Cake and Desmos
May 2, 2017
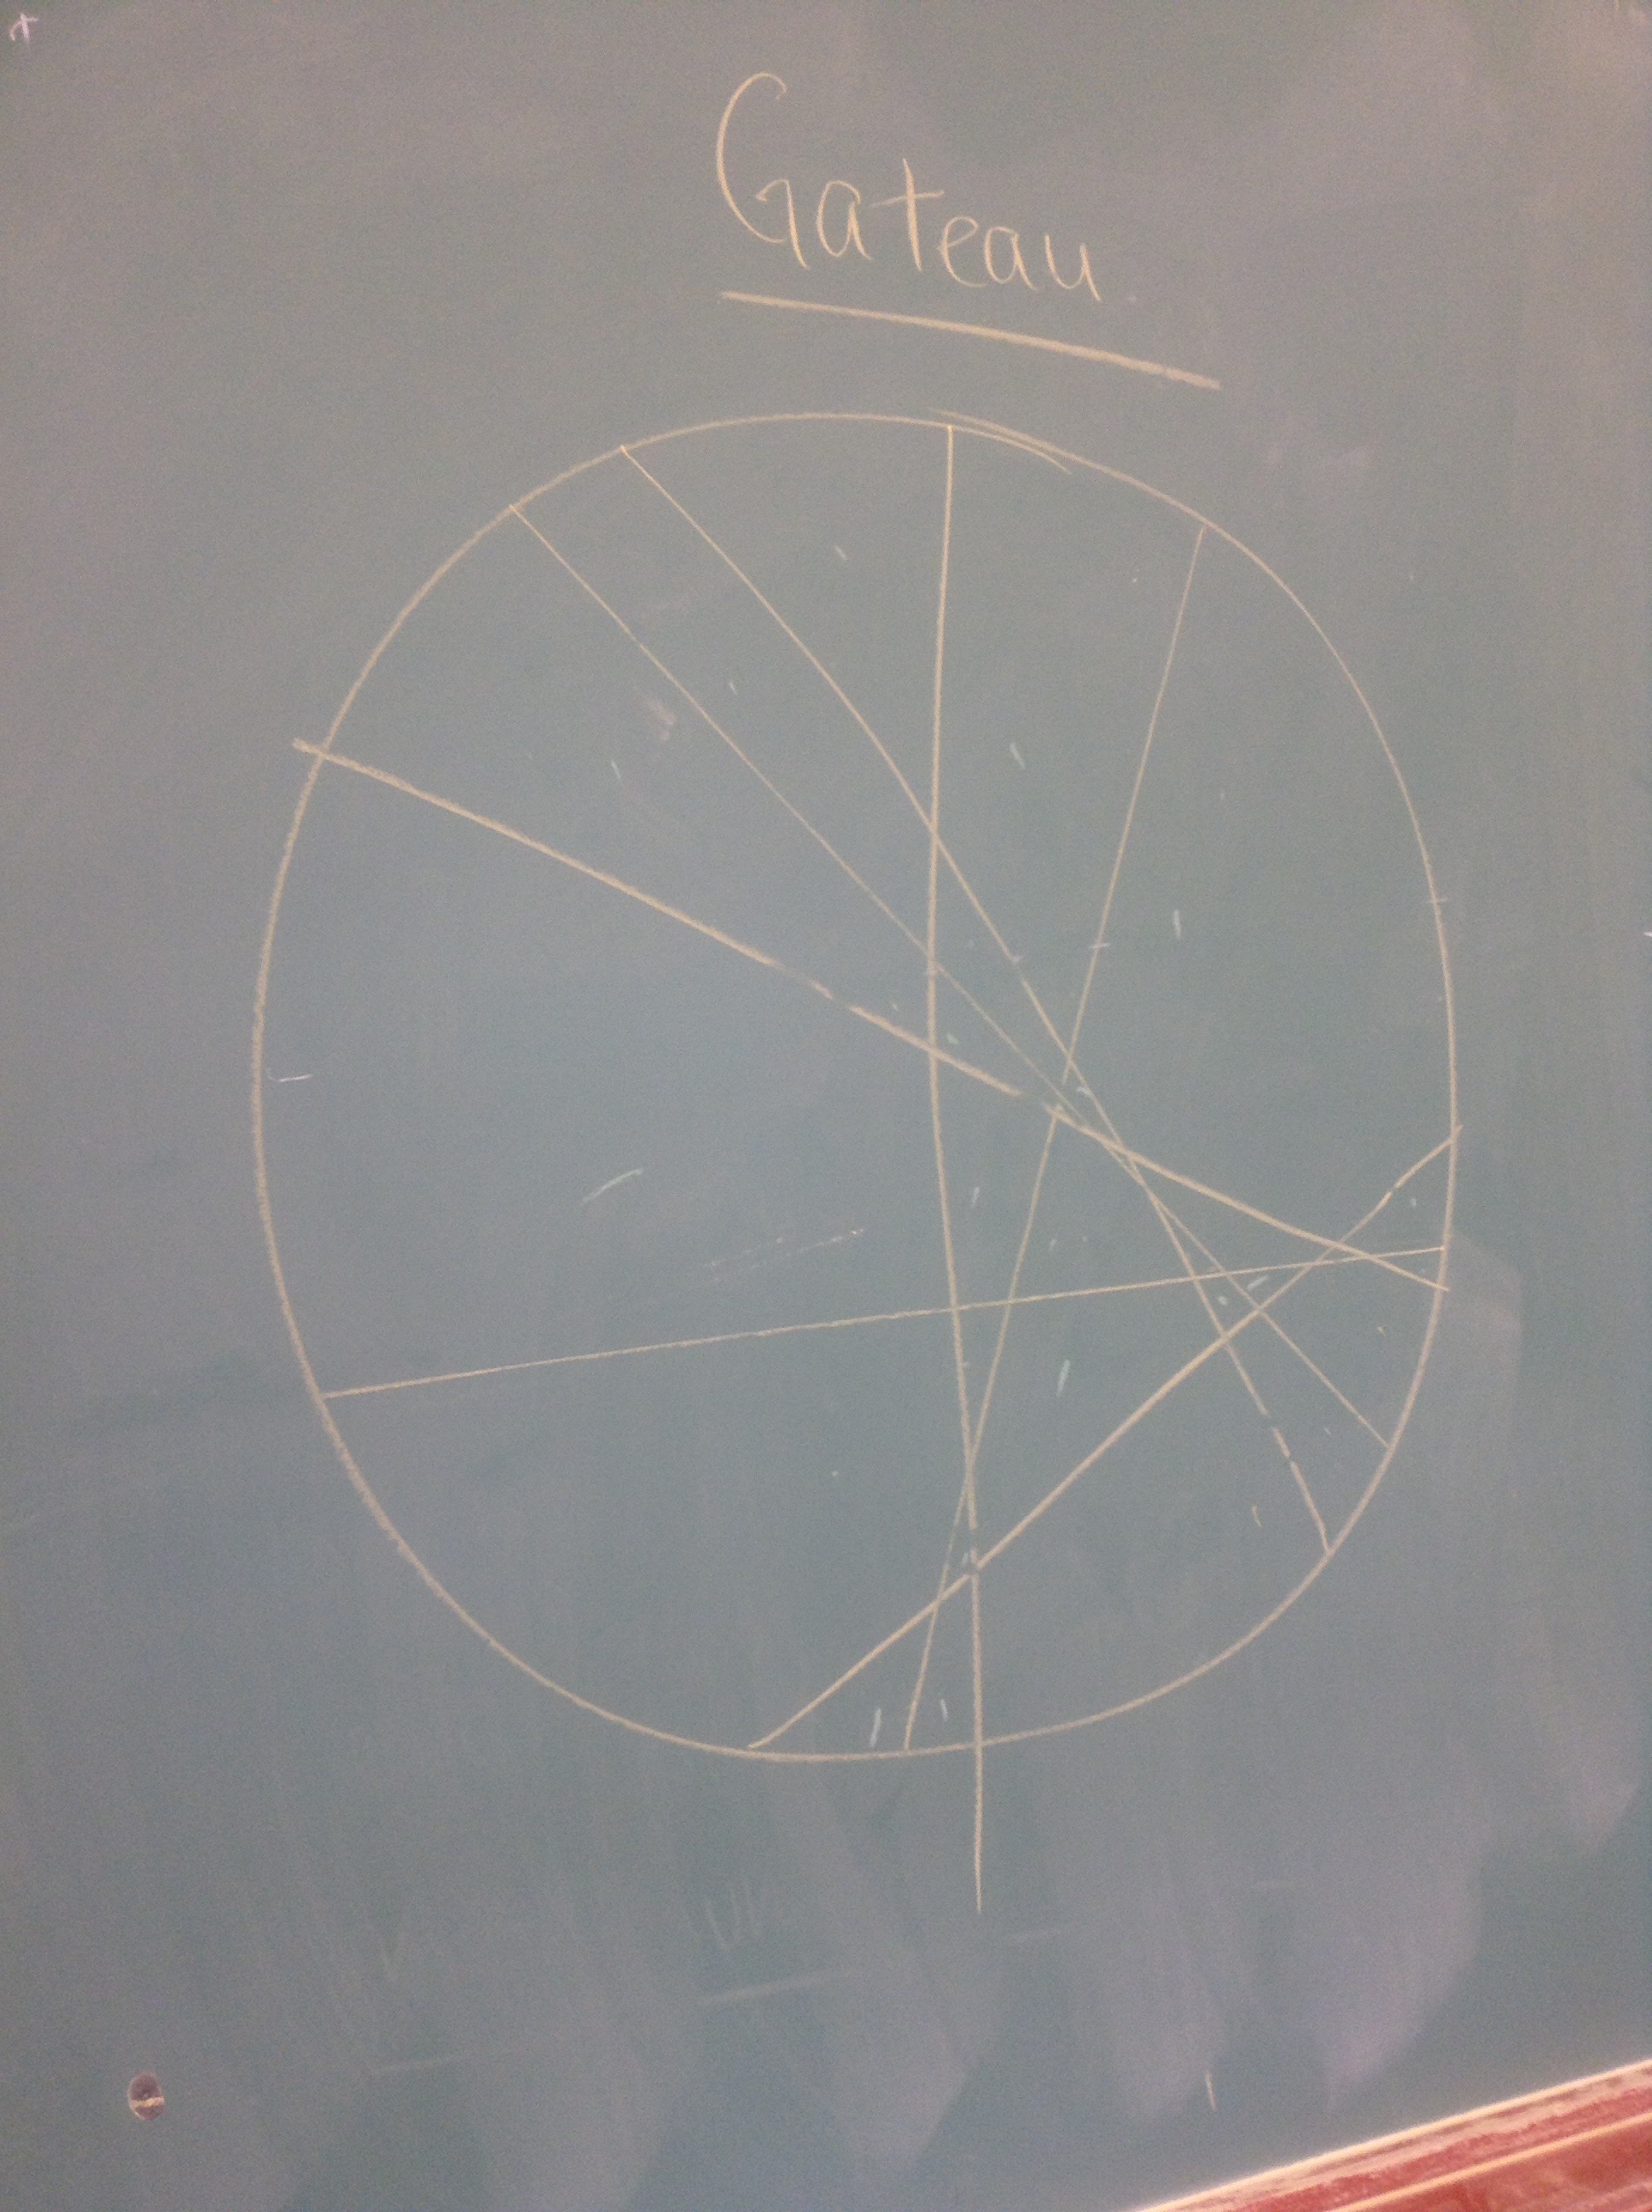
Today we looked at solving the cake cutting problem that was yesterday’s homework.
We showed how ro cut the cake into the most possible pieces
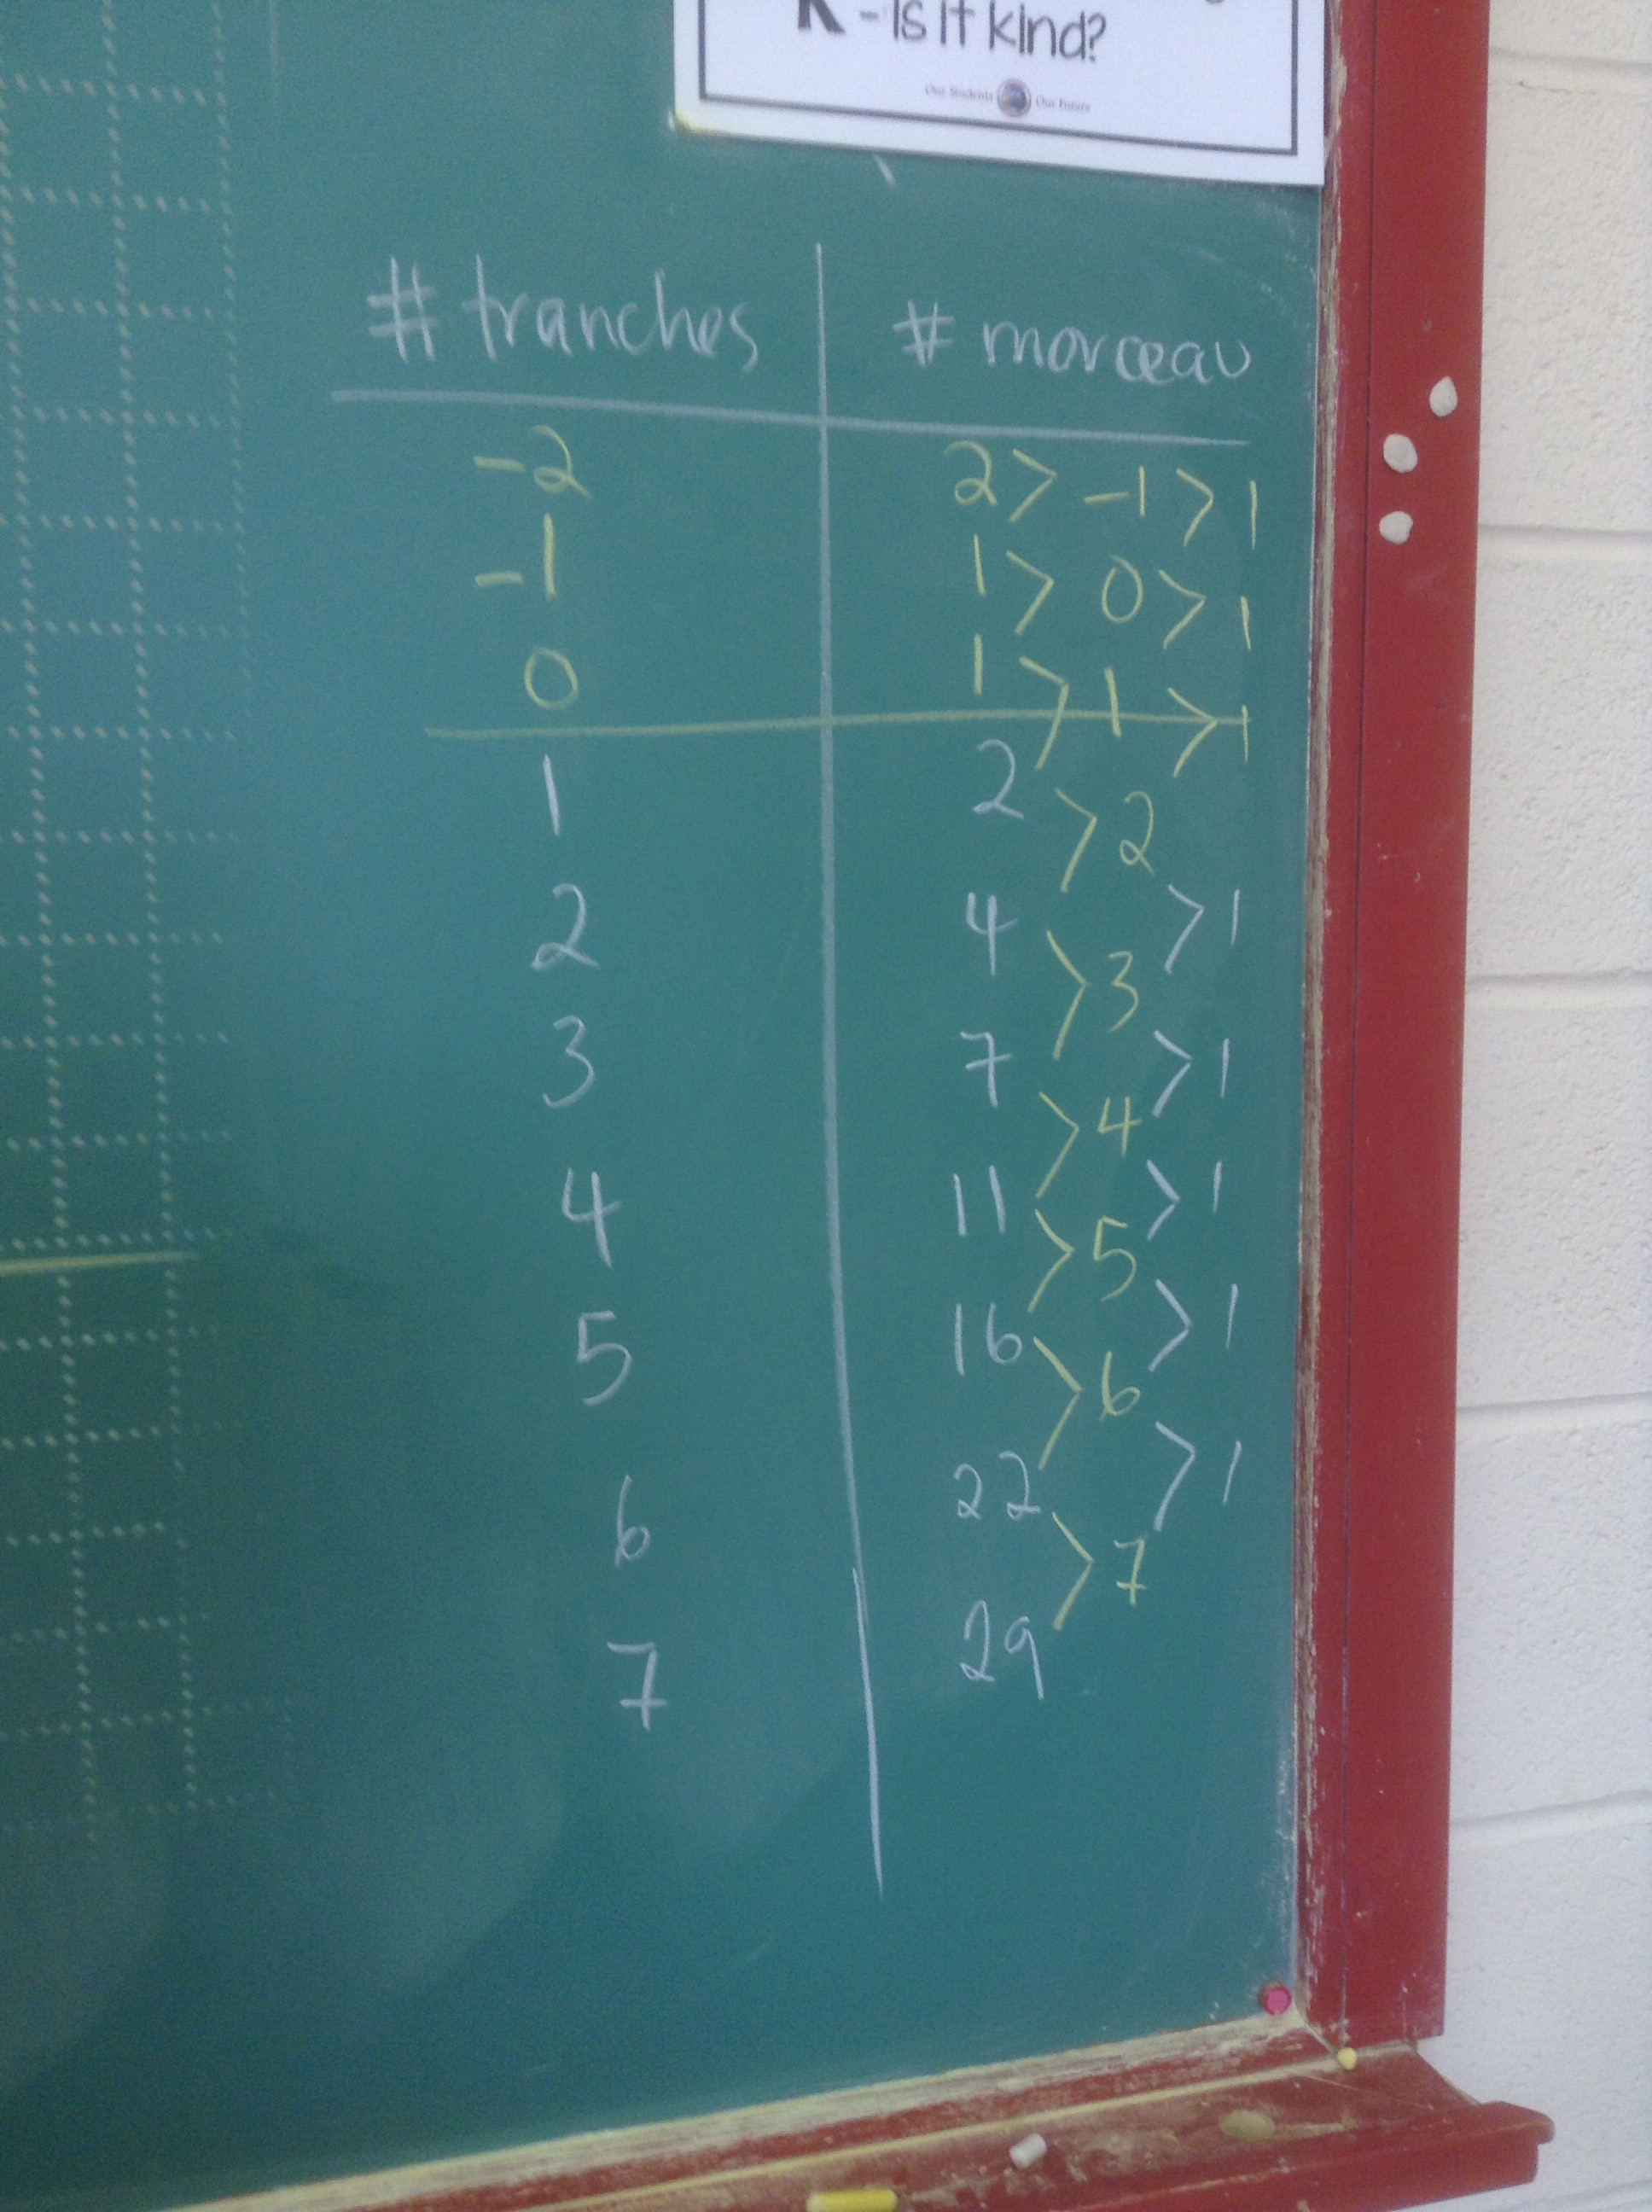
We showed our data in a chart and looked for patterns
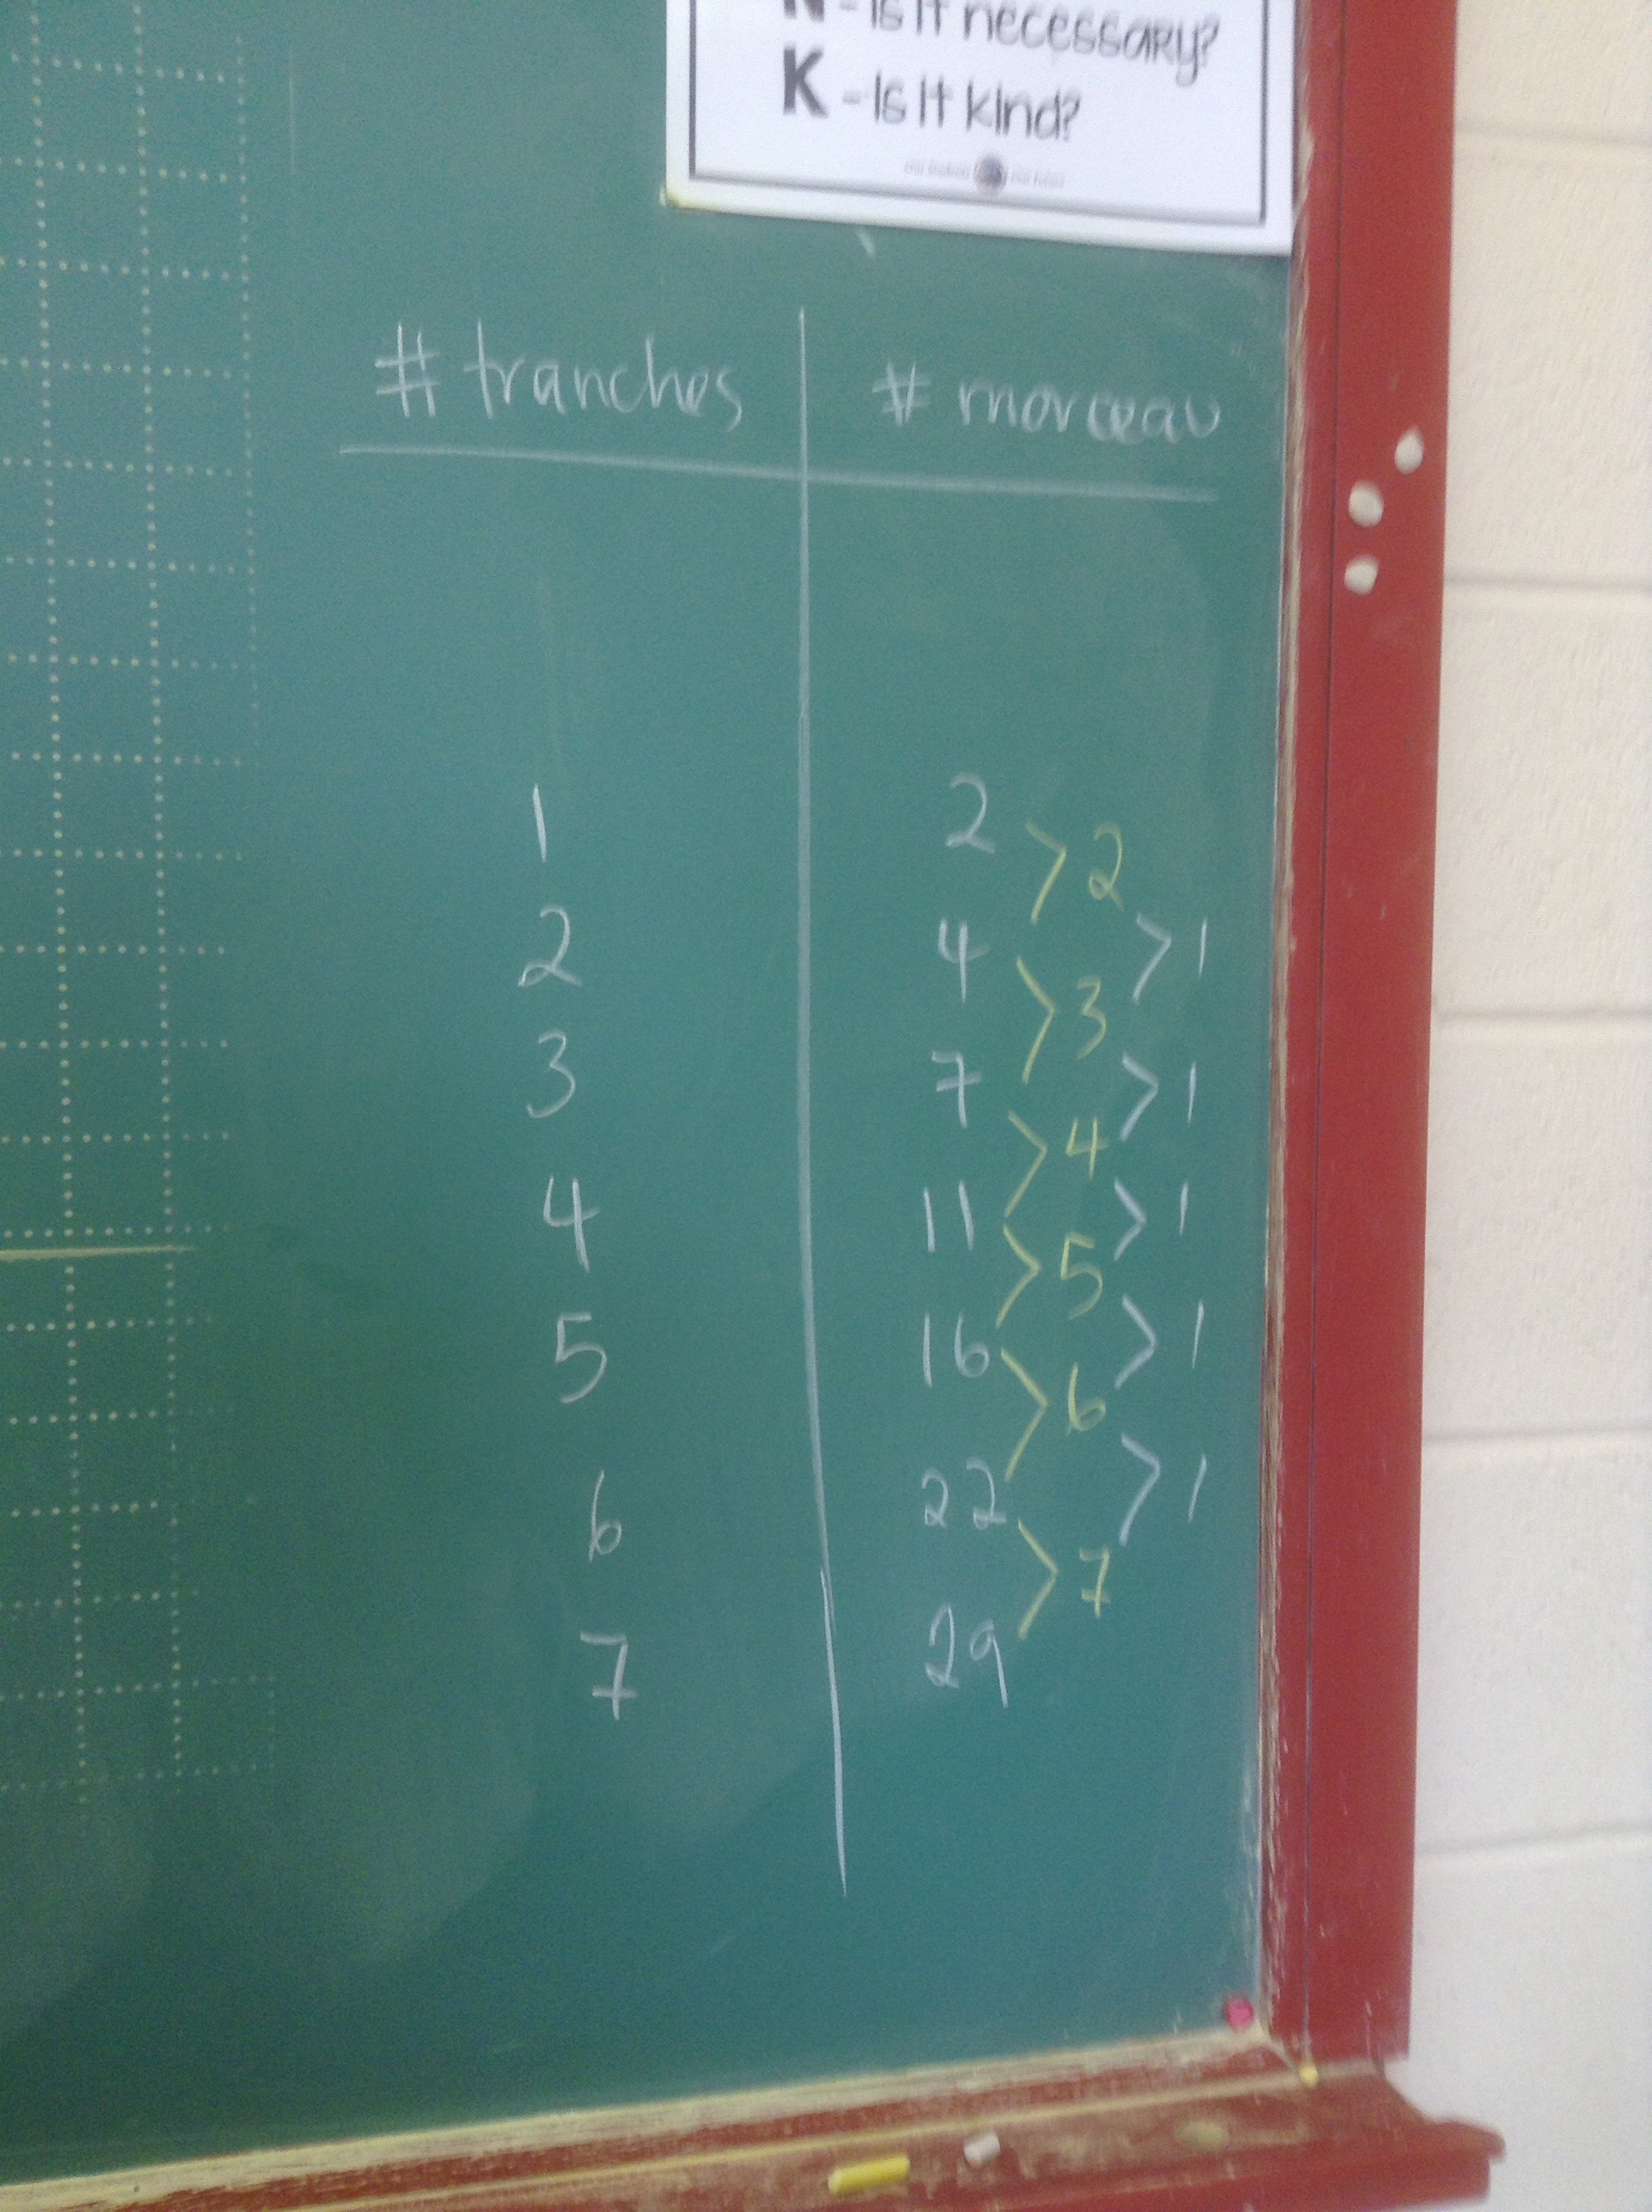
We extended the trend
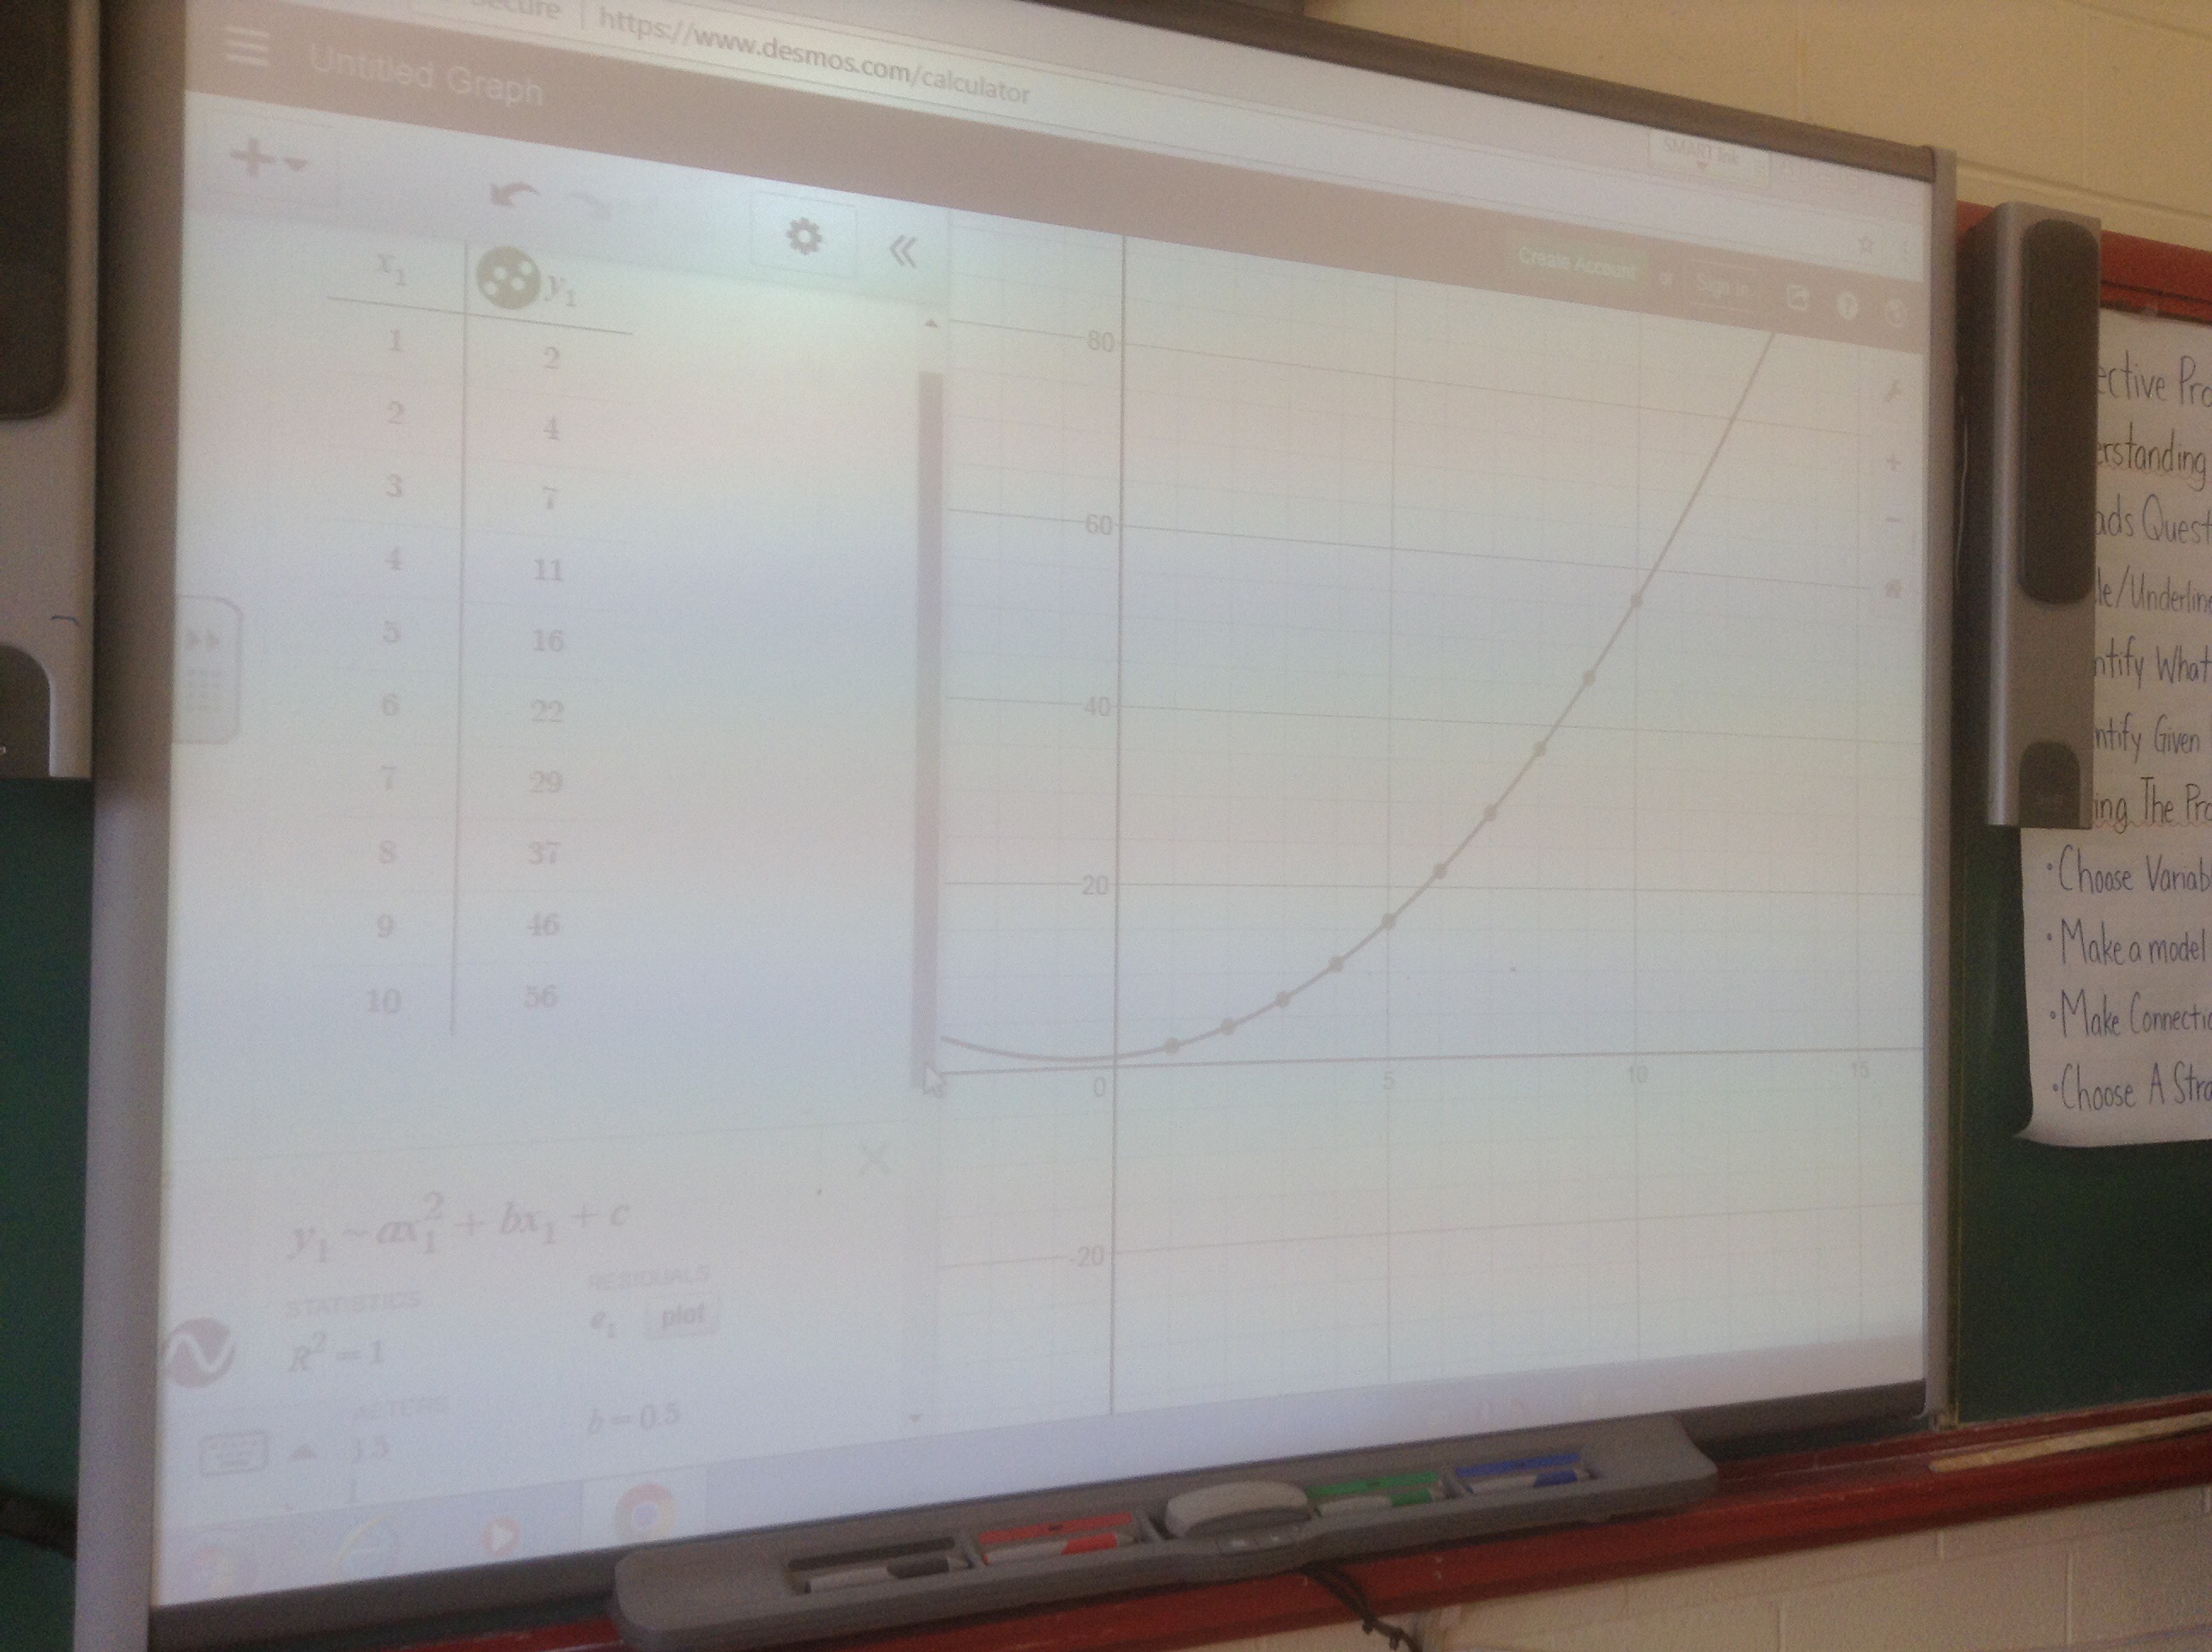
We graphed it
We came up with an equation using trial and error
Y=(x^2+x+2)/2
Y=0.5x^2+0.5x+1
Then we looked at how desmos.com can help us model the data graphically and also with an equation.
Finally we ate cake
Yummmmm
No comments yet
