Experimenting with Sound
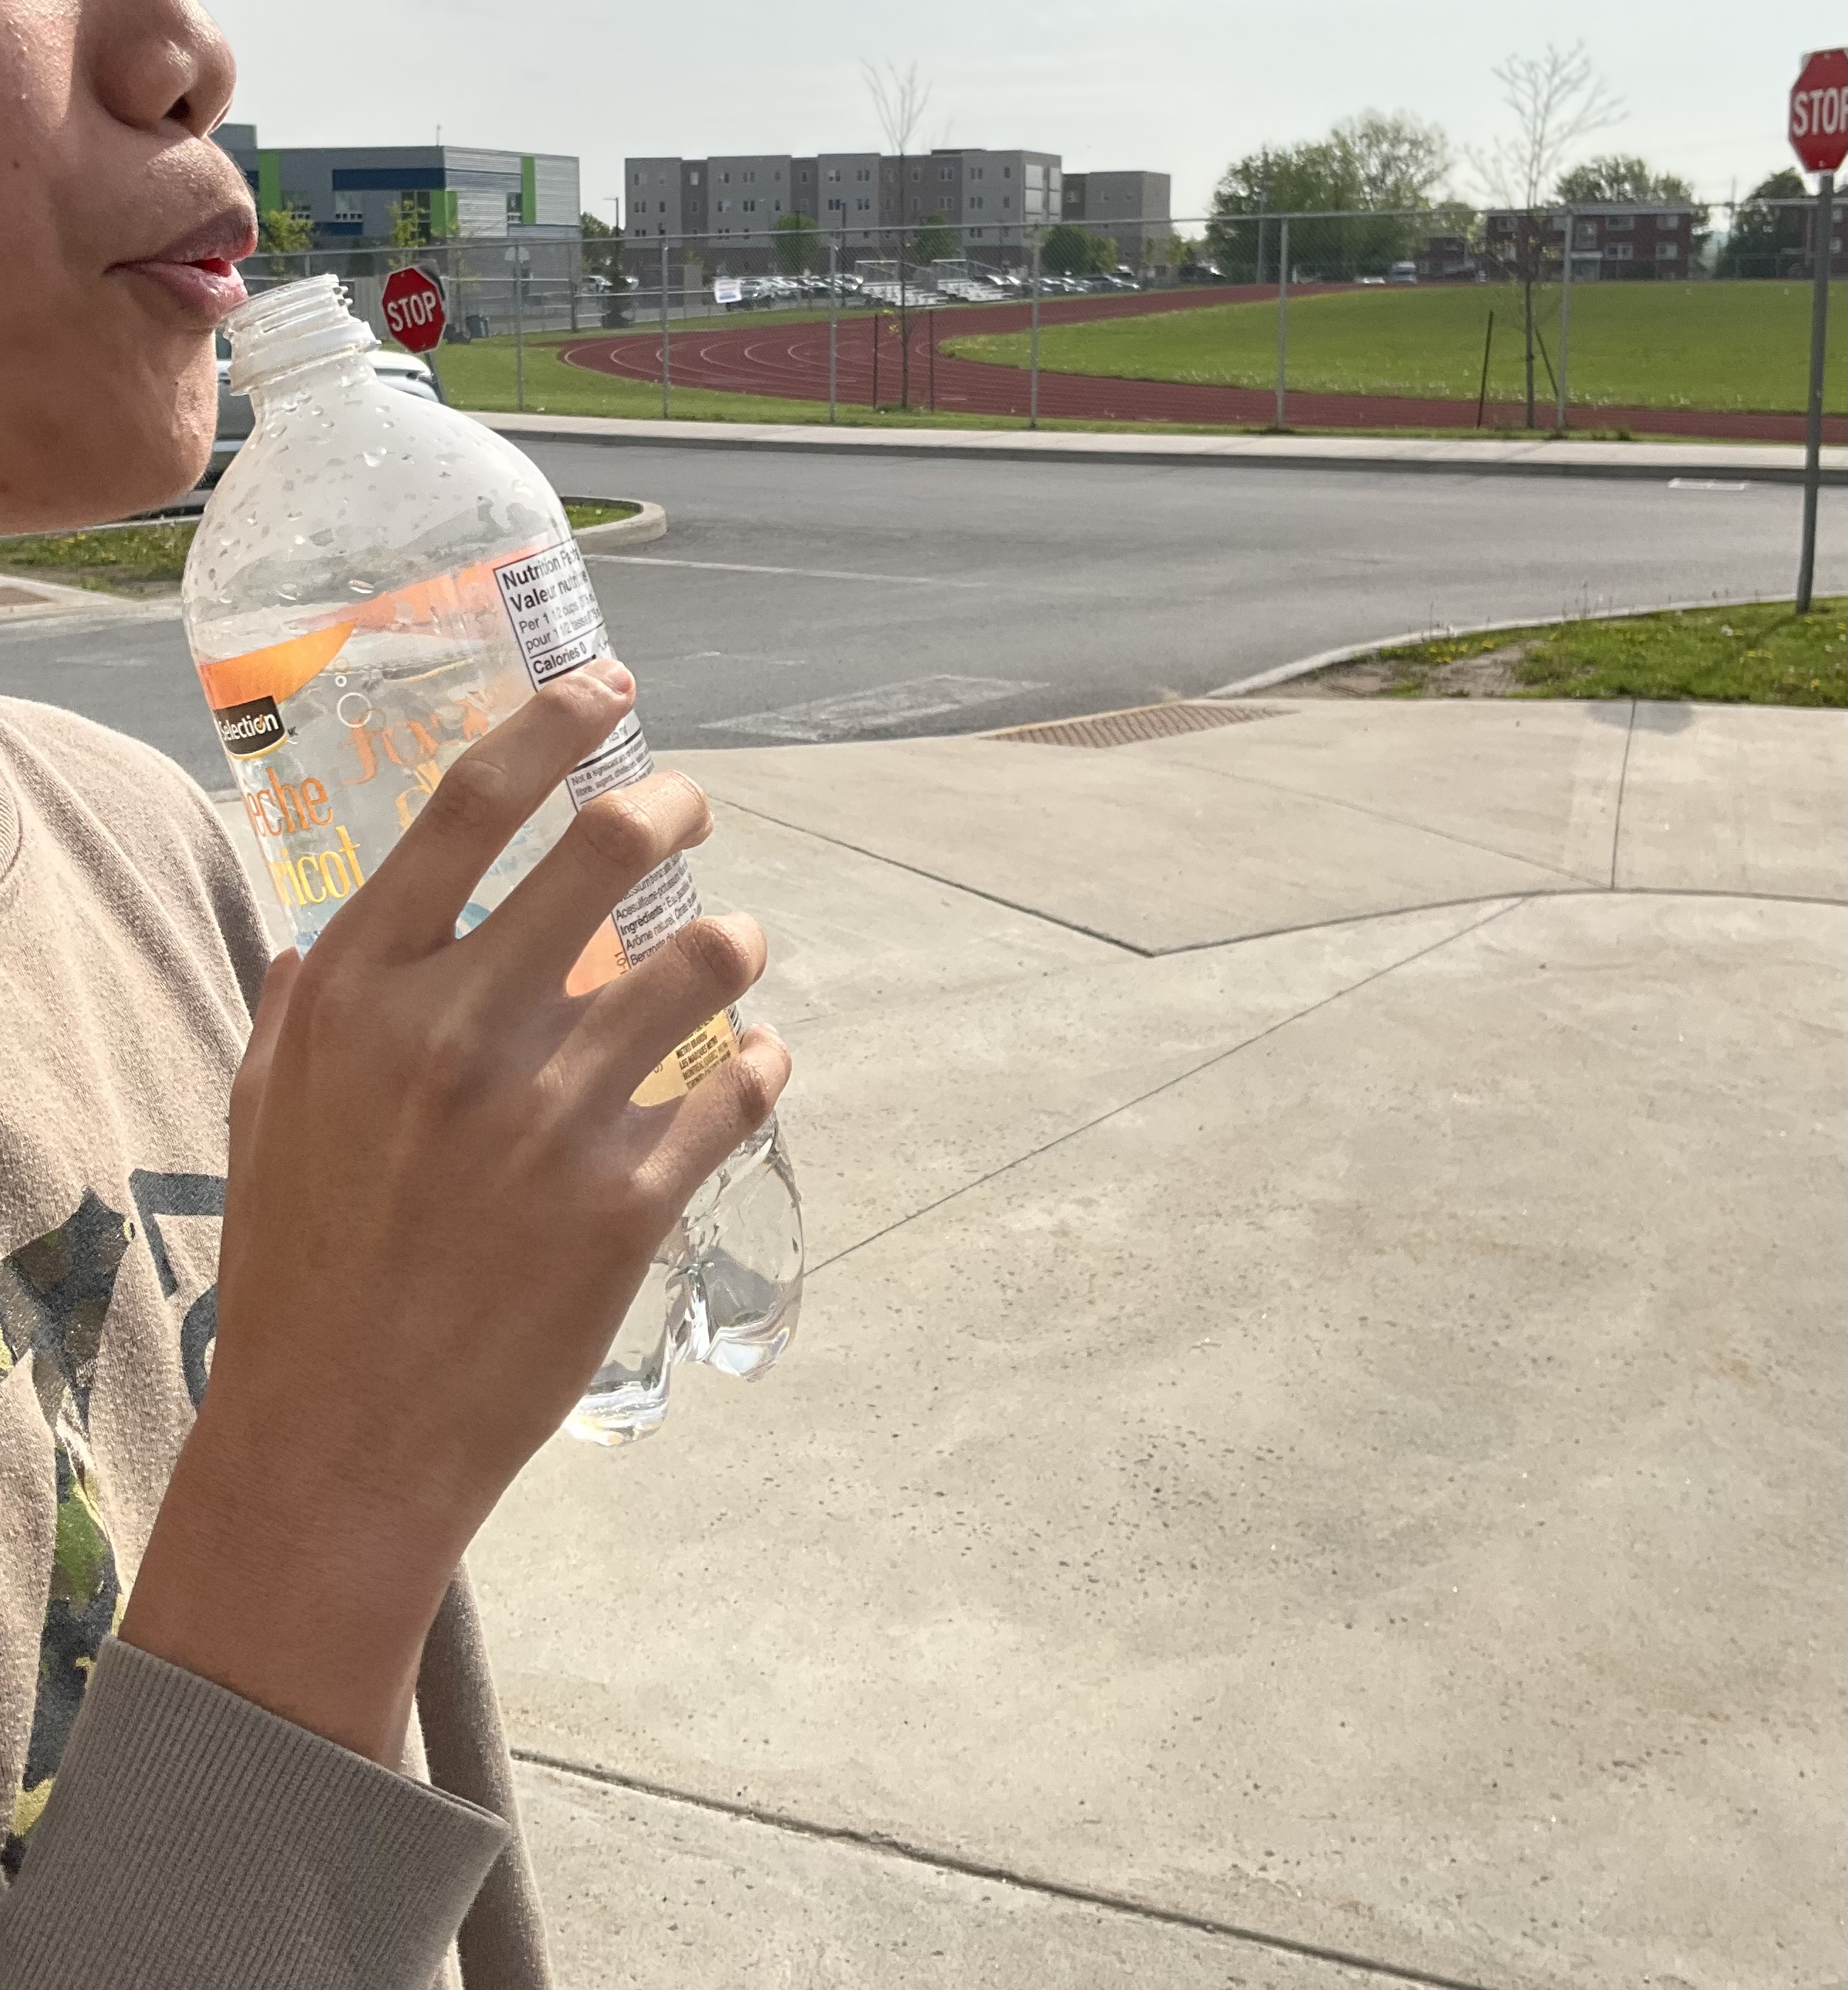
Today grade 9s experimented with the sound that is produced when you blow over the neck of a bottle and create resonance within the bottle. This sound changes as the water level in the bottle changes, and we were investigating that relationship.
We used the free app “sonic tools” which uses a phone/ipad’s microphone and will show the frequency of sound that it detects.

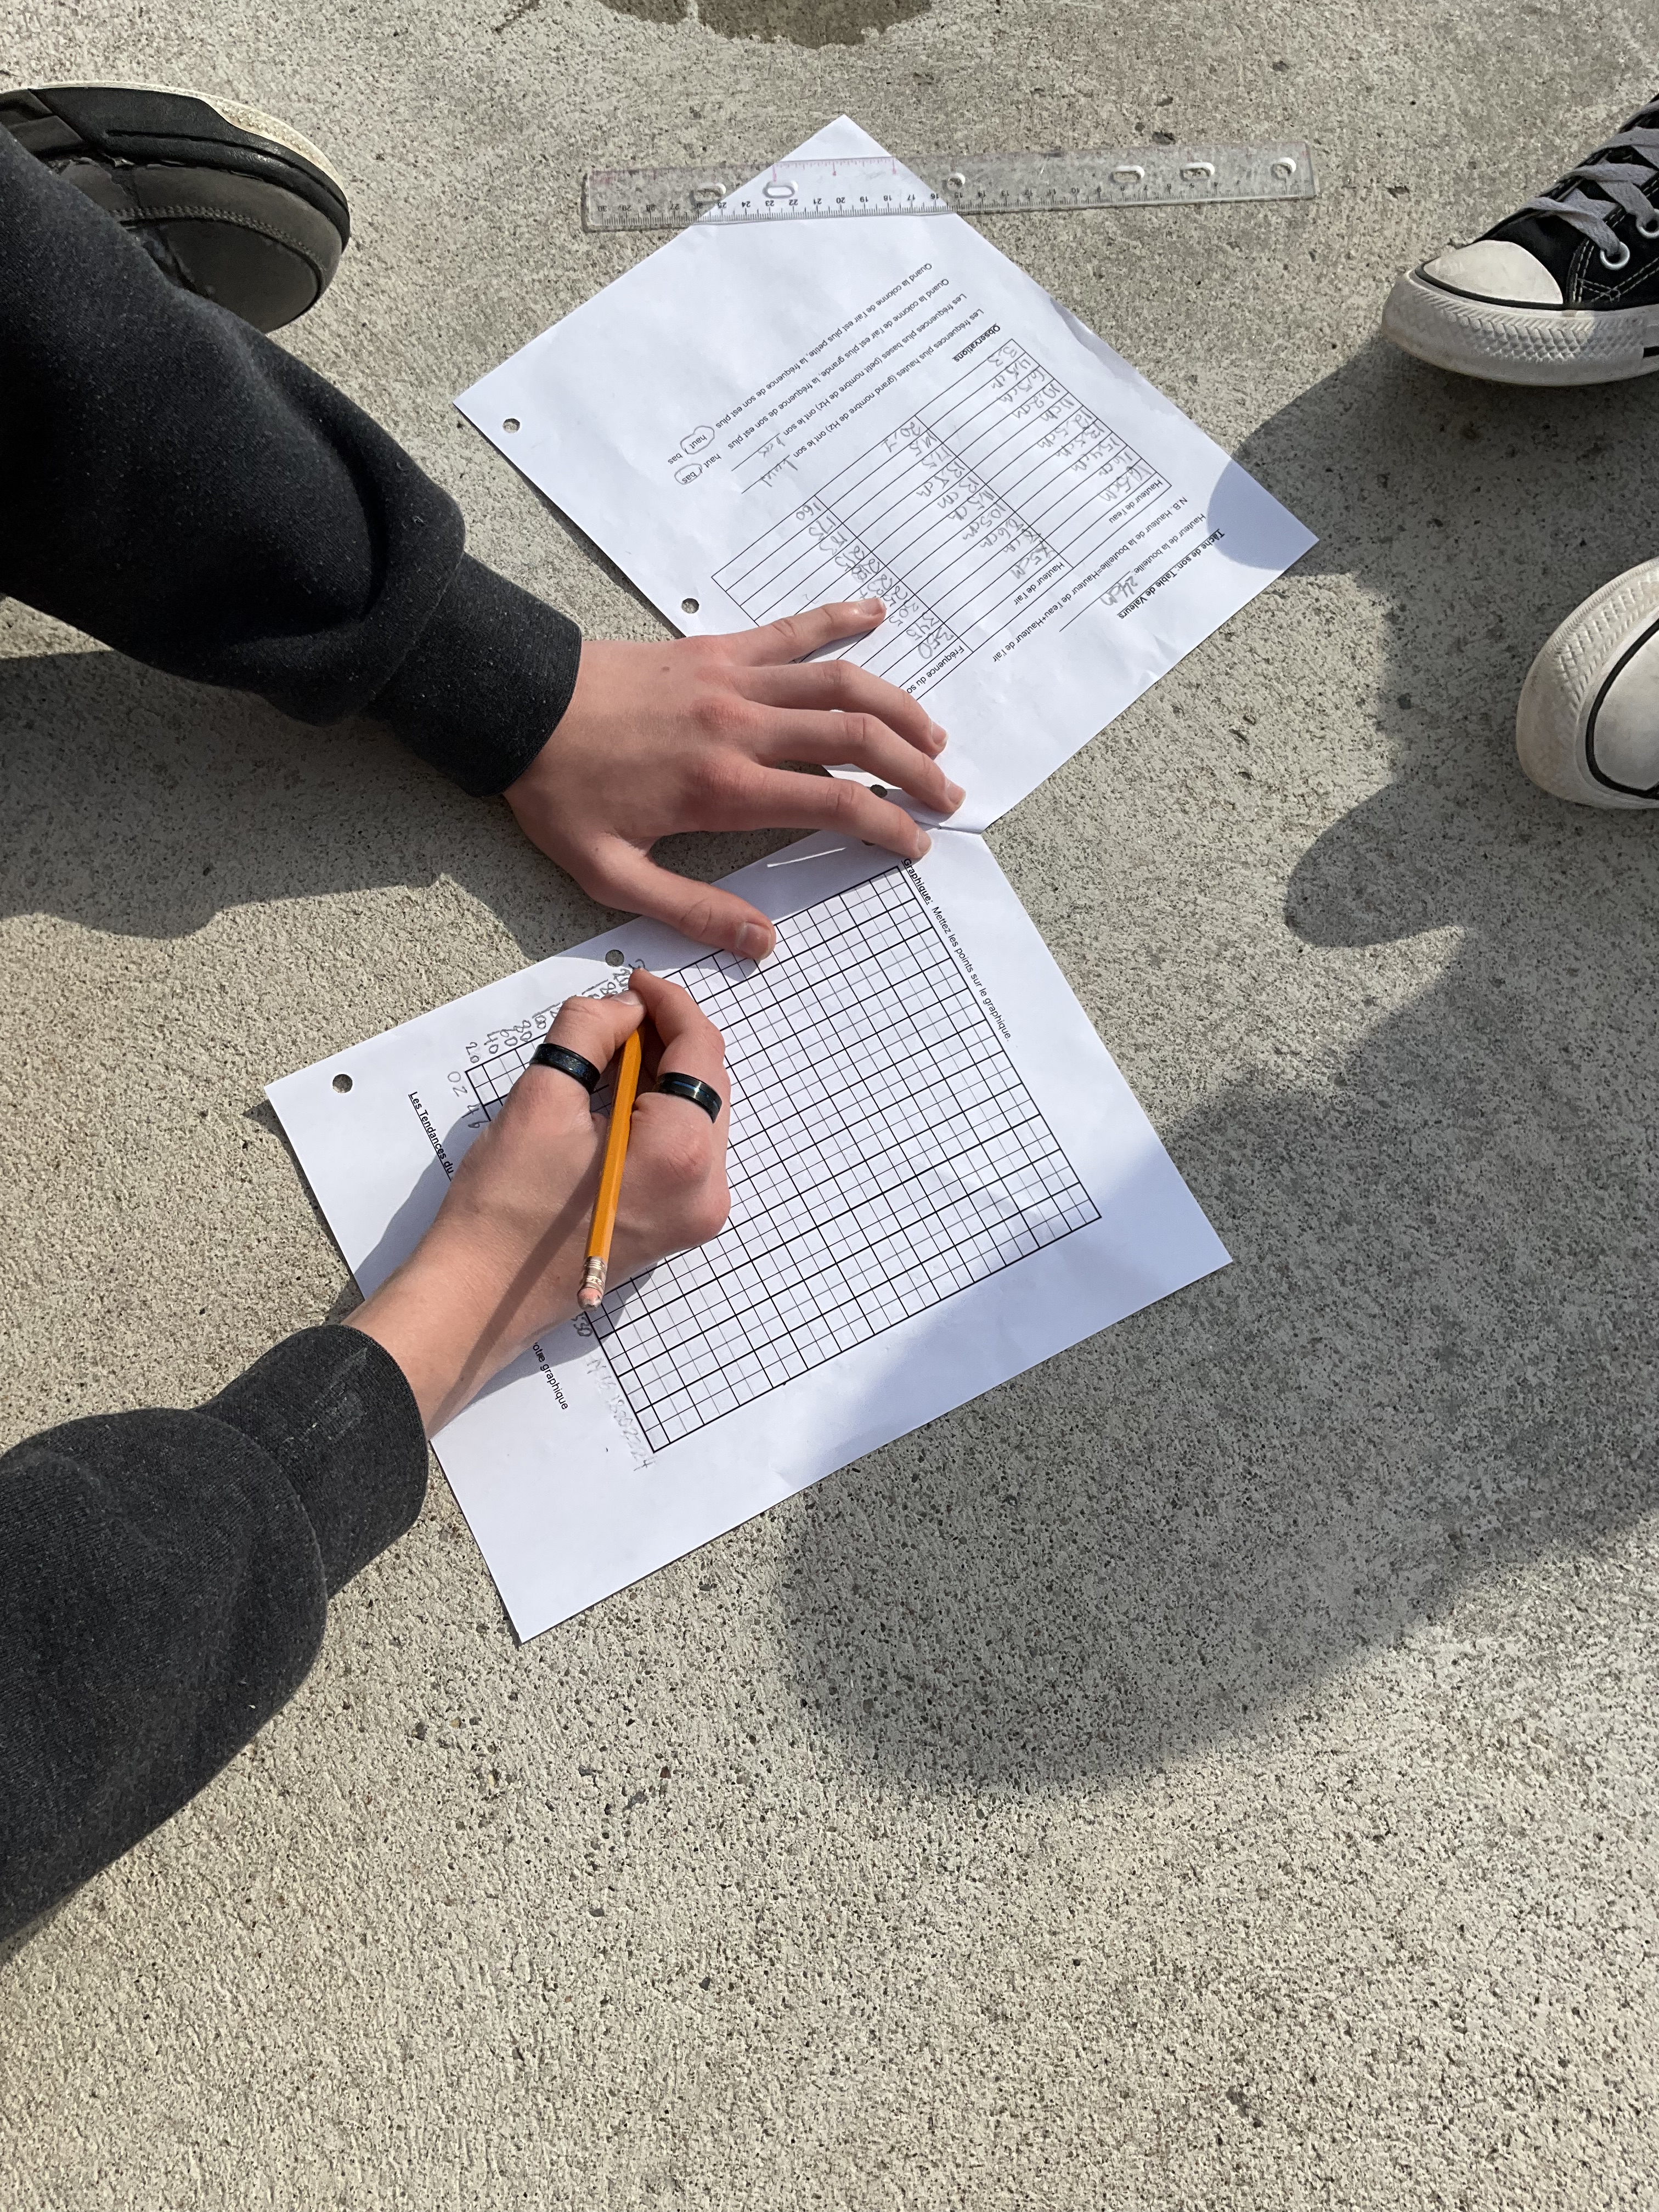
We measured the height of water in the bottle, and the height of the air column in the bottle, and then we measured the frequency of sound produced.

It was a lovely day so we could work outside and space out our groups so the sound we made didn’t interfere with others. We could also easily dump out some water between trials.
We scaled our axes to fit our data. We know that the dependent variable is the frequency, because that is what we are measuring, and the independent variable is either the height of water in the bottle, of the height of the air column in the bottle.
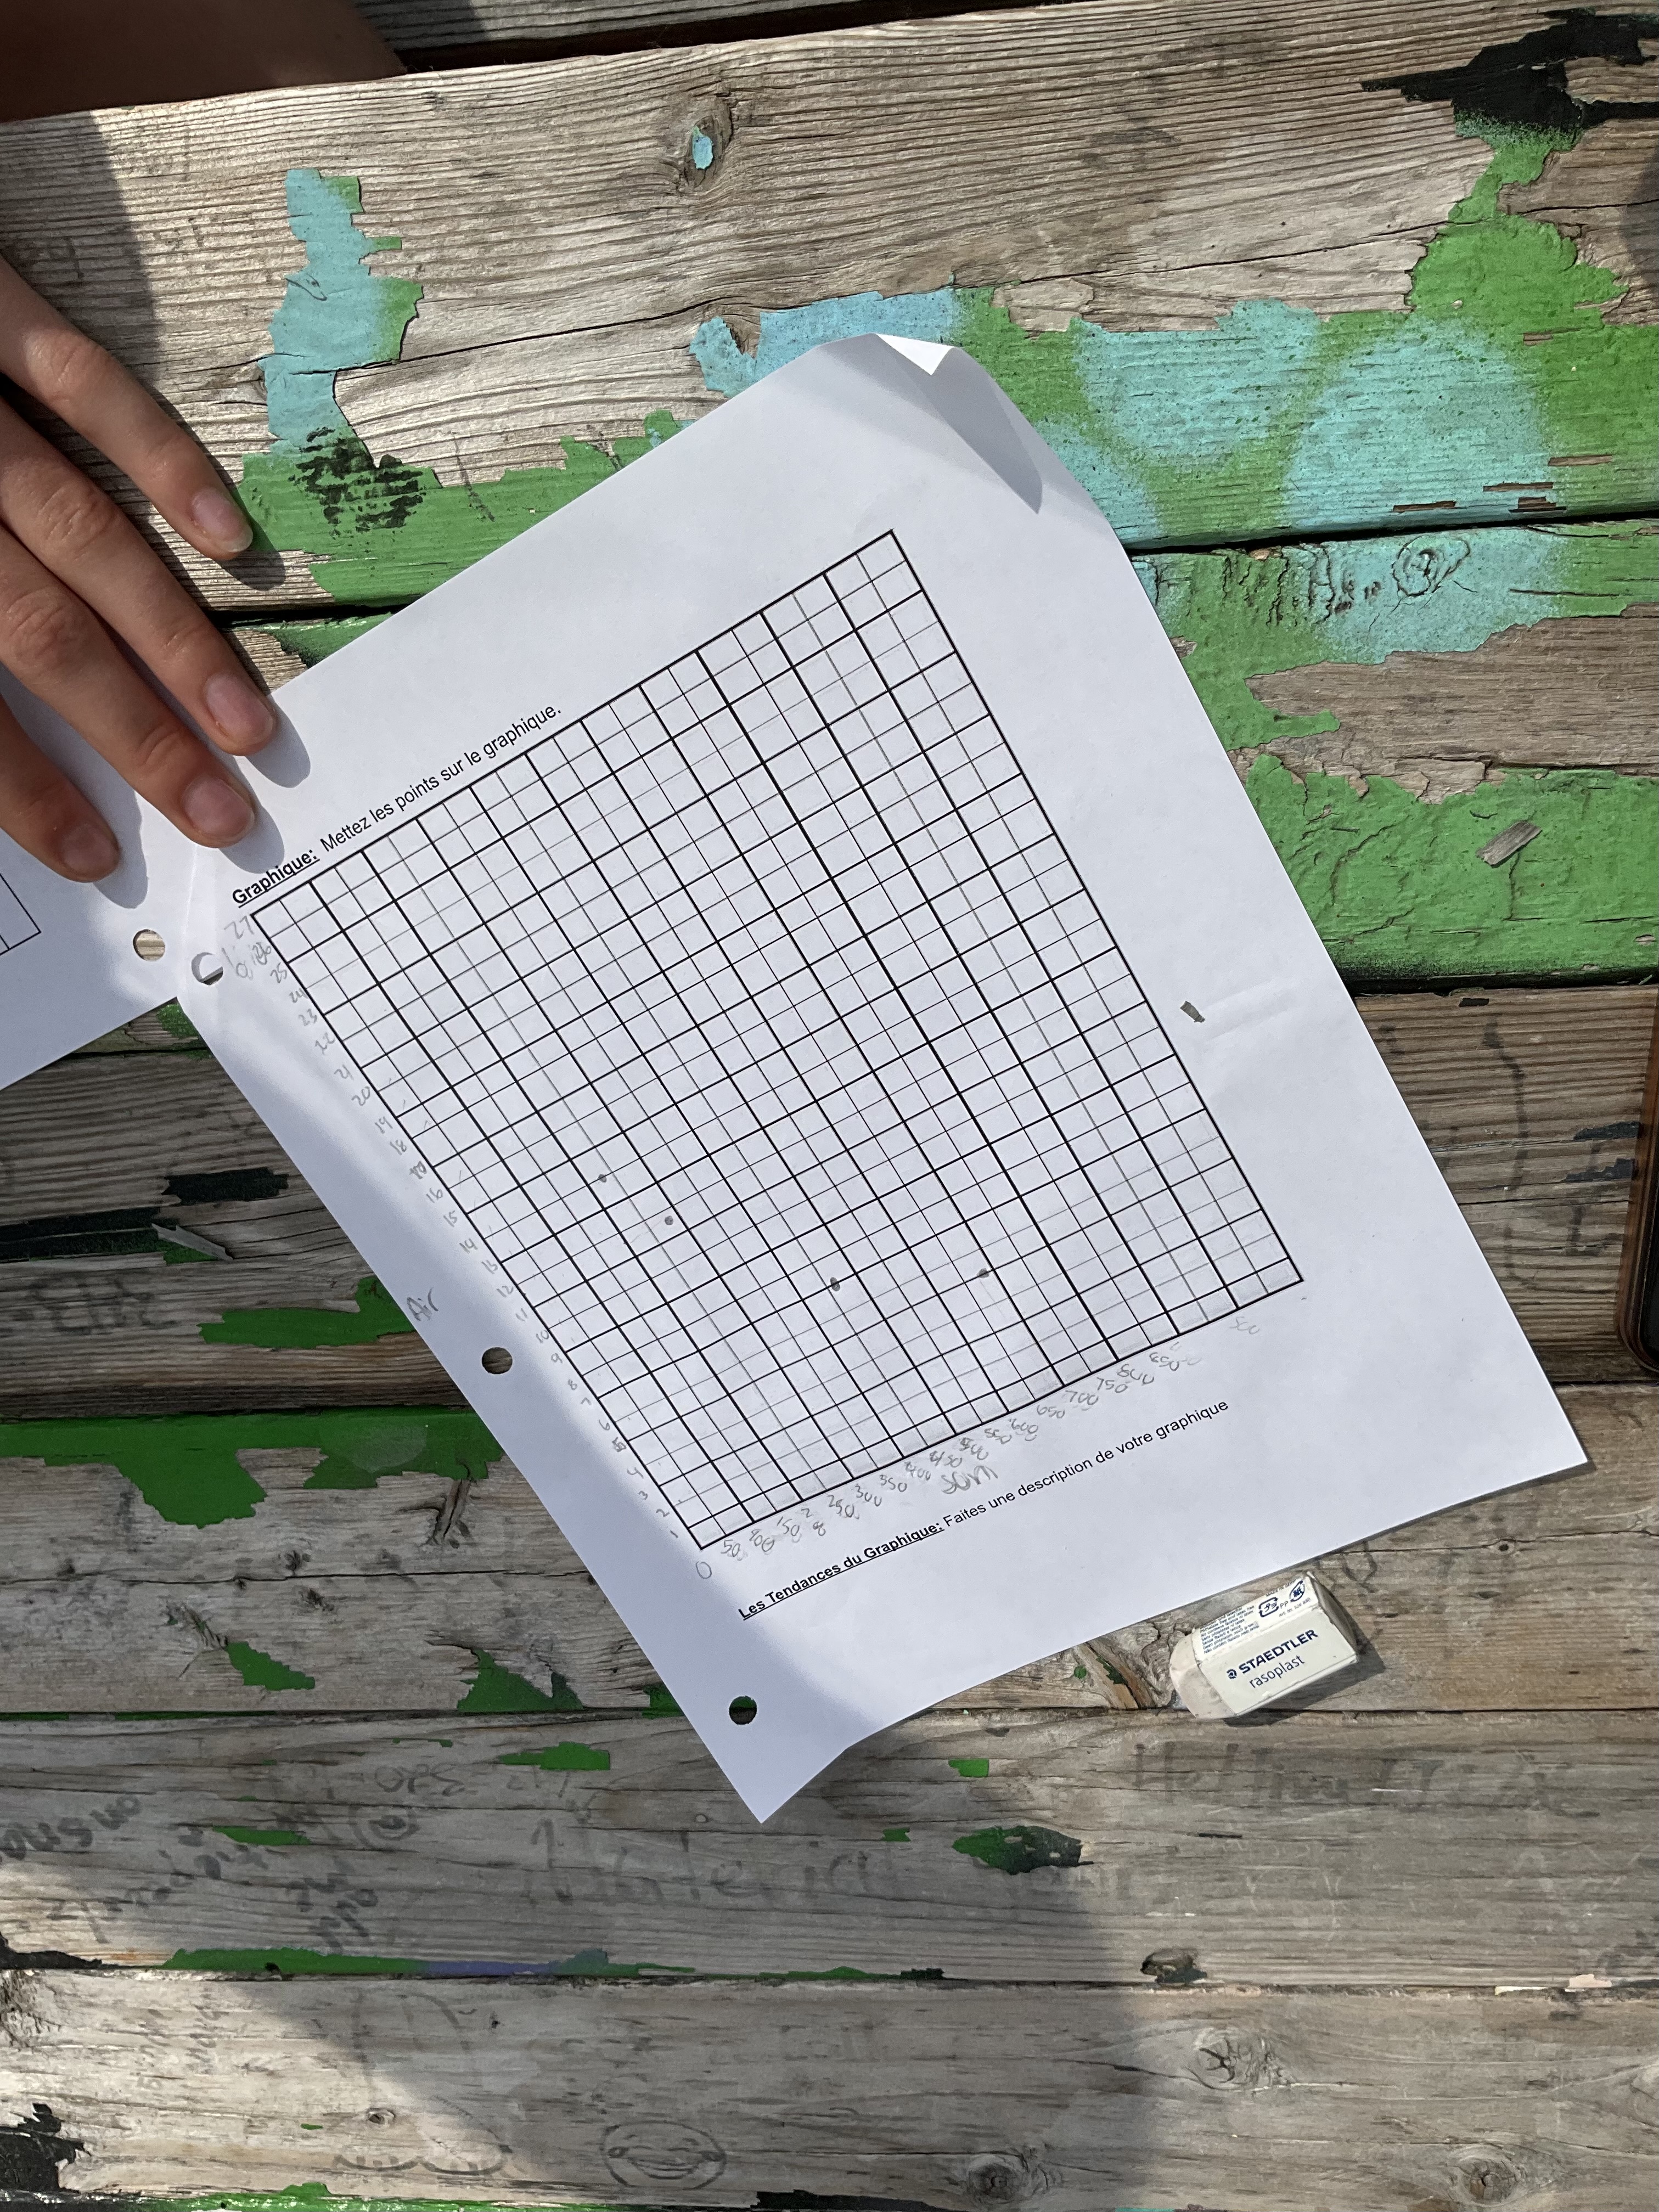
We noticed a non-linear trend, and used the graph to make some predictions. Some extensions could be to research the frequency of various musical notes, and attempt to create a bottle based instrument, like what we can see the “Bottle Boys” playing.
We could also dive deeper into the resonance in an air column, and explore the physics behind the results of our graph. The equation relating frequency and wavelength is f=v/(lambda) where lambda is the wavelength of the sound. We know that a bottle like this will resonate with a wavelength that is 4 times the height of the air column.

Some of this is best kept for grade 11 though where the students will be exploring graphs of y=1/x and sinusoidal graphs (like sound waves), and exploring acoustics in more detail in physics classes.
For us, in grade 9, we used this task to perform an experiment, collect data in a table, then display it in a graph. Students answered questions about the graph, made predictions and described the trends. We learned a bit more about dependent and independent variables too.
update:
Today we compiled some of our data, noting that some difference we saw were likely due to measuring error, or measuring to different points on the bottle (the top of the neck, or the shoulder of the bottle).
We noticed that the data made a curve, and that we could do a curve of best fit.

We researched the frequency of middle C, which is 261.63Hz, and used interpolation to estimate that if the bottle had about 10cm of air column the pitch would be middle C.
I’m not sure if anyone is motivated to play bottle instruments, but at this point they could!
