High Fives in Grade 10
Today in grade 10 we determined how many unique high fives there were among the 26 people in our classroom.
Groups split up and got to work modelling the situation and trying to determine the answer, and how to communicate it.
some groups imagined a line of 26 people. The first person goes down the line high fiving everyone, then leaves. There are 25 high fives done at that point. The next person does 24 high fives, and the pattern continues, adding one fewer high five to the total each time.

other groups viewed the number of people in the group as the x value, and the number of high fives in the group as the y. They can determine how many high fives exist in a pair, and a group of 3 and 4 and 5 and put that in a table. They noticed that the first differences increase by 1 each time.

Both groups found parabolas, but different ones to model the same situation. We worked on making equations, and extending tables to find key points like x intercepts and the vertex.
some groups viewed the challenge a bit differently, making equations and testing them out.

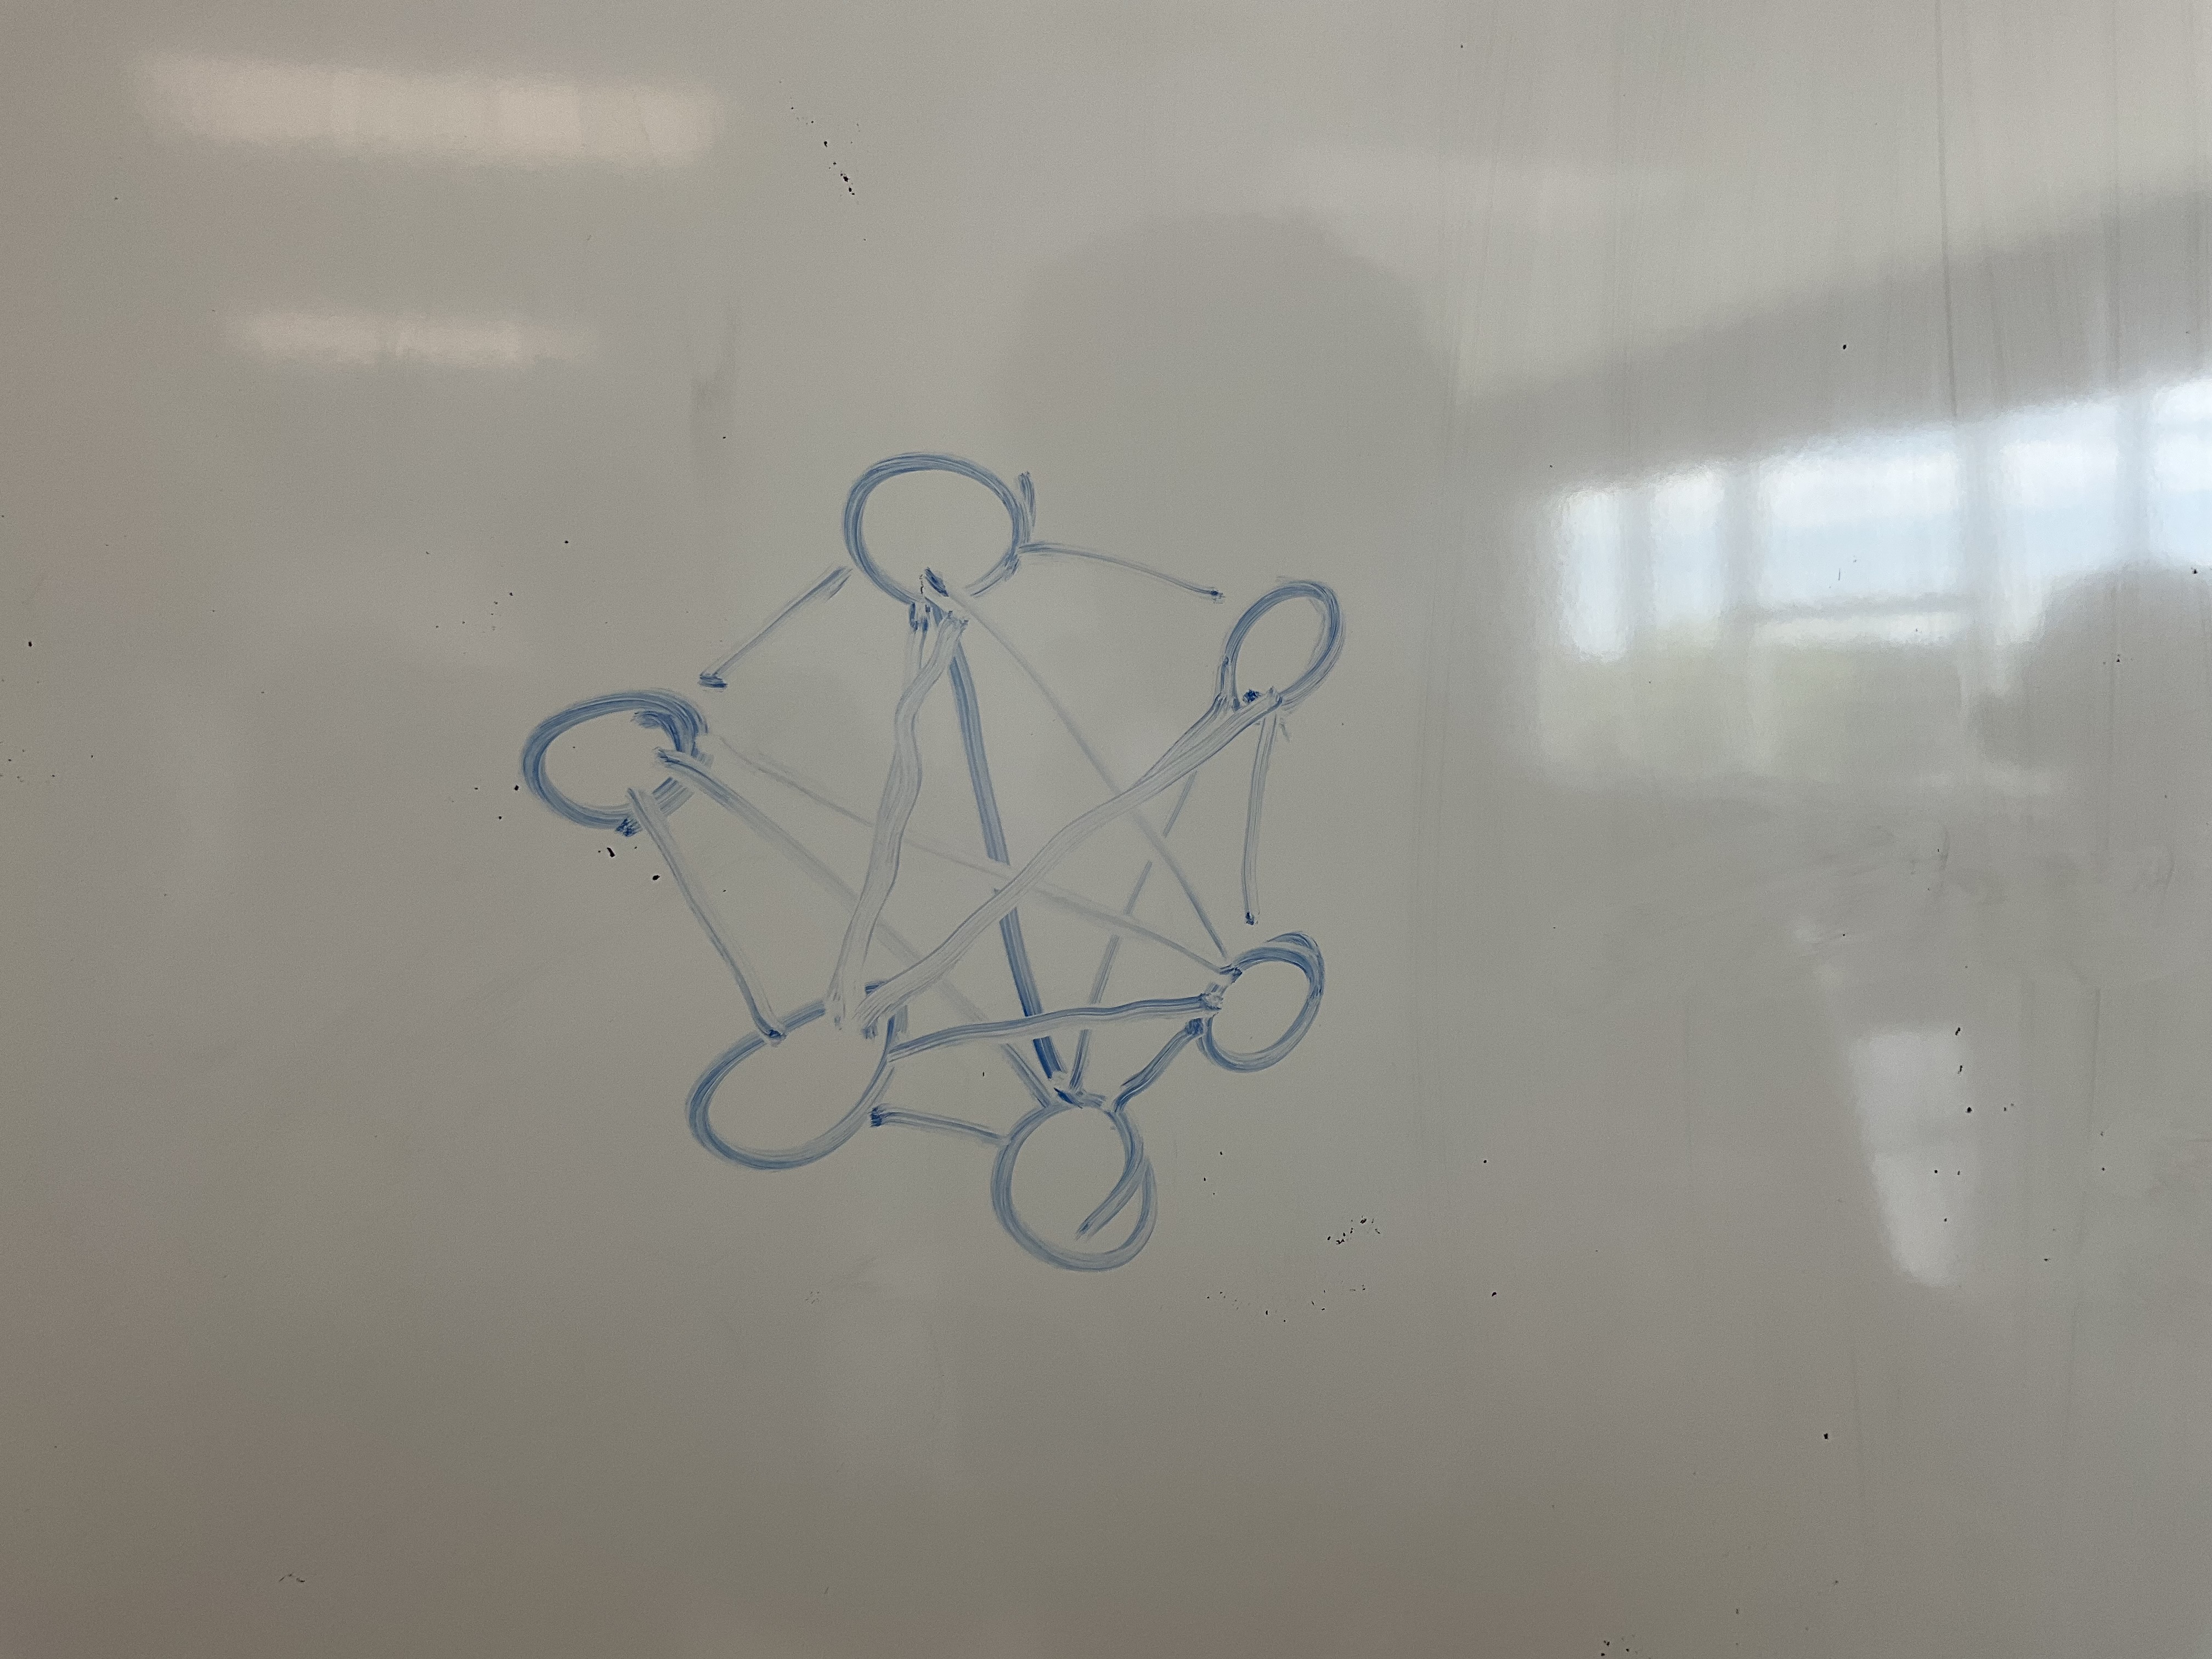
Other groups were working visually, showing the connections between dots and the high fives that exist
By the end of class there were graphs and equations showing up and being worked on. Students then used their models to solve the question about the number of high fives in a class of 26, which quickly changed into “how many high fives are there in a school of 1000 people”. Models got changed, and adapted, and students could see the power of using an equation rather than continuing a table for 1000 rows.

I showed a neat solution that students presented last year which turns the entire situation into a visual pattern. They modelled the blue triangle as the number of high fives. The blue triangle is half of the rectangle. The rectangle has dimensions (x)(x-1), so we need y=0.5(x)(x-1) as our equation.
As a wrap up we went back to some questions we’d worked on in the first week of class, that were quite challenging in February.
What was lovely to see is that students immediately dived into the problem, drawing and modelling, and finding equations. Where they had been hesitant in February, they are much more confident now, and helped their peers when they got stuck.


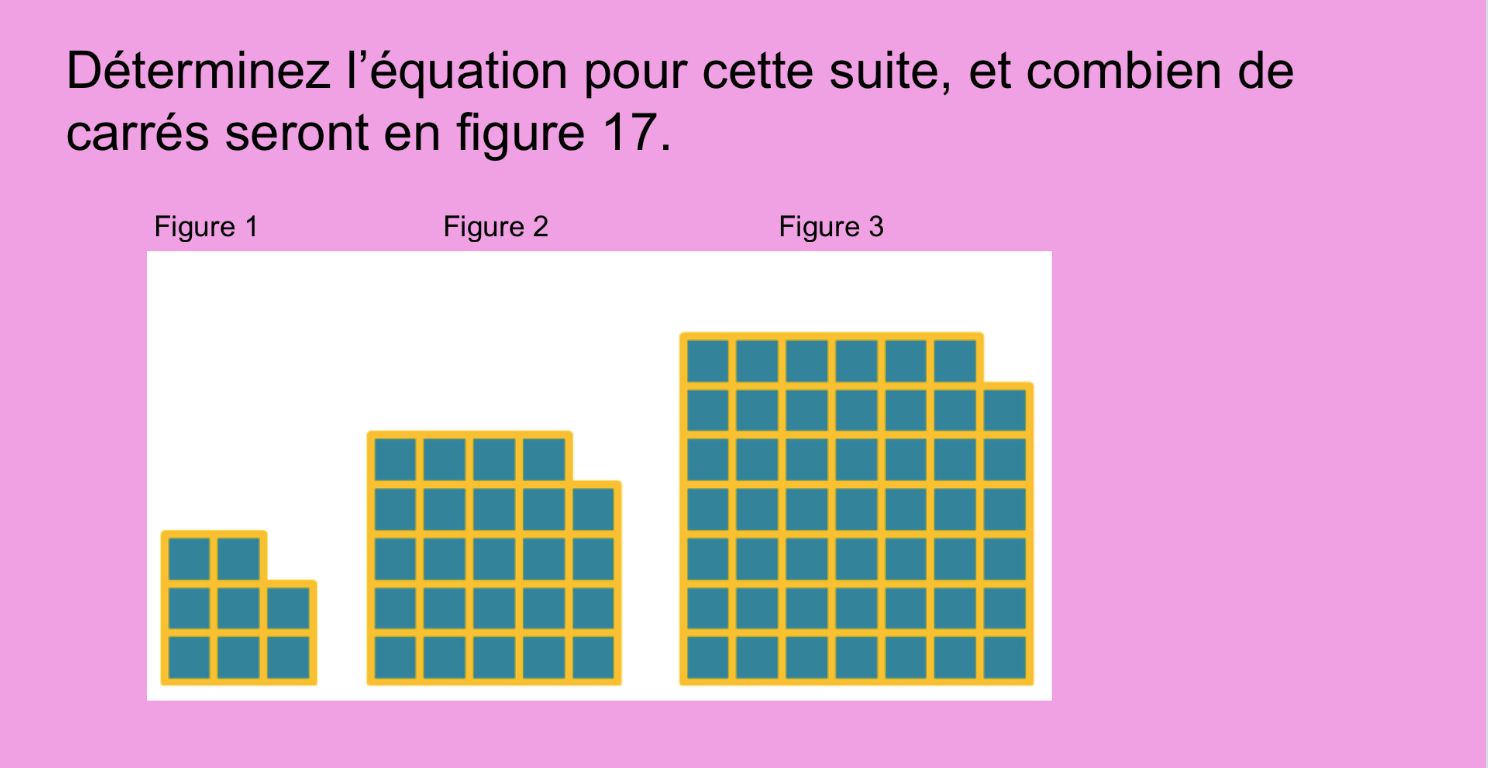
Once the equation was modelled and the number of squares in figure 17 determined, the extension questions were to graph it, or find the x intercepts, or complete the square or determine the vertex. This one pattern kept us going right until the bell on a Friday afternoon in June.
