Collecting Data in Grade 9
We’ve started collecting some data in grade 9, and we’ll be collecting more data each school day, for a total of 10 days.
Each student is going to be doing a “five minute frenzy” multiplication challenge.
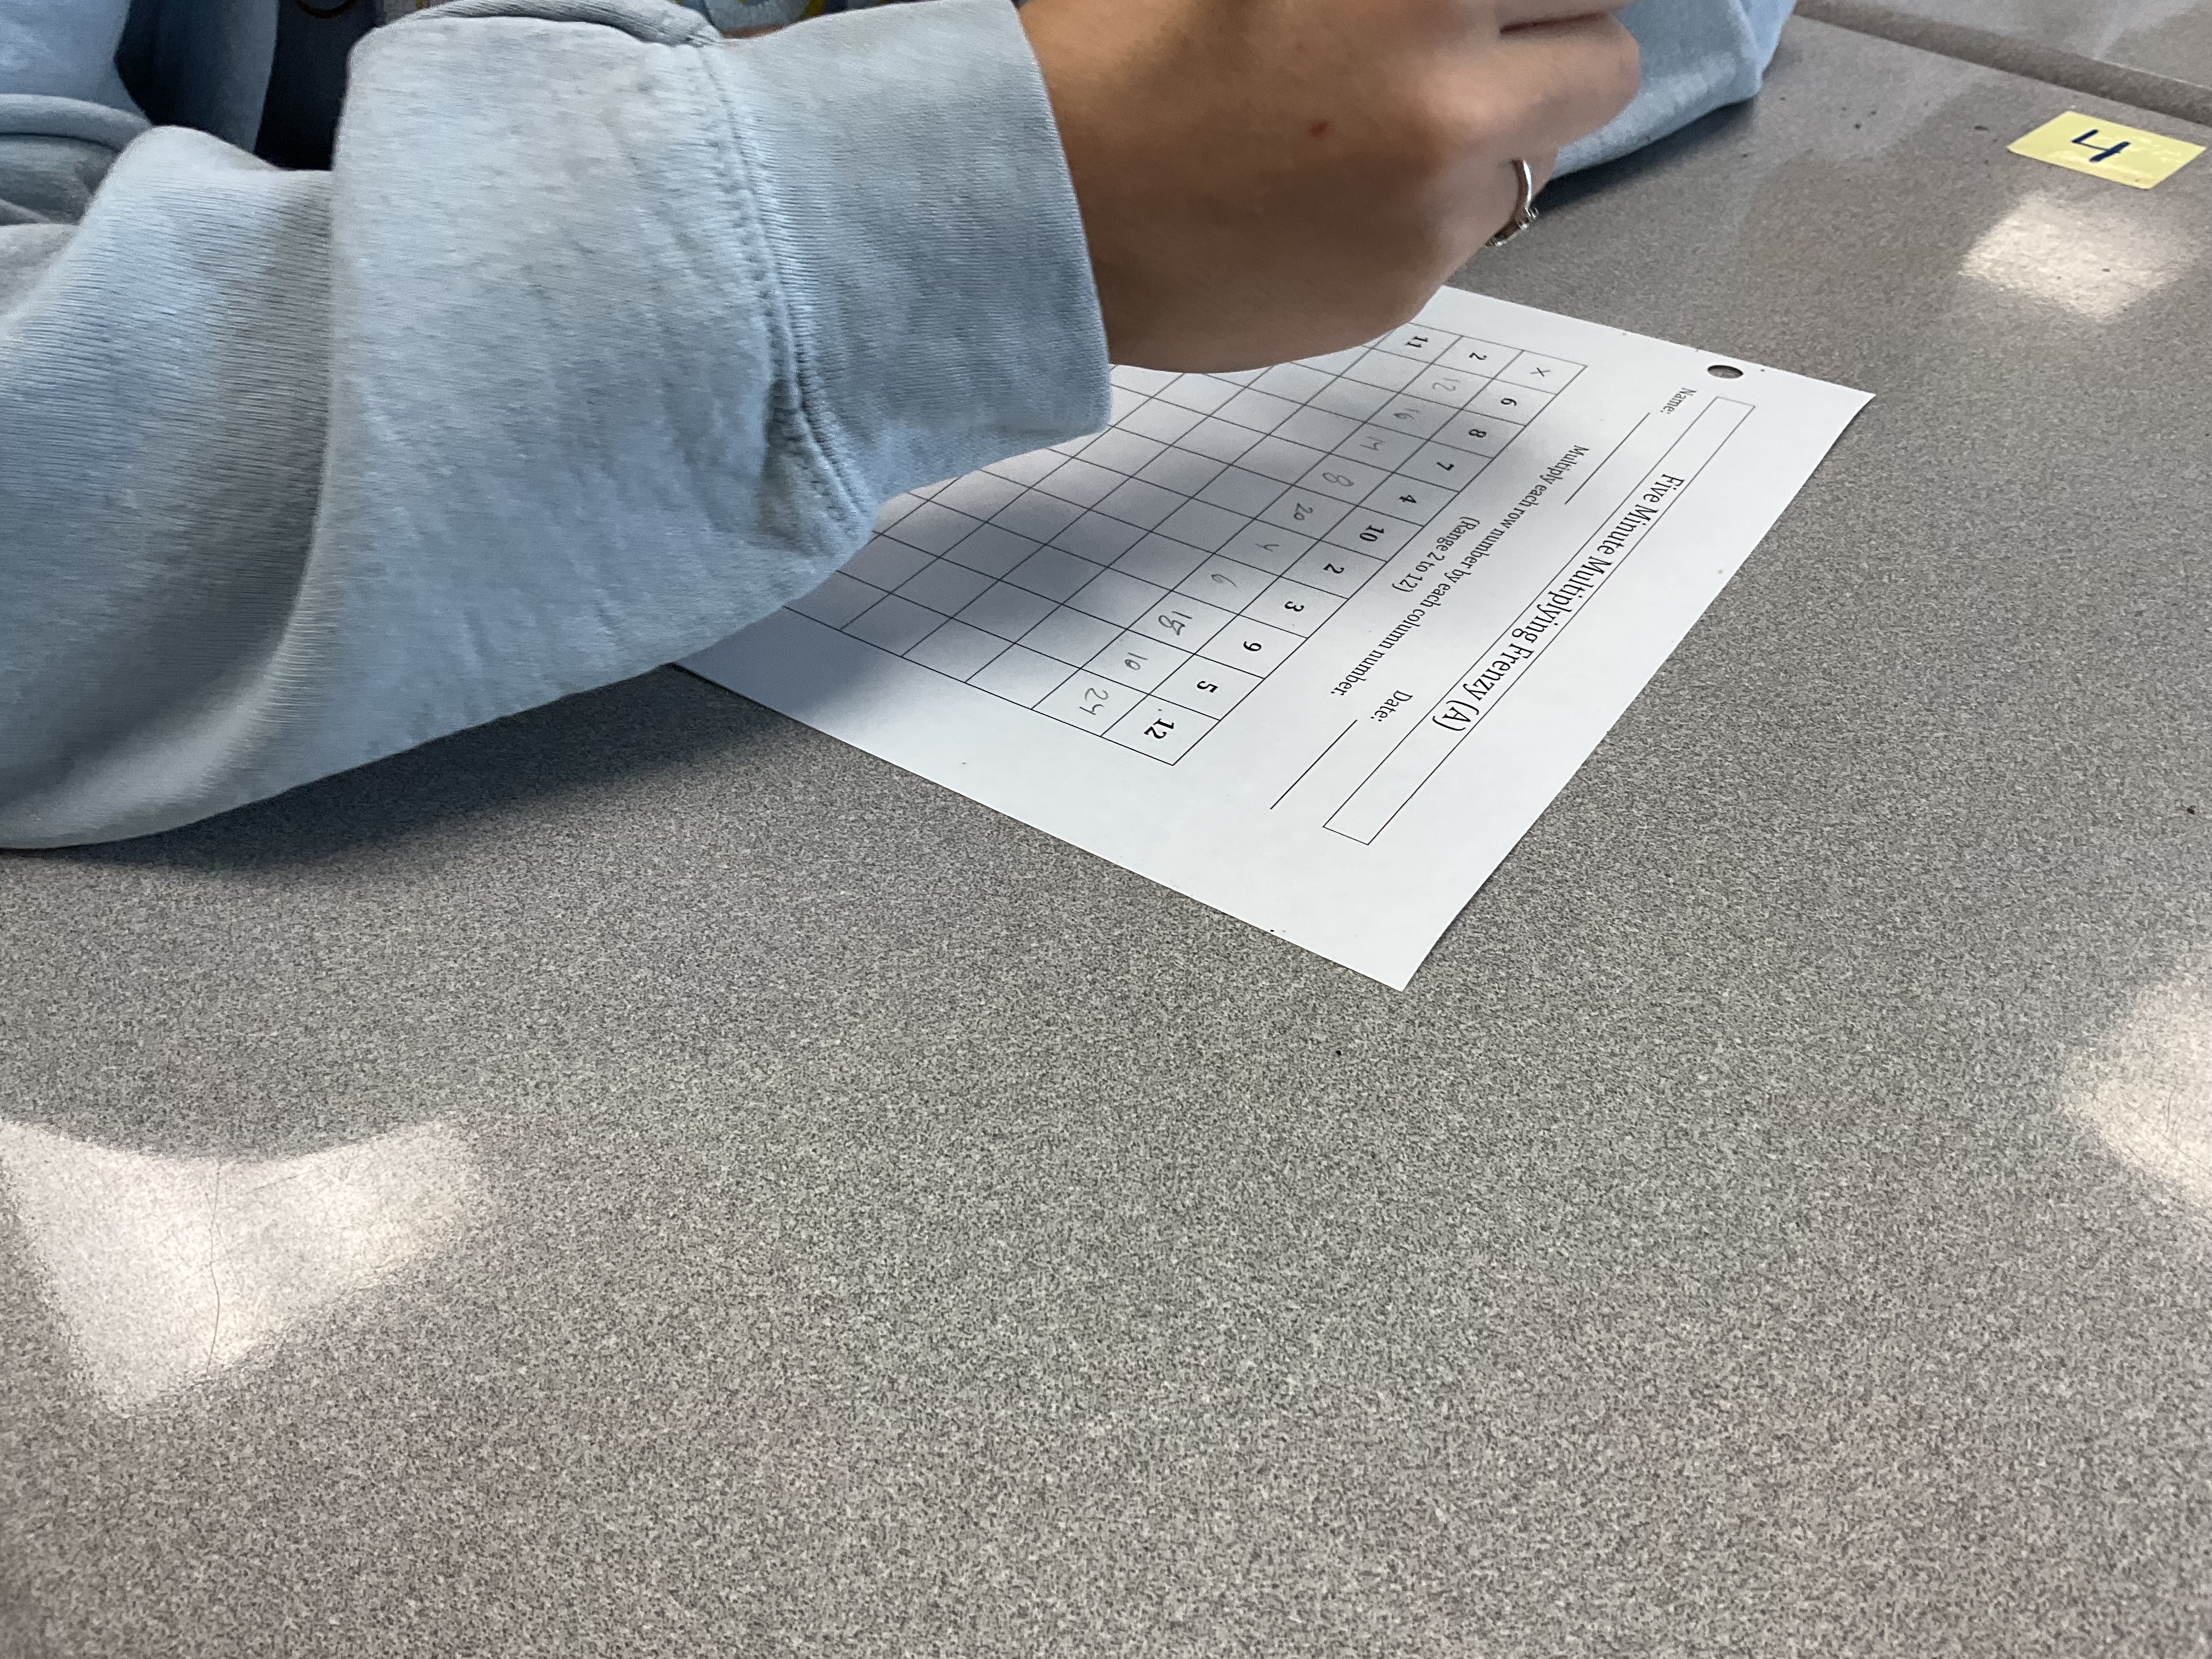
After the challenge is done, we tally up how many we got right, and how many errors we made, and how many we left blank, and how long it took. These are our dependent variables. We will be exploring how they correlate with the date that the challenge was completed.

Each student will then get to select data that tells a story. They will graph the data, interpolate and extrapolate with a line/curve of best fit, and discuss the trends of the graph.
Along the way, it is an excellent springboard to discussing multiplication strategies, and to try them out the next day.
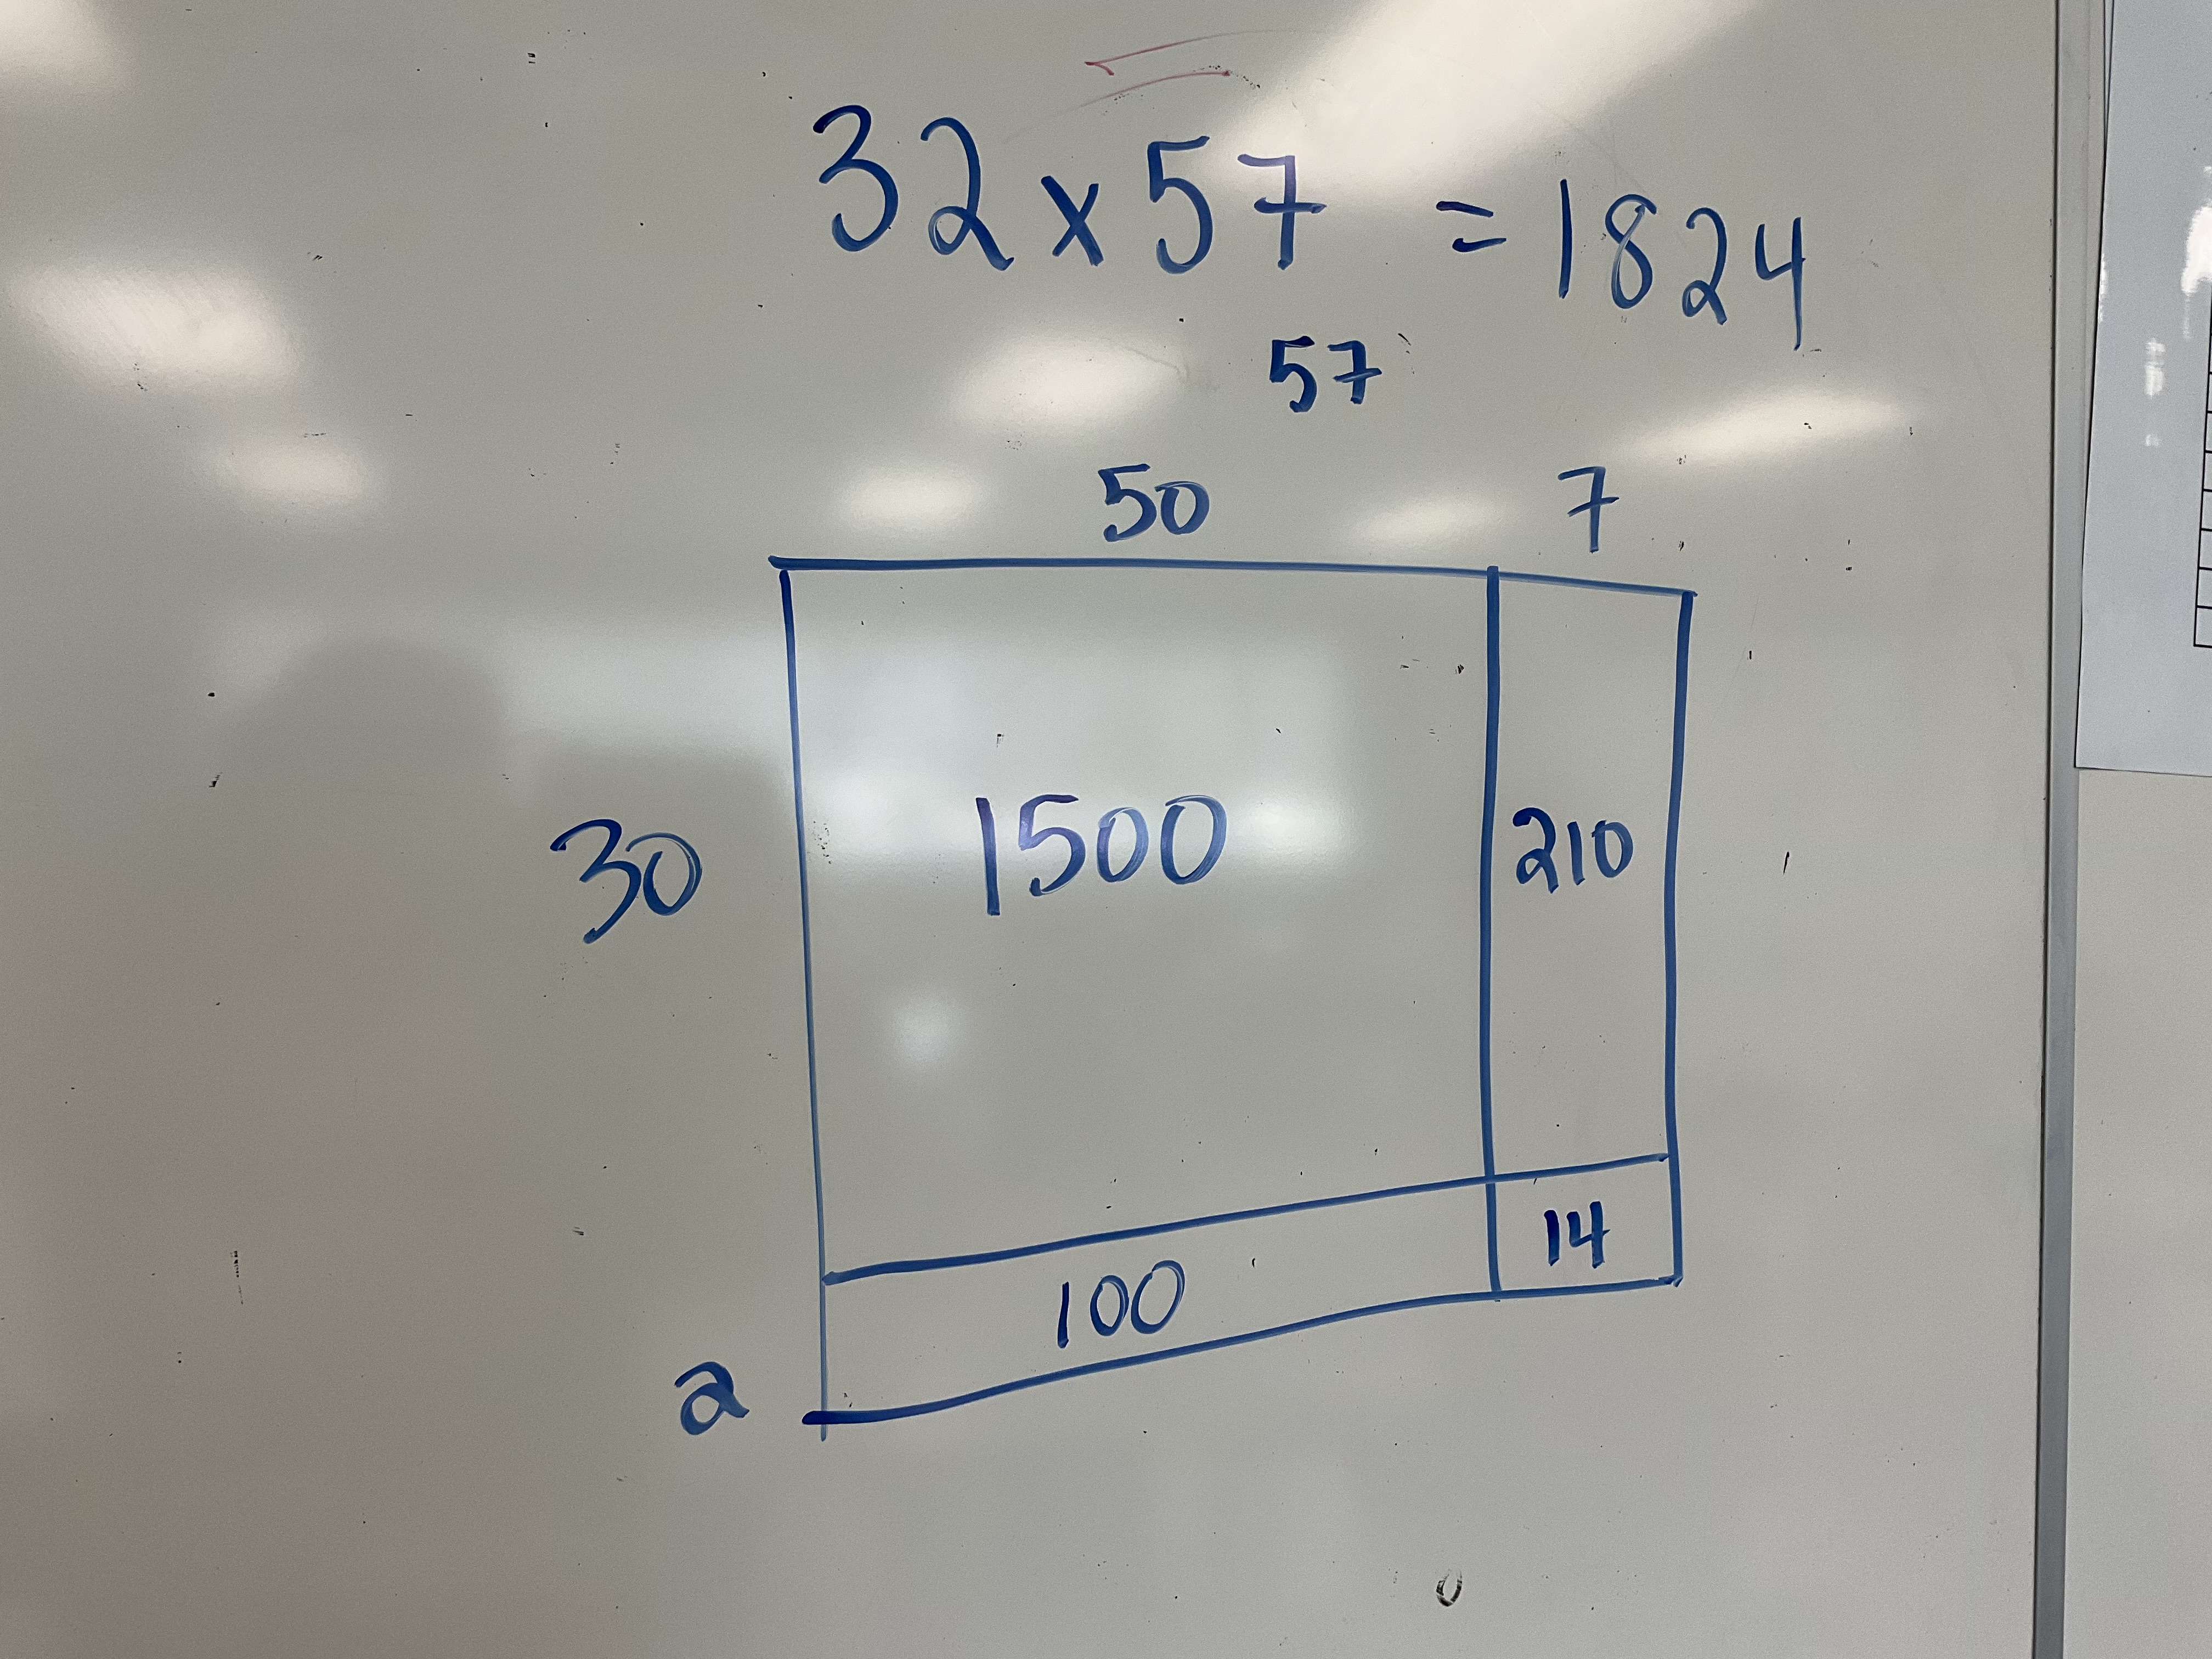
Today, we looked at using the distributive property to split up big numbers like 12 into friendlier numbers like 10 and 2, and using that to help us multiply by 12.

We also explored how this can help us multiply big numbers together.
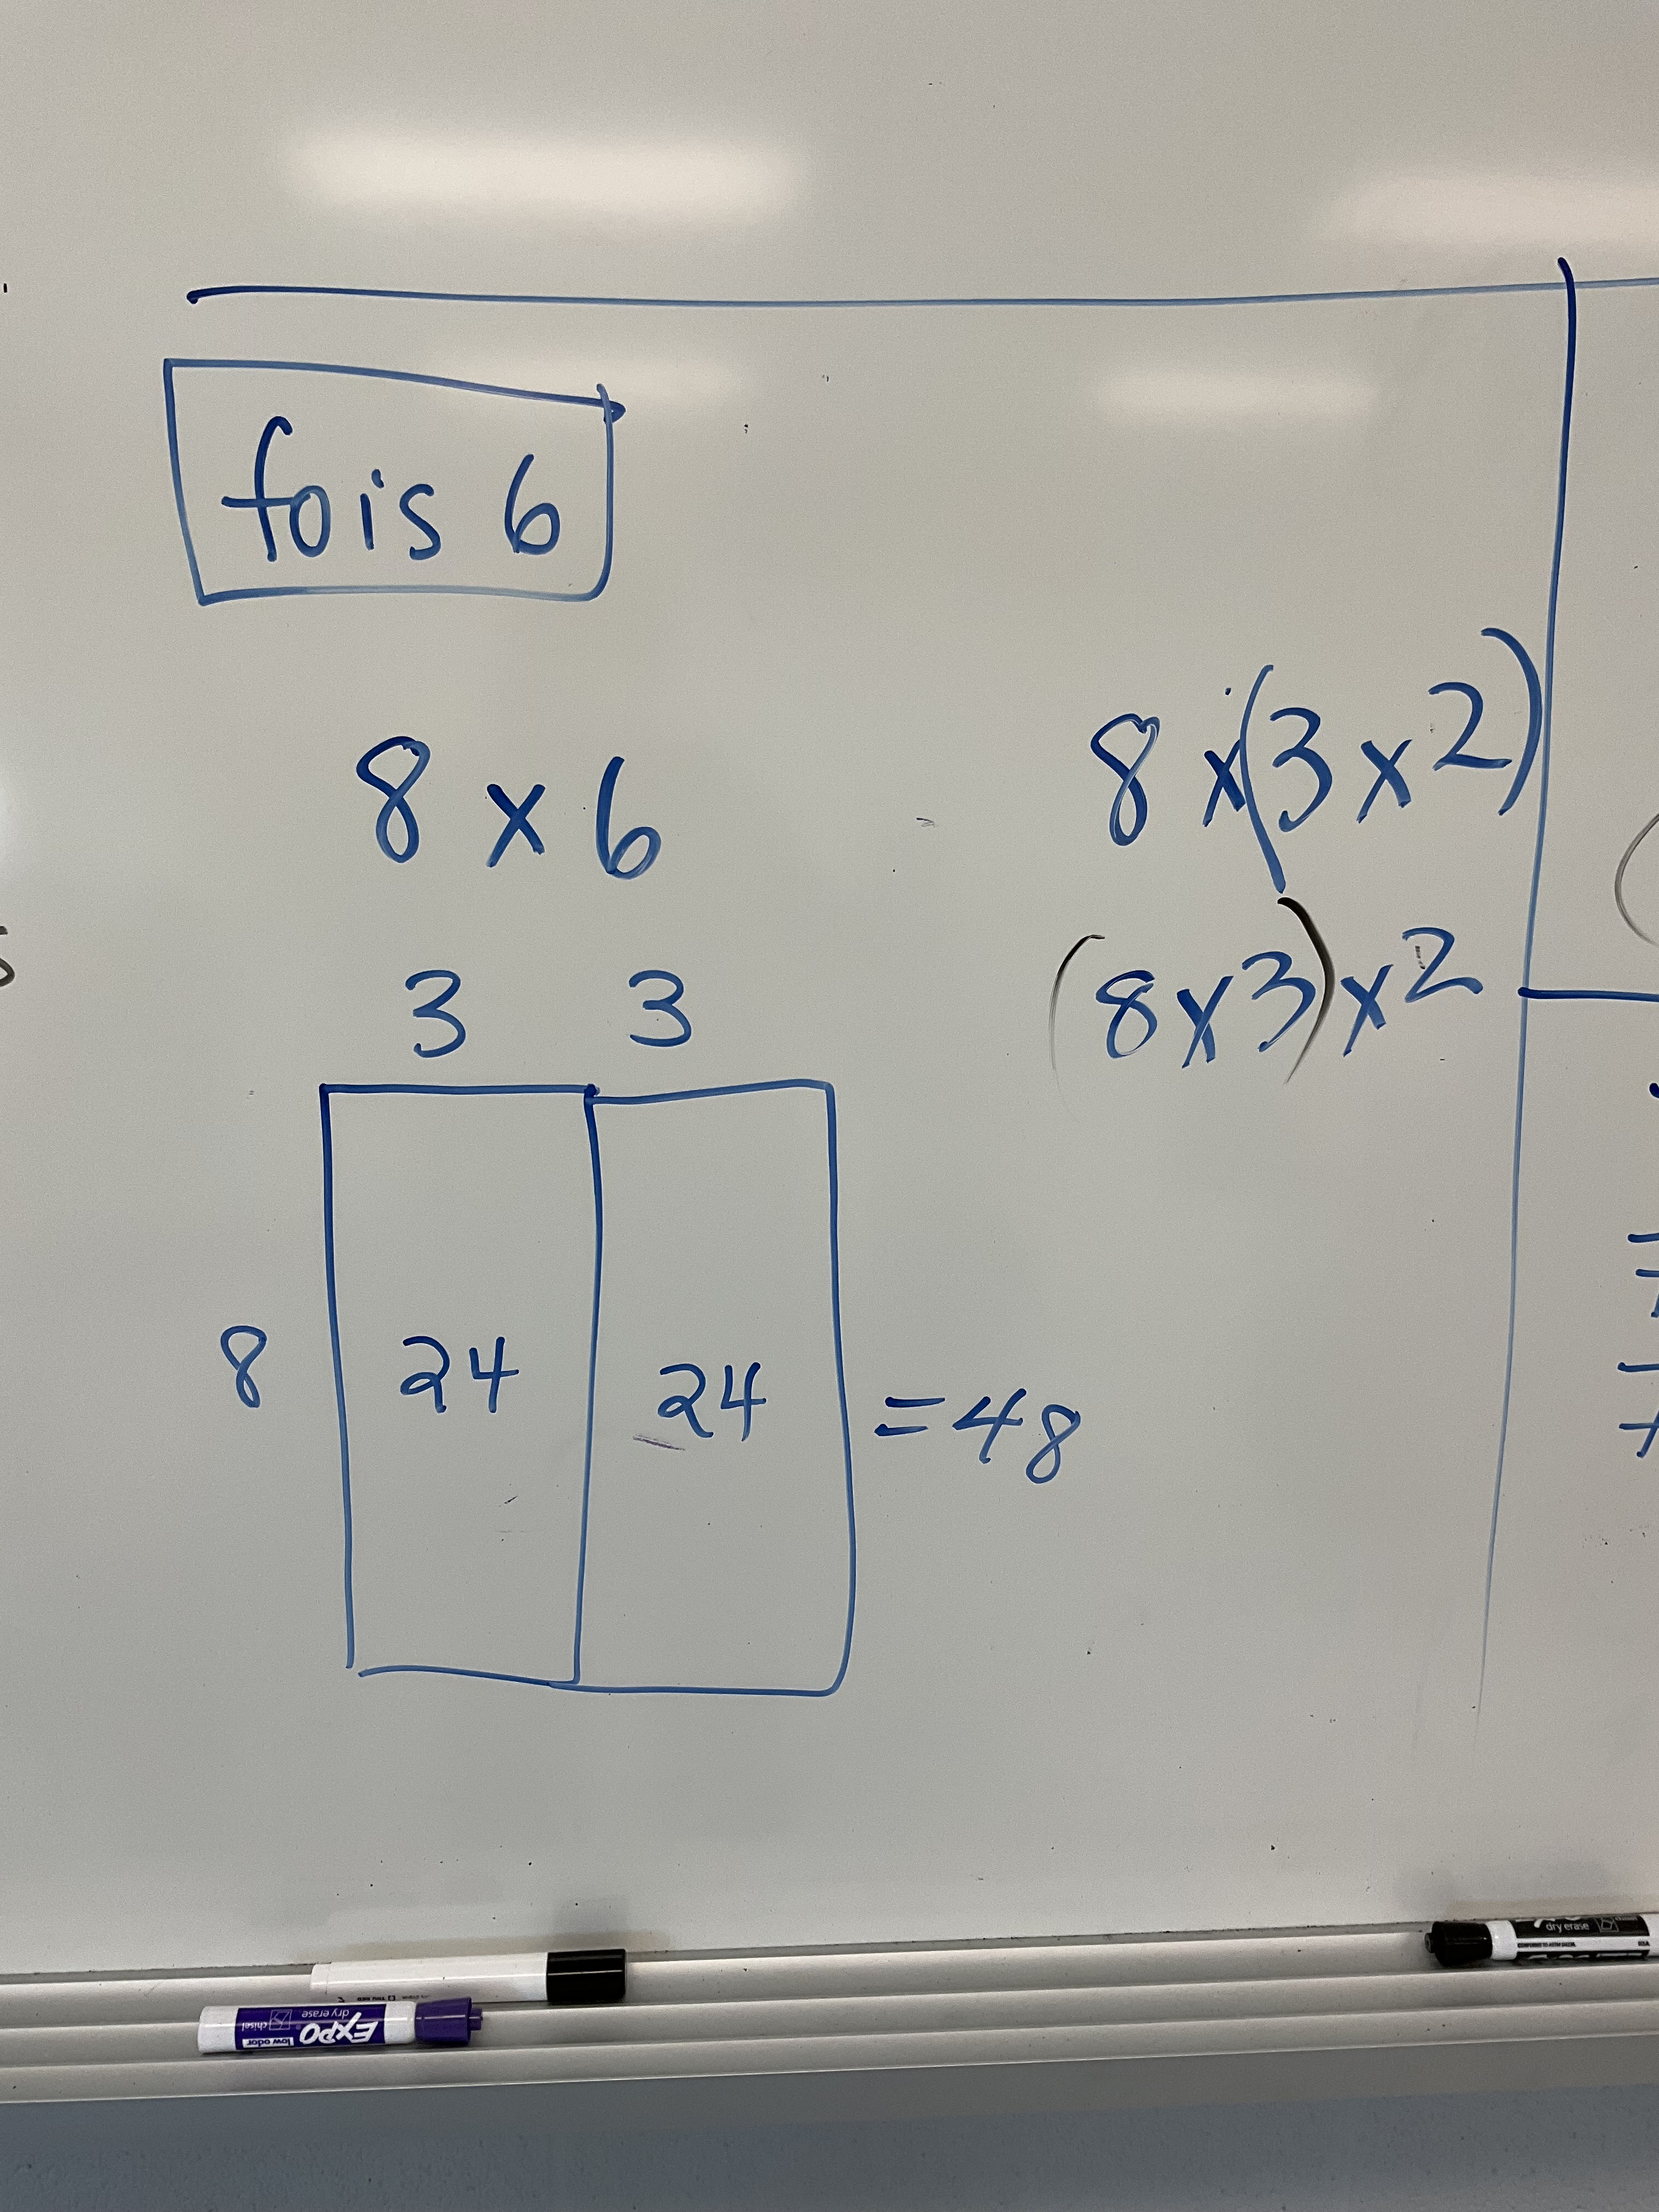
We looked at multiplying by 6 as well, and how it relates to doubling the result of multiplying by 3. Here we used the distributive property and the associative property to illustrate this multiplication.
We looked at multiplying by 4 and by 8 using the associative property as well.

Students are keeping track of their data each day, and some are already noticing some big changes as we practice and learn new strategies.
