Introduction to Spreadsheets
October 8, 2024
We were working with spreadsheets today in grade 9 math. Students measured their foot size and their height and we put the information into a shared spreadsheet.
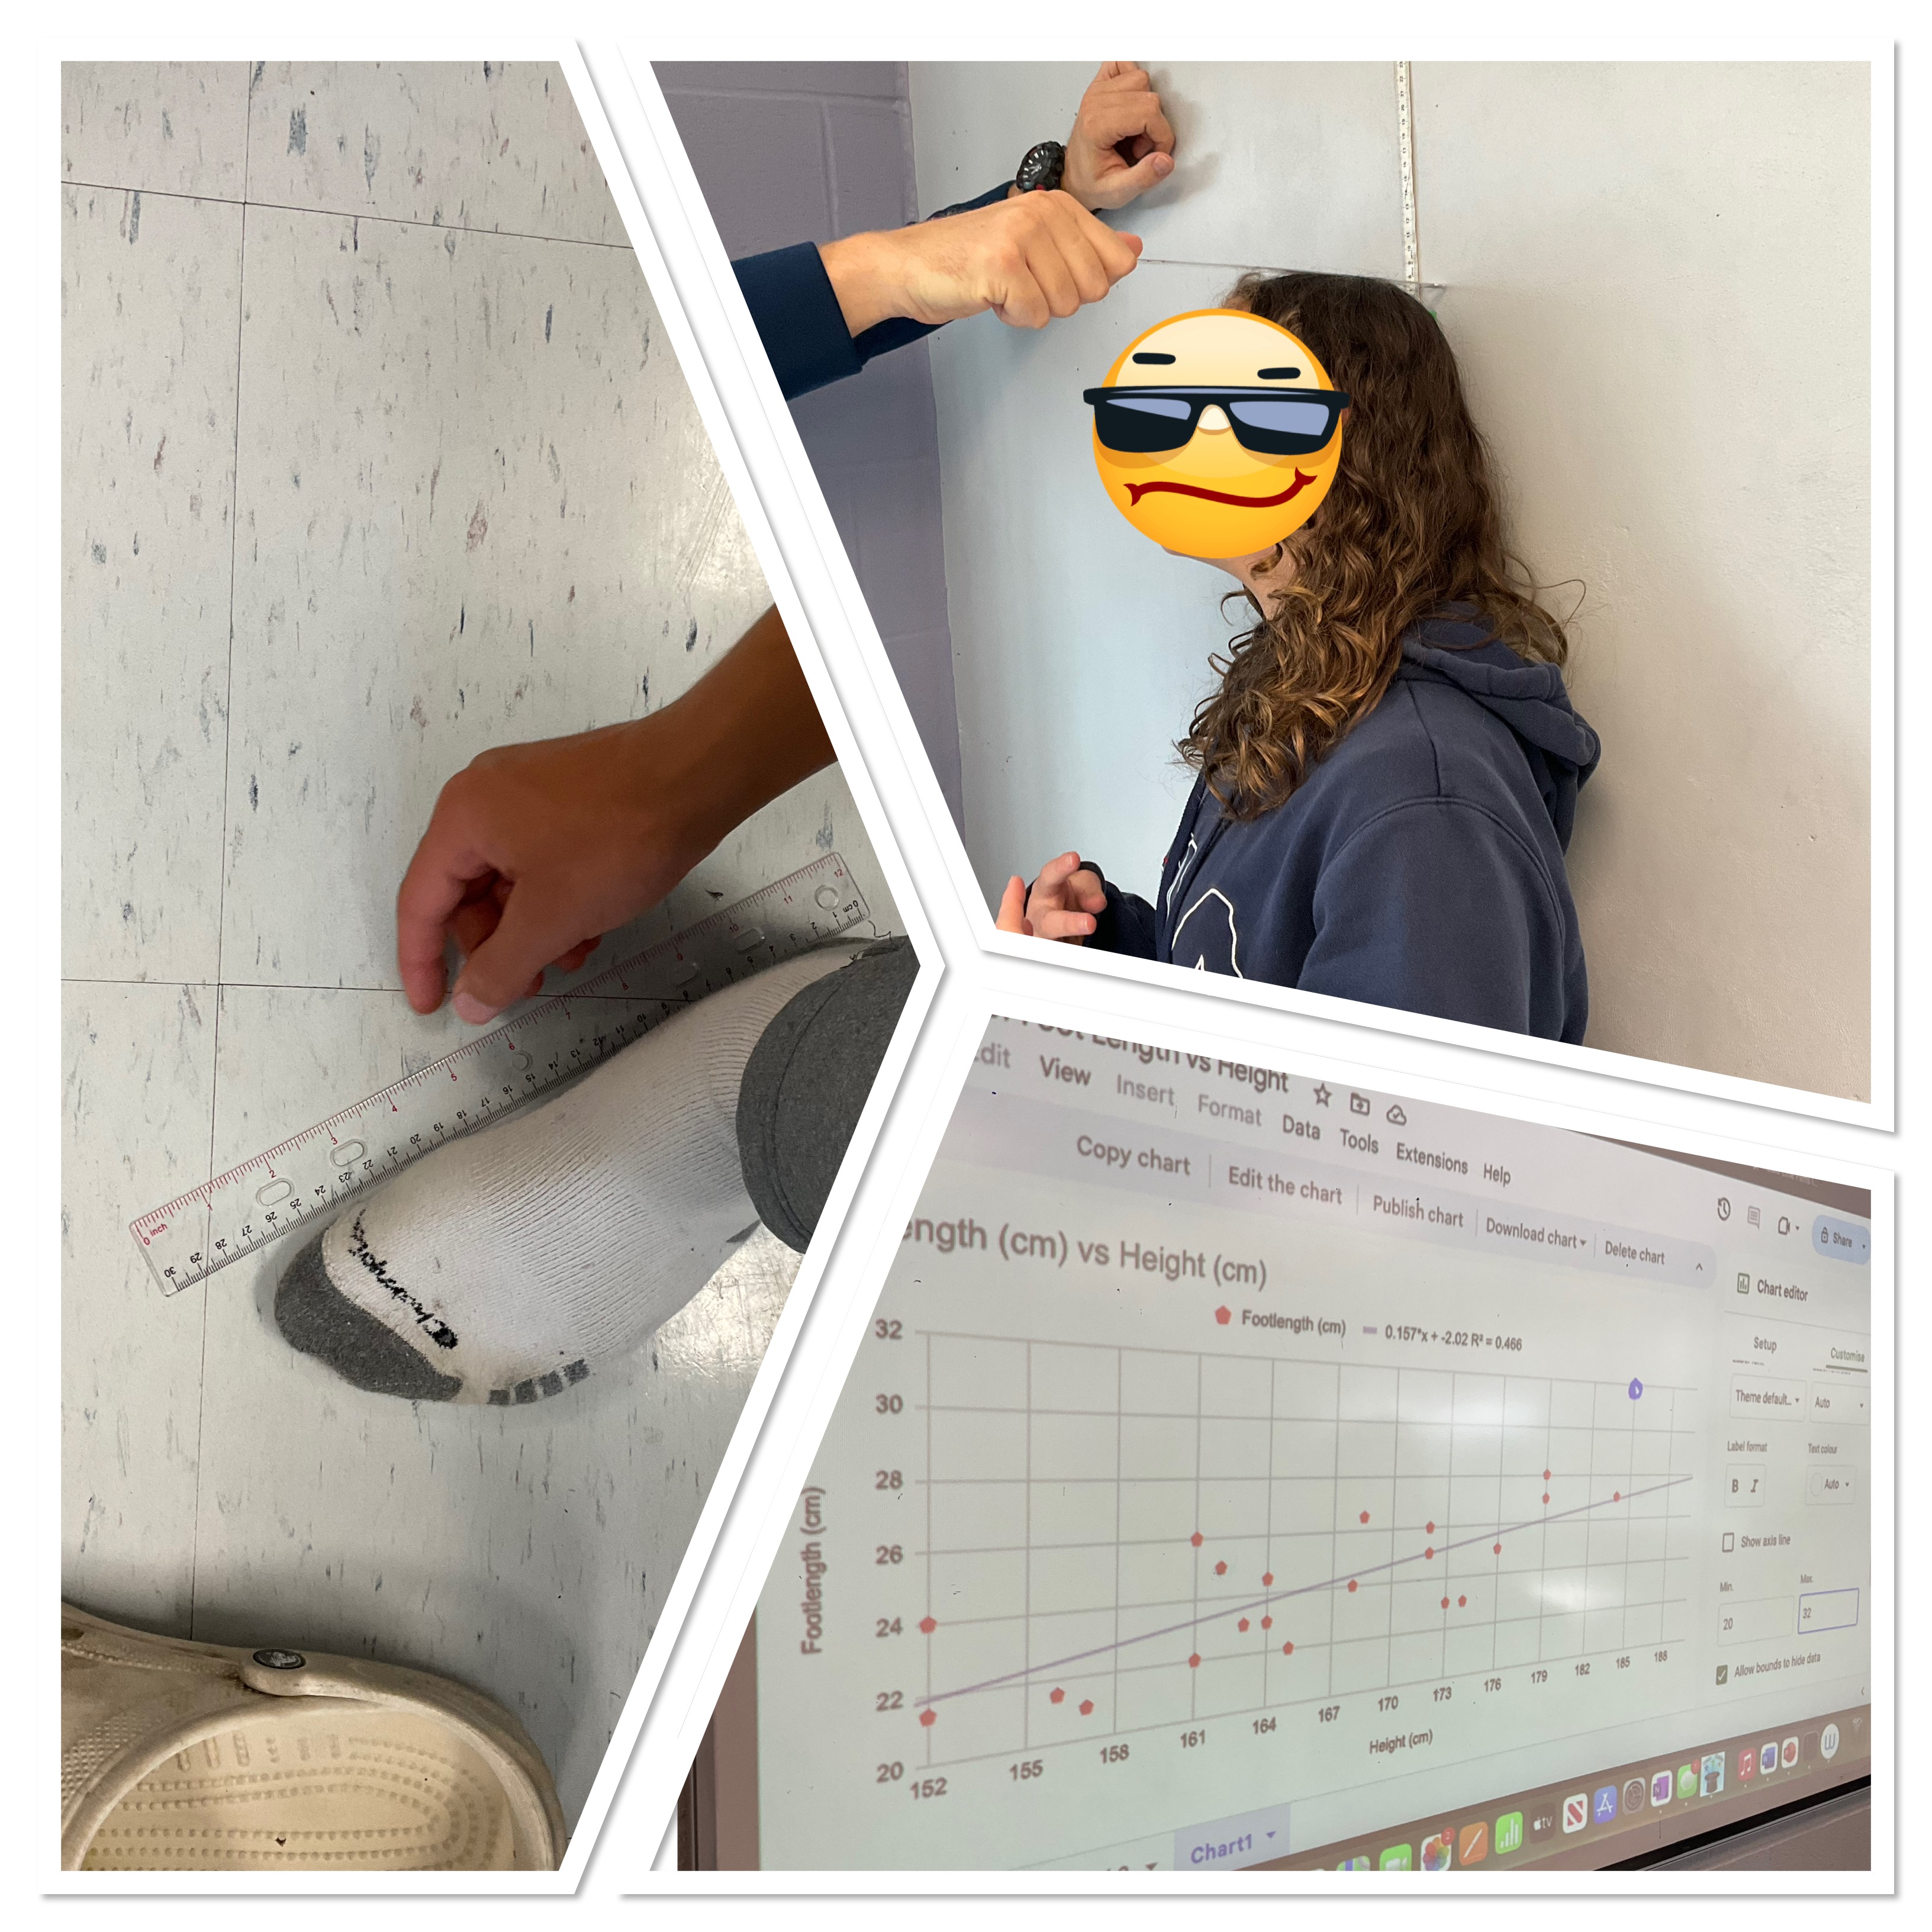
We looked at how google sheets can make a scatter plot, and add a trend line with an equation and R-squared value. We also used our graph to make some predictions.
We also explored how we can use coding to calculate the maximum and minimum values in a column of data. We also used coding to calculate the median, mode, and mean, and used the max and min to calculate the range.
No comments yet
