Connecting Representations
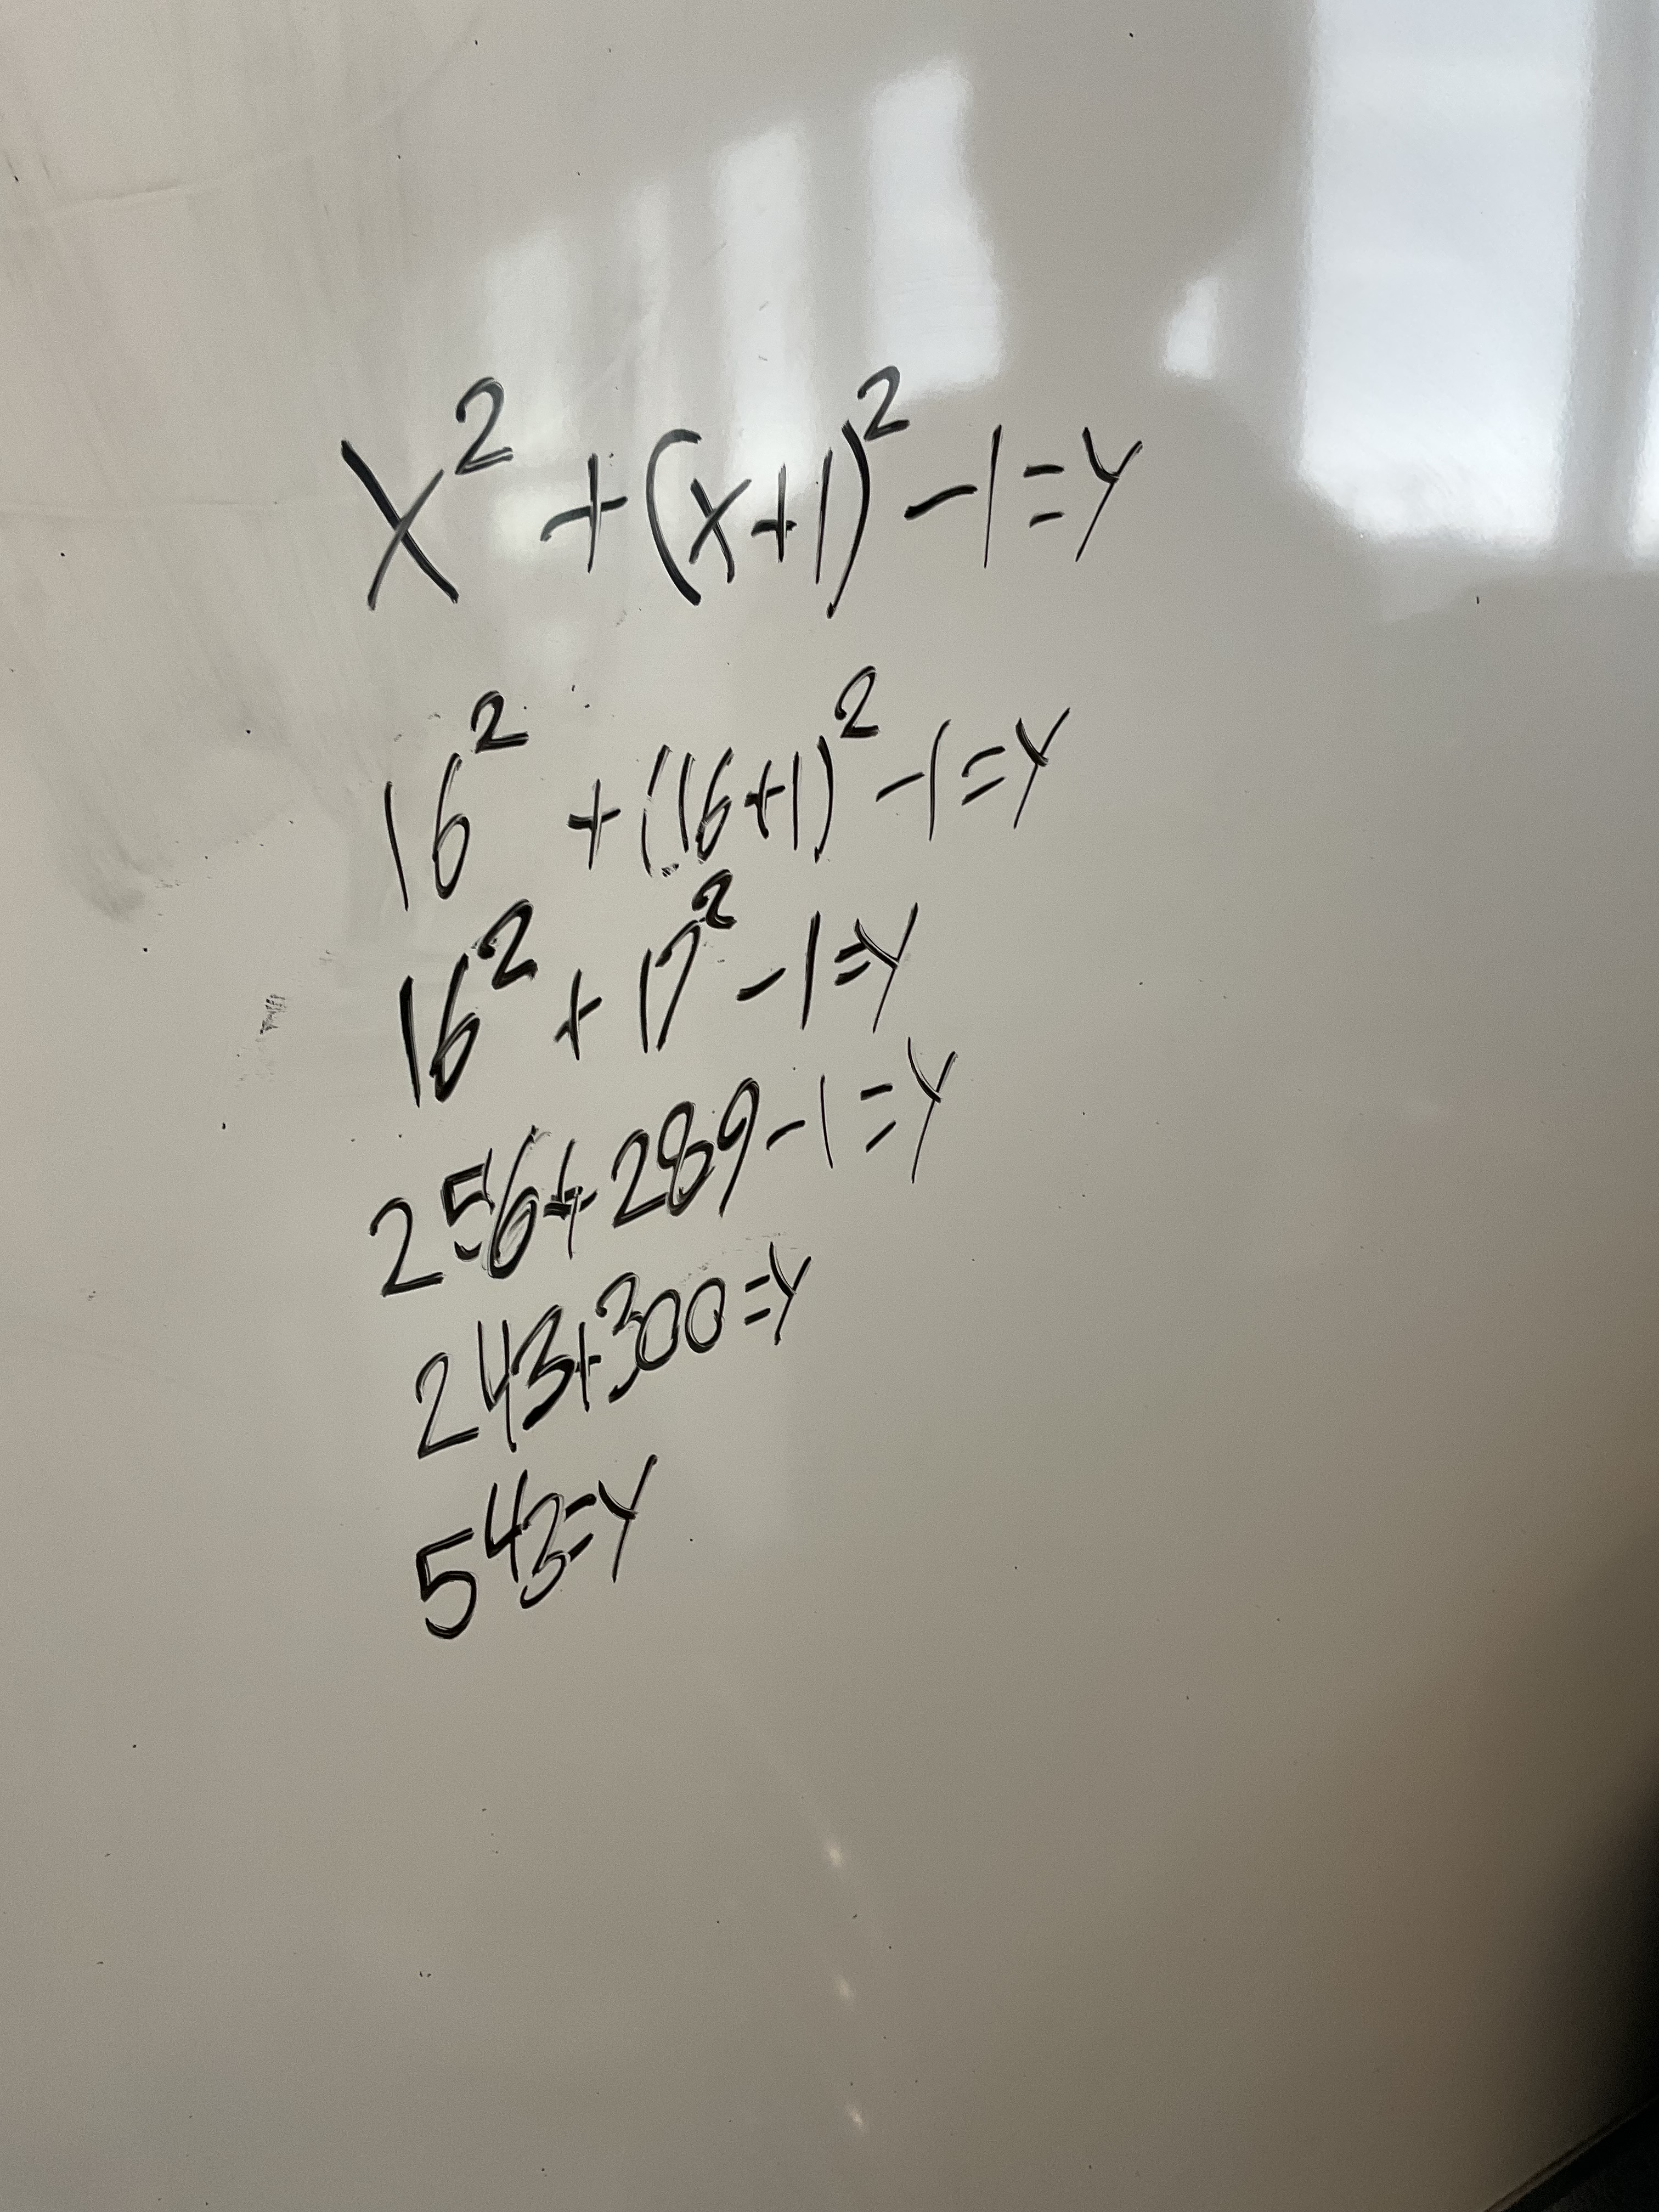
We’ve been practicing how to model quadratic visual patterns for a while now, looking at different strategies (tables, graphs, equations, and visual representations). Here’s an example of a practice problem.
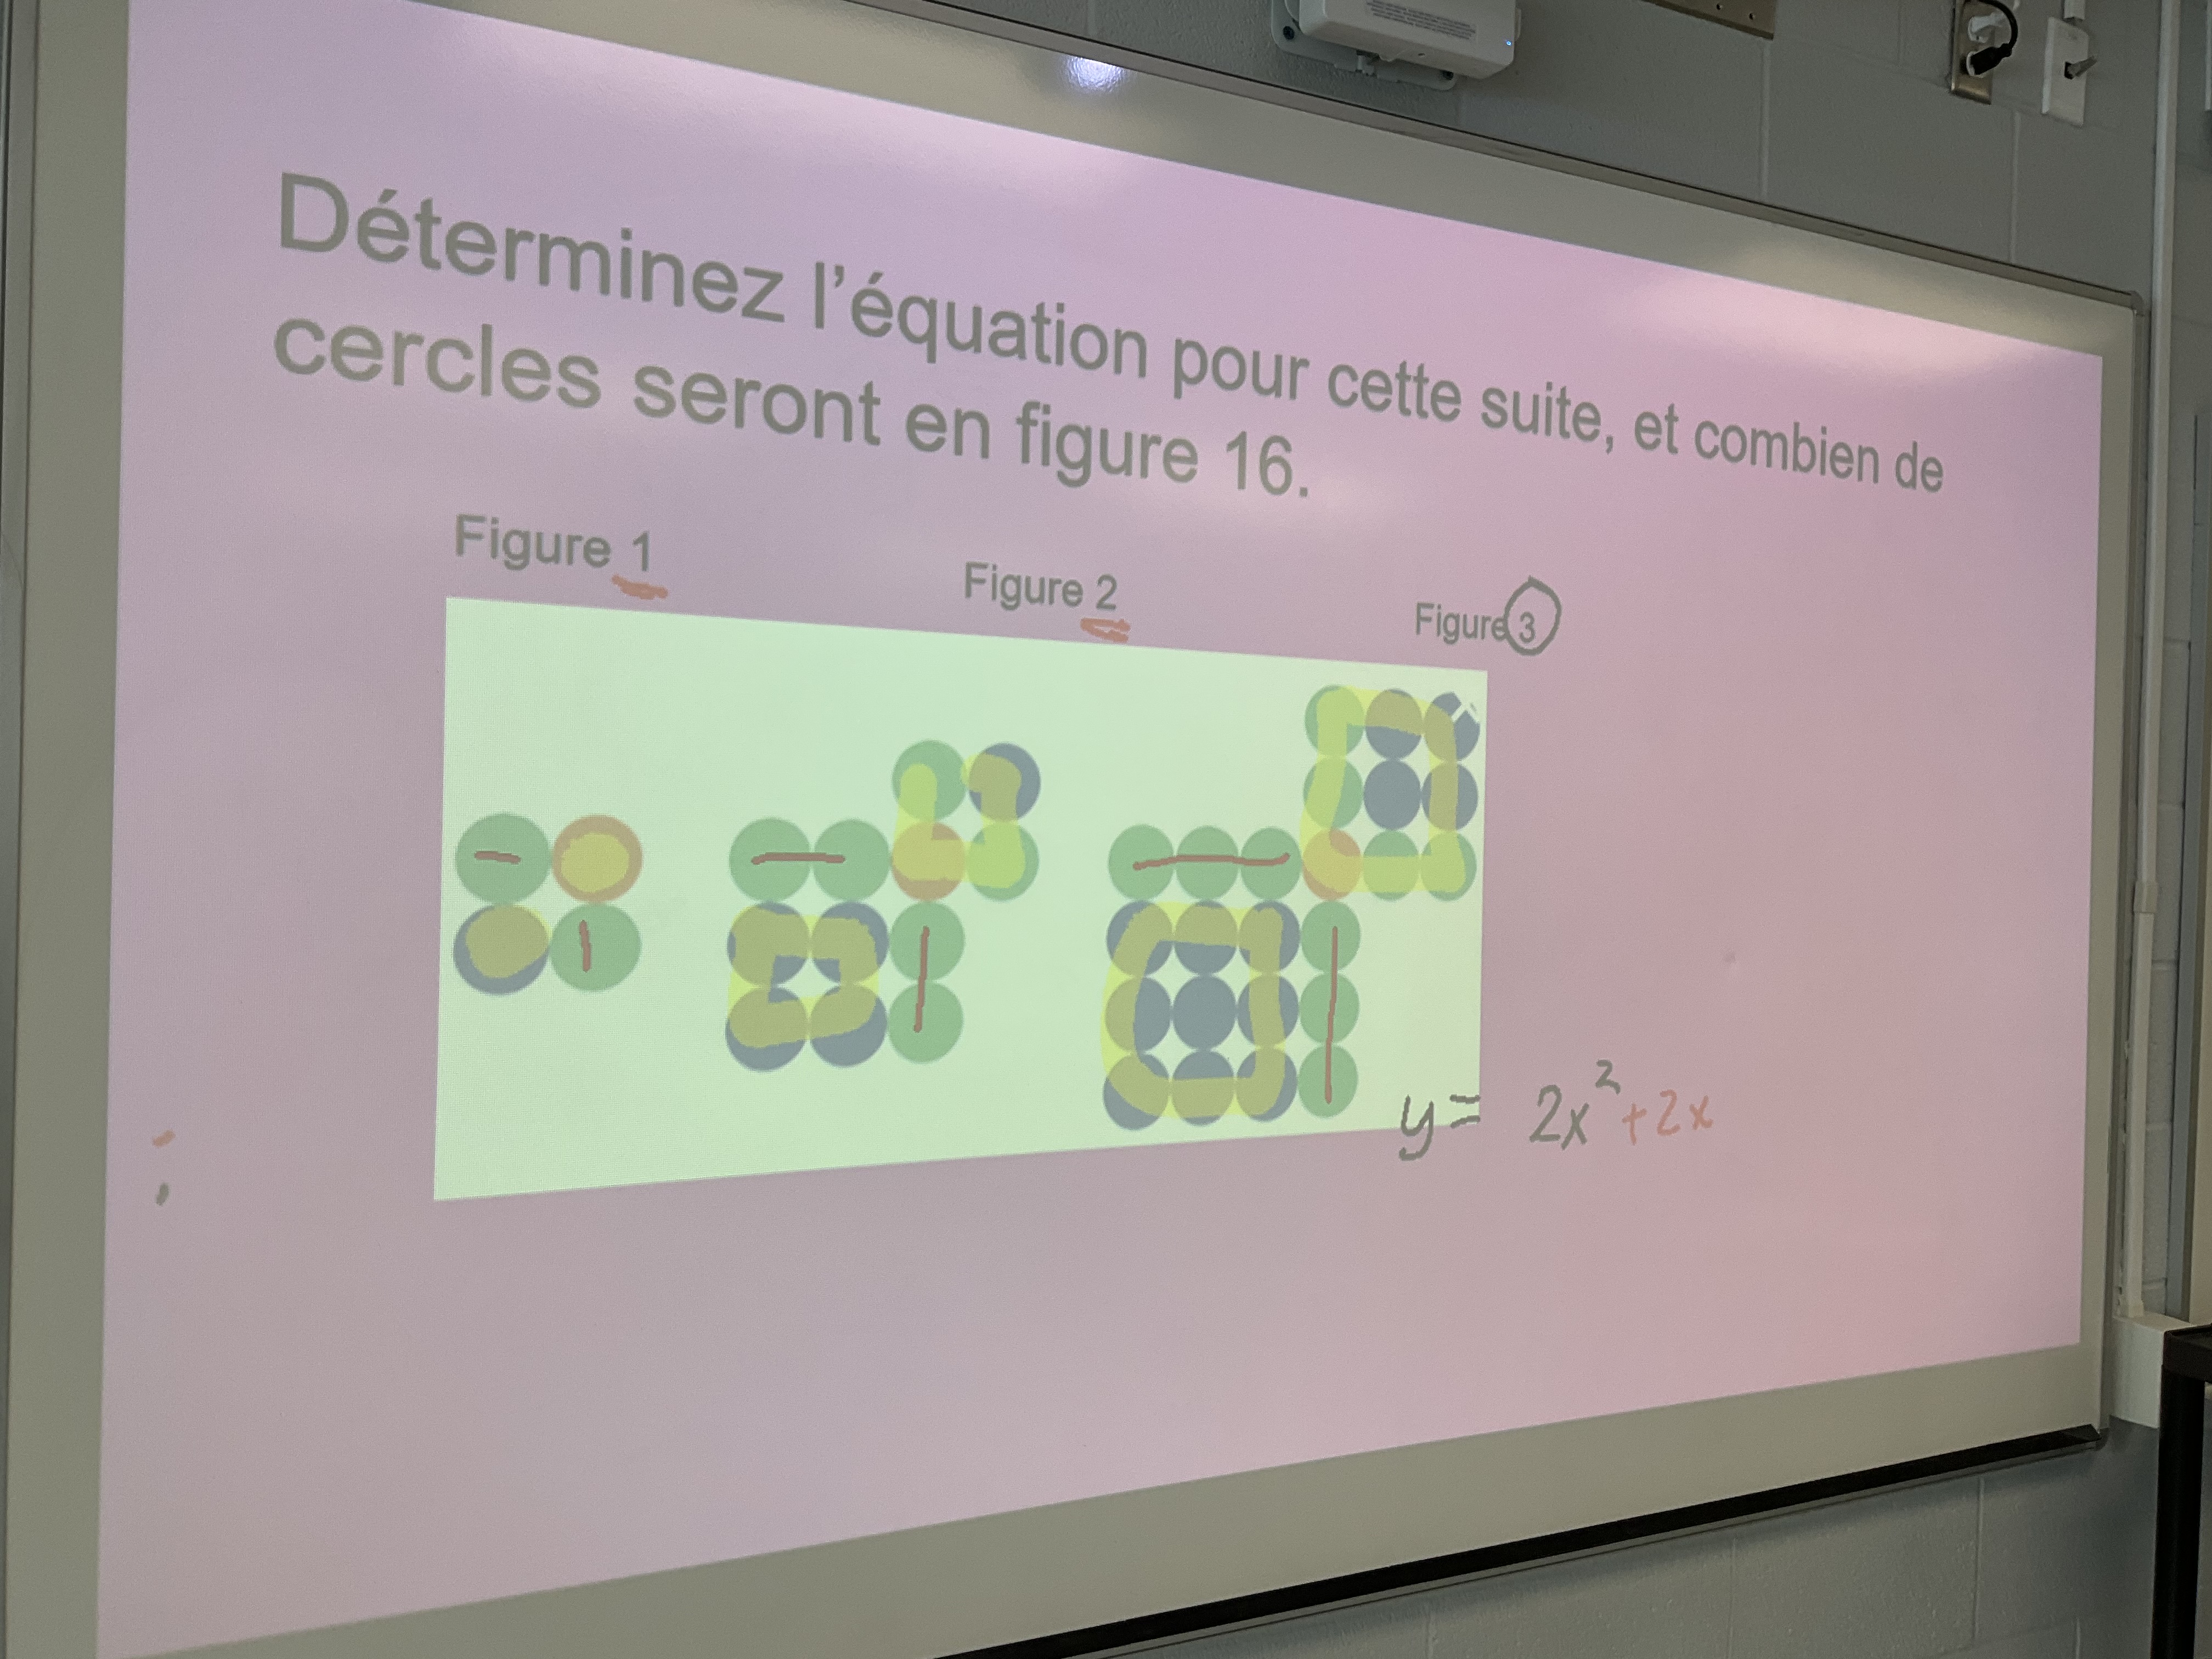
we had 2 different equations that worked based on how we viewed the pattern.
We had a summative task this week where students were exploring 2 different patterns, and comparing the equations of area and perimeter and using the patterns to solve various problems. It was in the middle of prompting a student that I had the idea to suggest using algebra tiles to build figure x to help the student visualize what’s going on.

I’m not sure why I hadn’t considered this earlier, we use tiles all the time for lots of things! This moment changed how I will approach the scaffolding of the patterning tasks. Where I used to ask students to extend the patterning to figure 4, and then back to figure 0 (to determine the constant). I’ll now ask them after the drawing of figure 4 to construct figure x from tiles. With the representation in tiles the area and perimeter equations are so easy to determine.
It’s great to make connections between representations, and to find even more ways to use the tools that we have.
