Graphing Parabolas
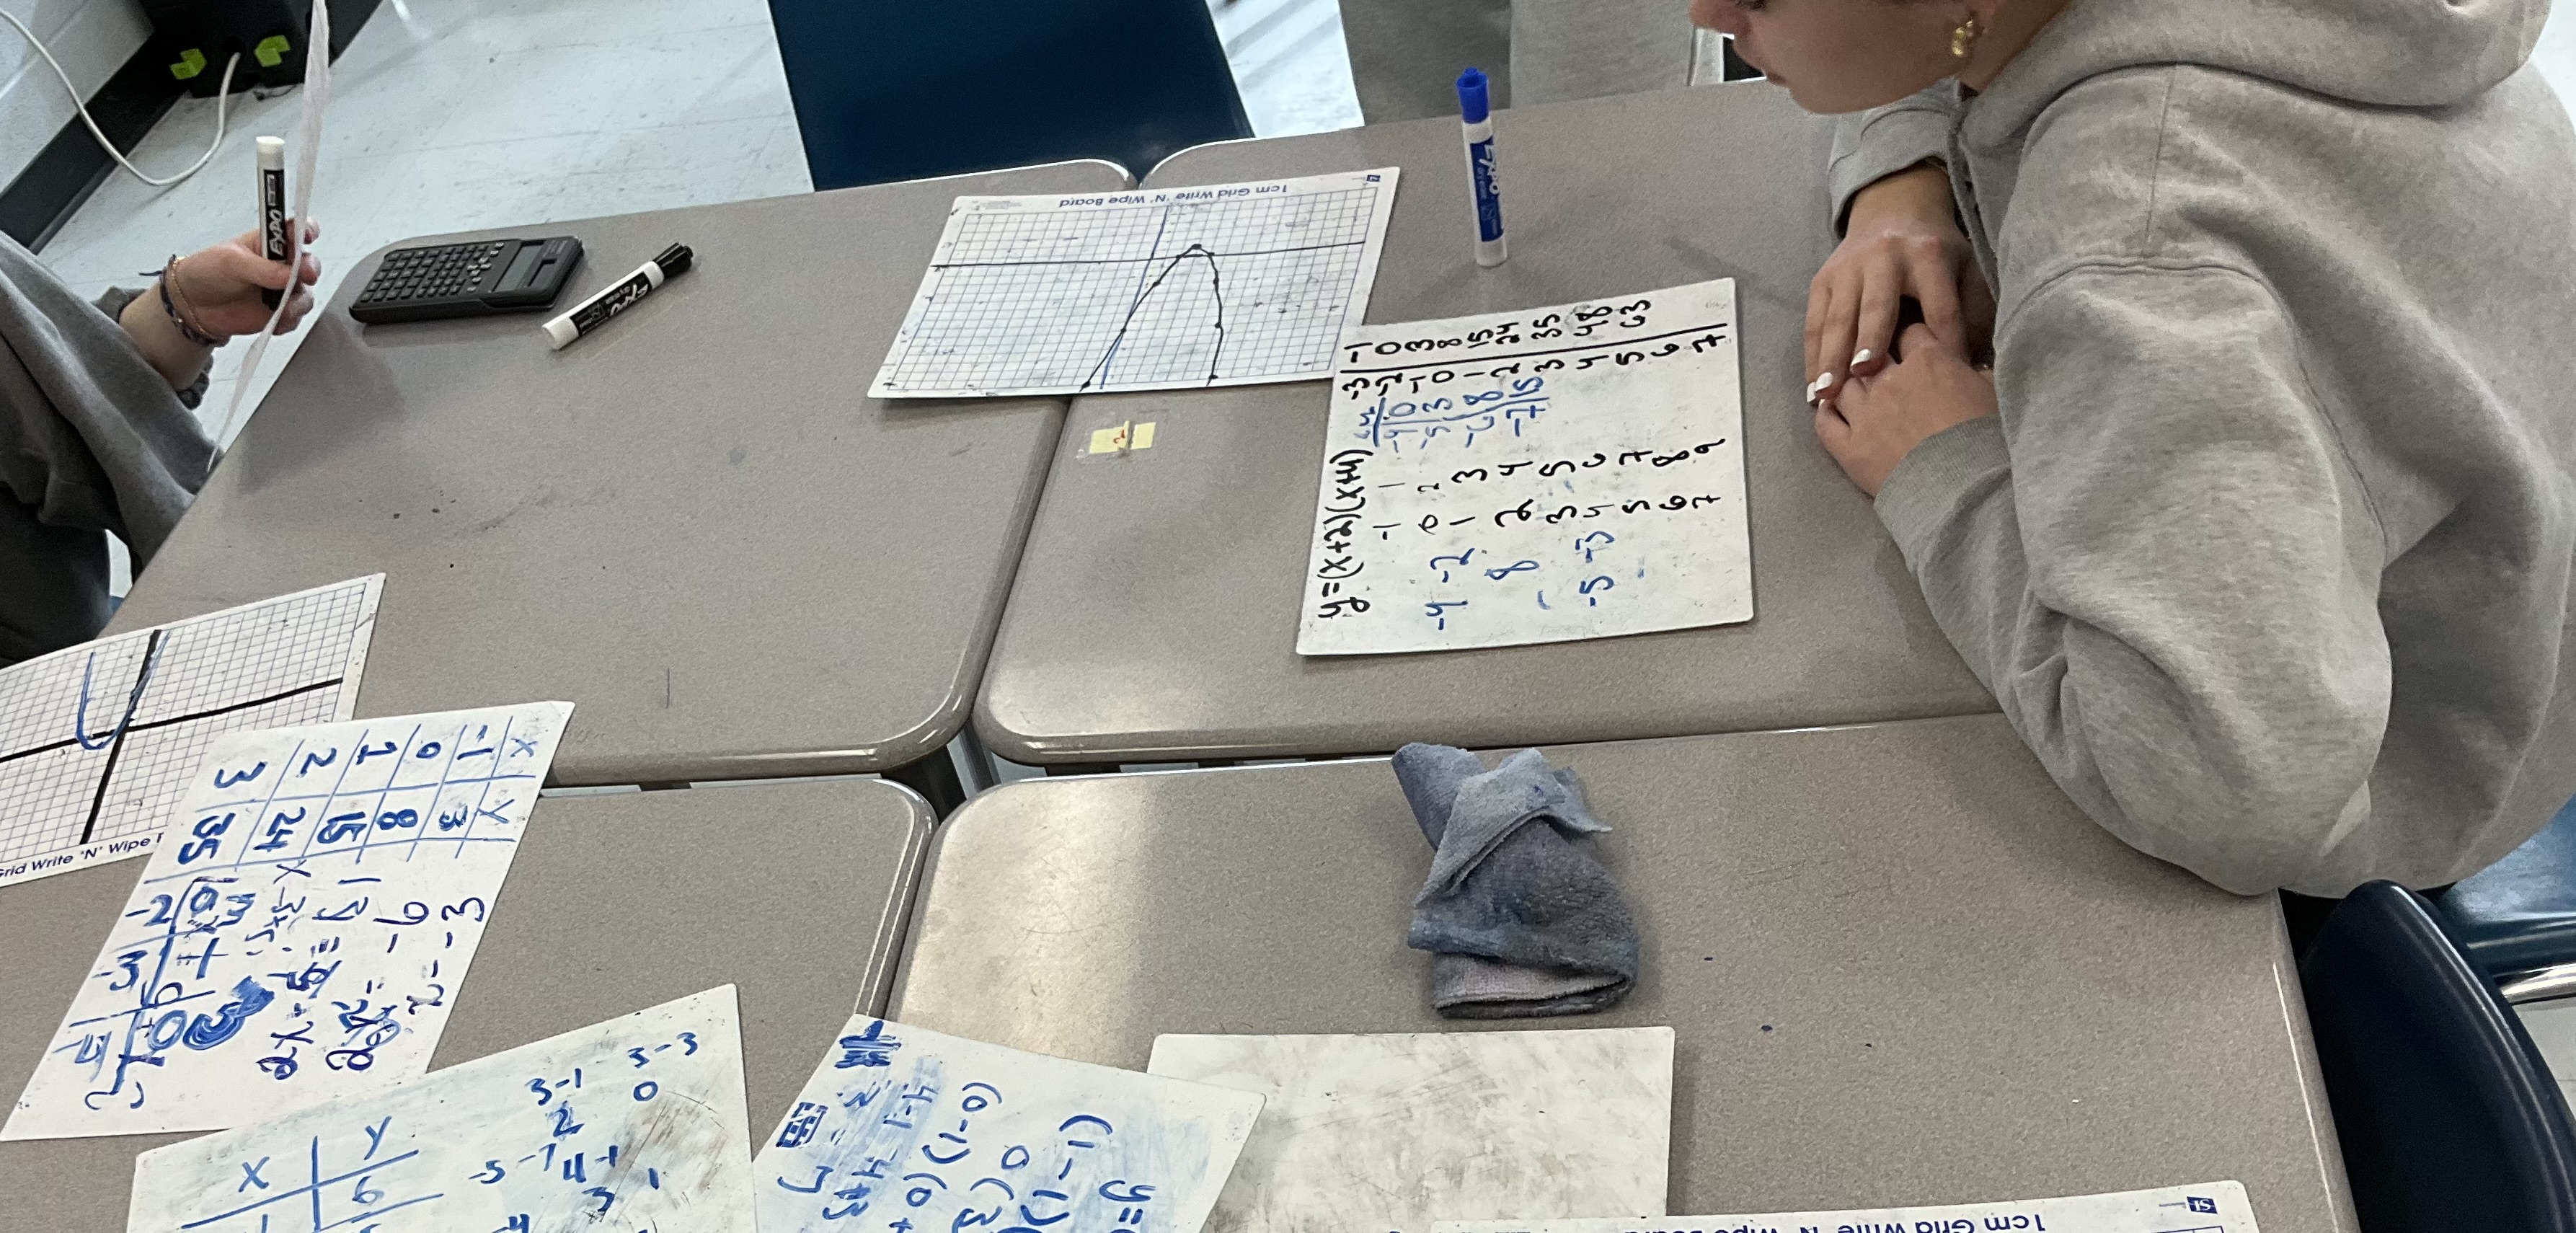
We graphed parabolas today for the first time. I gave an equation in factored form, y=(x-1)(x-3) and then we set out to make tables of values to see what it looked like.

Some students worked from the factored form as given, and others decided to expand first and use the trinomial.
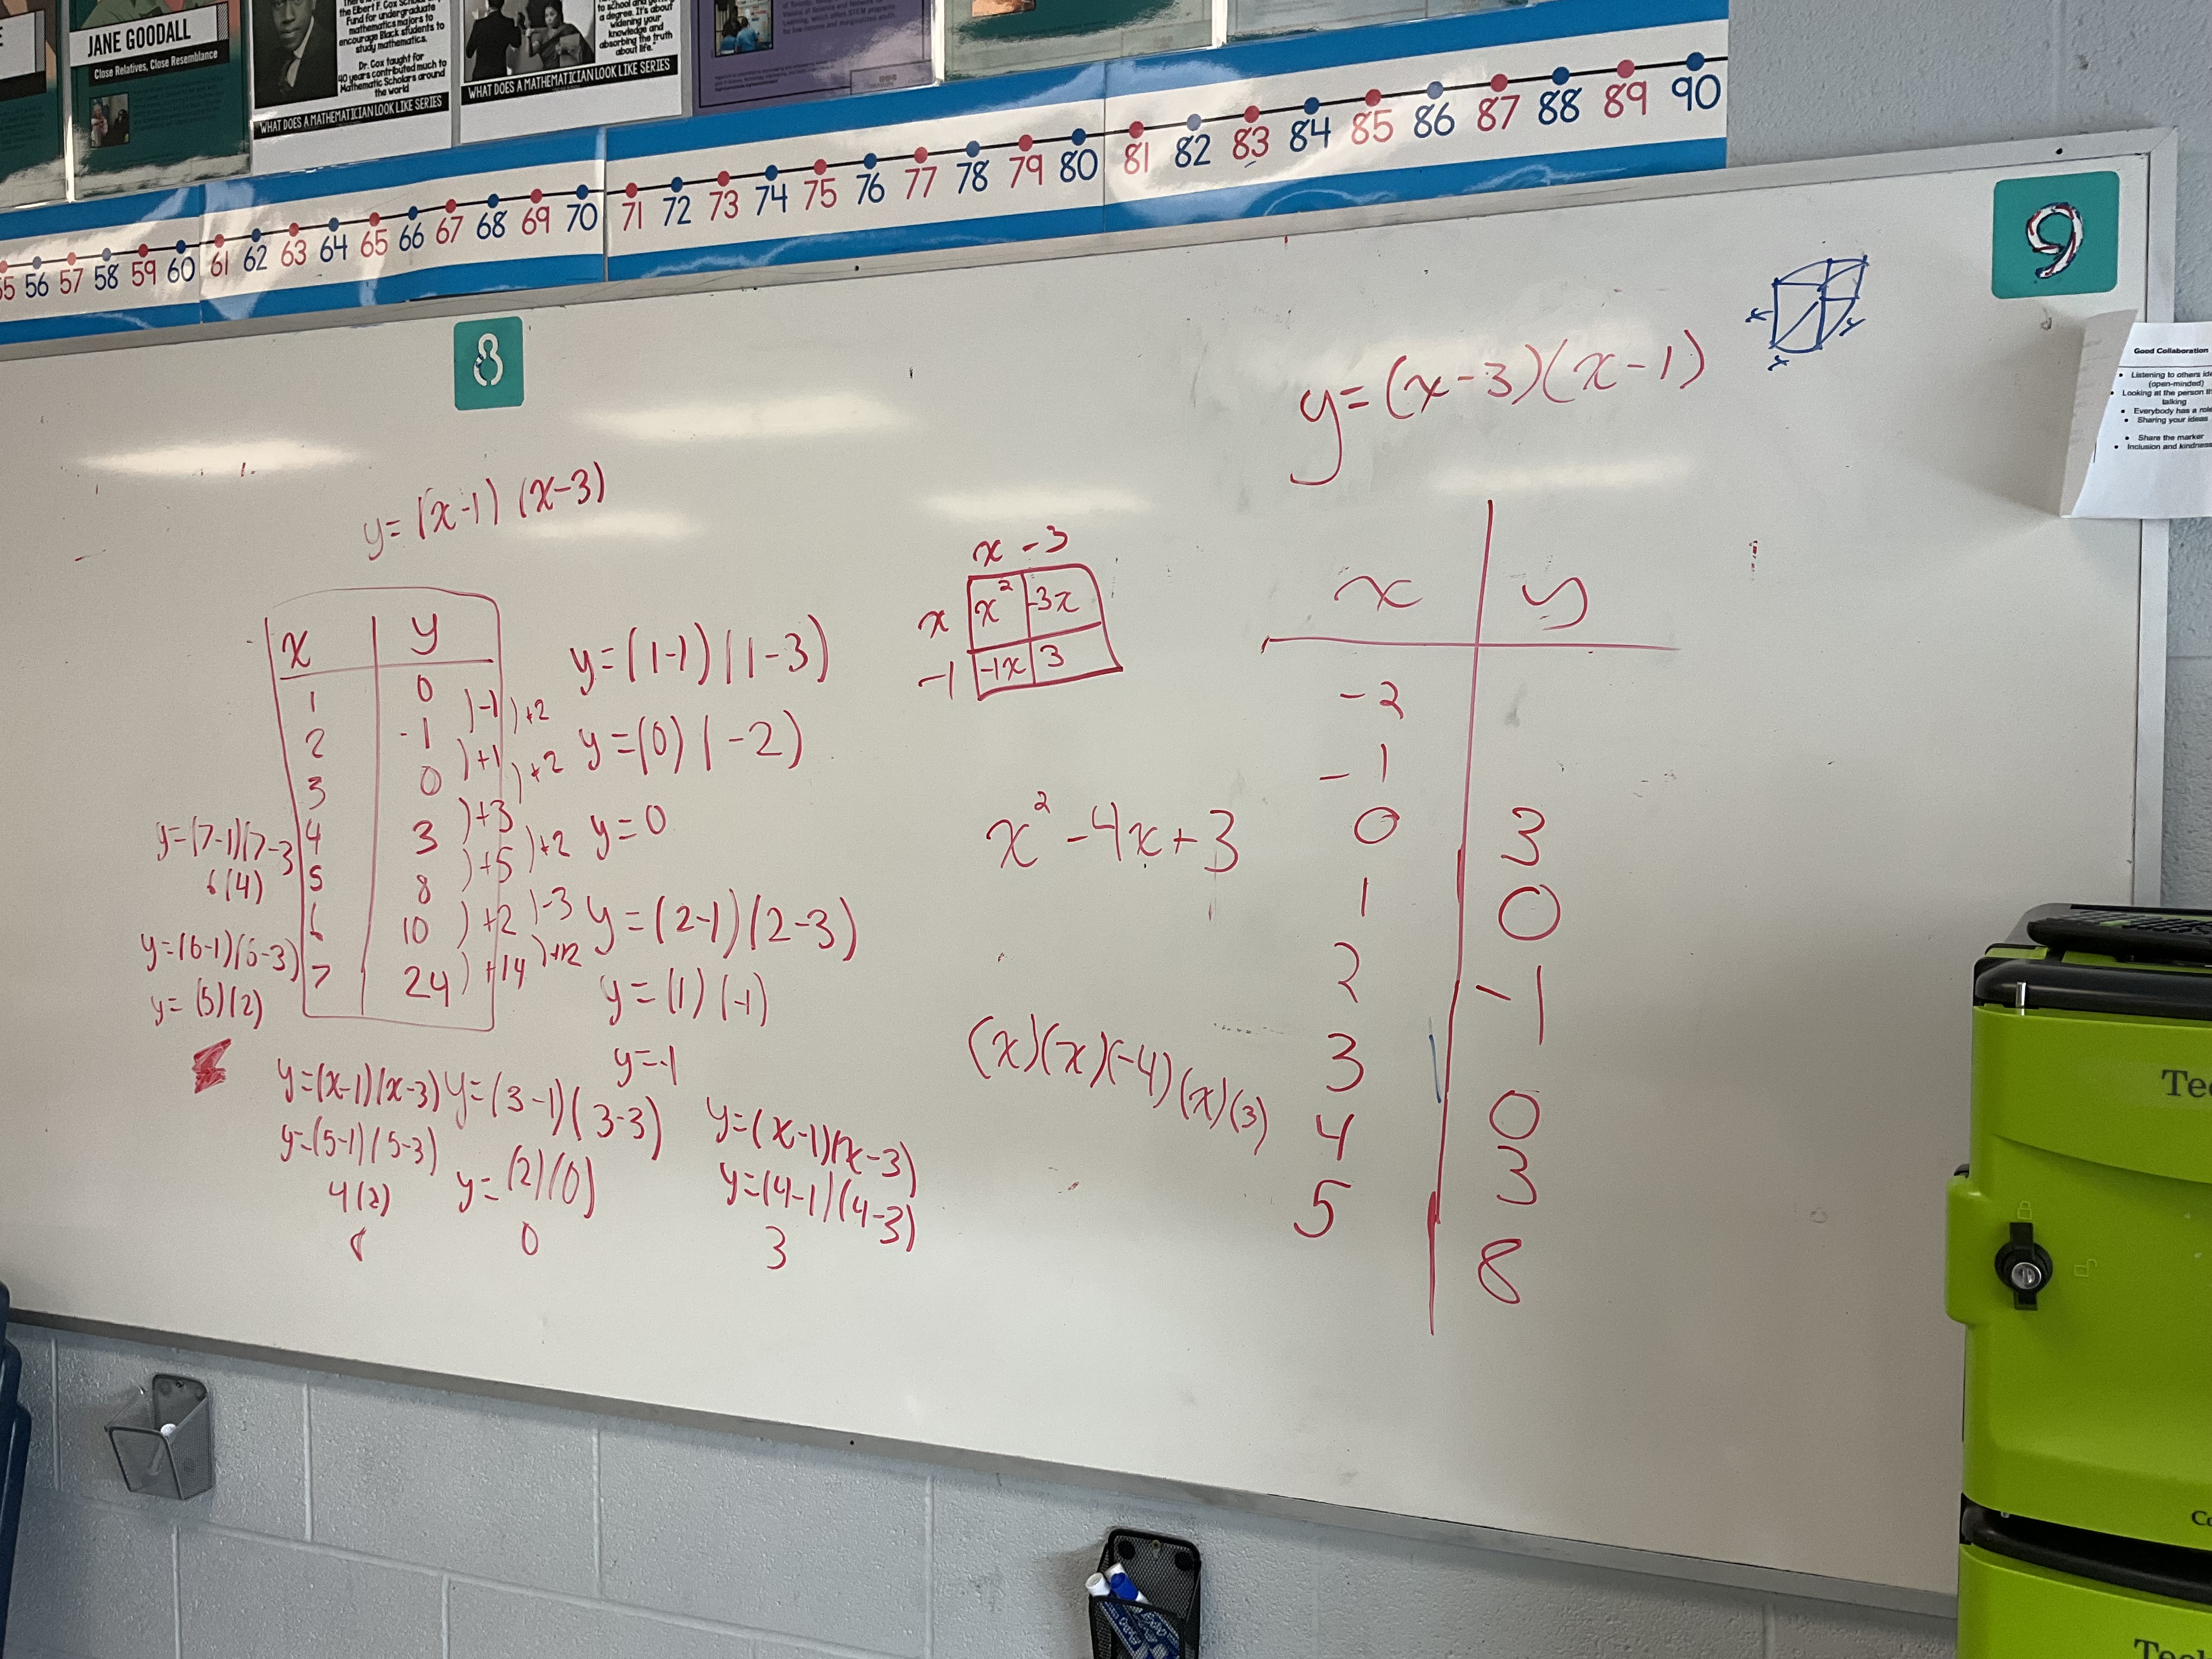
We looked for patterns in the tables of values, noticing that the 2nd differences are the same, and also that there is symmetry in the y values.
We graphed another one: y=(x+2)(x+4) and noticed some interesting trends when we looked at both equations and graphs.
We made the connection that the numbers in the brackets are related to the x intercepts, and that the low point is always in between the x intercepts, exactly in the middle.
We looked at how the x intercept values make zero pairs with the expressions in brackets. We saw how the midpoint calculations from earlier in the course will come in handy to find the middle, between the x intercepts, and how we can substitute that value into the equation to find out where the vertex will be.

We noticed that there’s only one “u turn” in these graphs. We look forward to doing more practice with this tomorrow, and connecting our factoring skills to helping us graph parabolas.
