Patterns to Graphs
We’ve been working on building patterns in MFM2P, showing linear growth. We are comfortable with the idea that figure 0 is our constant, and that there will be a consistant change between all the subsequent figures.
Today I gave groups a pattern rule to build. We made the patterns showing figure 0, 1, 2, 3, 4. Once that was done, we lined up all the blocks in figure 0 along the y axis of our graph. We’re using 1 inch tiles and 1 inch graph paper so that the squares line up perfectly with the grid. We make figure 0 into a stack, and then put a dot on the top left corner of the stack. We do the same thing for figure 1, making a stack right next to figure 0 and then adding a dot at the top left.
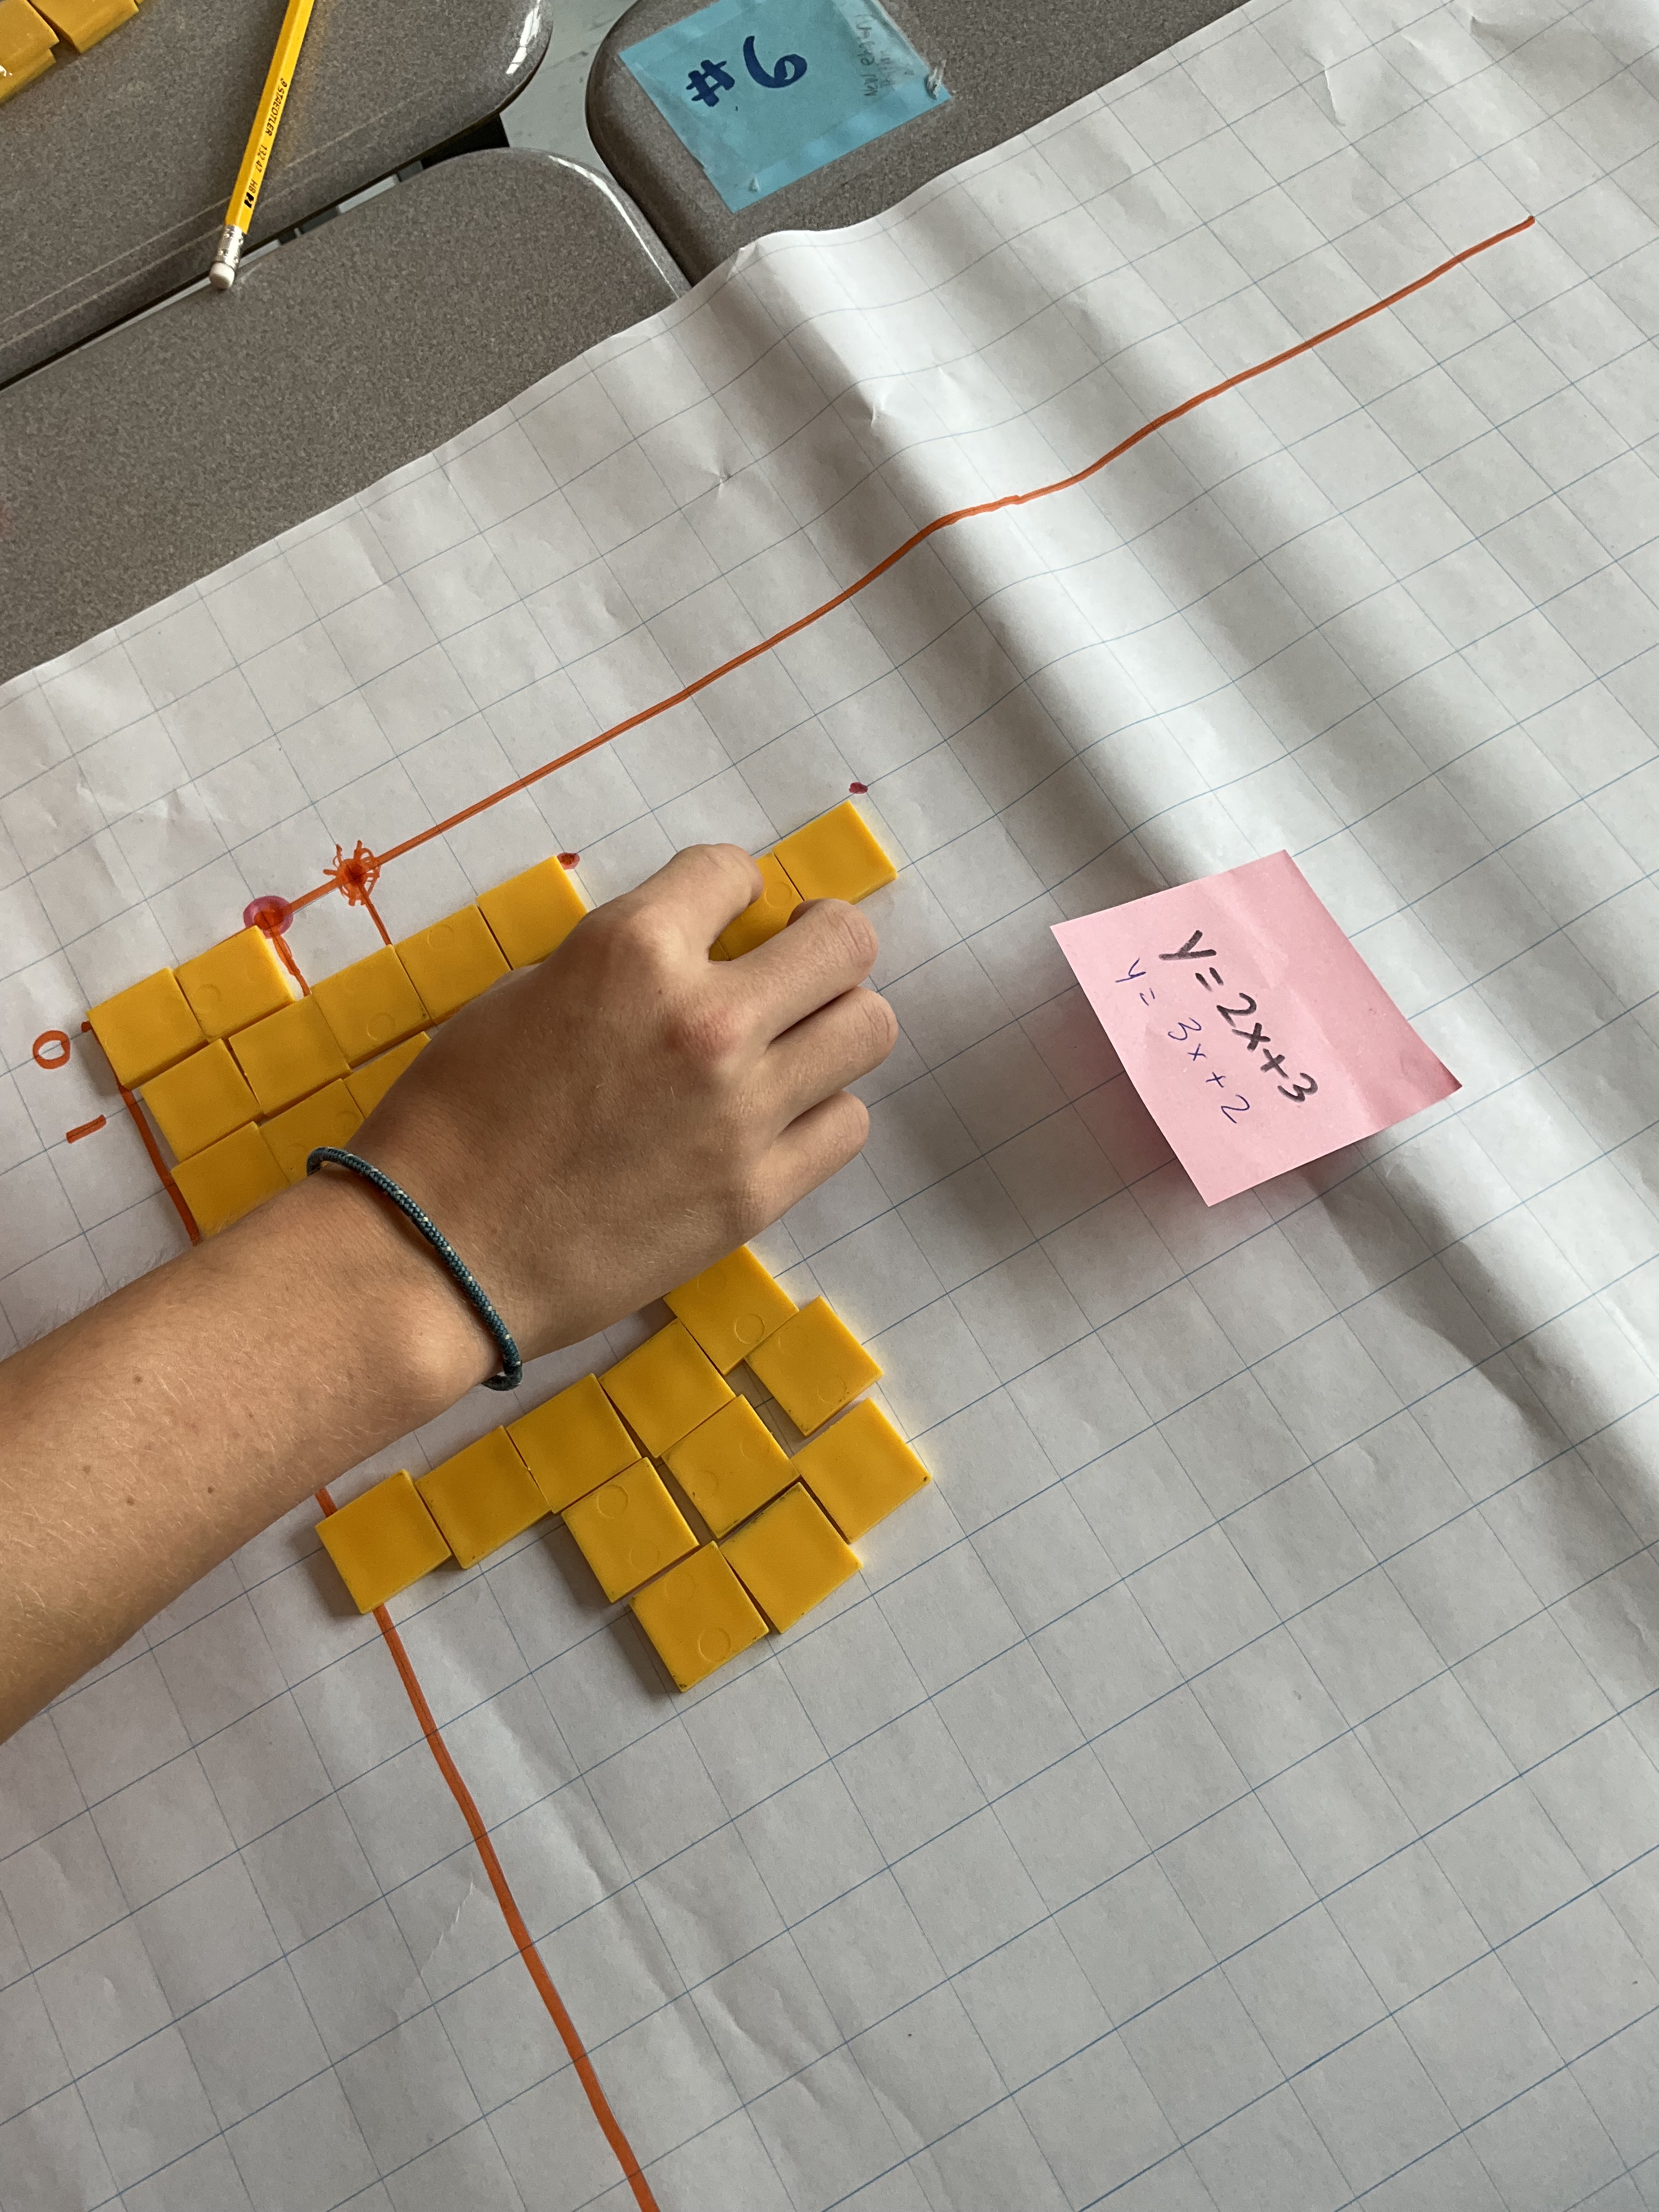
We changed colours of markers and then did the same thing for a new pattern rule, with a goal of superimposing the graphs to compare the lines. This instruction was a bit complicated for some groups to follow, but we all got 2 graphs drawn in the period, and learned a bit about the rate and the constant while we worked.
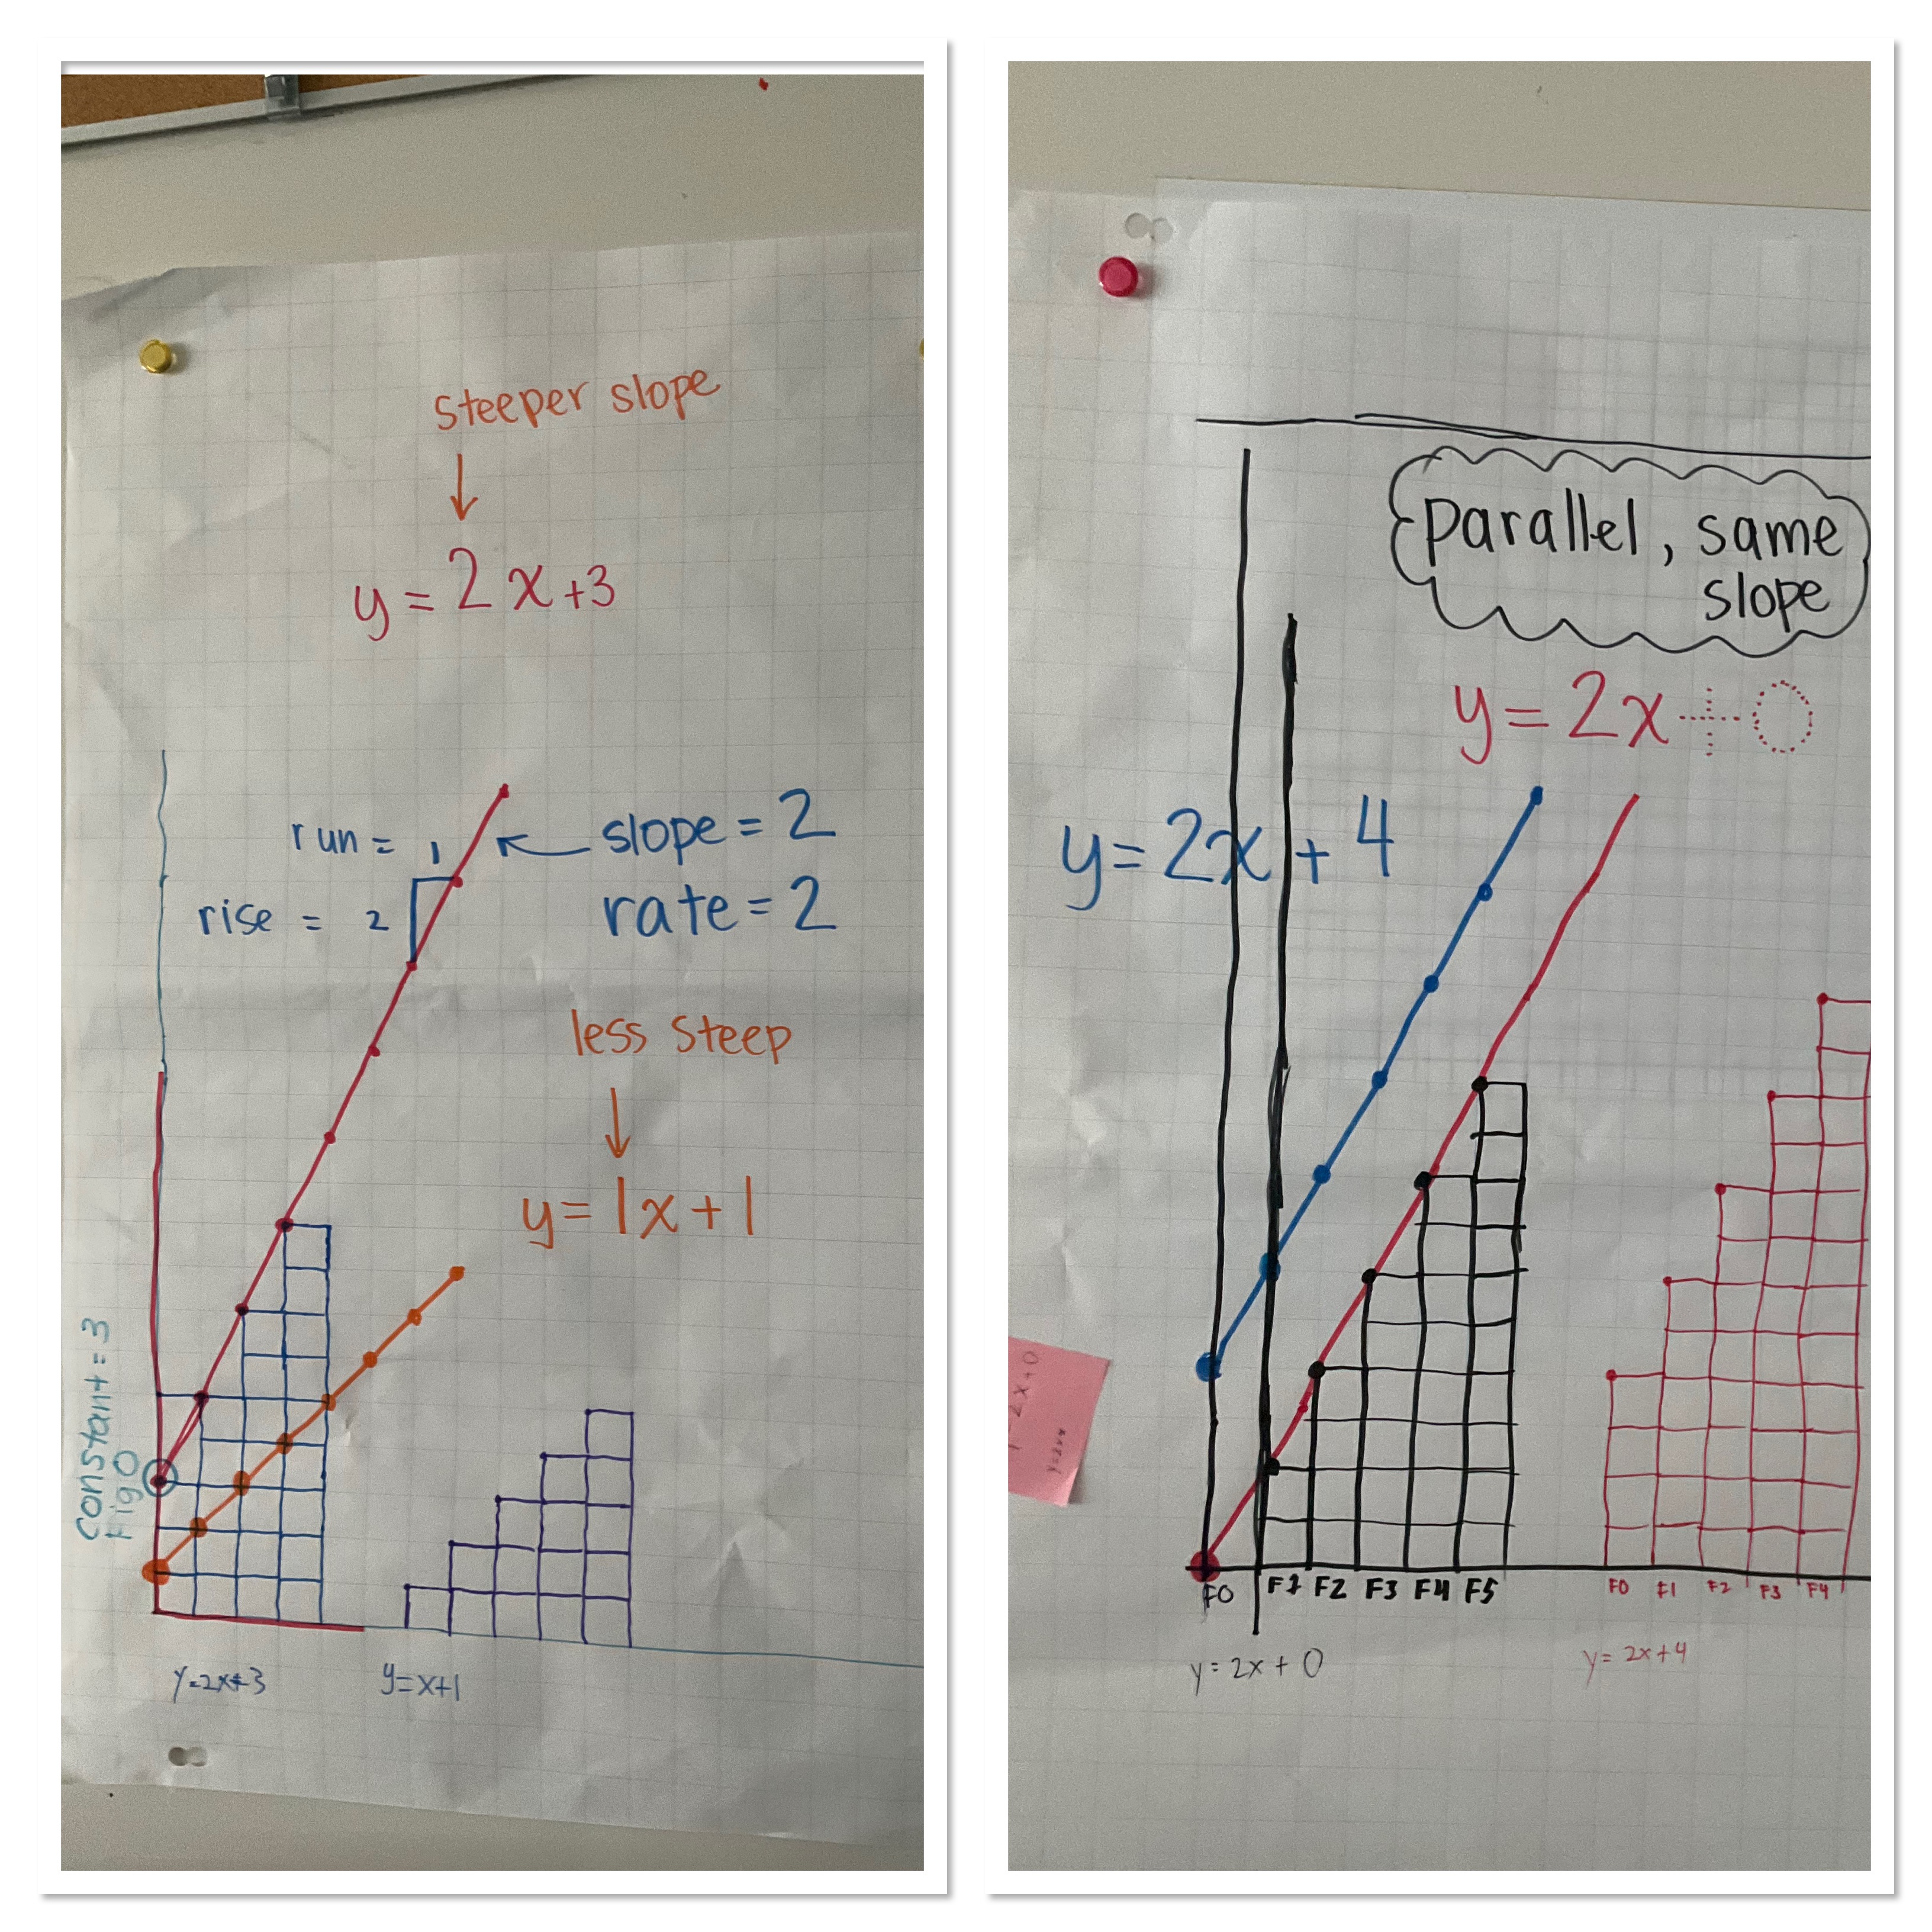
The next day we used our graphs to do consolidation. I helped with the superimposition of the graphs, sliding one graph onto the next. We then compared slopes, talked about steepness.
We talked about what negative signs do, if the rate is negative, or the constant is negative. We talked about intersection points and how to show that a point is on both lines.

We looked at making a lot of parallel lines. We repeated a lot of times that parallel means “same slope”. We noticed that we don’t have to write +0 at the end of the equation when the constant is 0. These 2 lines cross at the origin (0,0).

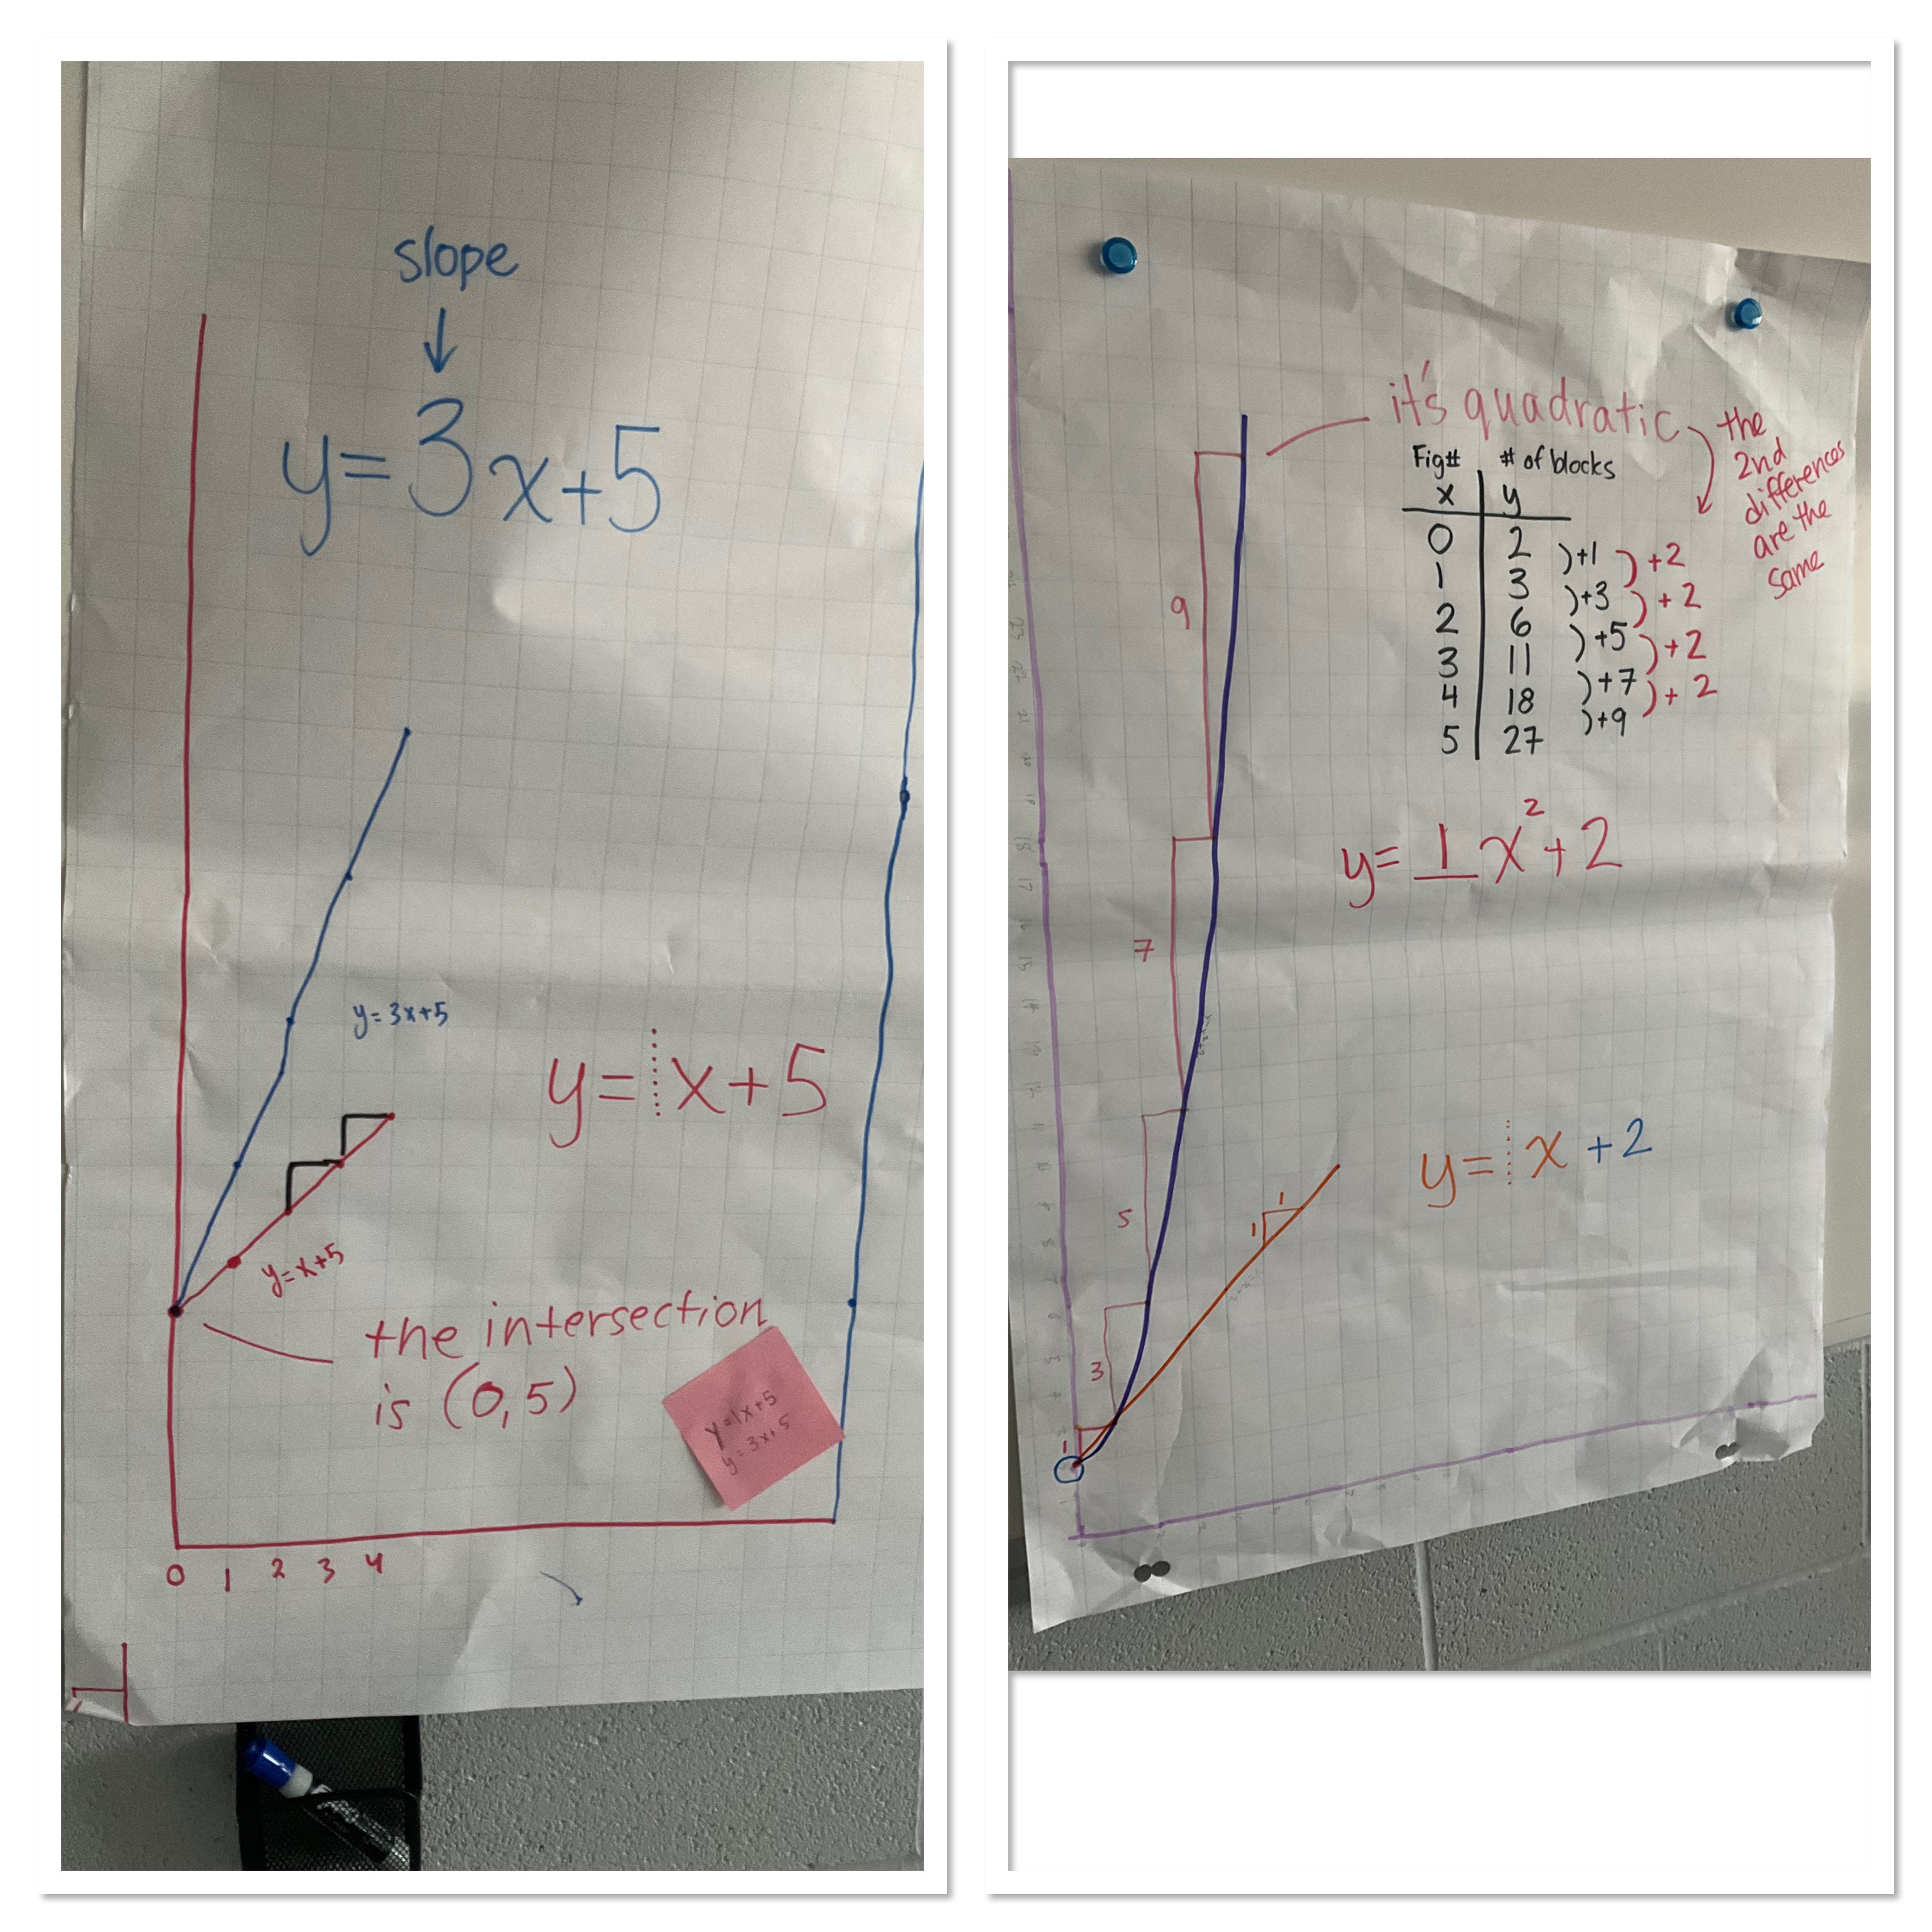
We noticed that if the constant is the same for 2 lines it will be the point of intersection. We also noticed how we could do the same task but with quadratic relationships. Here there are 2 intersection points between a line and a parabola.
By the end of the 2nd day we are getting really confident with out graphing skills.
