Correlations, and beans?
My grade 9s really wanted a “fun friday” today, so we did an activity involving everyone getting up, mixing mingling and taking off their shoes. It ended up with a nostalgic discussion that was all about beans. A memorable day for all!
The goal of the lesson was to make a scatter plot and talk about correlation, and to show how google sheets can be used to make a graph and see a trend-line and an r squared value, and then be used to make predictions.
We taped ikea rulers to the wall, then took turns being measured. We stepped on rulers and measured our foot length too. Then we made a graph to see if it’s true that you can guess someone’s height by looking at their shoe size.
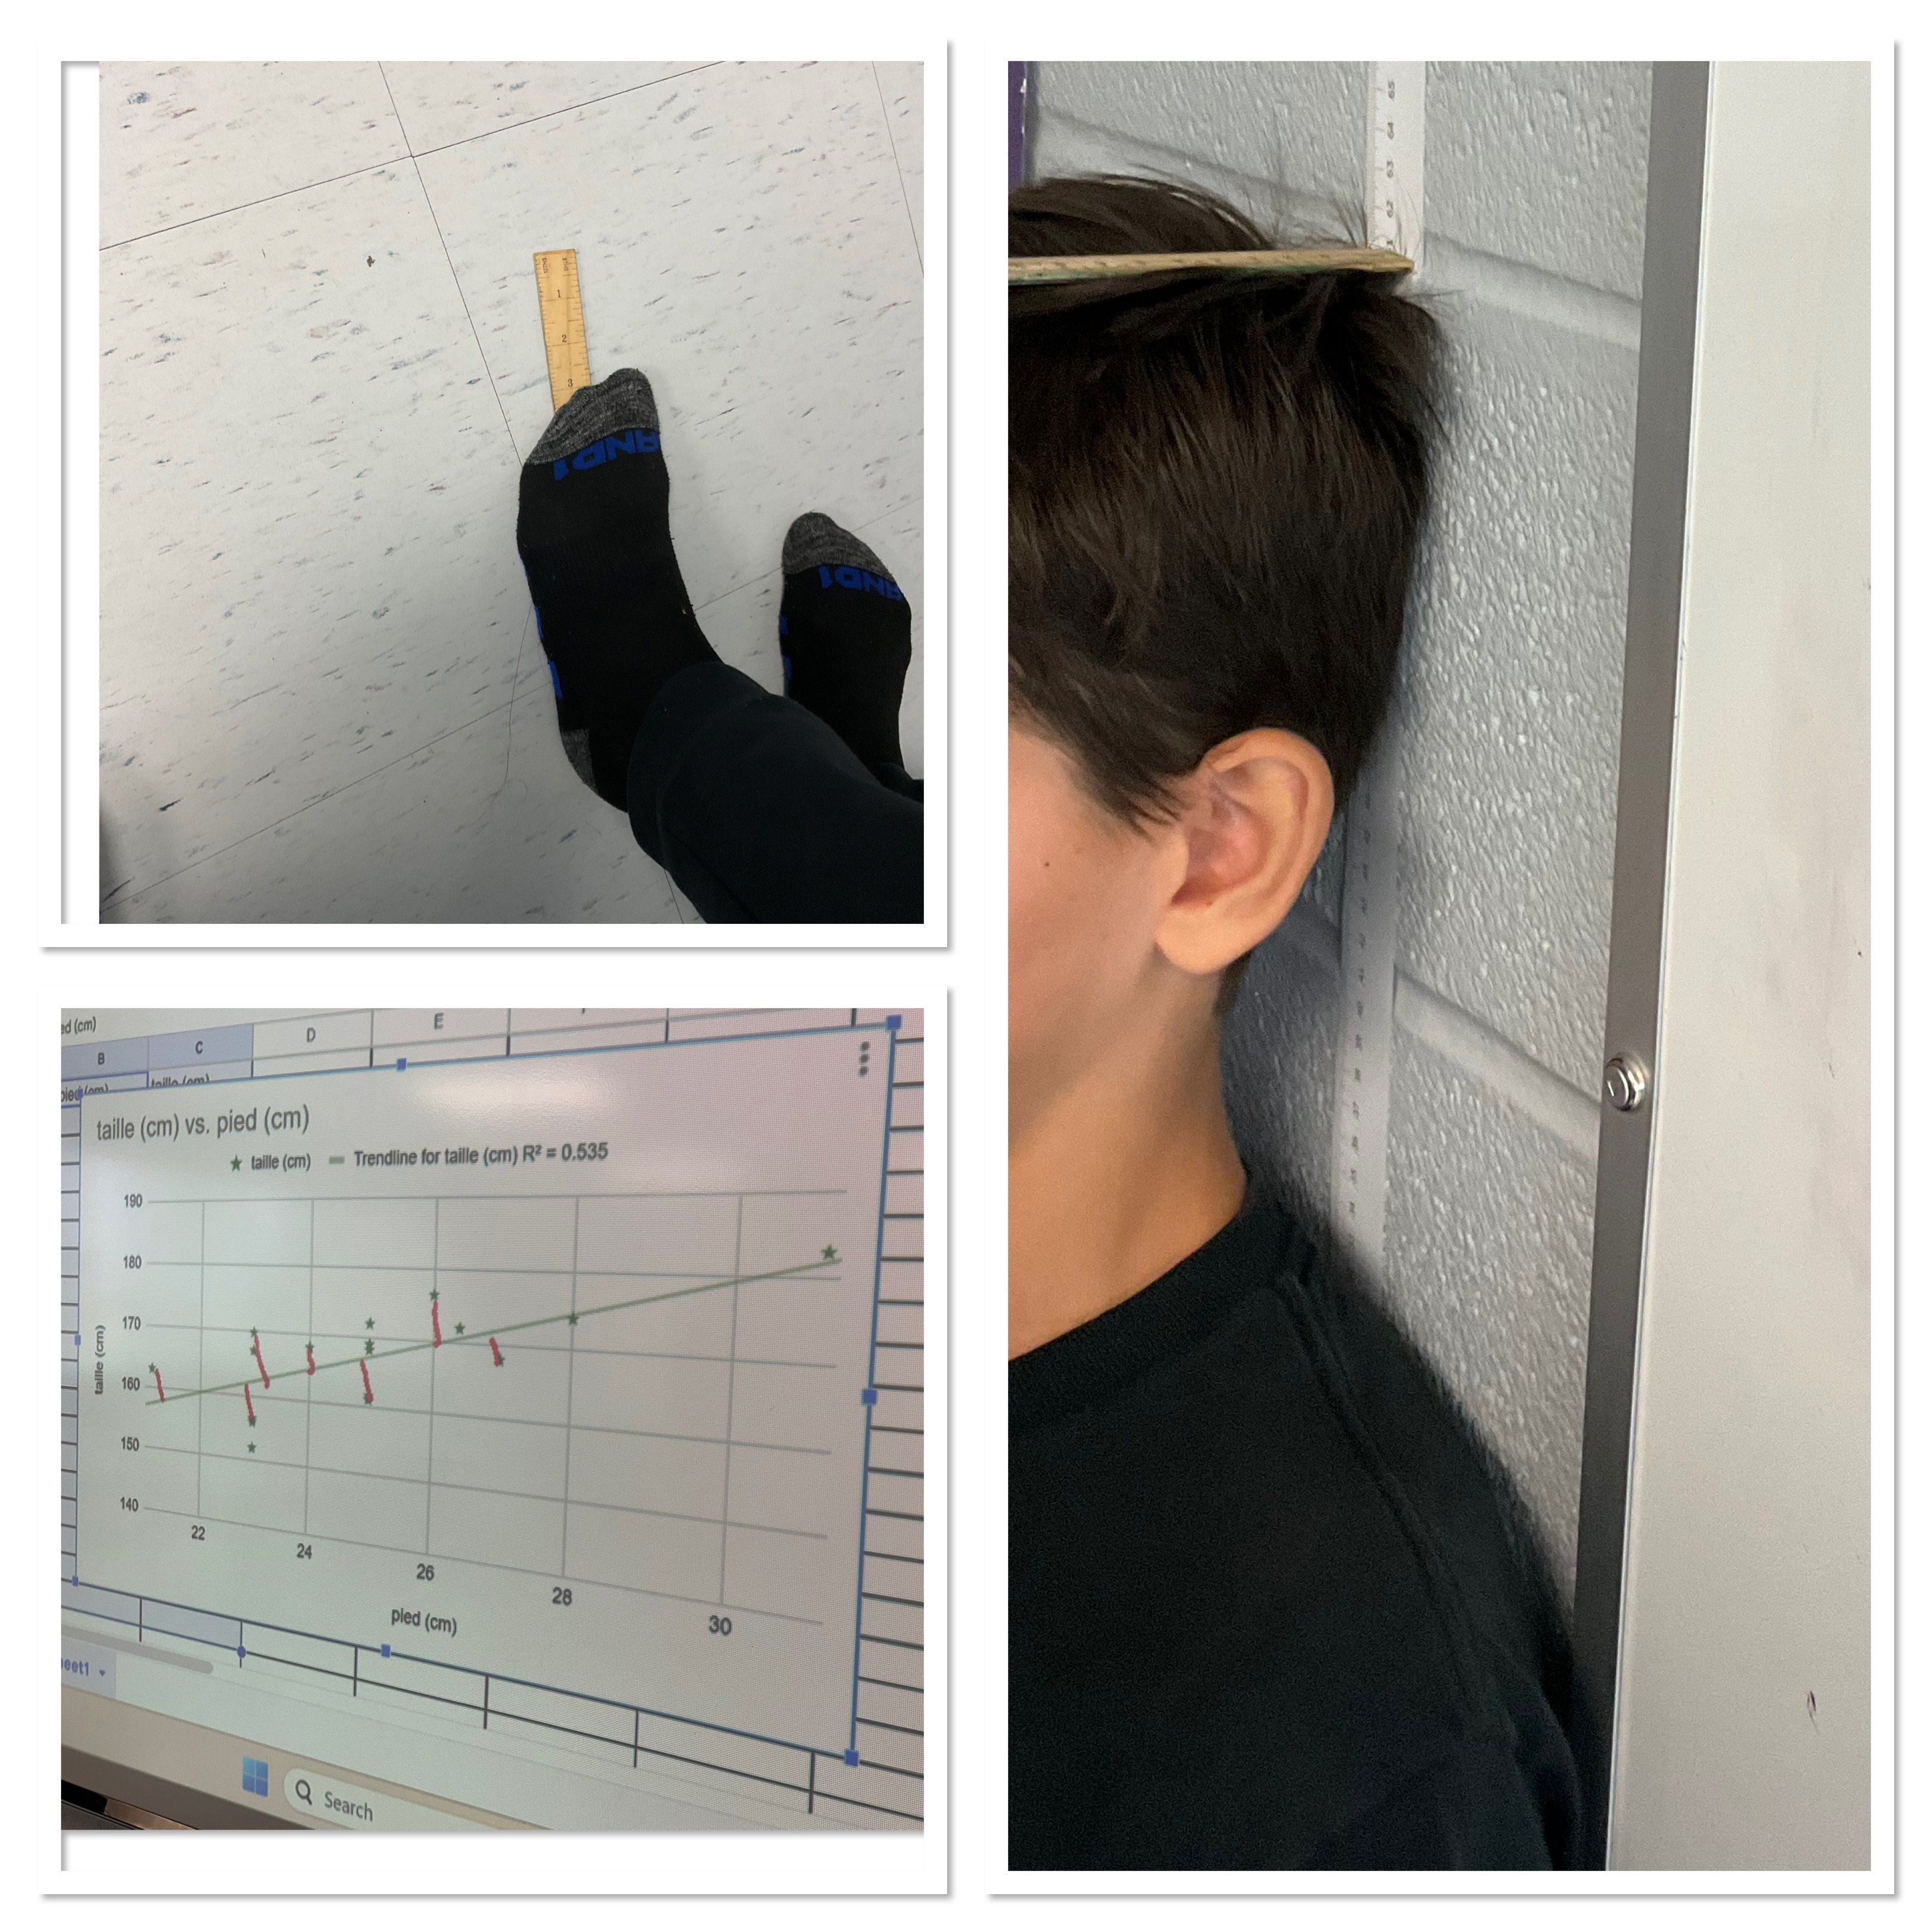
In our class the trend is pretty weak. The r squared value is 0.53, but we can see that height correlates a bit to foot length. The larger the foot the taller the person, in general, but we wouldn’t be very confident in the height of someone if we just saw a foot print.
We talked a bit about how this graph really only represents grade 9s, and with a small class, and some absences, it is not even a really good sample of the whole grade 9 population. We noted that grade 9s are in the middle of growth spurts, and that this likely does not represent what a graph of adult height and foot length would be.
We discussed vocabulary about trends (postivie/negative, strong/weak, linear/non-linear) and we made lines of best fit by hand, and with technology on google sheets. The final step was to chat about making predictions using our trend-line, and how some predictions are interpolation (inside the data) and some are extrapolation (outside the data).
I then told the class a story about when we were back at kcvi and had deep windowsills. My classes used to take advantage and grow beans on the windowsills. We’d turn it into quite a project. We used the dry beans to explore counting, and then we germinated the beans in paper towel and water in a baggie for a few days. We looked at the fraction that germinated and the fraction that rotted.
we planted the beans in small paper cups and cared for them as they sprouted above the soil. The plants were measured daily, and data tracked in a table. We grew kidney beans and black eyed peas, and compared their growth over the first week or so that they sprouted above the soil.
Next step was to graph the bean data in scatter plots, we could compare growth rates of different types of beans and make predictions from the data about the height of the bean at the end of a month of growing.
The trick is that the beans start off with quite a linear trend for the first week, with a very different growth rate between kidney beans and black eyed peas. These plants do NOT maintain their linear growth though. They are bush beans which have a maximum height. Students predicted bean plants that would be about a meter tall after a month of growing, but they maxed out at maybe 30cm.
By then though we were attached to our little bean garden, and we kept watering them and caring for them and many times the bean plants would flower, and then after the flower dropped off a baby bean was there, growing and producing new bean seeds inside.
After me doing some show and tell (search for beans on this site and there are lots of progress pictures), my students were disappointed in our sleek windowsills and wanted to grow beans. I happen to still have a bag of dried beans in the closet, so many went home today with some black eyed peas in their pocket and dreams of making a bean garden of their own. We’ll see if any are successful.
It ended up being a pretty fun Friday after all!
