Intro to Patterning
We started looking at patterning today and how to determine pattern rules and make graphs and tables of values from visual patterns.
we can extend a pattern in both directions to find figure 4 and also figure 0
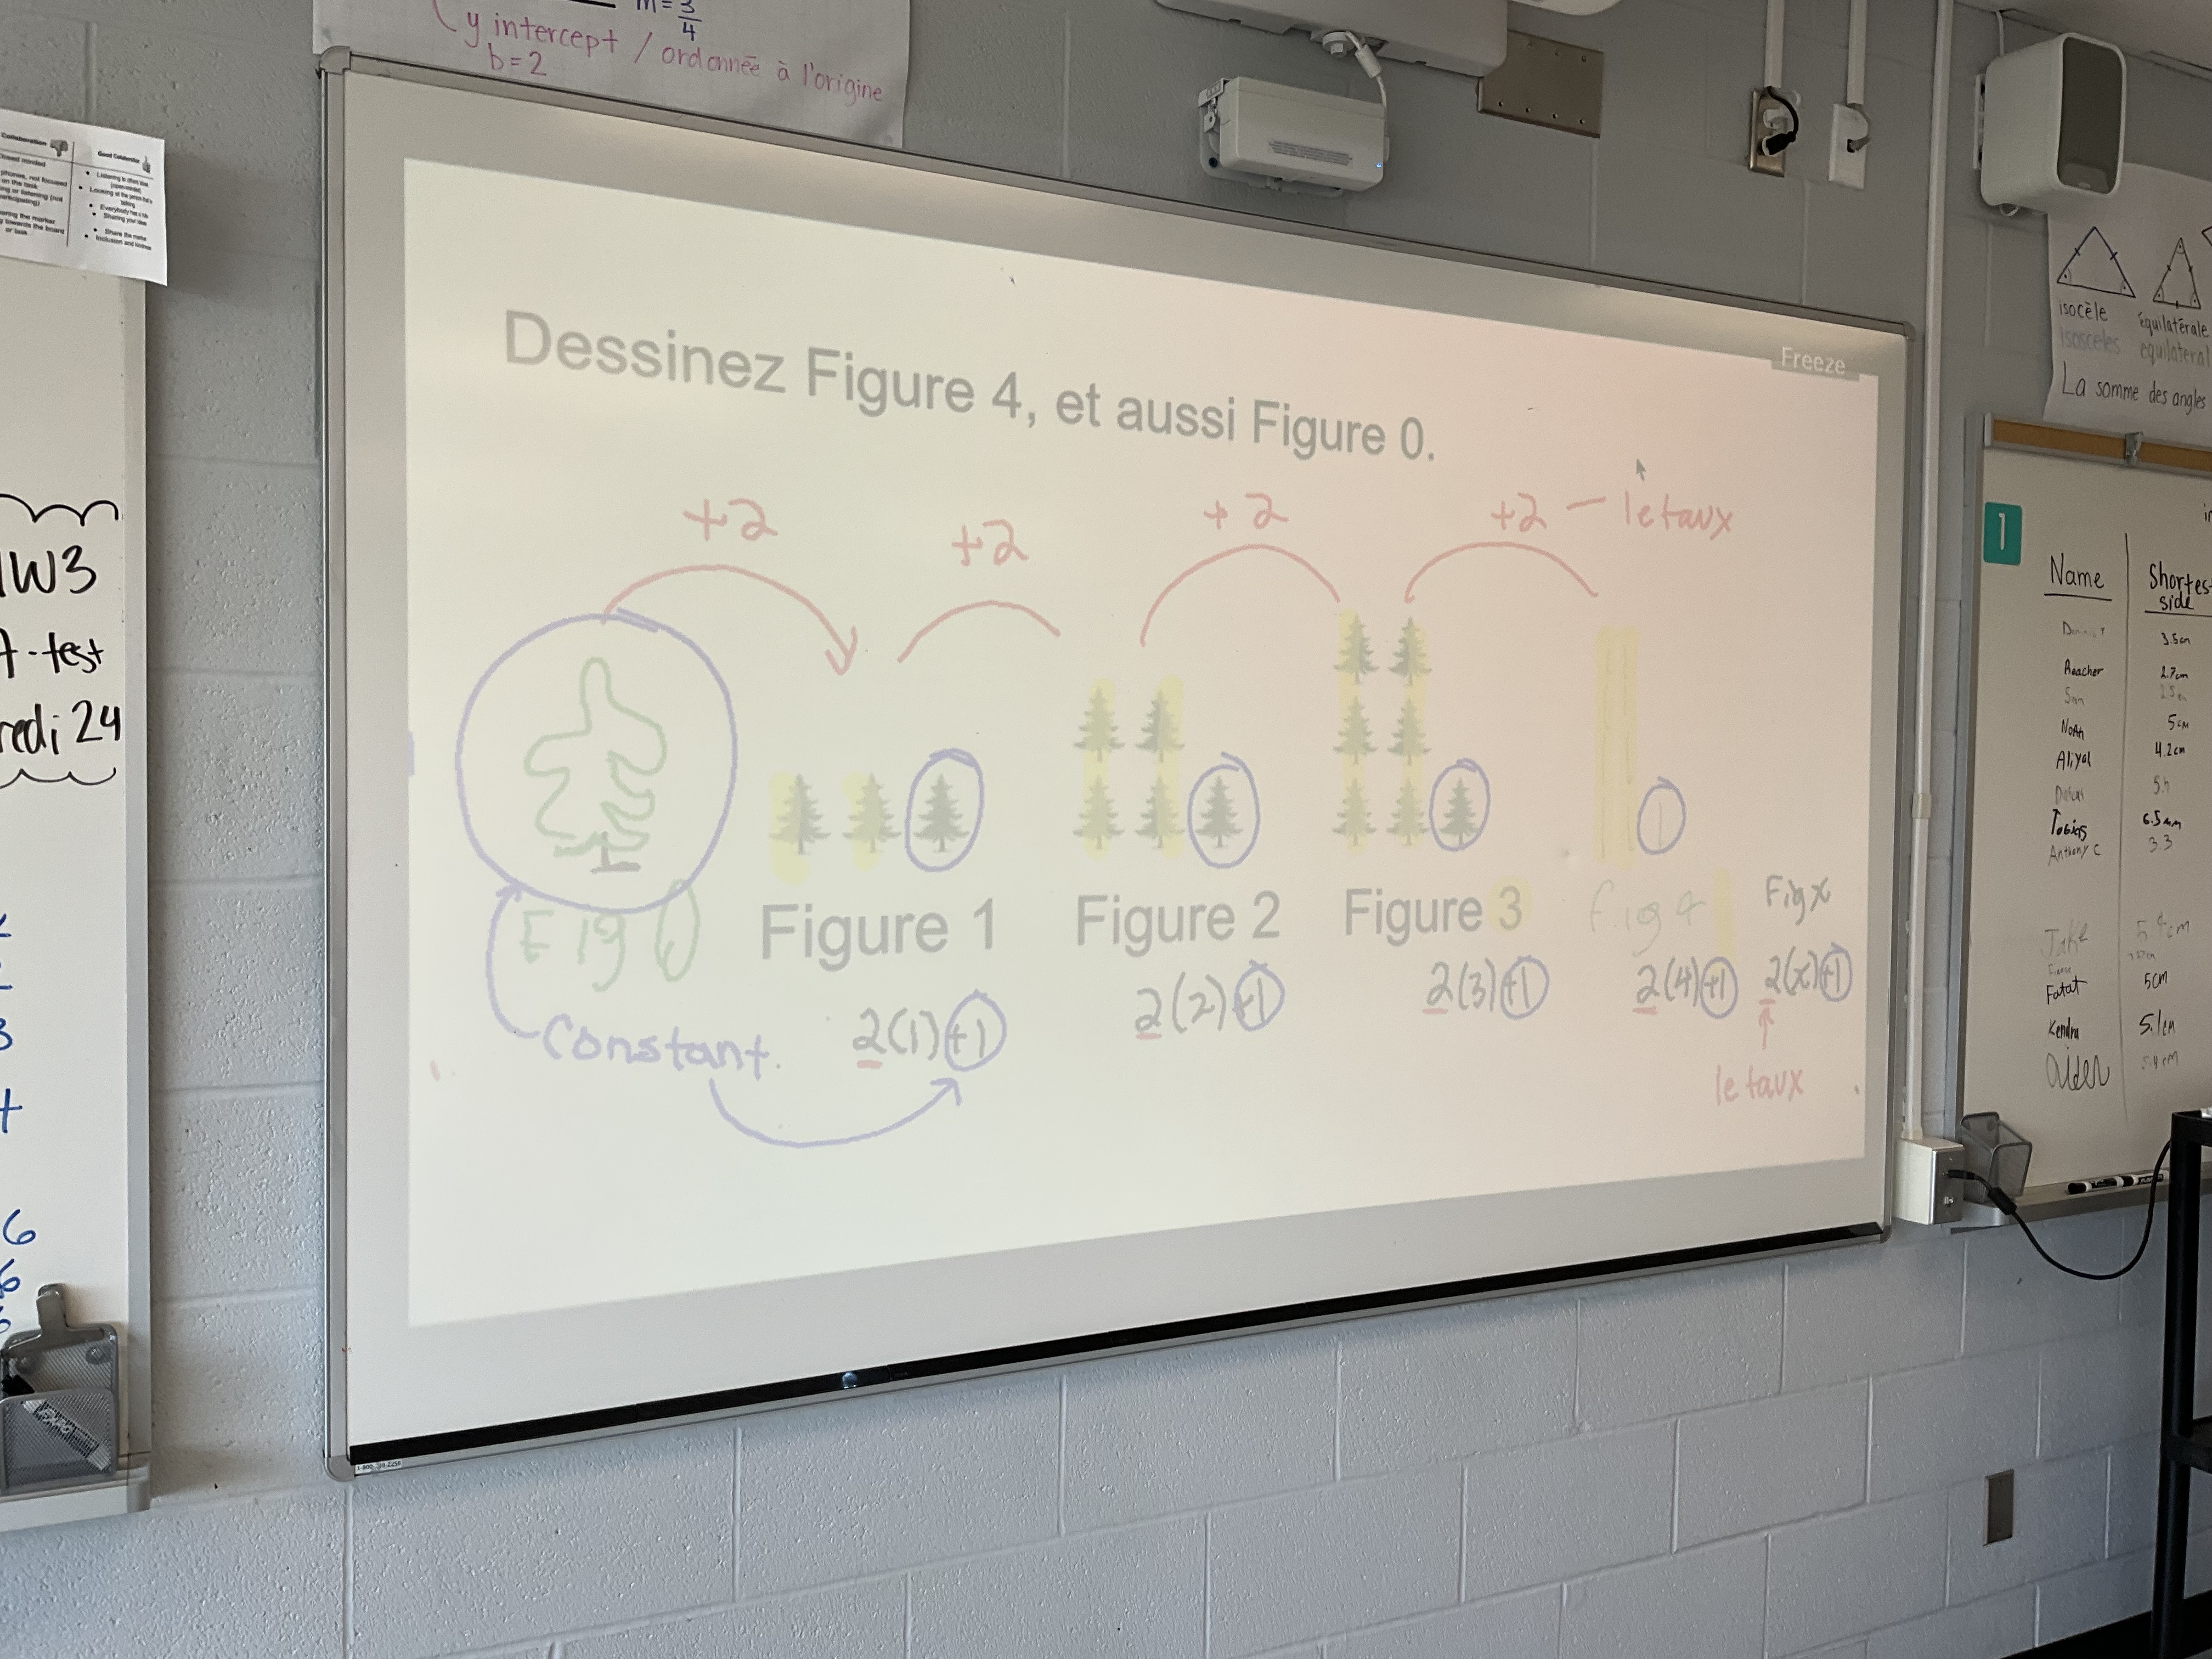
We noticed that the pattern increase is +2 each time. That can also be seen as 2 groups of the figure number in this pattern (the vertical columns of trees). We noticed that figure 0 is 1 tree. That’s the solitary tree that is alone on the left of each (circled in blue).
We thought about how to figure out how many trees are in figure 10. We know that we’d add 2 10 times, or that we’d have 2 columns of 10 trees, and then we’d have the 1 extra tree on the side. We could do that for figure 100 as well…
figure 100=2(100)+1
we can go from here to make the equation for figure x (this would be a neat time to introduce function notation…I didn’t think of it at the time though)
figure x=2(x)+1
we just replace the 100 with x and get the equation!

We put the data in a table and noticed the rate/slope and the constant (figure 0) in the table. We then put the points on the graph and noticed the slope (rise and run) and the constant (y intercept) on the graph.
We next had a challenge to build a pattern around the “figure 2” that was given
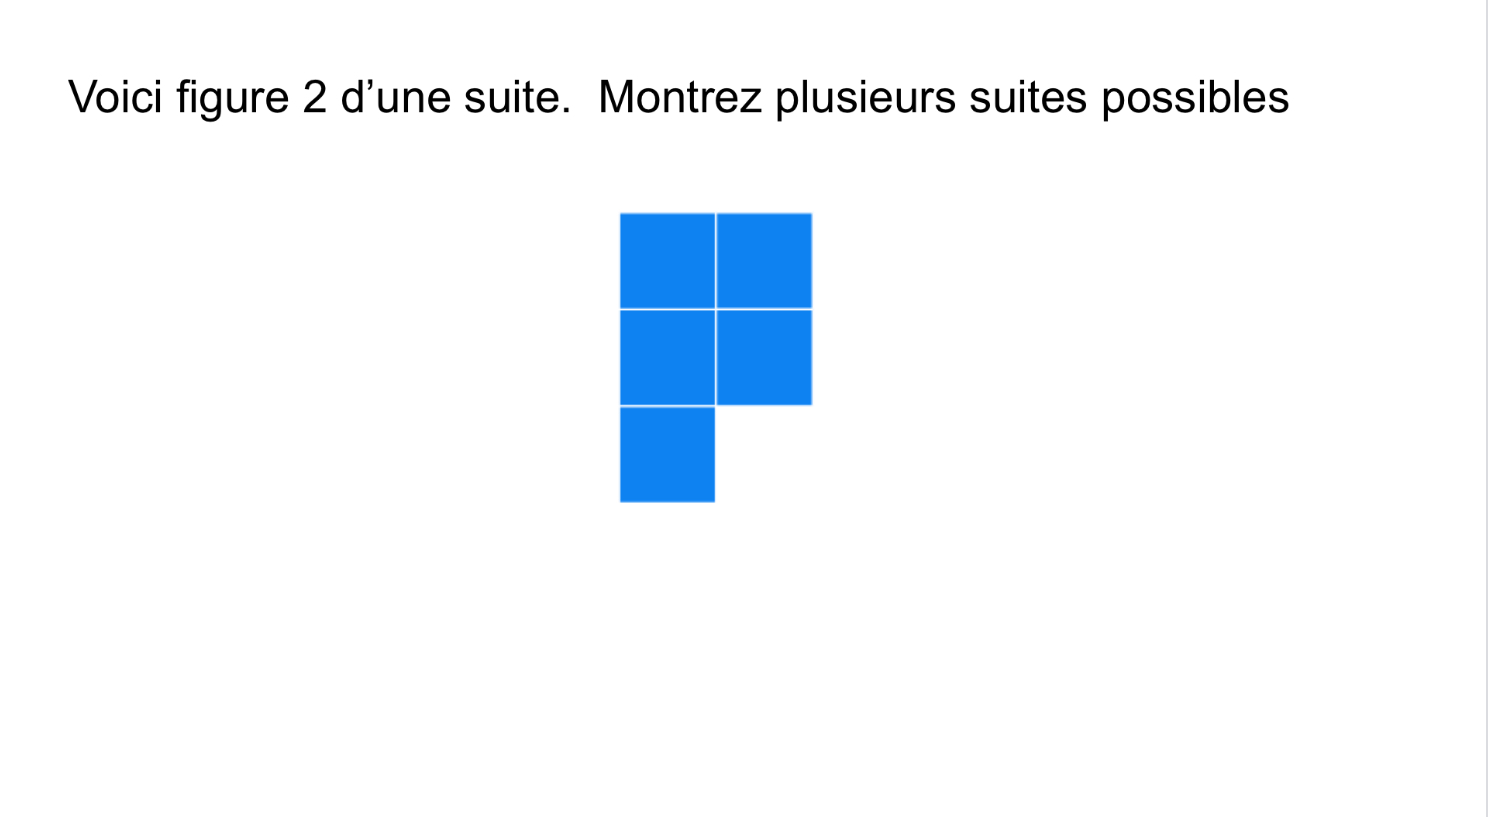
Here are some of the patterns and the analysis we did. We made the pattern rules for our classmates work. This one is y=3x-1
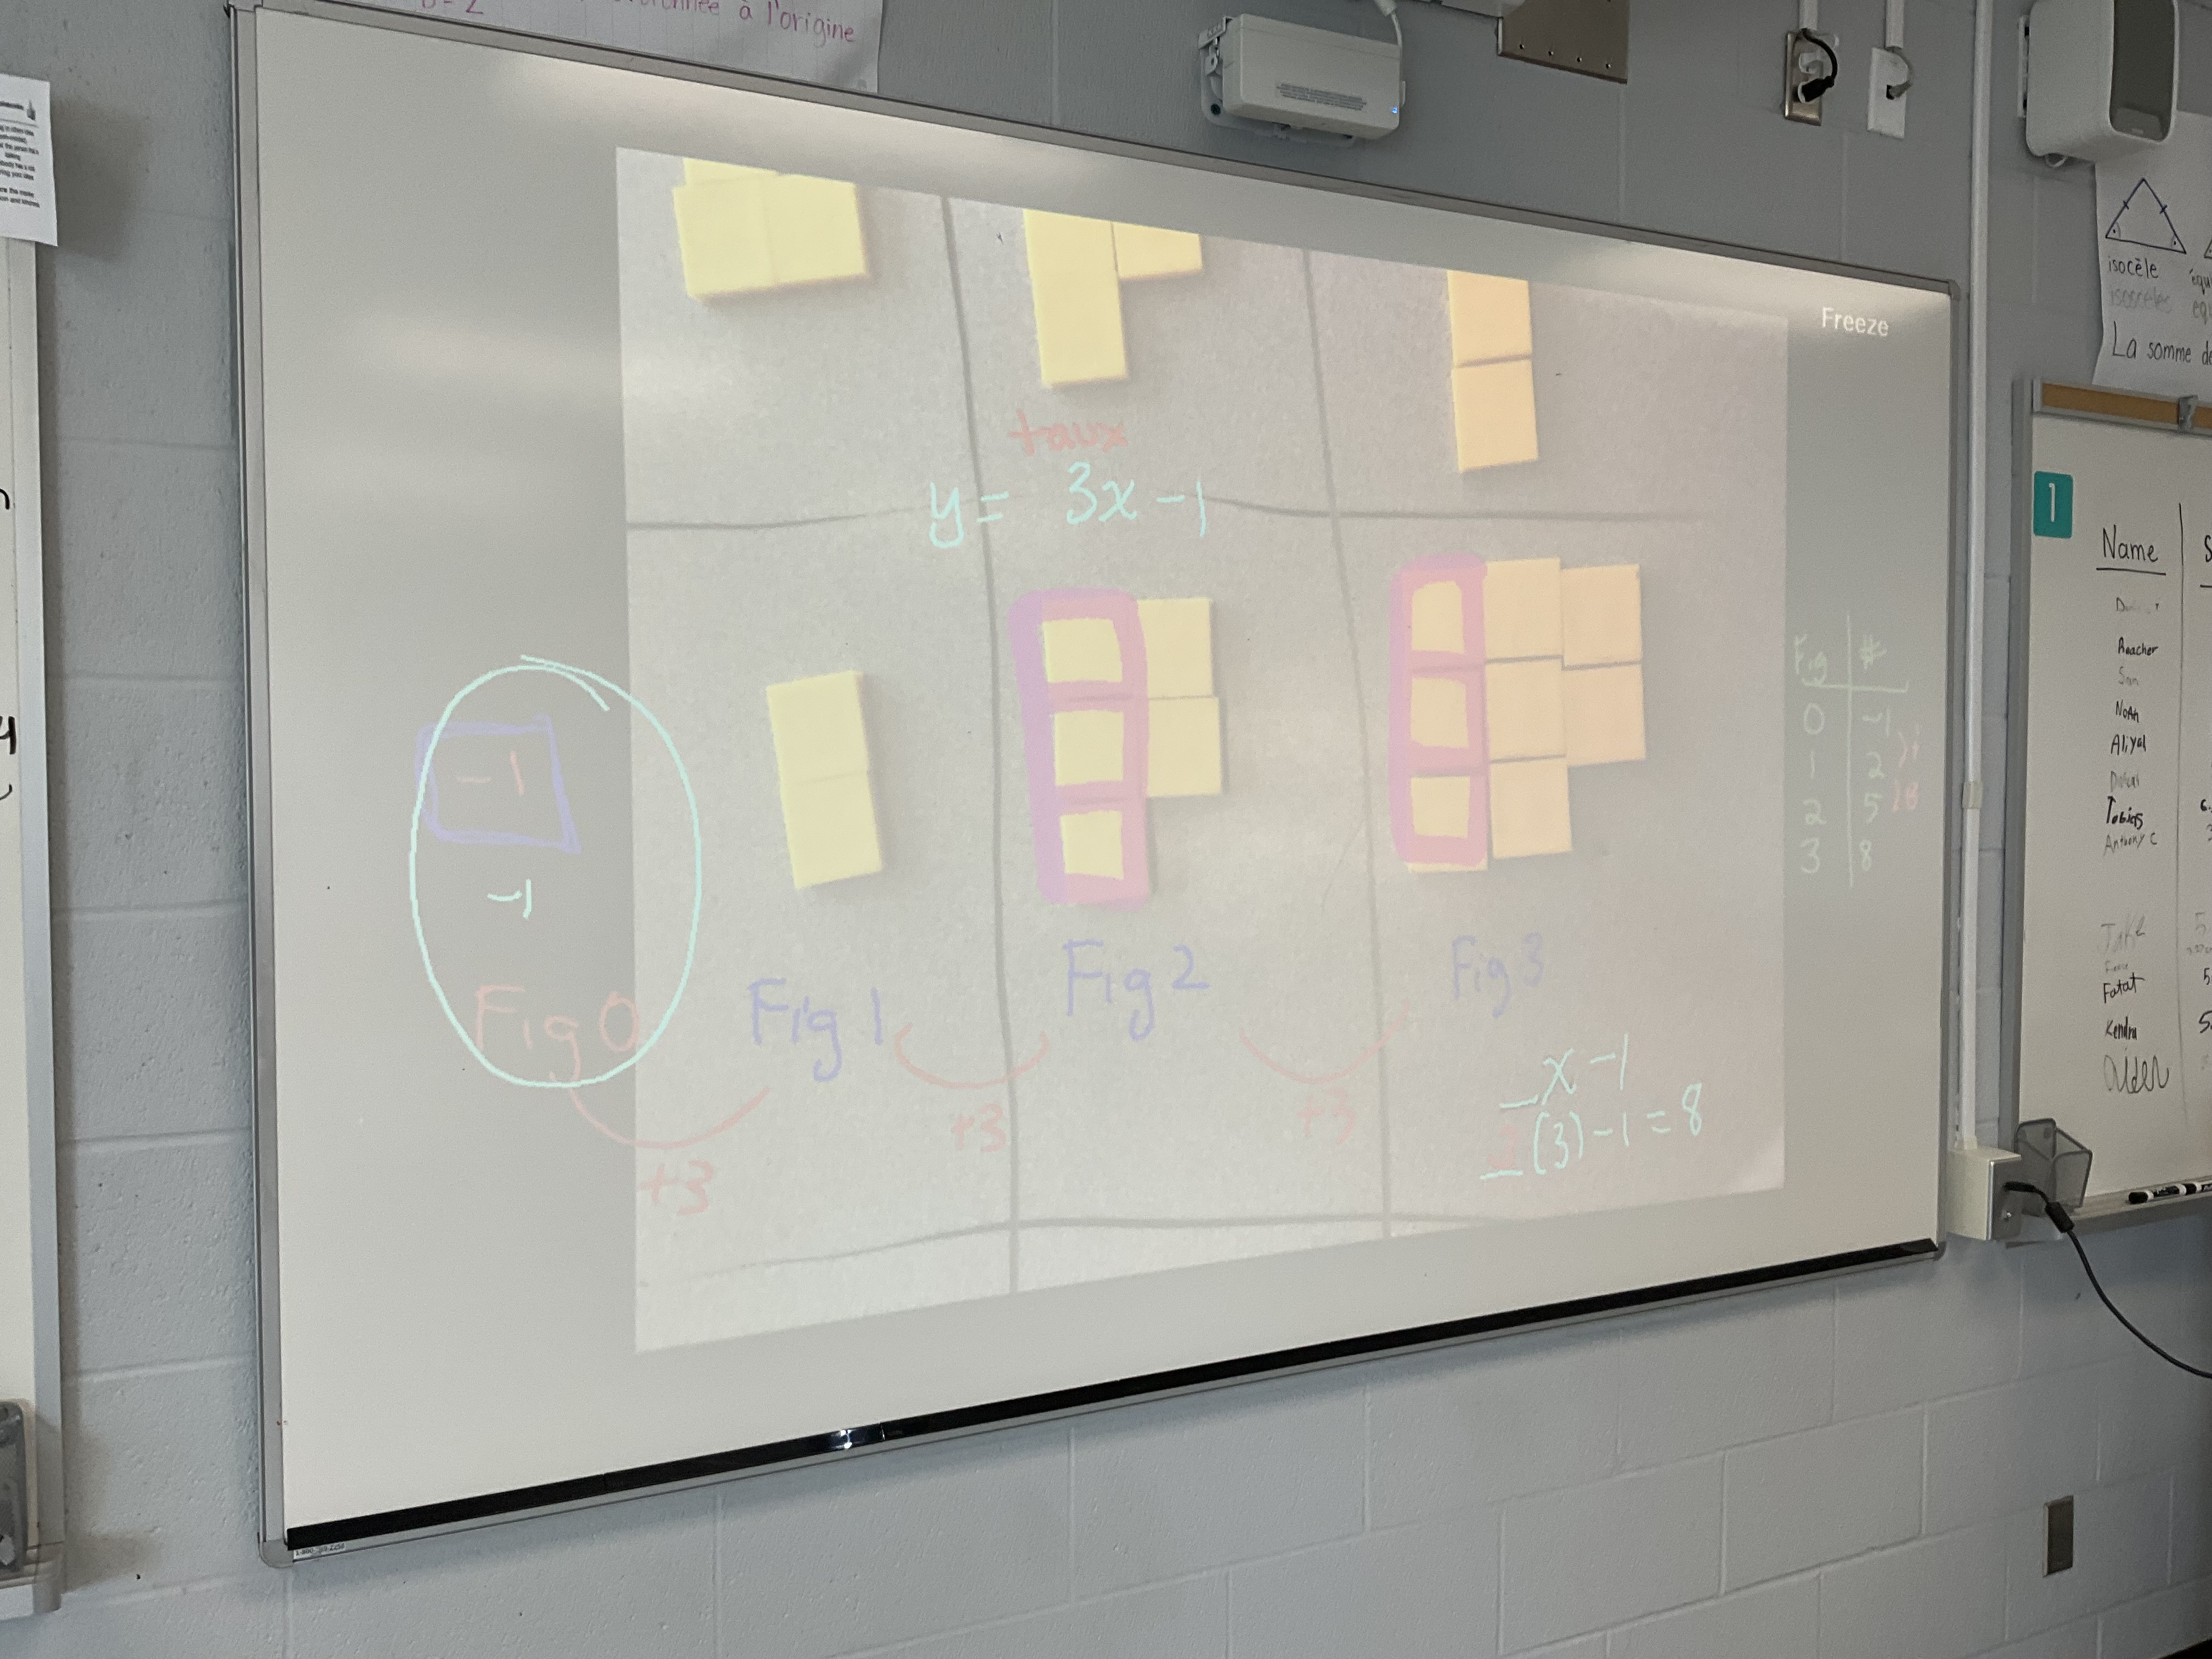
This one had an oopsie in figure -1, which we corrected, but for this one we see that the rule is y=2(x)+1

It was great to see the creativity that the class had in creating different patterns.
We had some time to try to analyse patterns on our own, and we made good progress with our new skills. We’ll keep practicing tomorrow and maybe see some non-linear patterns too.
