Graphing Lines using Visual Patterns
Today in grade 9 we started graphing lines. We used our skills in visual patterns to help us out. Each group got a pattern rule and 1 inch square tiles to build the pattern. We needed figure 0, figure 1, figure 2, figure 3, figure 4 at least.
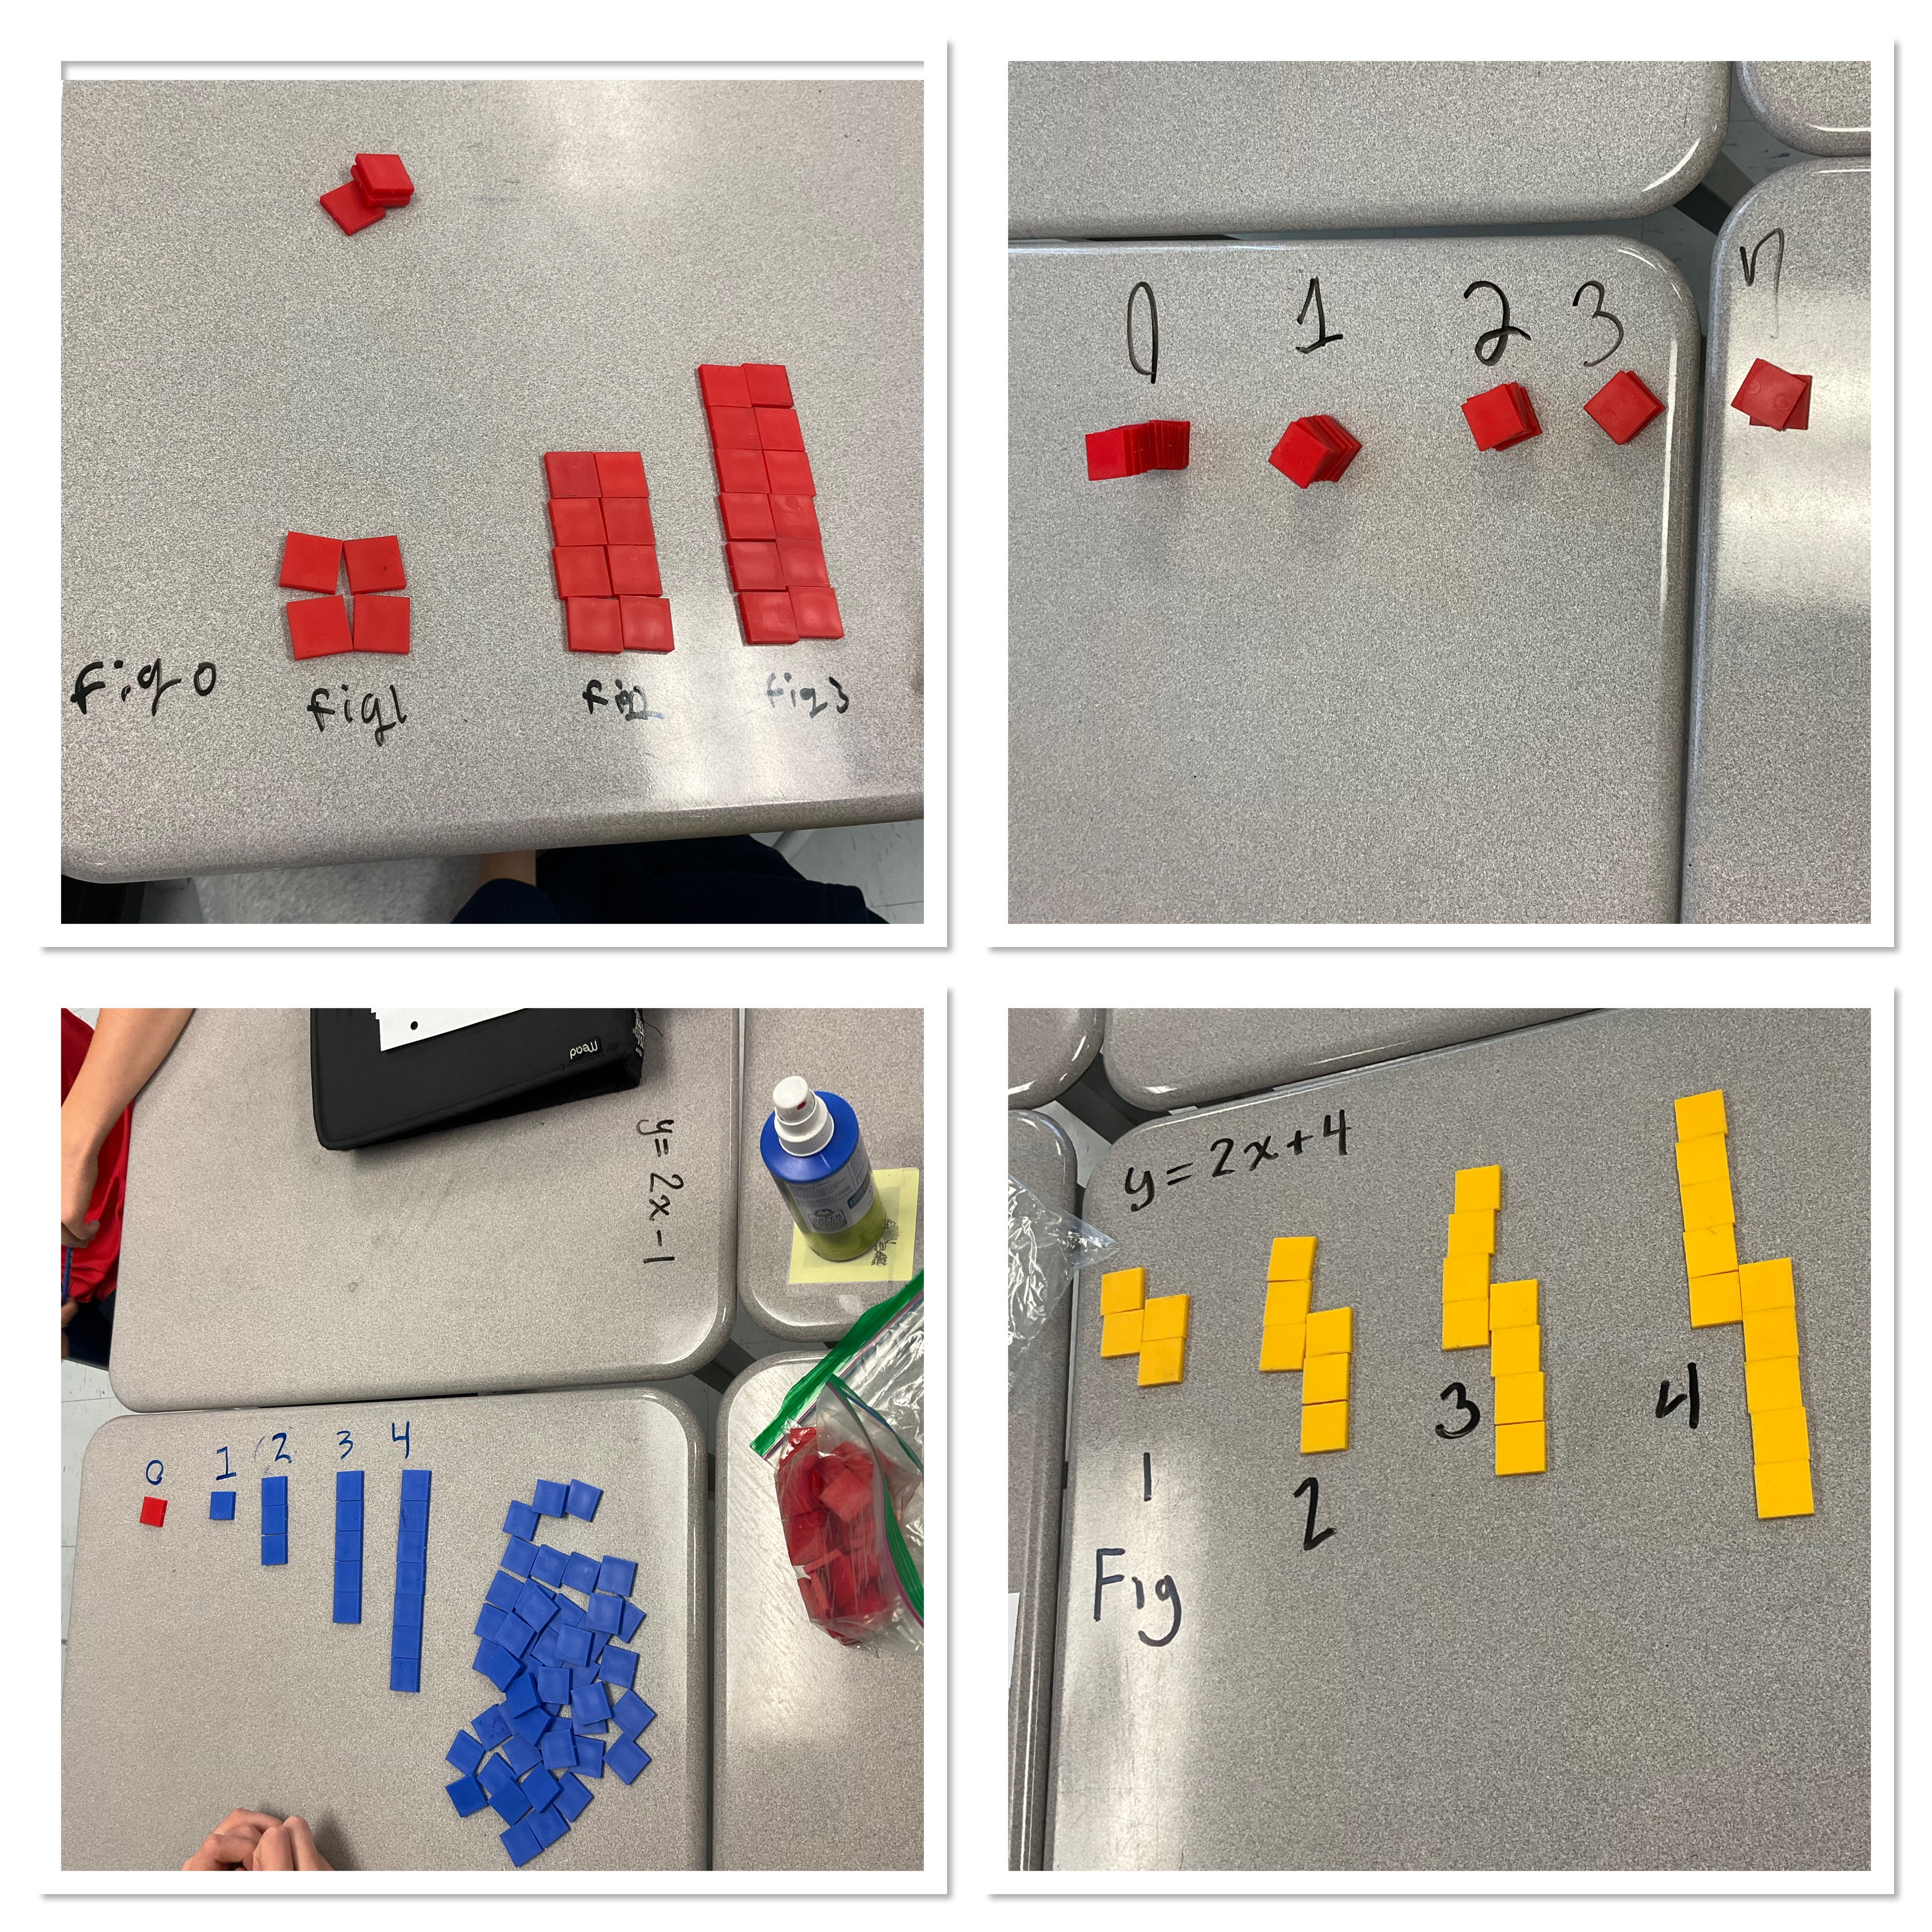
Next groups used 1” grid chart paper with x ans y axes drawn on it. They carefully moved all the tiles from figure 0 into a column on the graph paper that lined up with the y axis. They drew a dot at the top left of their column. The next figure was then dismantled and rebuilt into a column beside figure 0. A dot was placed at the top left. This was repeated until all of their figures had been moved and traced.
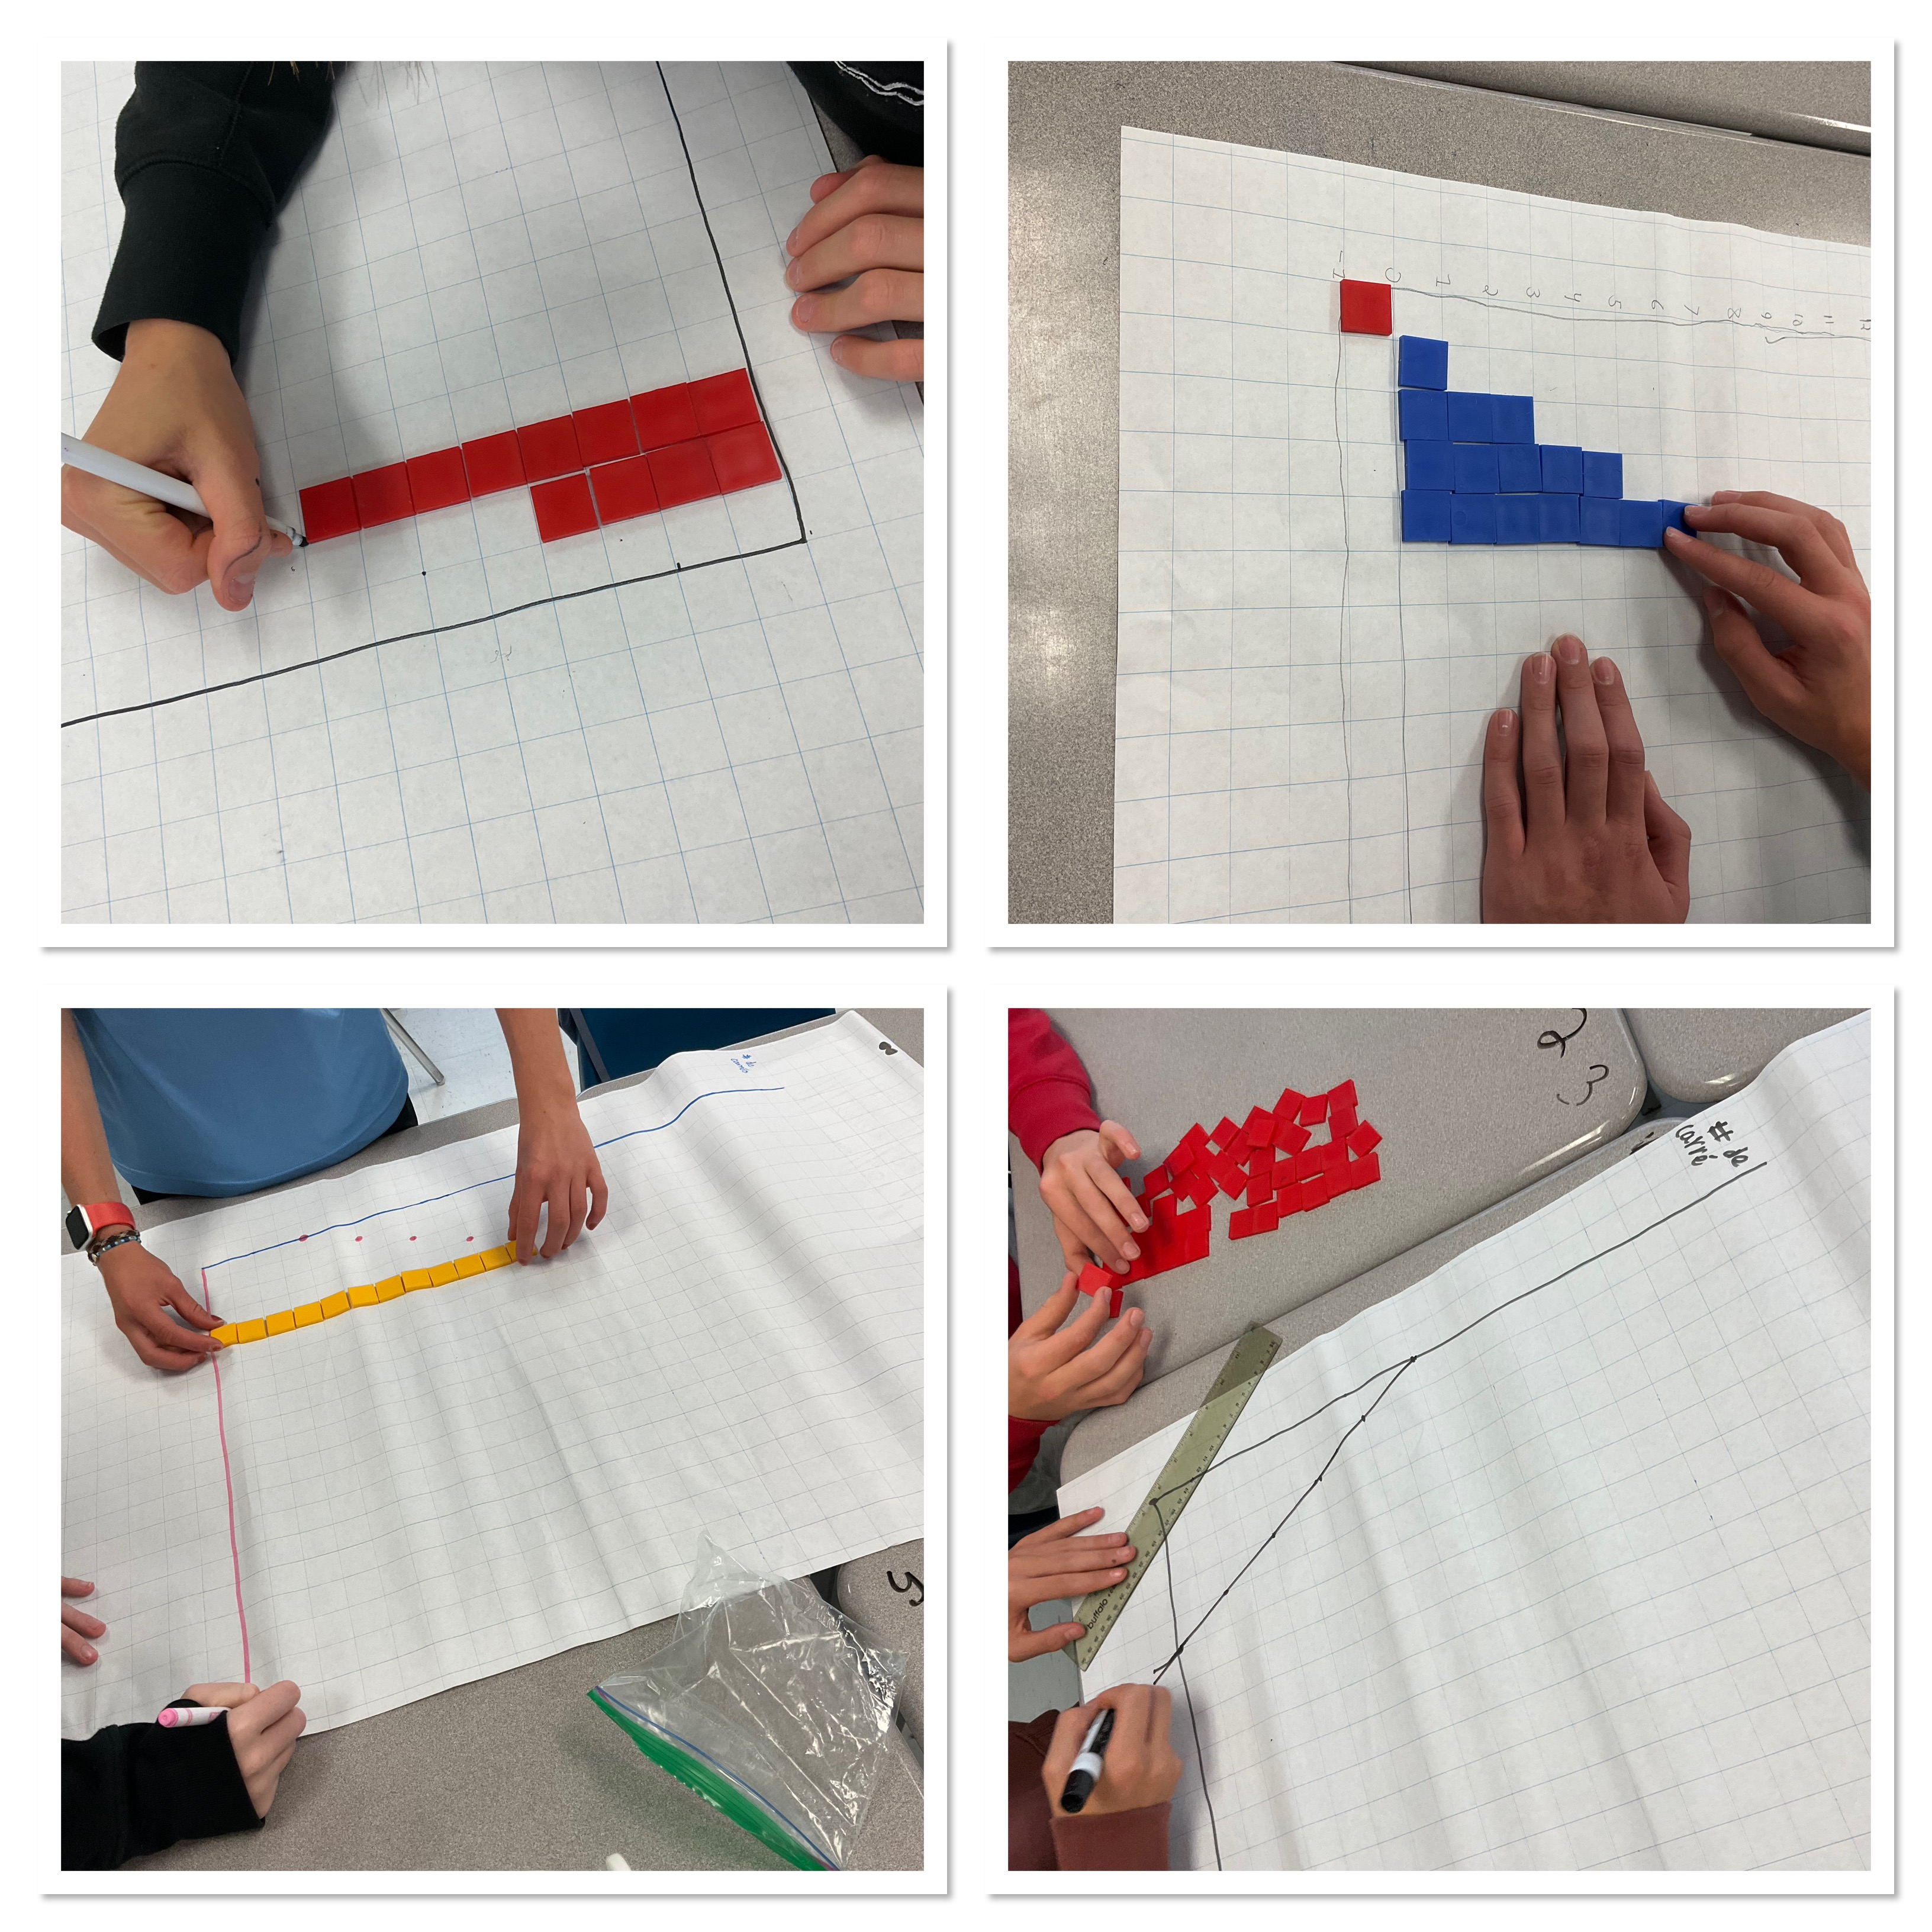
Next the dots were connected to form the line. Groups were given a different pattern rule and we did the same steps making a second graph superimposed on the first.

Finally we put them on the wall and then did some consolidation from our examples.
We identified parallel lines, how they have the same slope and will never intersect. We noticed that the slope is the number in front of the x, that multiplies the x. That’s also the rate of change. In French, le taux, la pente. We noticed that the constant will give us the y intercept on our graph.

We looked at slopes that were steeper and less steep. We noticed that the bigger the value for the slope, the more the line increases each time. We saw that if the equation was just y=4x that the constant is 0, and the line crosses the y axis at the origine (0,0). Here there is an intersection point at (1,4).

This graph shows a line with a positive slope of 2, and a line with a negative slope of -1. We noticed that the equation can be written like y=2x-1 or y=4-x, the constant could come first or last. We noticed that the constant represents where the graph crosses the y axis, even when it’s a negative number, so we needed to extend the axis down to accommodate it. We estimated the intersection point here. There’s a way to calculate it, but we’re not there yet.

Here we have 2 negative slopes, representing decreasing patterns. There is an intersection point, which is also called the solution. We can draw slope triangles to see the rise and run and visualize the slope.

We noted that it’s possible for a system of equations to intersect 0 times if the lines are parallel and distinct, 1 time if the slopes are different, and infinite times if the two lines are the same exact lines.
We finished off the class watching some excellent videos
Hopefully this summary helps those who were away at leadership camp get caught up!
