M&Ms task
Today I had the pleasure of working with a grade 11 math class who have been studying exponential growth and decay.
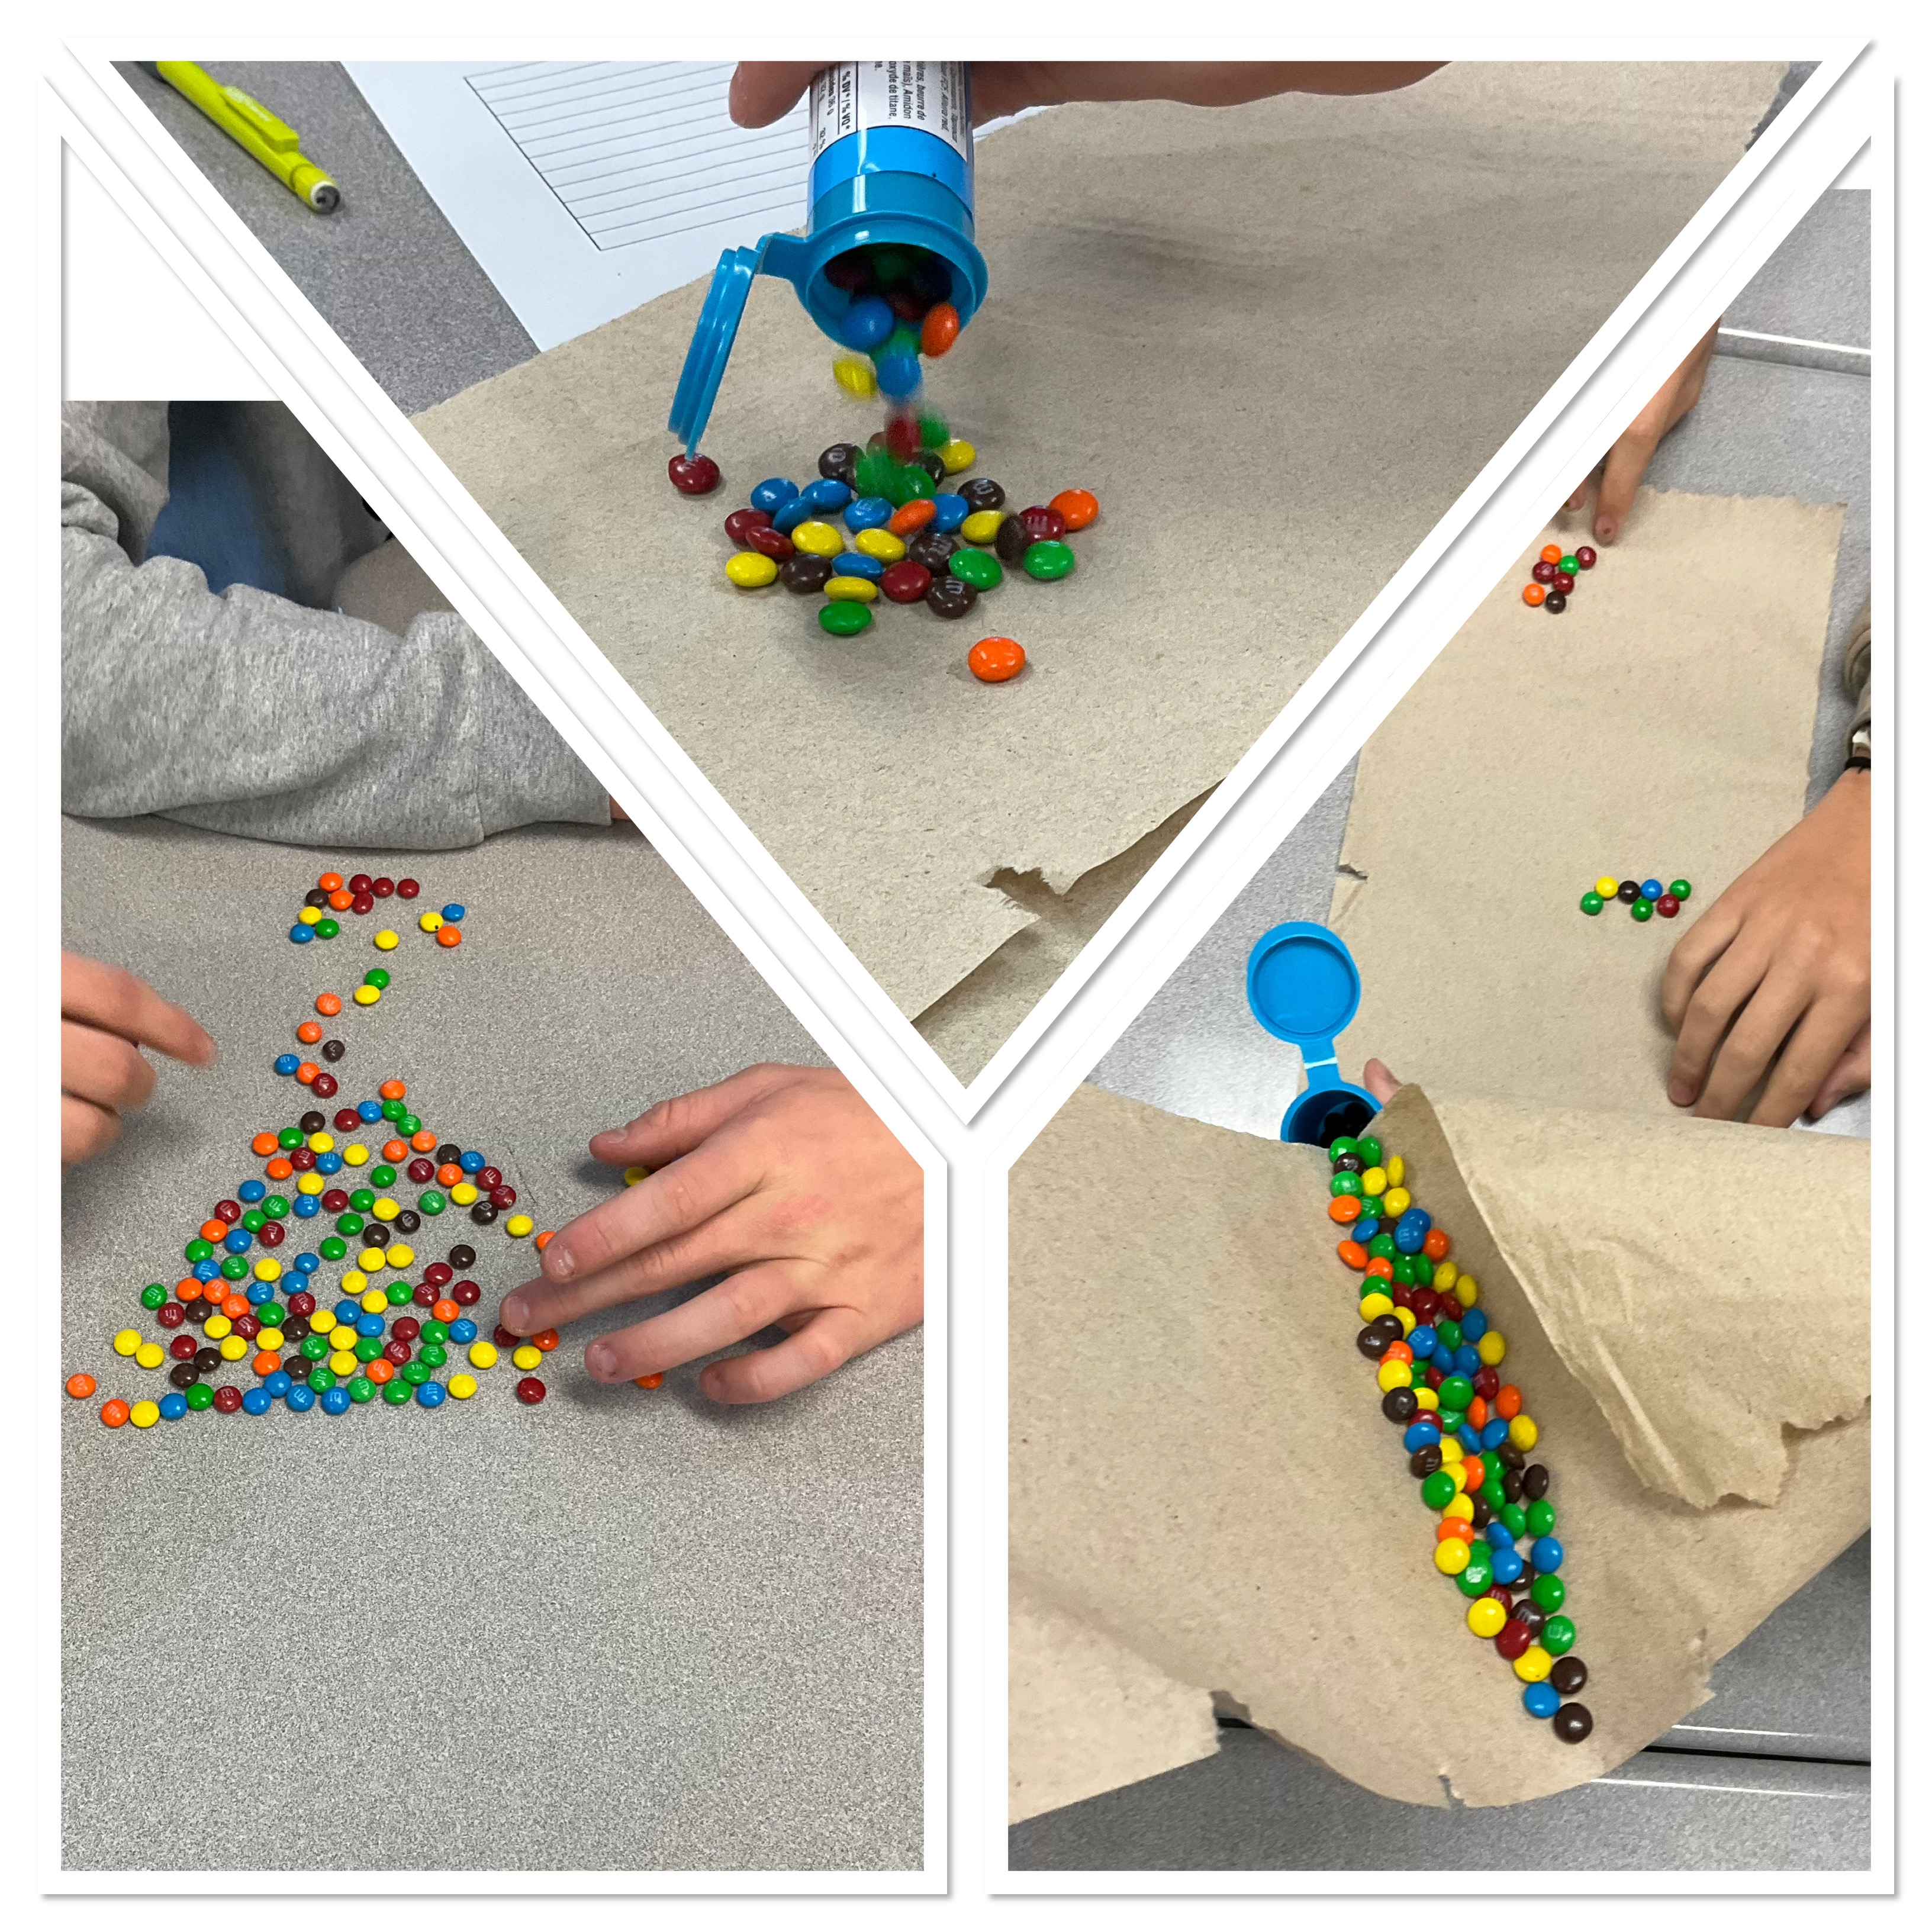
we started by sanitizing our hands because we were going to be touching candy which we wanted to eat later.
Each group got a tube of mini m&ms. They needed to count how many were there to start with, and add information to a data table.

Next we put all the m&ms into the tube and dumped them.
We eliminated (ate) all the ones with the M side up, and counted the remaining ones, added that to the data table, and repeated until we were done 10 repeats.
Next we made graphs using our data table, and tried to make sense of what type of relationship we saw, and what equation would model the data.

We noticed that the number of m&ms remaining dropped fast at first, and slowed as we continued. Some groups noticed that they had 8-13 remaining, even after repeating the process 15 times. It turns out some m&ms didn’t get printed!
We noticed that there was a horizontal asymptote that appeared. The graphs were showing exponential decay. Since we removed about half the m&ms each time, or since there was a 50-50 chance of them landing m side up, we used 0.5 as the base of the exponent. We know that the x will be the exponent. We needed a vertical shift to have the horizontal asymptote in the right spot, and we used the “a” value, a vertical stretch to get the y intercept in the right spot. Knowing that anything raised to the exponent 0 is 1 is very helpful!

Next groups got computers and put their data into desmos and used the extrapolations available there. We noticed that if you use the exponential regression that desmos has from their drop down menu that the horizontal asymptote is at the x axis. To do a more precise regression you can type it in. This graph is the aggregate of all of the class data, shown on one graph.

It’s important to remember the subscript 1 which ties the x and y values to the data table with x1 and y1. The ~ indicates that a regression is to be done, and there will be values given for each of the parameters provided in the equation. The r squared value will also be given.
It was neat to see the connections the students were making to their prior knowledge. They understood what the asymptote would represent in this situation, and how the base had to be a value between 0 and 1 since it was a decay situation. I was impressed at how well the data from the experiment worked out, and how clear it was that we were dealing with exponential decay.
I had debated having the students eat the m&ms without the m showing, but I think that they would have missed out on a rich conversation about the horizontal asymptote being representative of the “defective” candies that didn’t get printed. The task could be done with skittles as well, but the mini m&ms work well since they are small so each group starts with a large number, and can see the decay rather dramatically at the start.
