Equations to Graphs via Visual Patterns
Today I had the pleasure of running a task in a colleague’s grade 9 math class. We’ve been working on patterning, pattern rules (equations) and graphs. Today the goal was to start with an equation and end up with a graph, but we used visual patterns as the intermediate step.
Each small group of students were given an equation (pattern rule) and were challenged to build figure 0, figure 1, figure 2, figure 3 and figure 4.

Next they brought their tiles from each figure number one at a time to build columns on a graph. All the blocks from figure 0 were lined up on a tower along the y axis, all the blocks from figure 1 were lined up in a tower next to it etc.

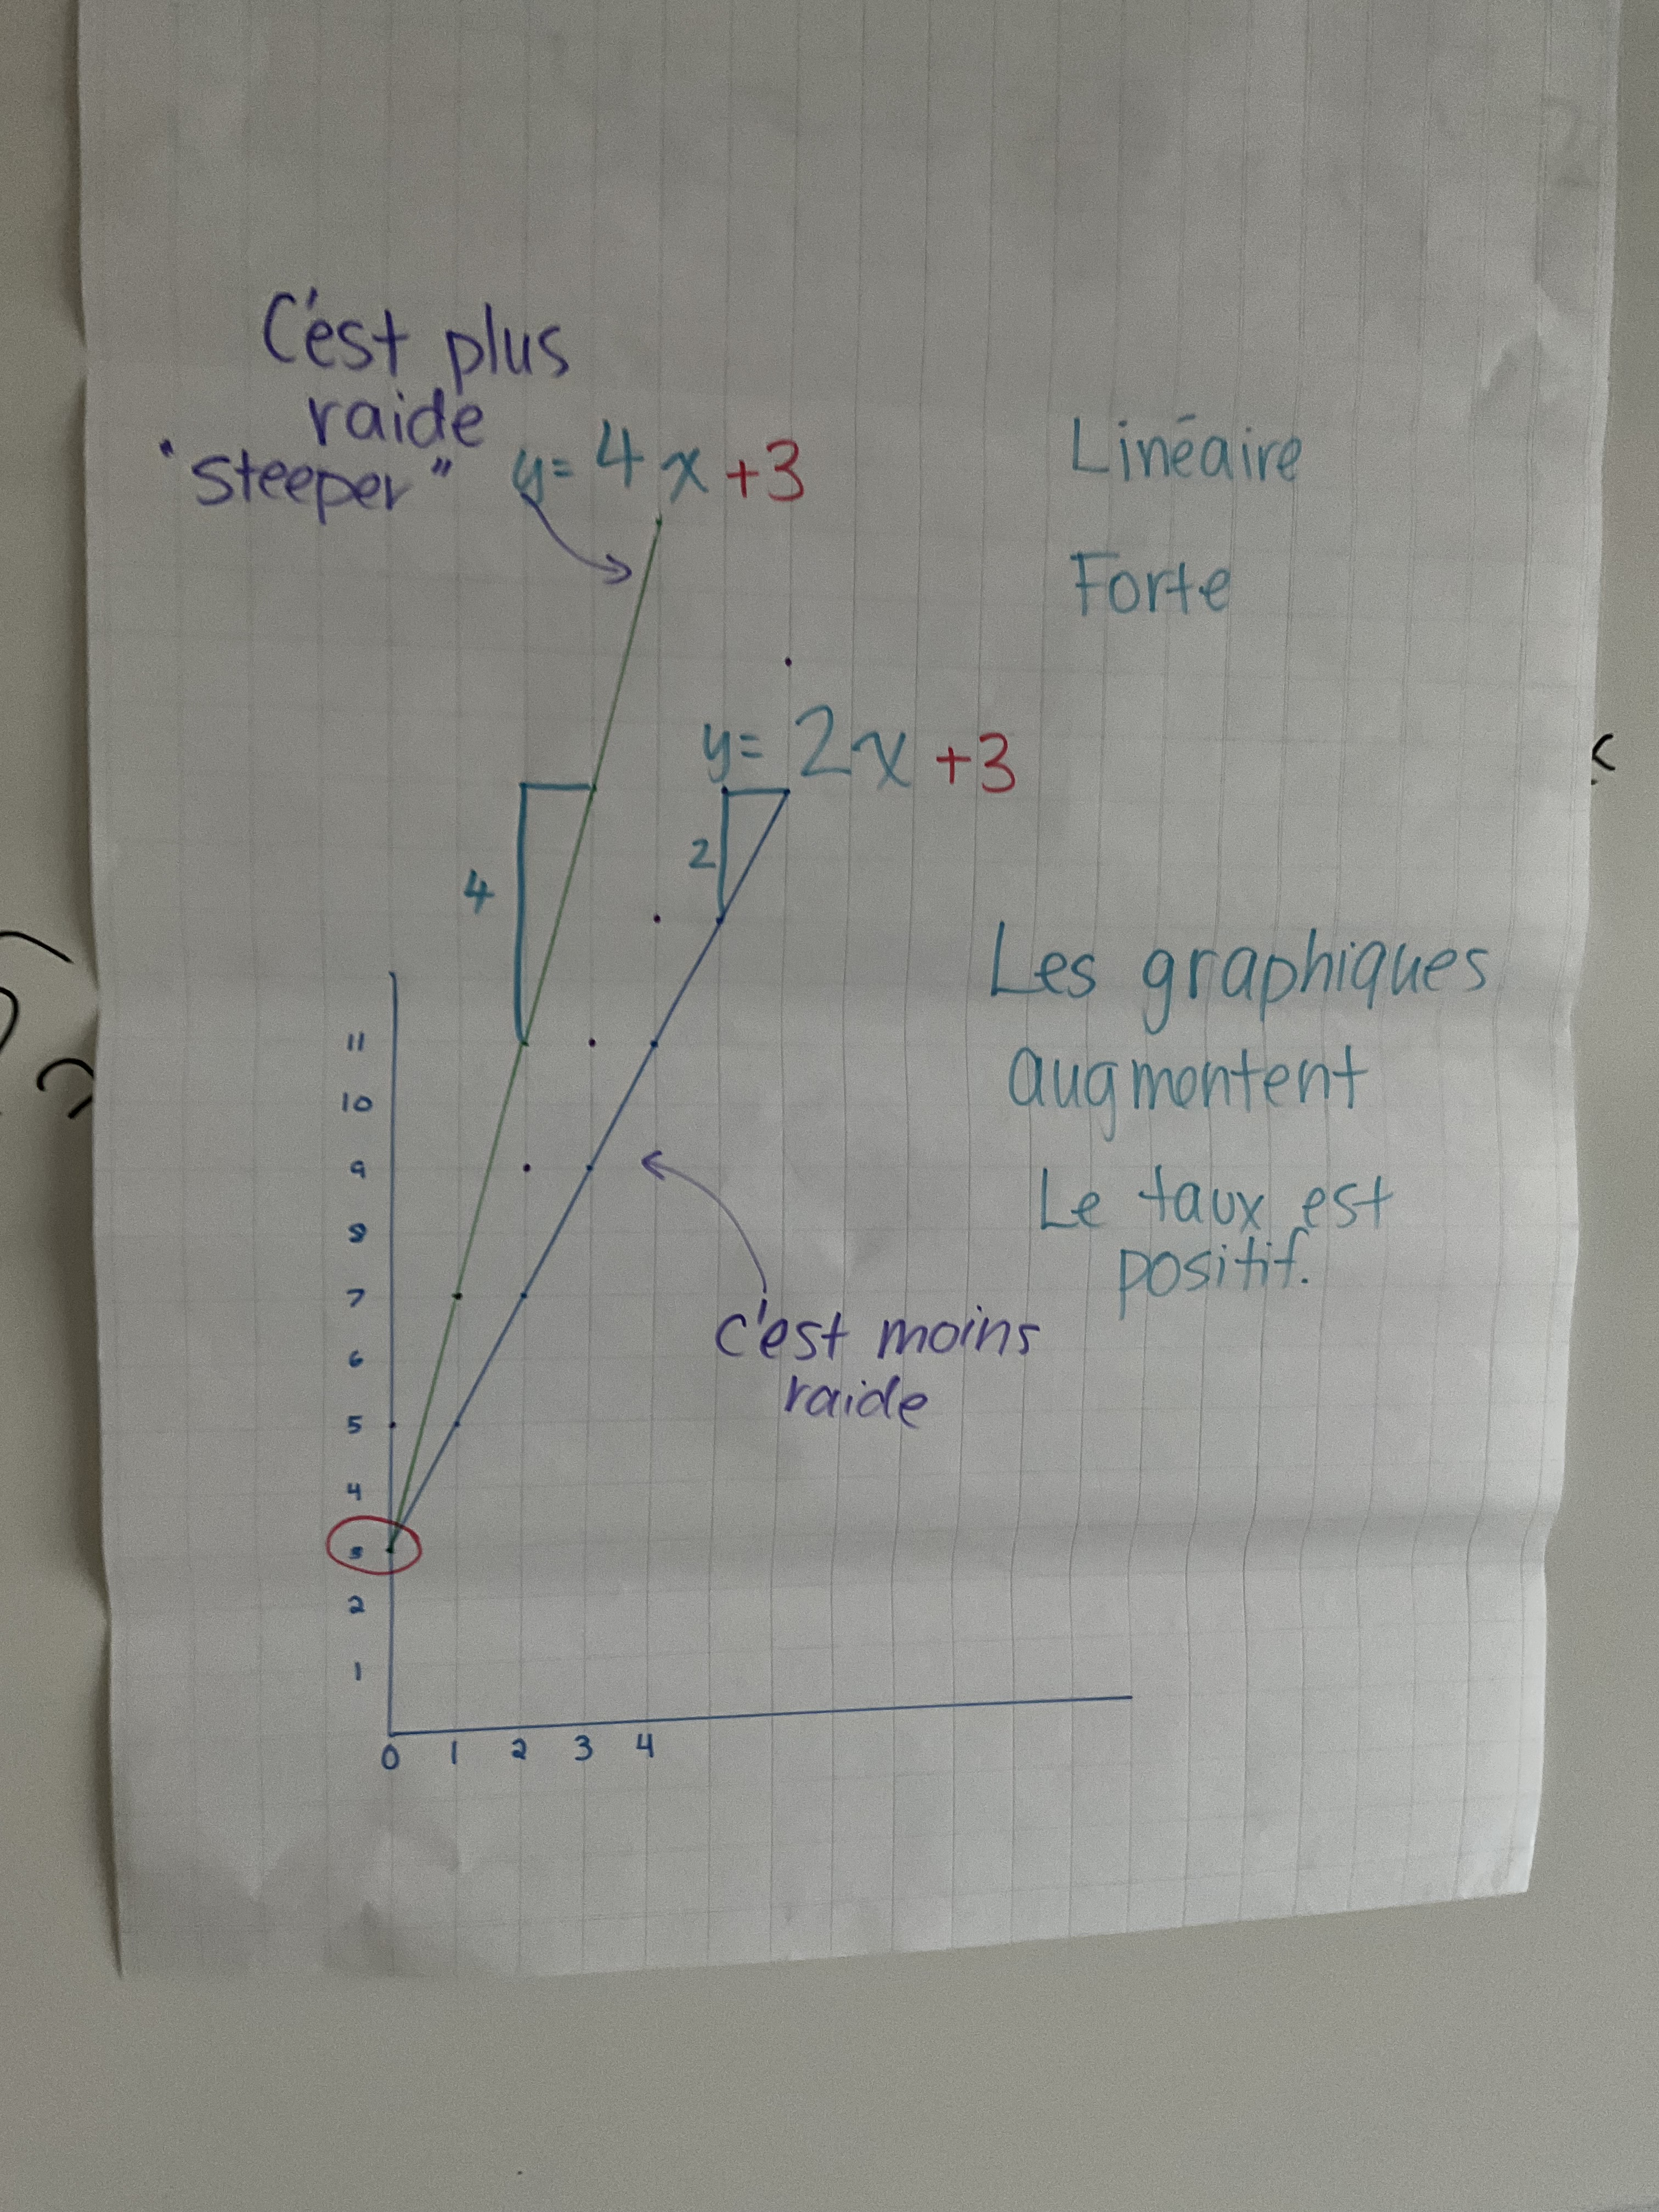
Dots were placed at the top left of each column of blocks to indicate the height of the column, and later we removed the tiles and joined the dots to make a line.

Next students were given a different pattern rule and we did the same thing again, making a new pattern, new columns of blocks, and then new points and a new line, with a different colour marker.

Some groups did more than 2 graphs. Others did just 2. Some had some misplaced points which we left on the graphs and then used them for points of discussion later.

We got groups to clean up and then we posted the papers on the wall to use as our consolidation. Now, there is a bit of an art to getting a good consolidation on these tasks. It starts with pairing up the equations well to get something to discuss. I made sure to have some lines with positive slopes and negative slopes, some lines that had the same y intercept, some lines that would intersect with each other. Some lines with positive and negative y intercepts, and some parallel lines. The next part about the consolidation is to meet the class where they are at. Many students were comfortable talking about all of the graphs being lines, or about them being increasing (growing patterns) or decreasing (shrinking patterns). Once we got all of those ideas up on the pages we started looking at more similarities and differences among the lines, introducing new vocabulary when possible.
I get the class to do a call and response of “parallèle” “même pente” which I think is fun, and it helps reinforce the idea that parallel lines have the same slope.


We took a bit of a break and watched some of my favourite life changing math videos:
Next we consolidated the final graph. We showed more detail about the slope and how we can use various points to show the slope triangle, and the fraction can be simplified. We also looked at how the point of intersection is on both lines, so when you sub in the x ans y values it makes the equation true.

It was a really productive class, and quite fun to collaborate with my colleague and introduce her to this task.
