M&Ms task
Today my grade 9 class tackled the M&Ms task.

Students counted, dumped, removed all the “M” side up candies, then counted, dumped and repeated the process. They added to a data table as they went, and noted that there was a big drop at first, and less and less of a drop as it went on. Some saw the connection to the drop being about half each time, which was neat to see. Again, we noticed that 8-12 candies had no M printed at all, so we never ended up eliminating all of them.

Groups created graphs and saw that the pattern was not linear, but looked like a decreasing curve. They made curves of best fit to model the data.
We talked about how to make an equation to generalize what we saw happening. We know that to find half of a number we can divide by 2 or multiply by 1/2. If we find half of THAT number then we’d have to multiply by 1/2 again. We showed that in our table of values for an example case of starting with 160 candies.

We could use our exponent knowledge to help us build the equation. This type of modelling will be important when we look at compound interest later on.
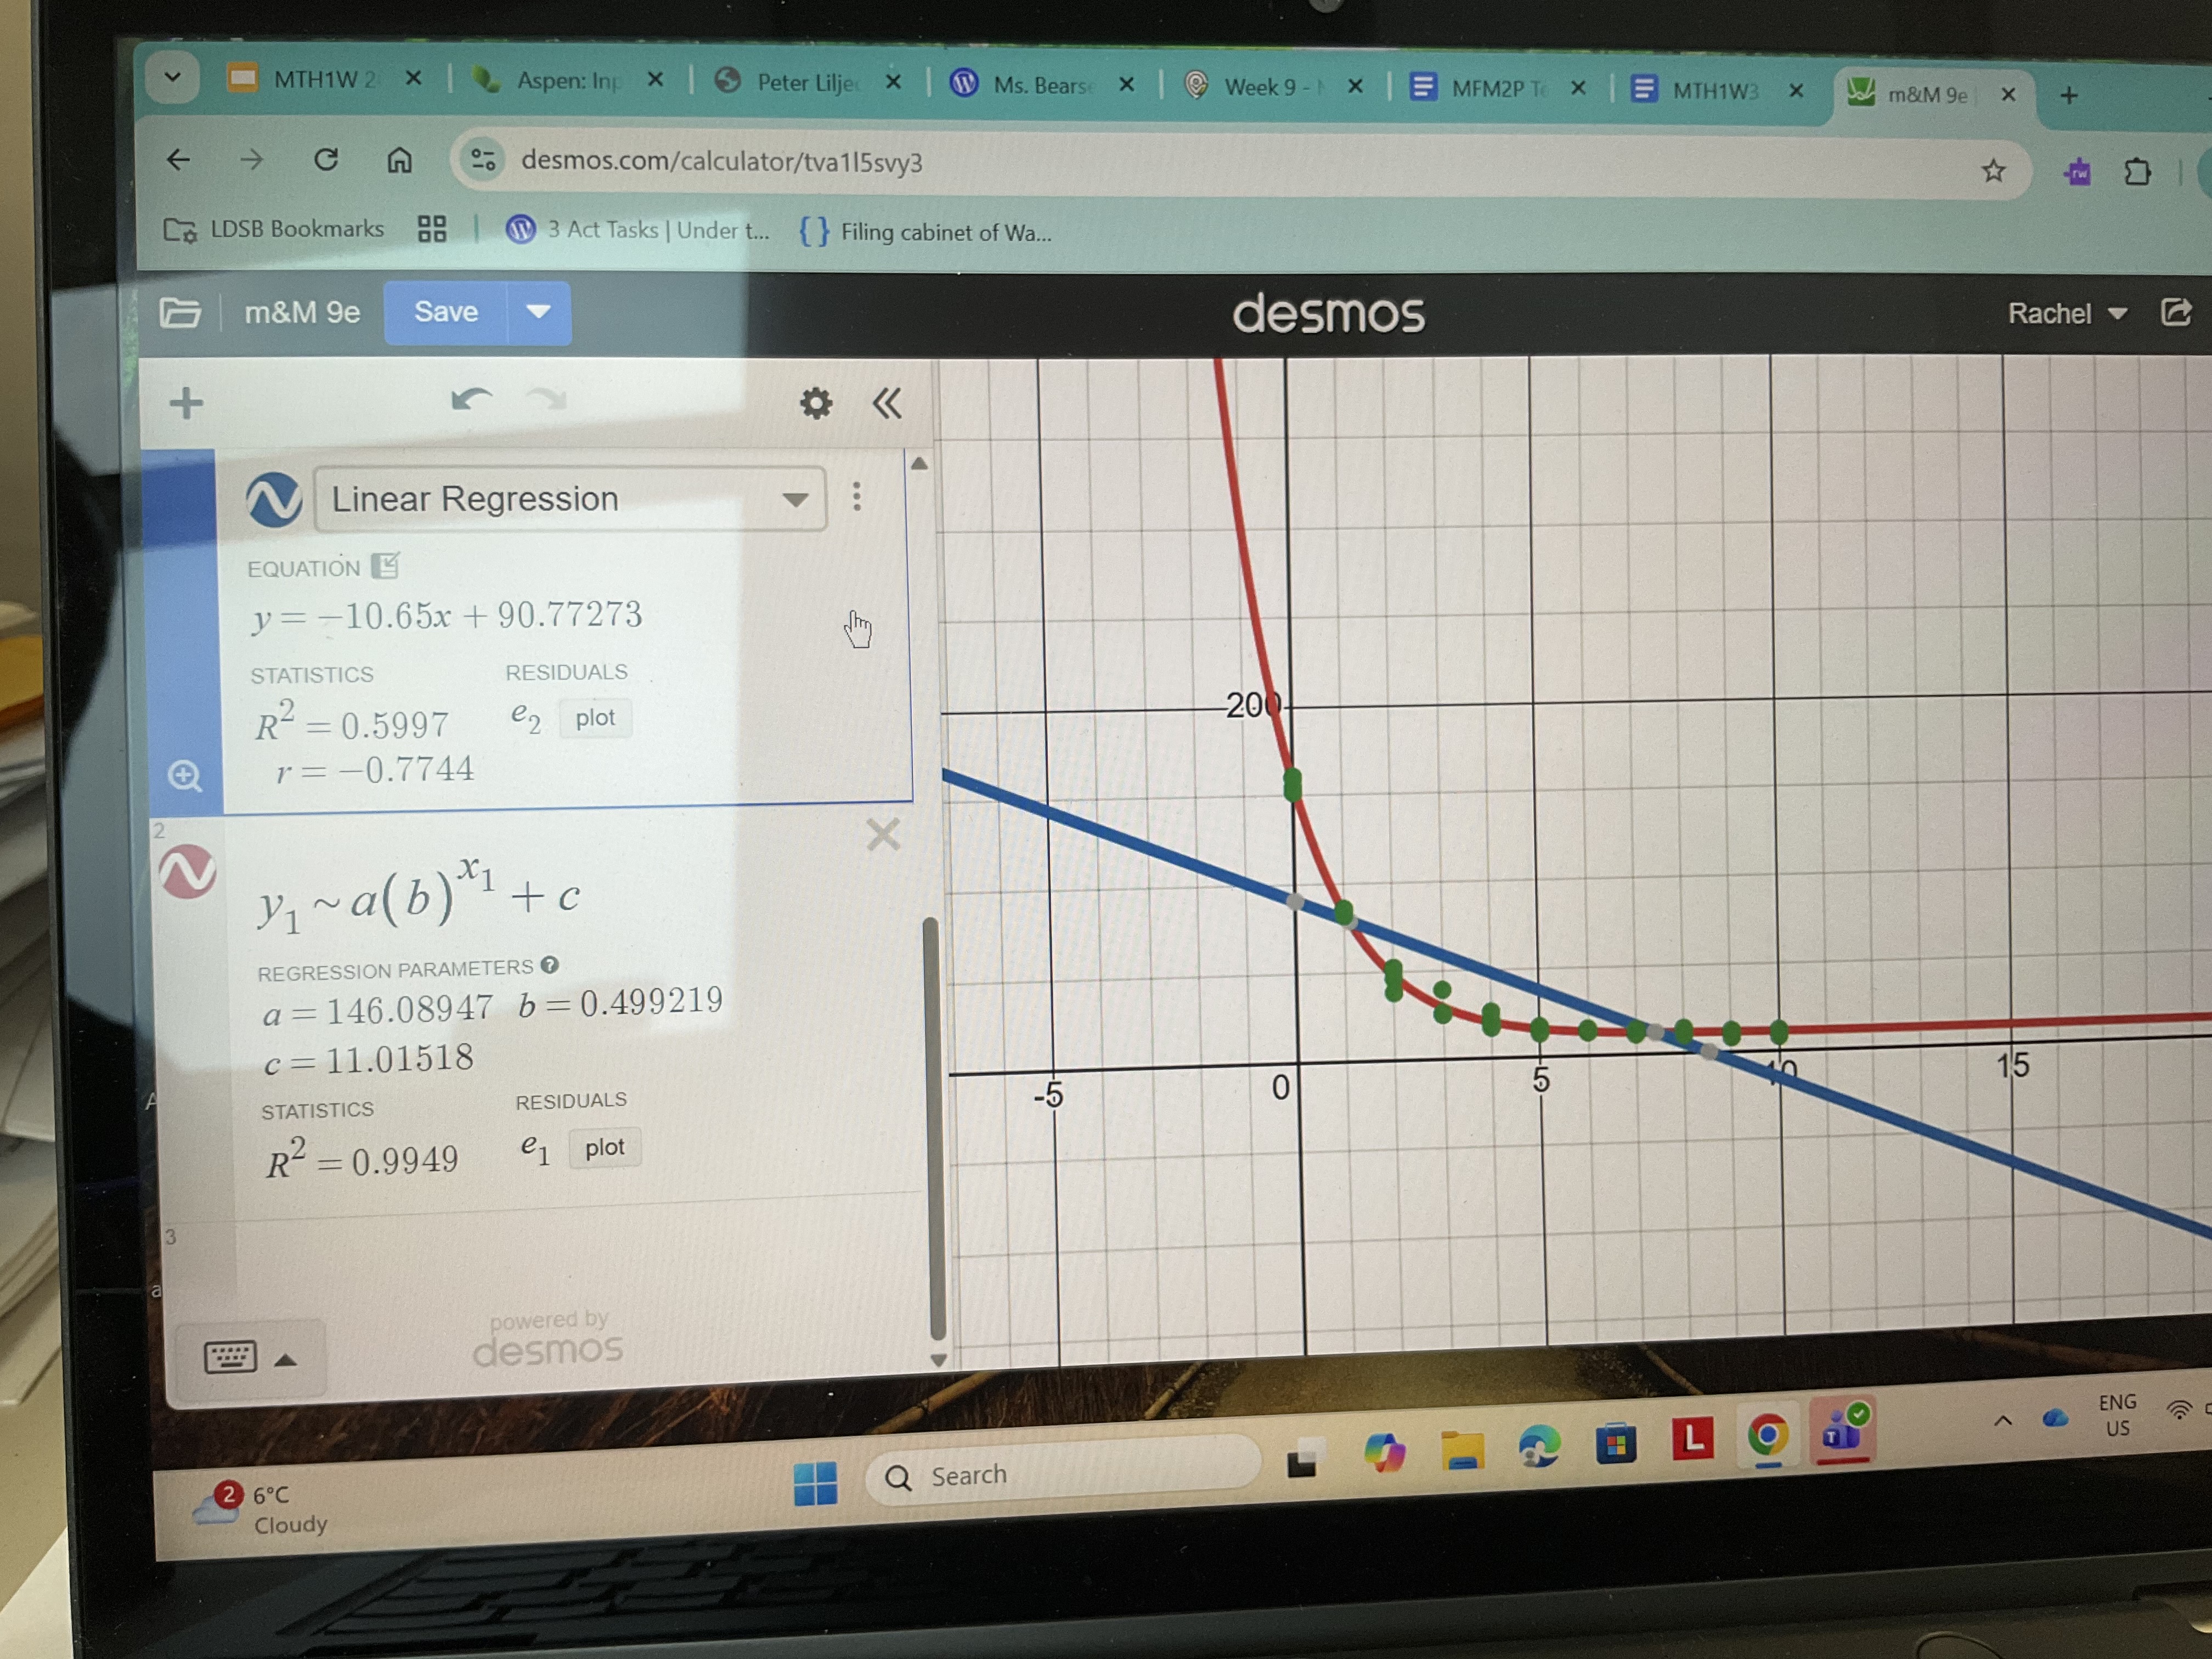
Finally we modelled the class data on desmos and looked at how to do a regression. We followed the same model as we created together, but left the initial value as “a”, the base of the exponent as “b” and the vertical shift for the horizontal asymptote as “c”. We talked about the R squared value and how it’s a really good fit. We compare this to the linear regression that Desmos does. We noticed that the linear regression has an R squared of 0.59 which is not as good a fit.
This was a nice way to spend a Hallowe’en Friday, eating some candy and making some graphs, and learning some pretty sophisticated modelling skills.
