The Great Cookie Stacking Competition
This activity is quickly becoming a favourite. It’s a nice way to revisit mean, median, mode and range, and also introduce the idea of quartiles and a box and whisker plot.
There are very strict rules for this challenge. People use one hand and stack one cookie at a time to build a freestanding cookie tower. I gave each group a box of cookies to use (I get the cheapest cookies I can find that are not sandwich cookies because they stack too well).
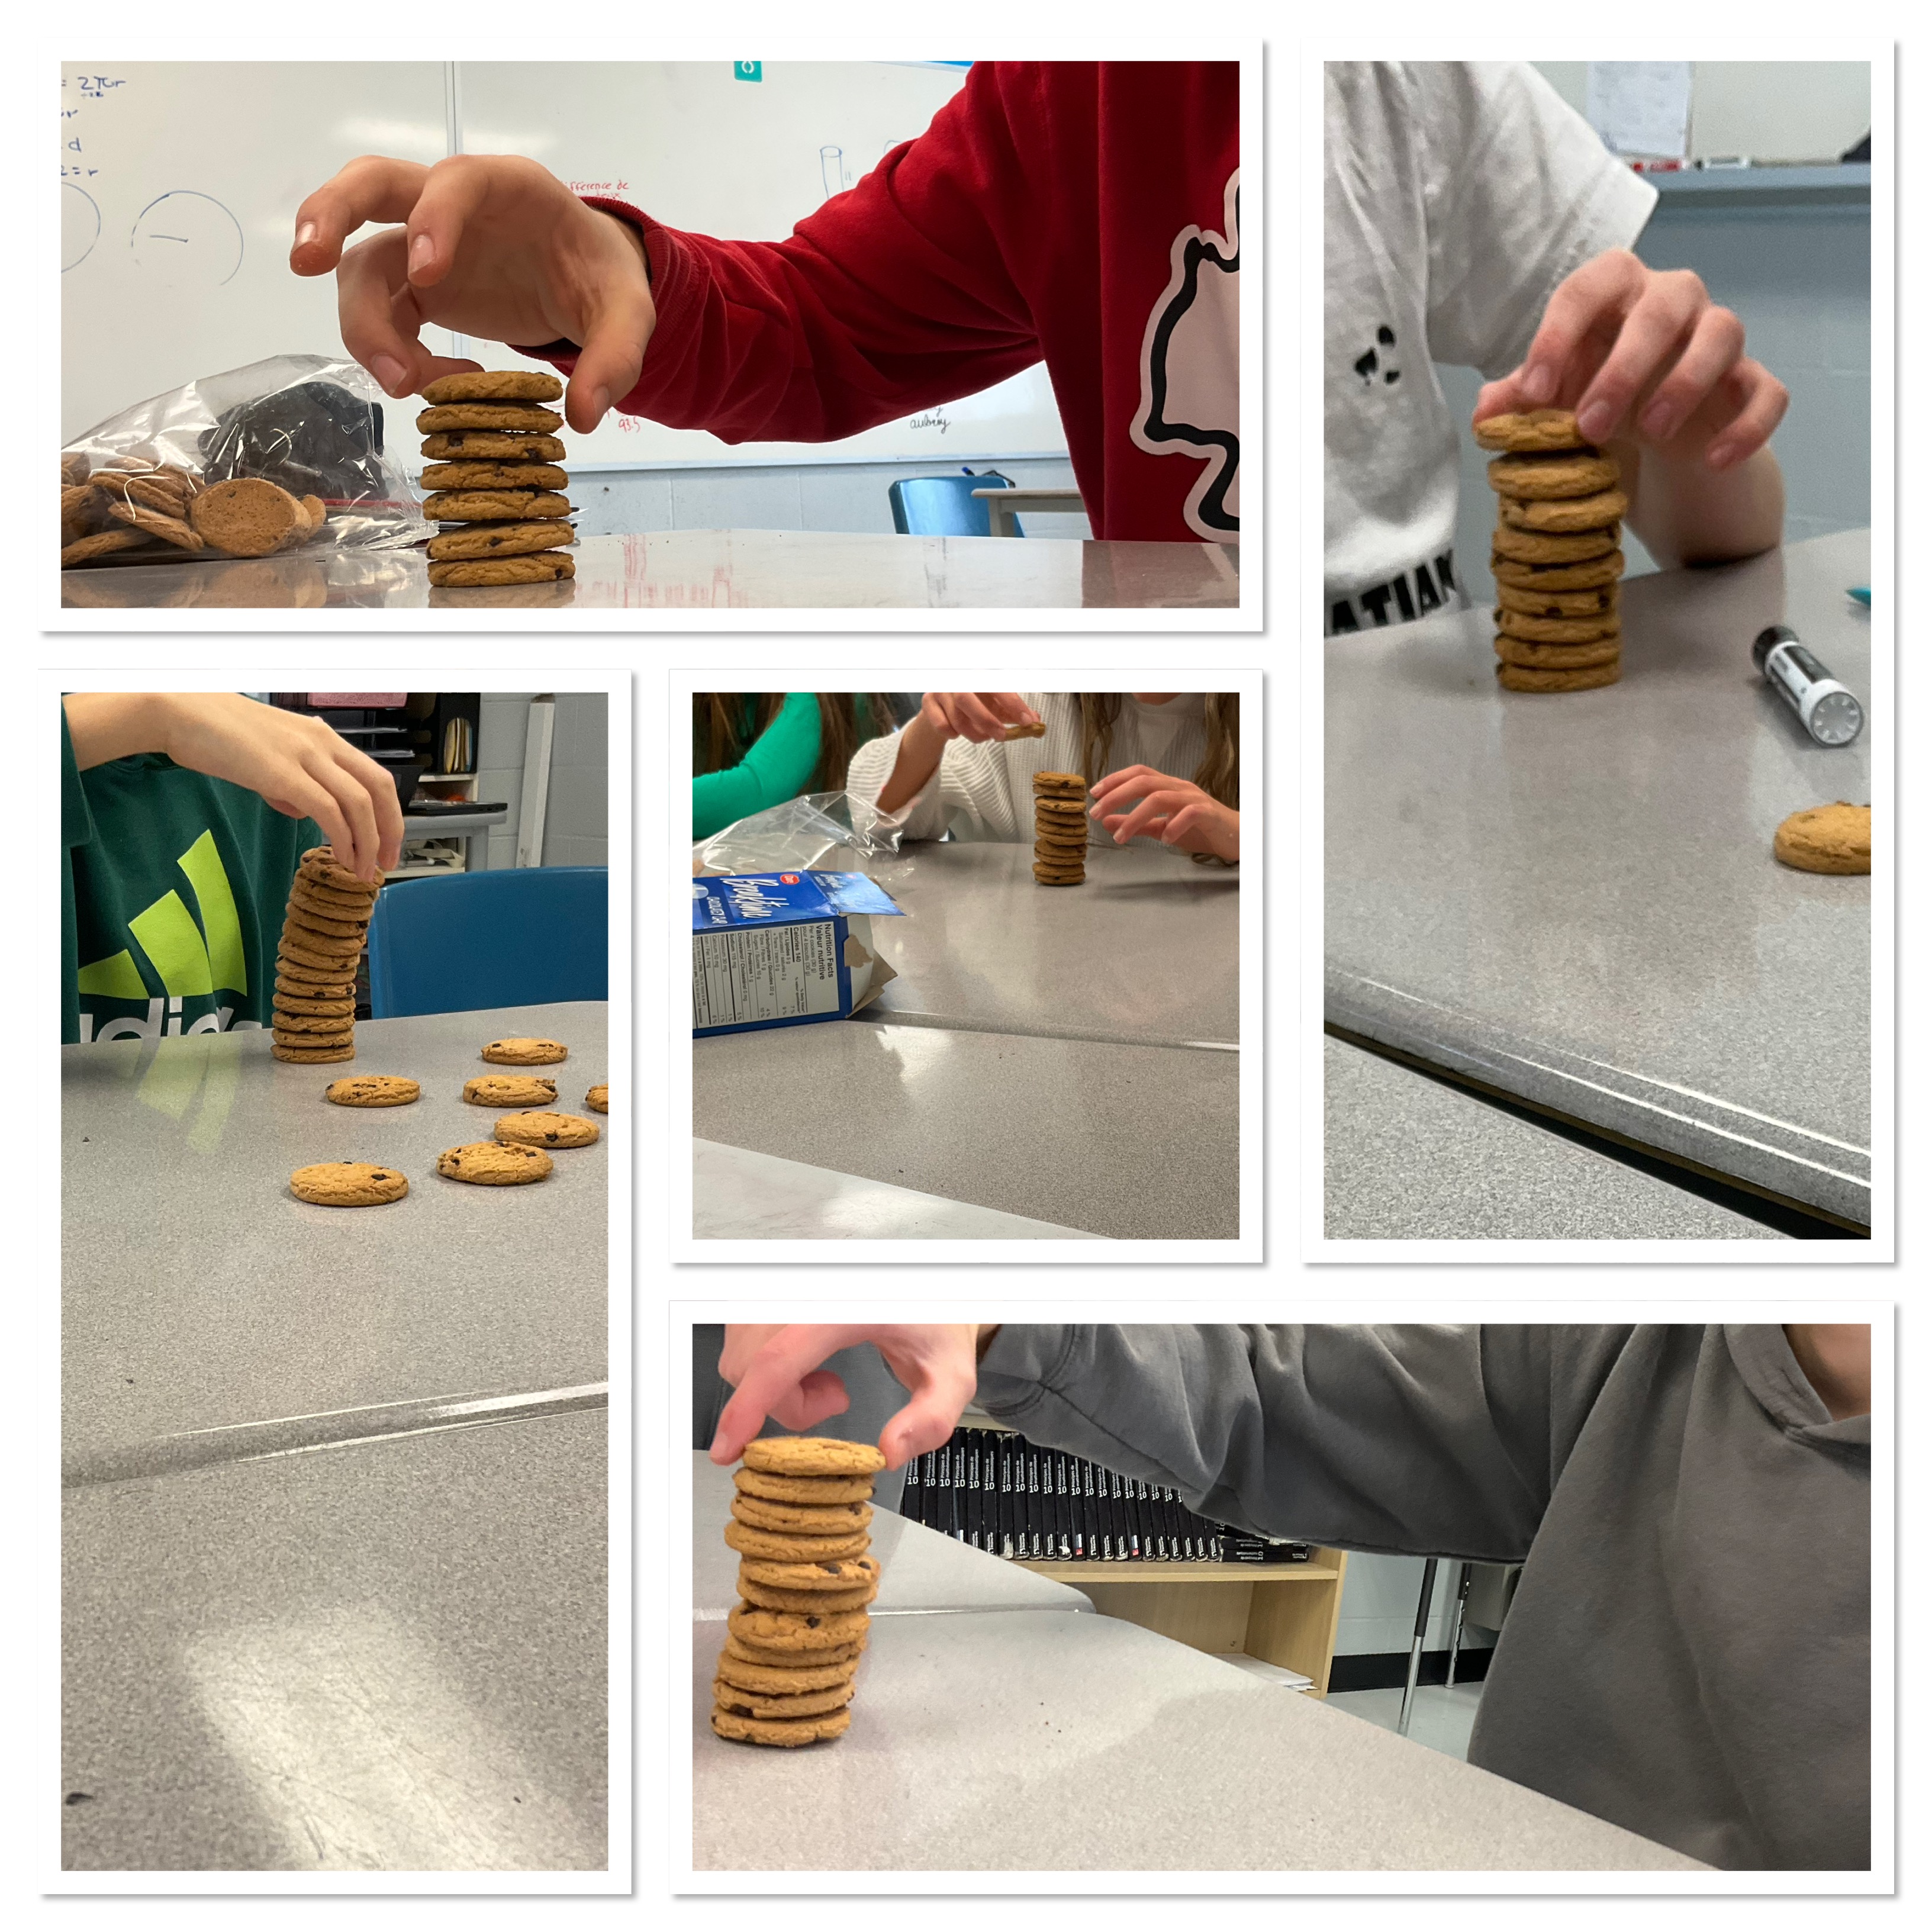
There’s high drama as everyone stacks towers. We keep going until each group has 12 data points. The best stack of the day was 19 cookies. I didn’t get a picture of that one, but here’s a pretty good one.

When we all have our data written down, the next step is to calculate the mean, median, mode and range.

and after that, we took a pause to explain what quartiles are (we cut the halves in half), and then we made box and whisker plots of our cookie tower data.

It’s nice for the class to see that data in a table has all the information, but it’s harder to compare the data between groups by looking at the table. We can make comparisons easier by looking at the box and whisker plots. We’ll come back to this again tomorrow with some practice.
