Ramp Race Day 2
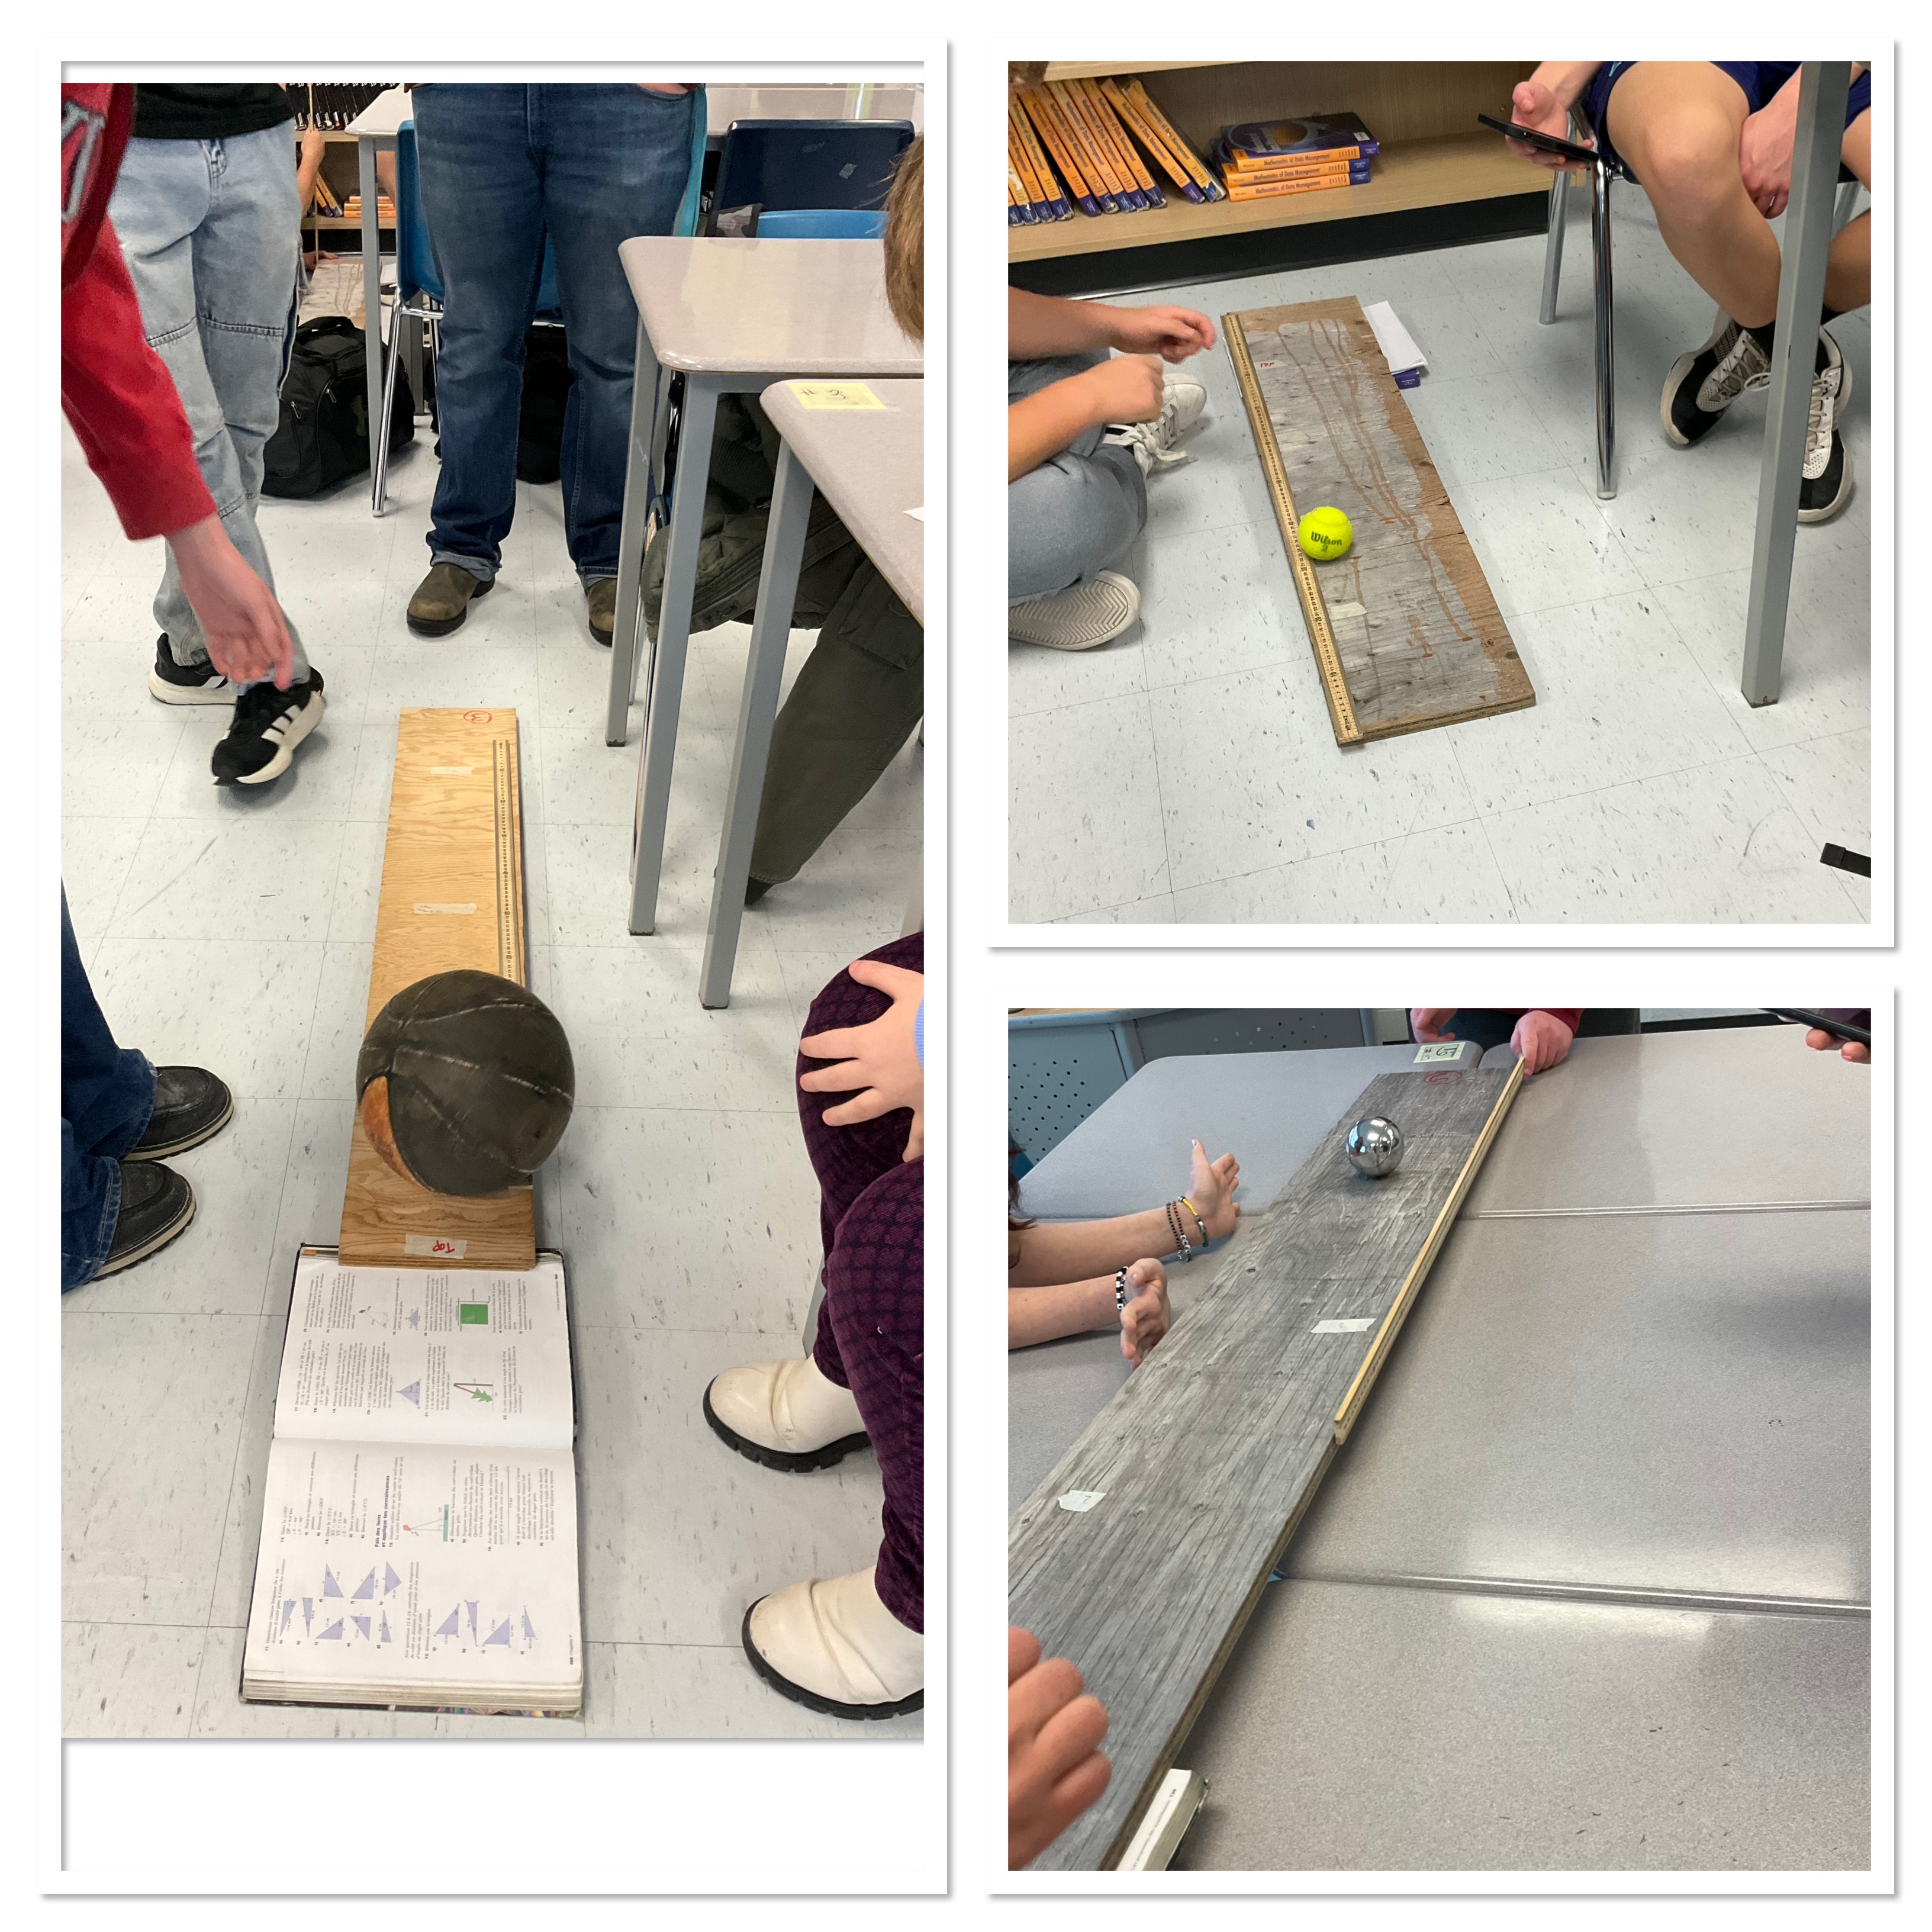
Today we got to work with our ramps, finishing up all of the data collection and averages.
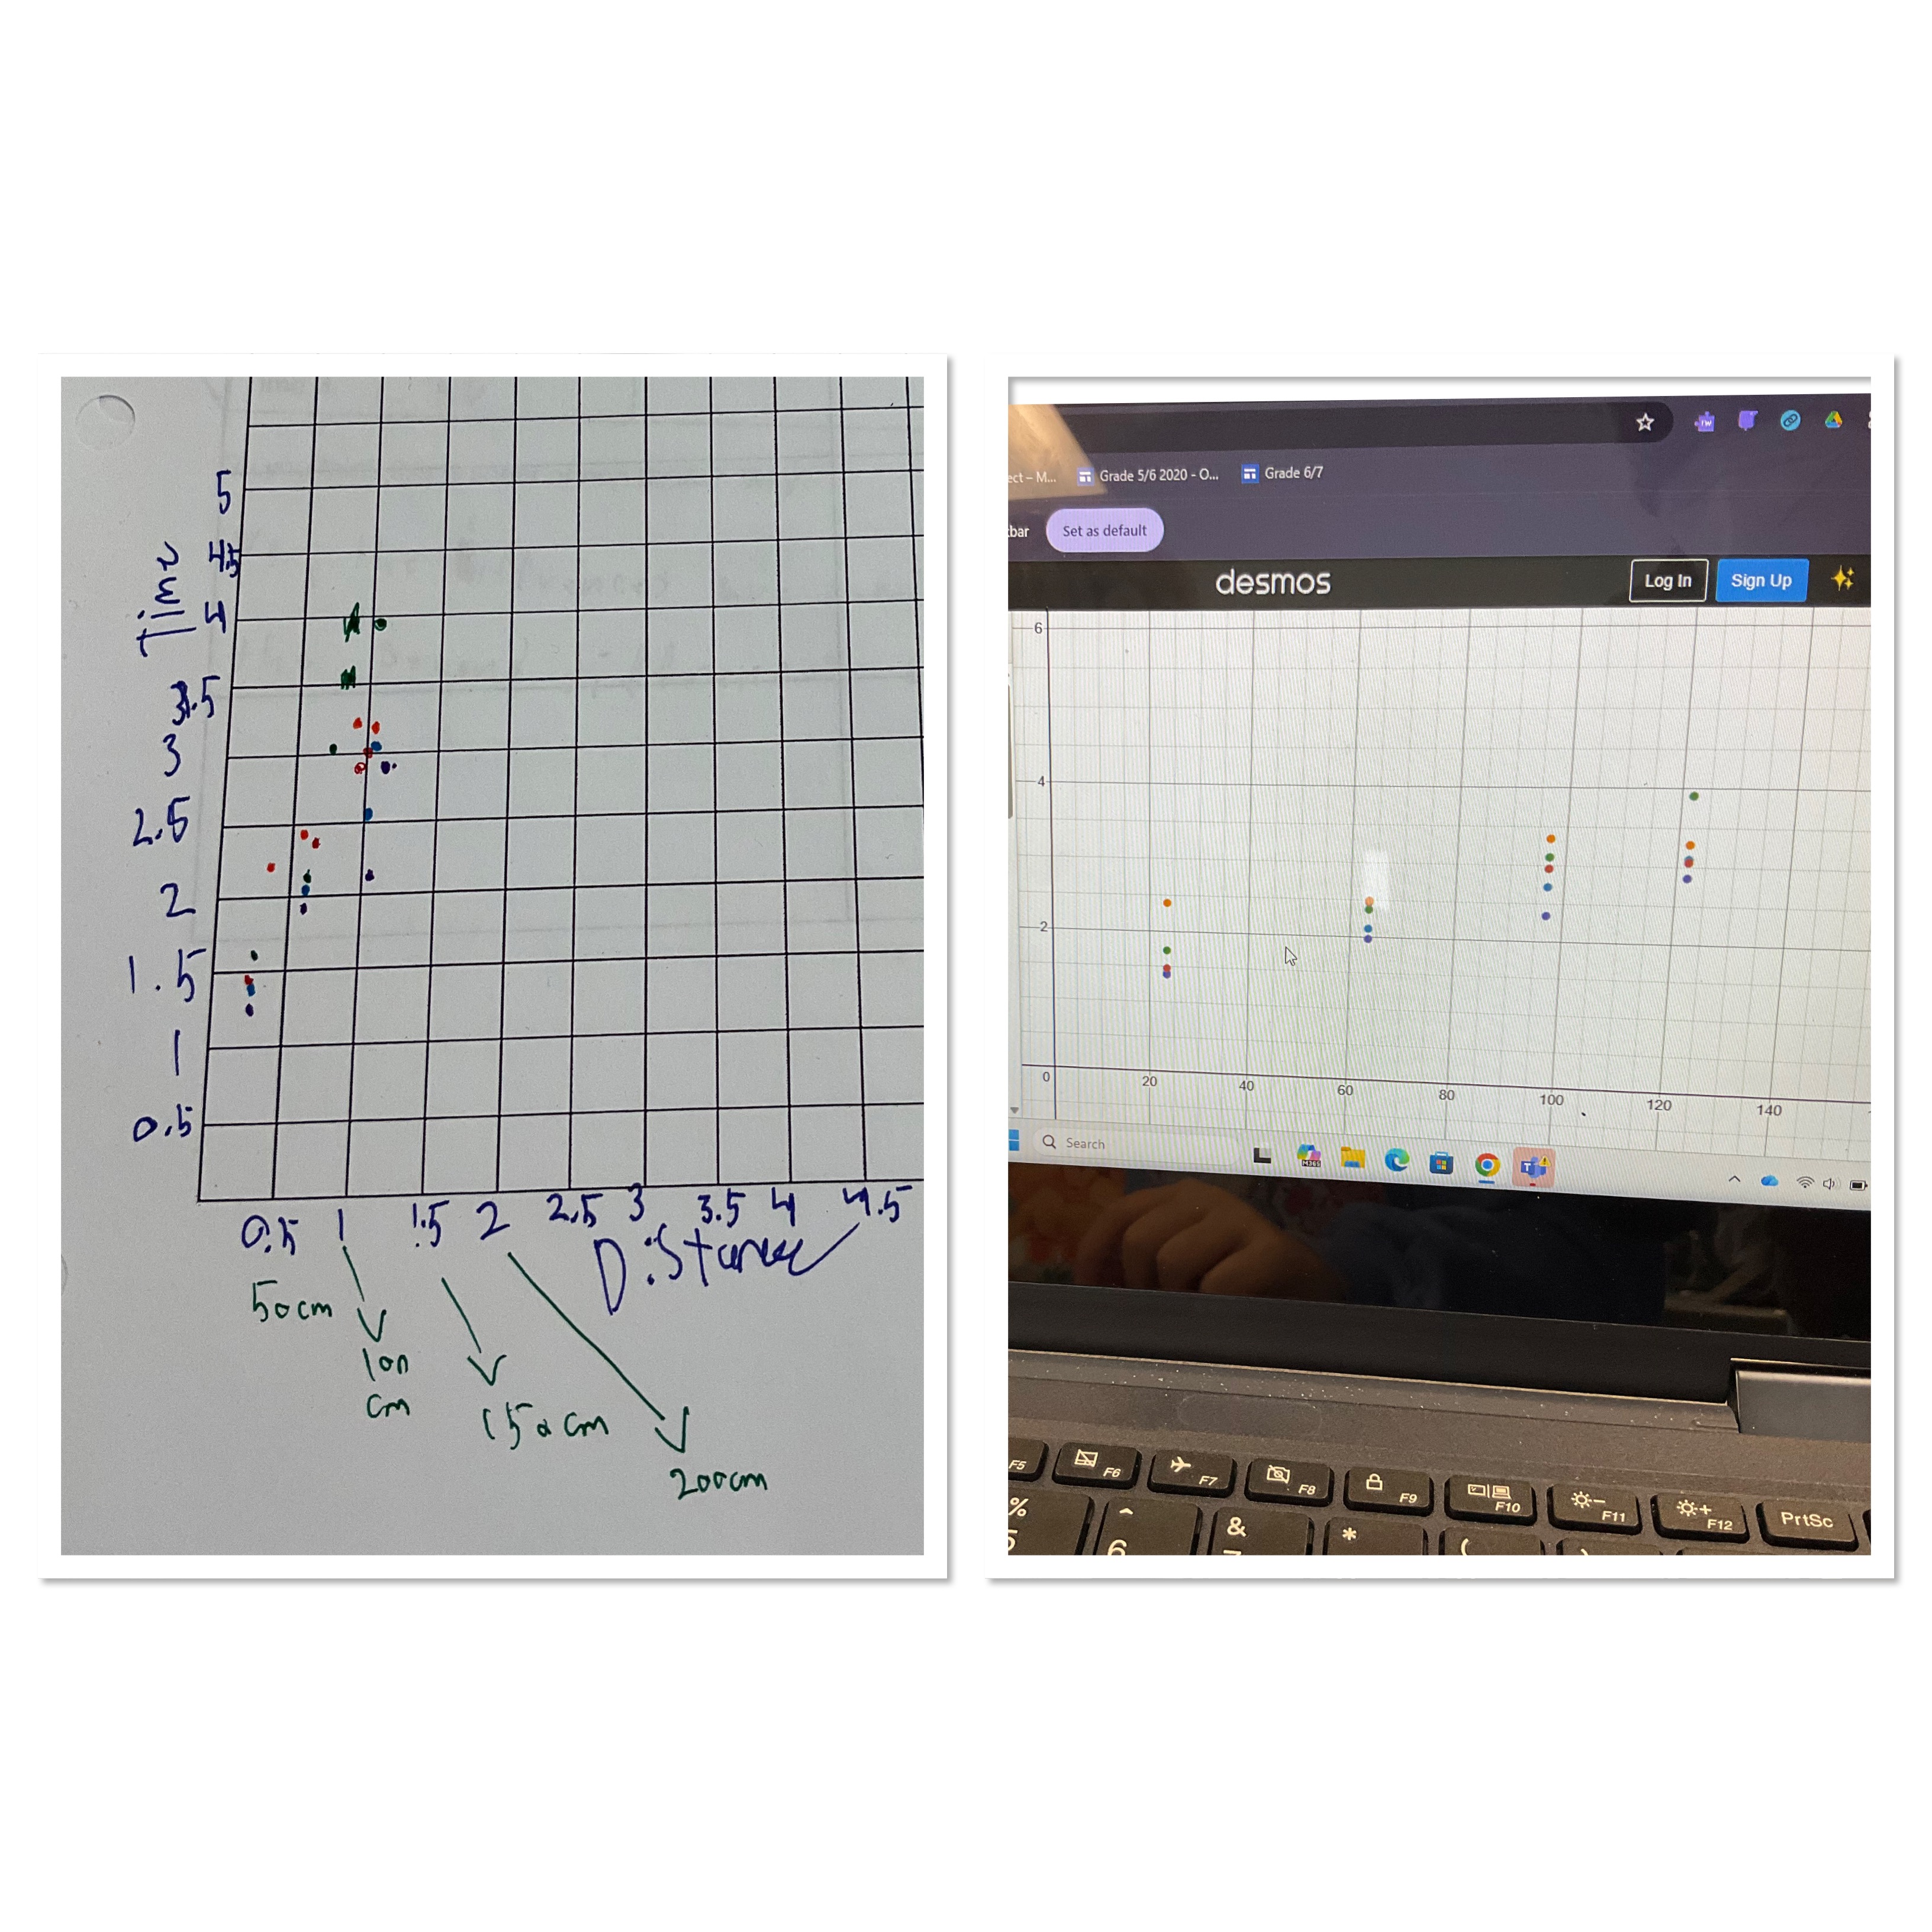
We looked at the data to see if it seemed linear or non-linear, and tried to model the data.

We used Desmos to help with our models. From the data for most groups a linear model seemed to work.
There are a few challenges we’ve noticed. Some of our boards are not straight, so for some, the tennis ball will stop part way down the ramp, because the ramp momentarily goes up. For next time we’d try to get thick boards that wont curve, and to check that they are as straight and flat as possible. We also noticed that the timing can cause some challenges. Since the ramps are short, a small error in timing will be a big percentage of the time value that we get, which is likely why our data is looking linear-ish. Having only 4 points for each ball also might not be enough to see a real trend. In any case, we’re going with the idea that they might be close enough to be linear.
Groups are using Desmos to get lines of best fit, and then Monday they are going to make predictions about how long it will take for the ball to go down the 8m ramp. We’ll hopefully be able to get the final race done on Monday as well, and we can use the final results to evaluate our models to see if the real world race is modelled by linear equations, or whether it might be more complex.
Many thanks to Pathways to Education for sending a grad connector to help with some of the groups. This is a task that takes a lot of coordination and checking in. We are much more on task now than we were in September though which is a great development.
