Ball Roll Race Finale
Today was all about analysis and making predictions, and then we did the final race.
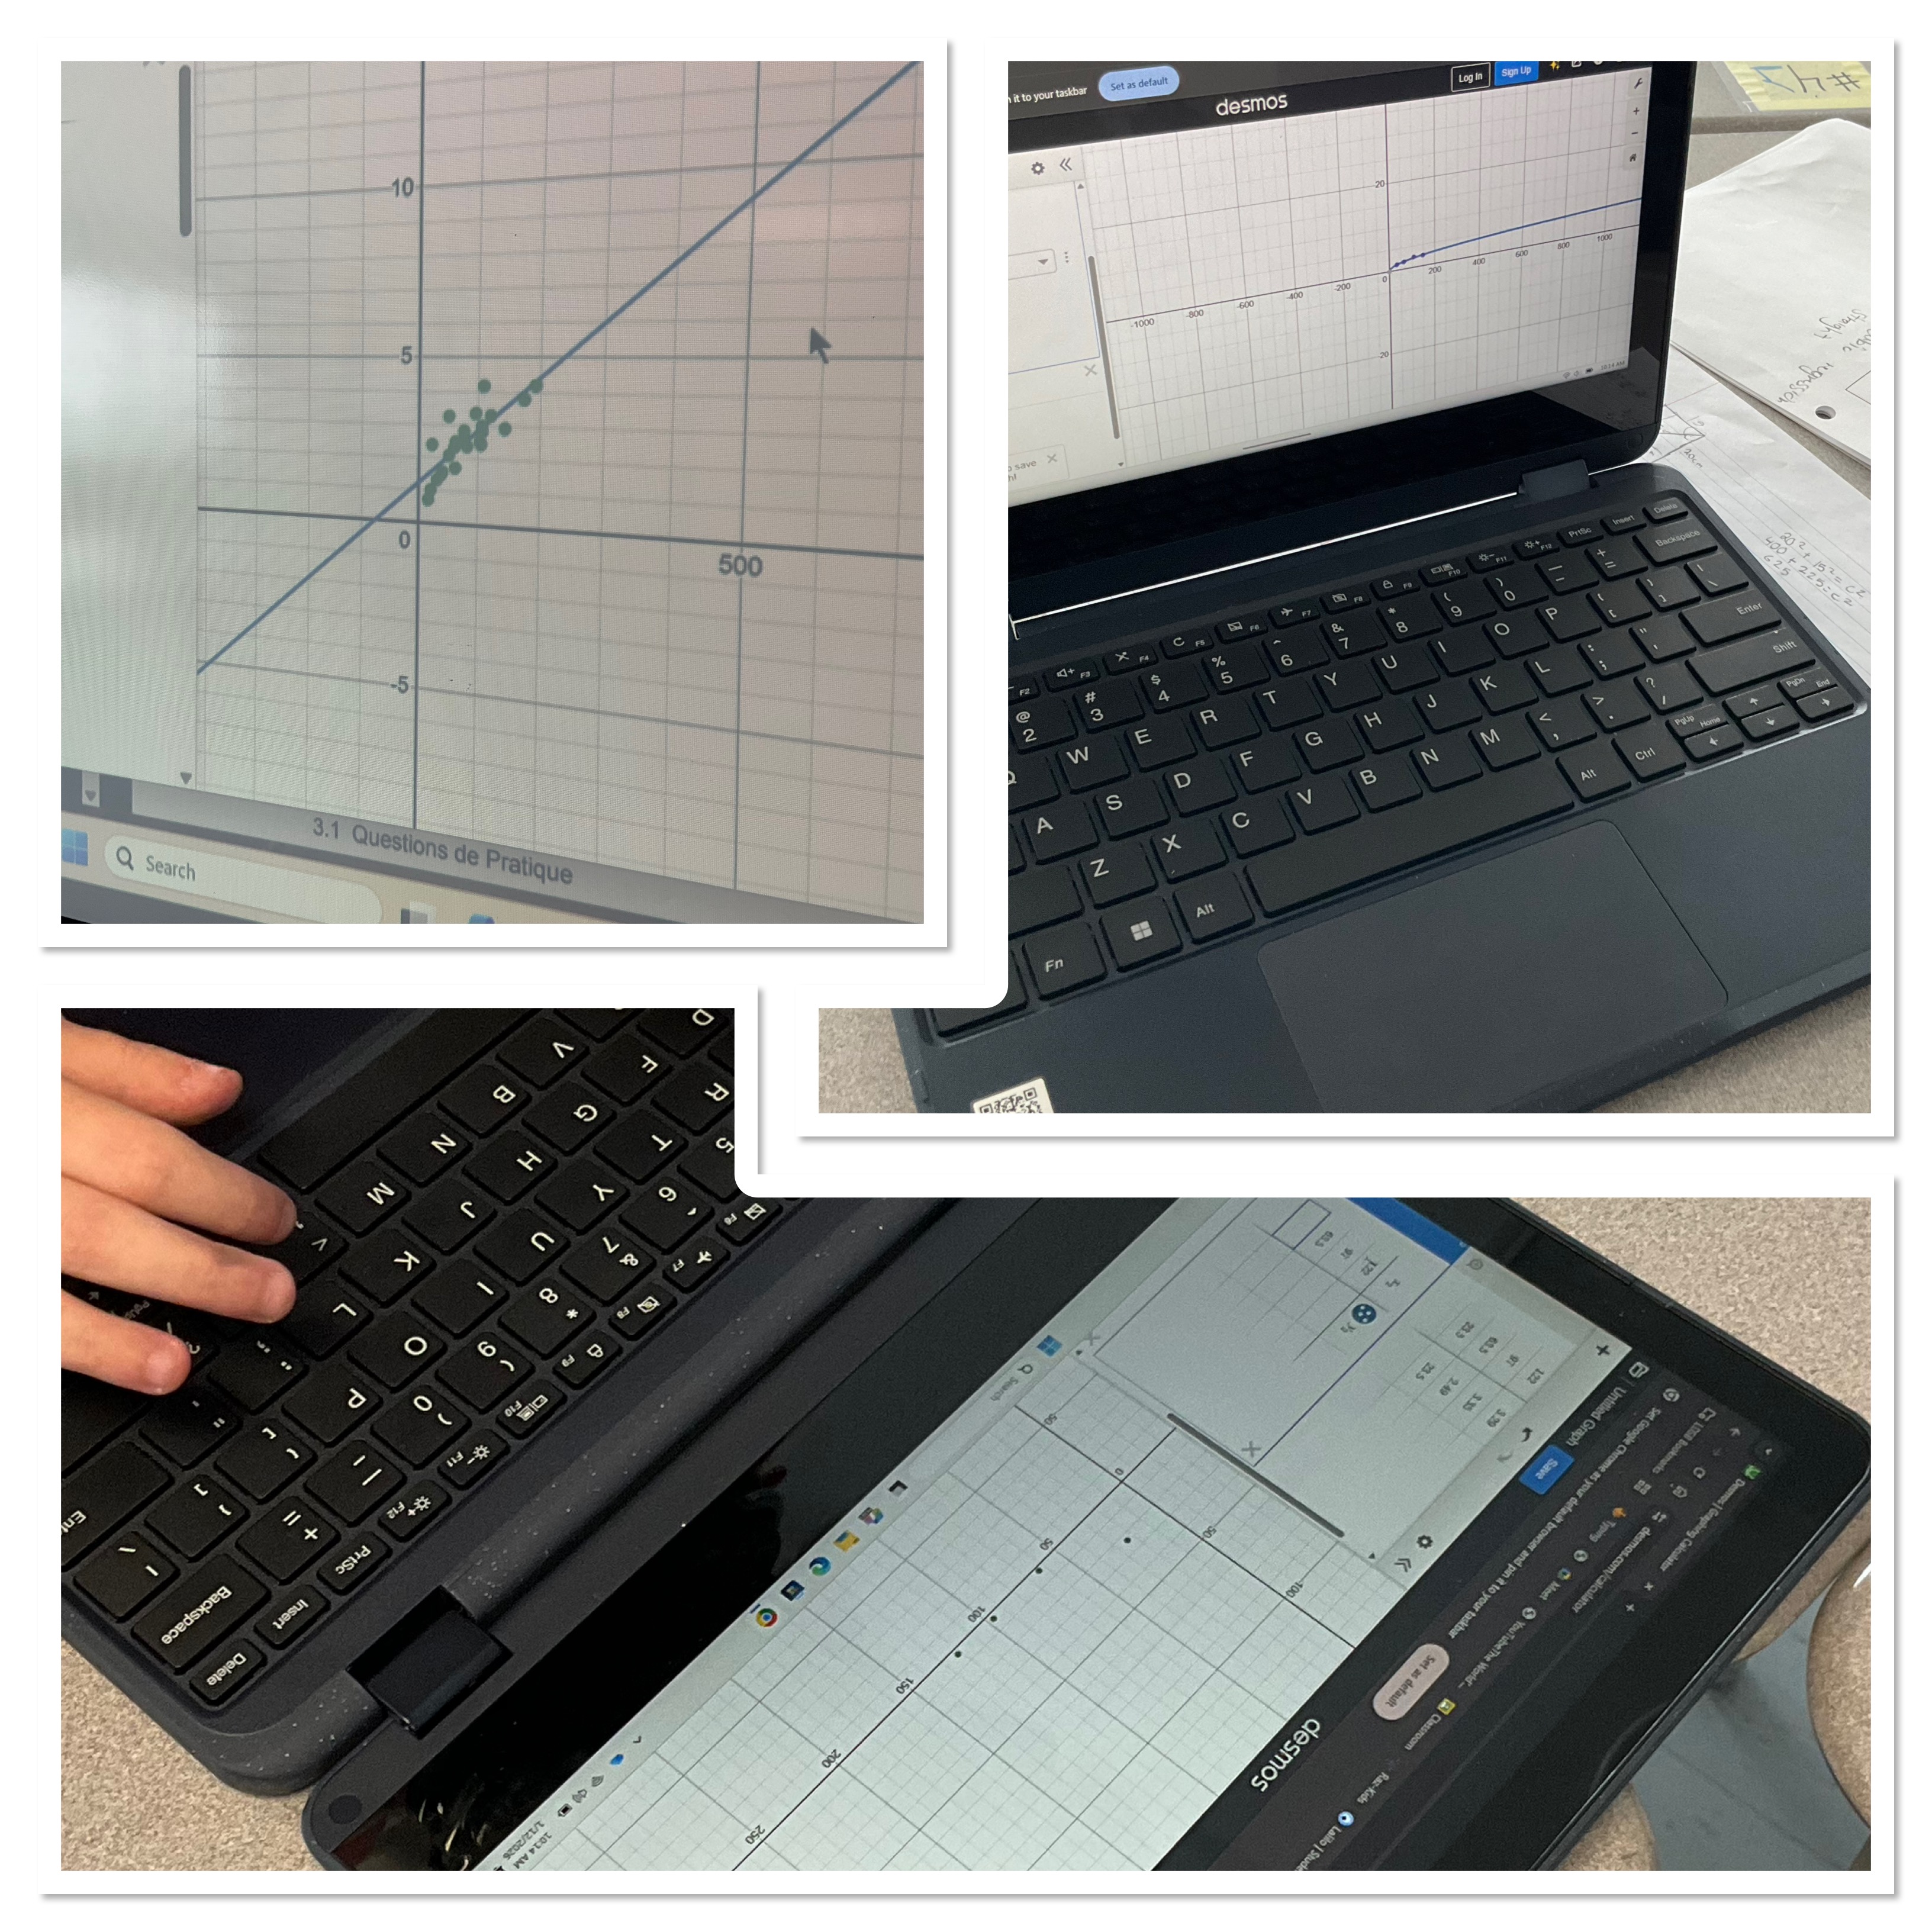
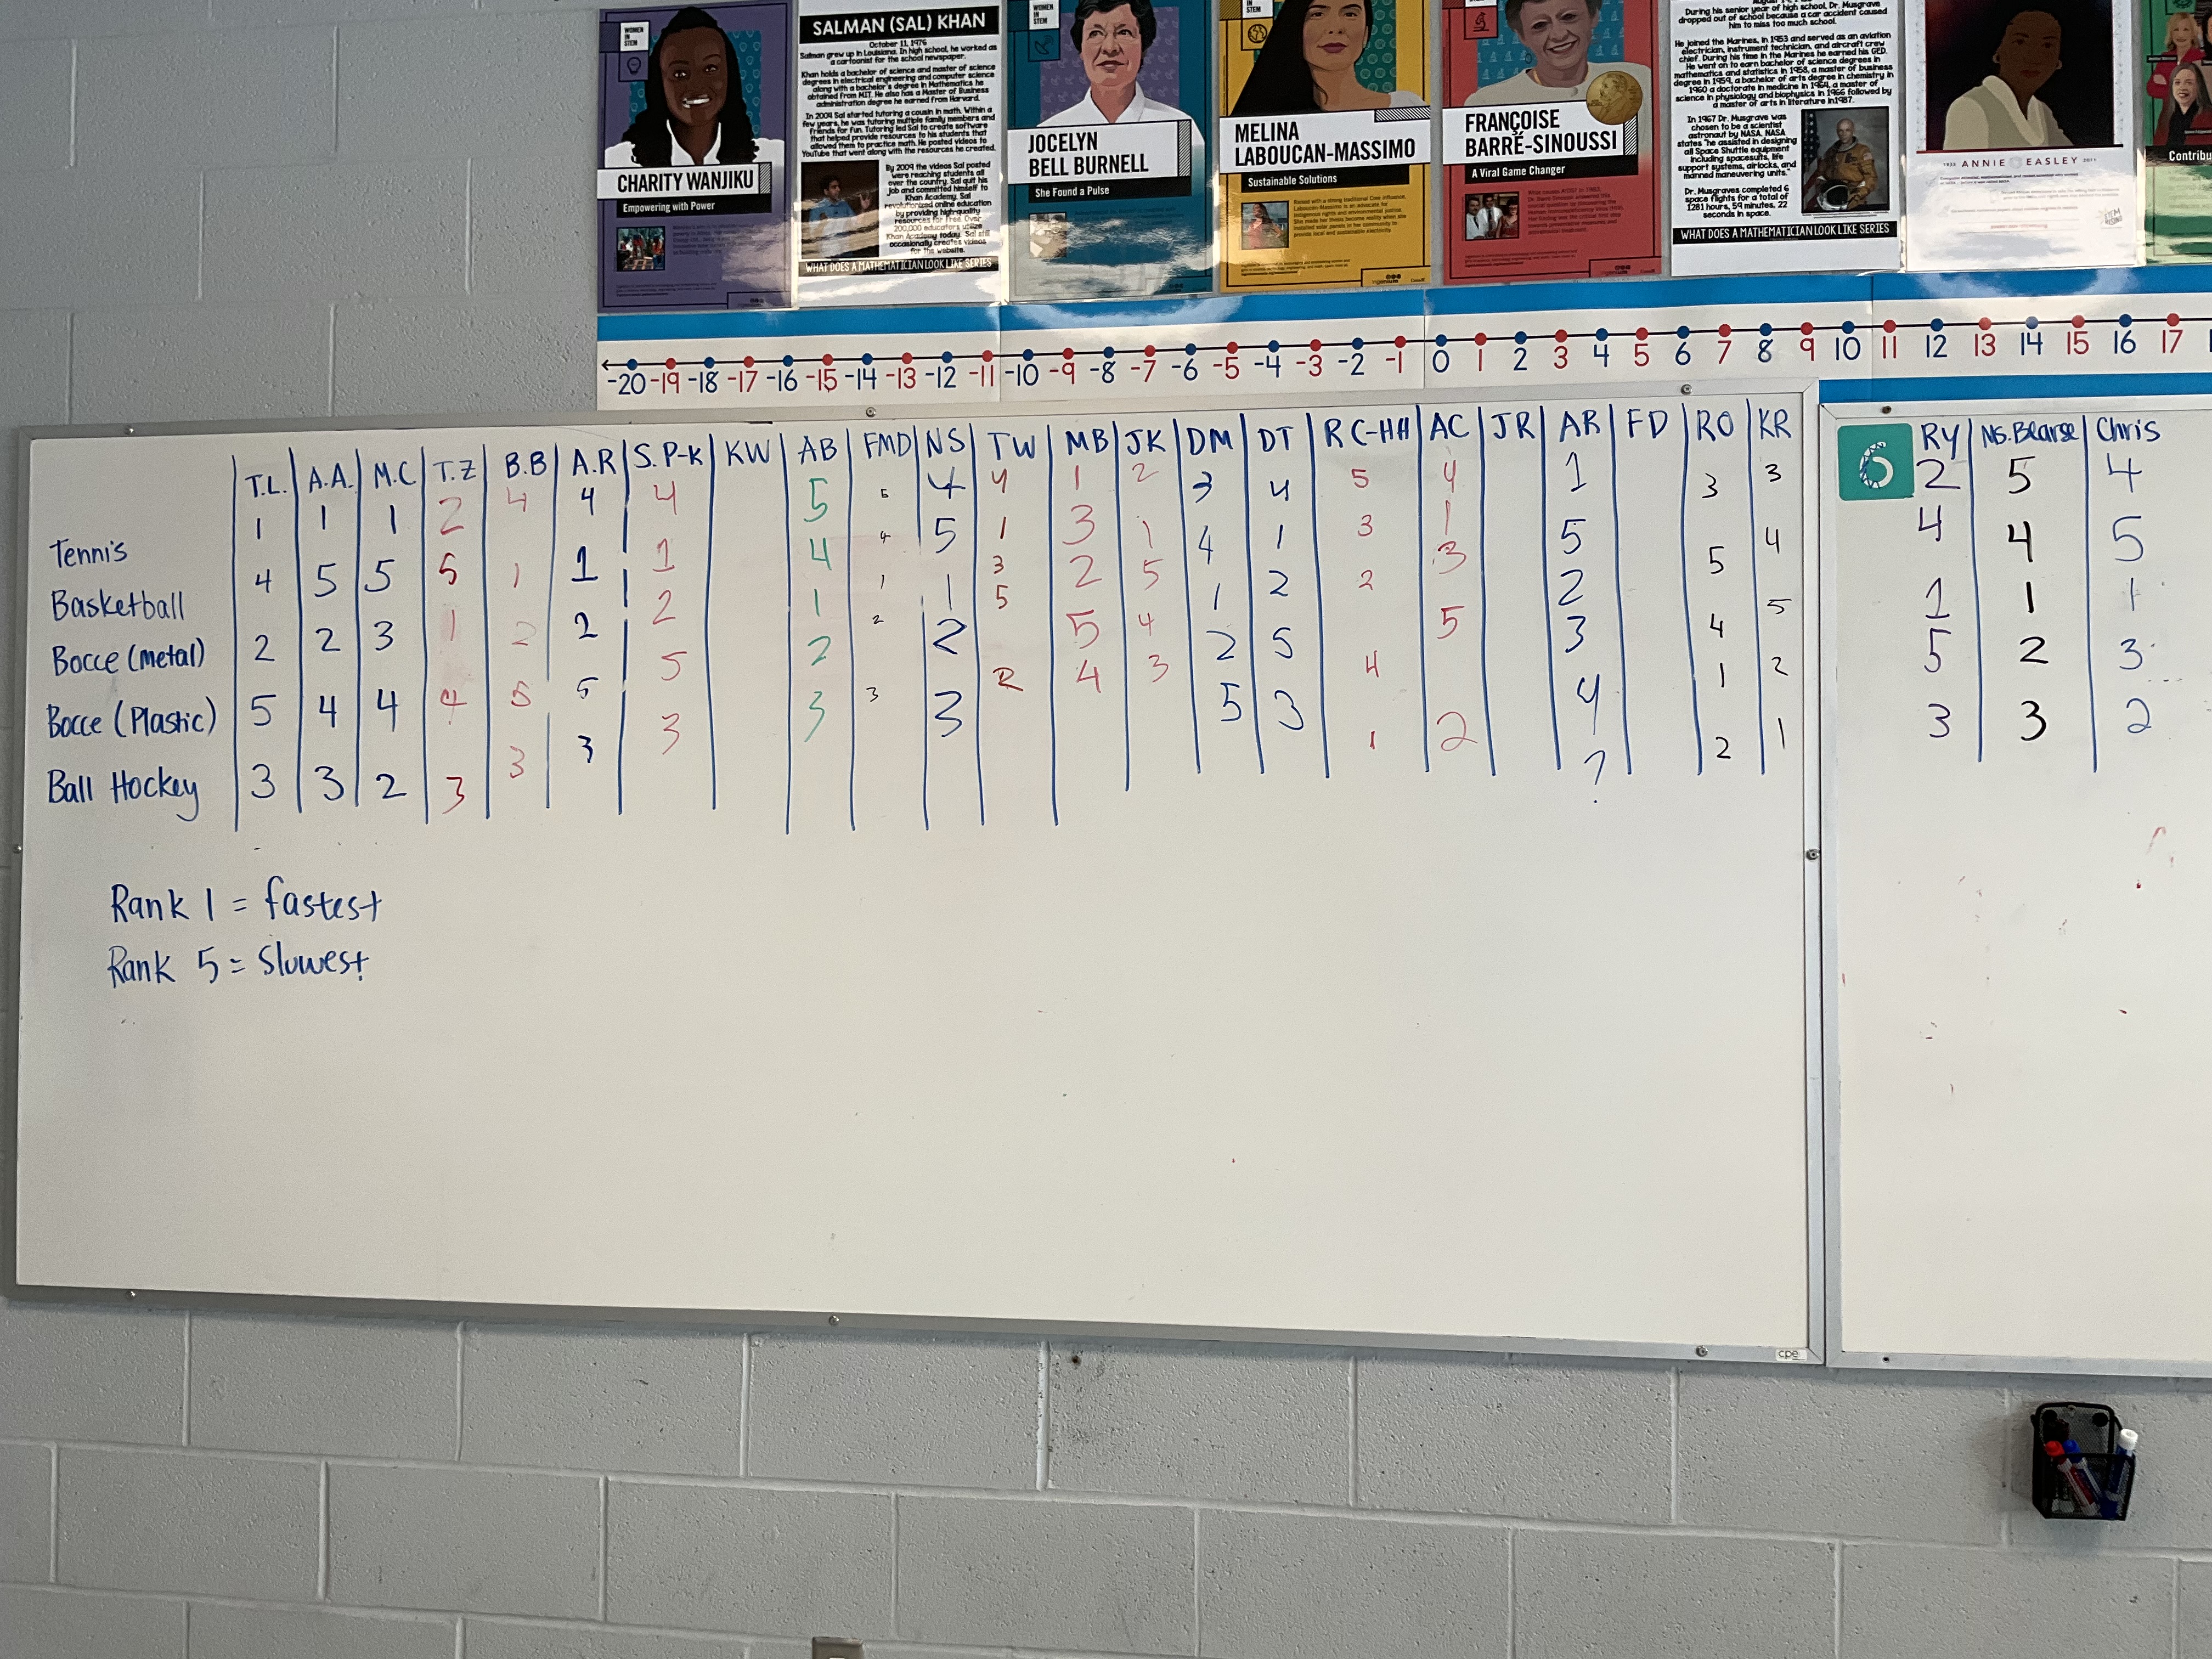
We spent some time at the start of class making graphs by hand and with Desmos in our groups, and then using them to predict what we thought would be the end results.
We looked at some composite graphs from all the groups, and since class I made one with ALL of the data here
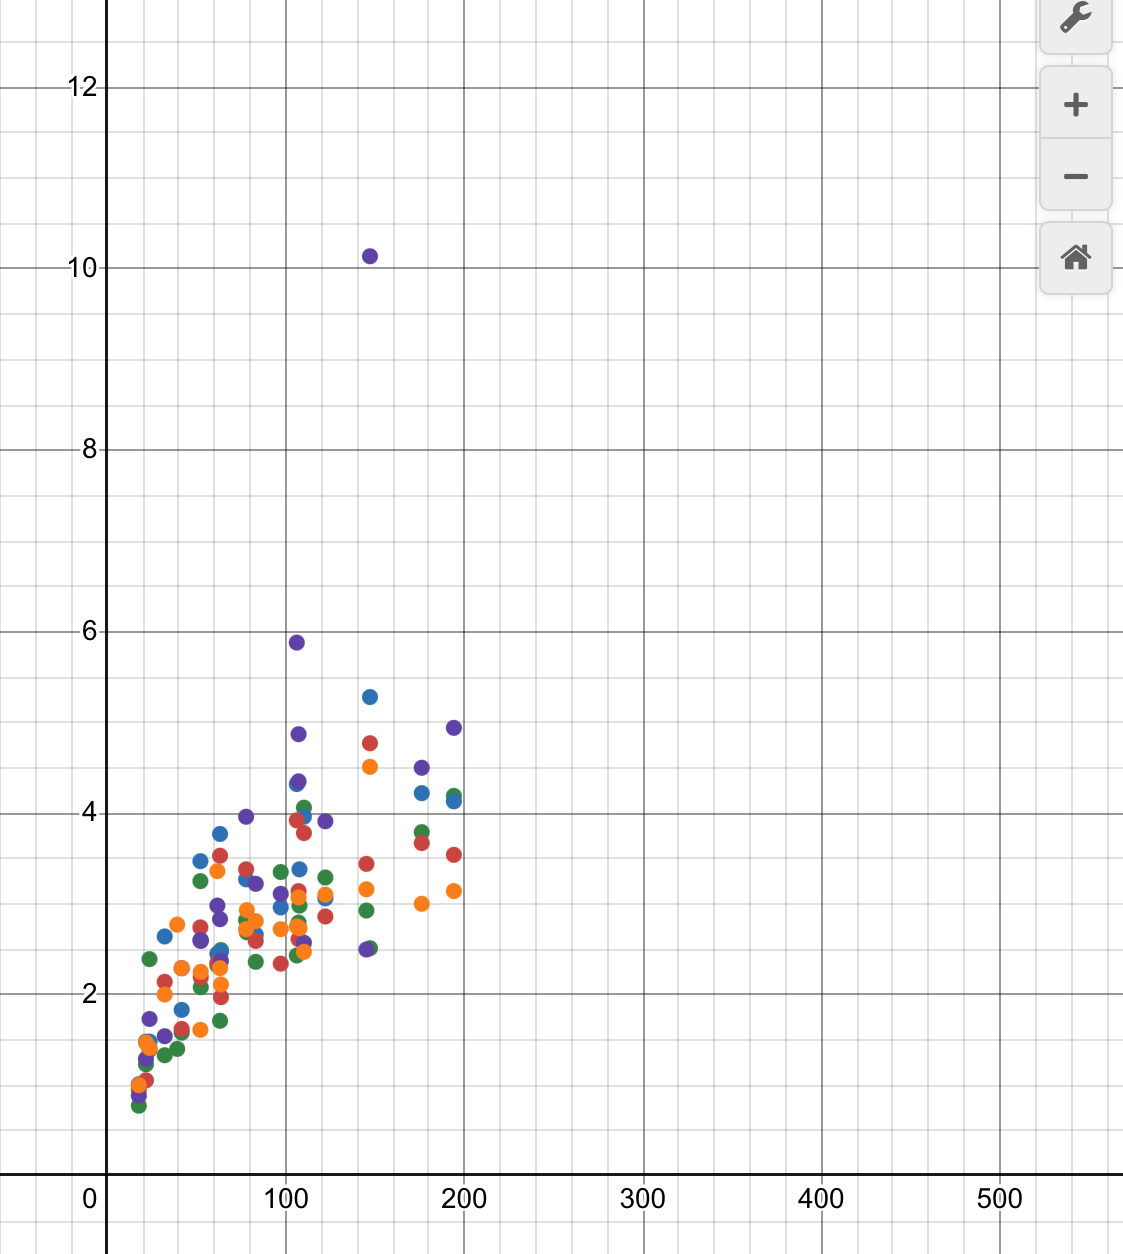
We can see a non linear trend when we have lots of data together, but most groups assumed that their 4 points of data could be fit with a line.
Once we had locked in our choices, we went downstairs to the ramp to do our final trial. We lifted the meter stick and the balls rolled down the ramp.
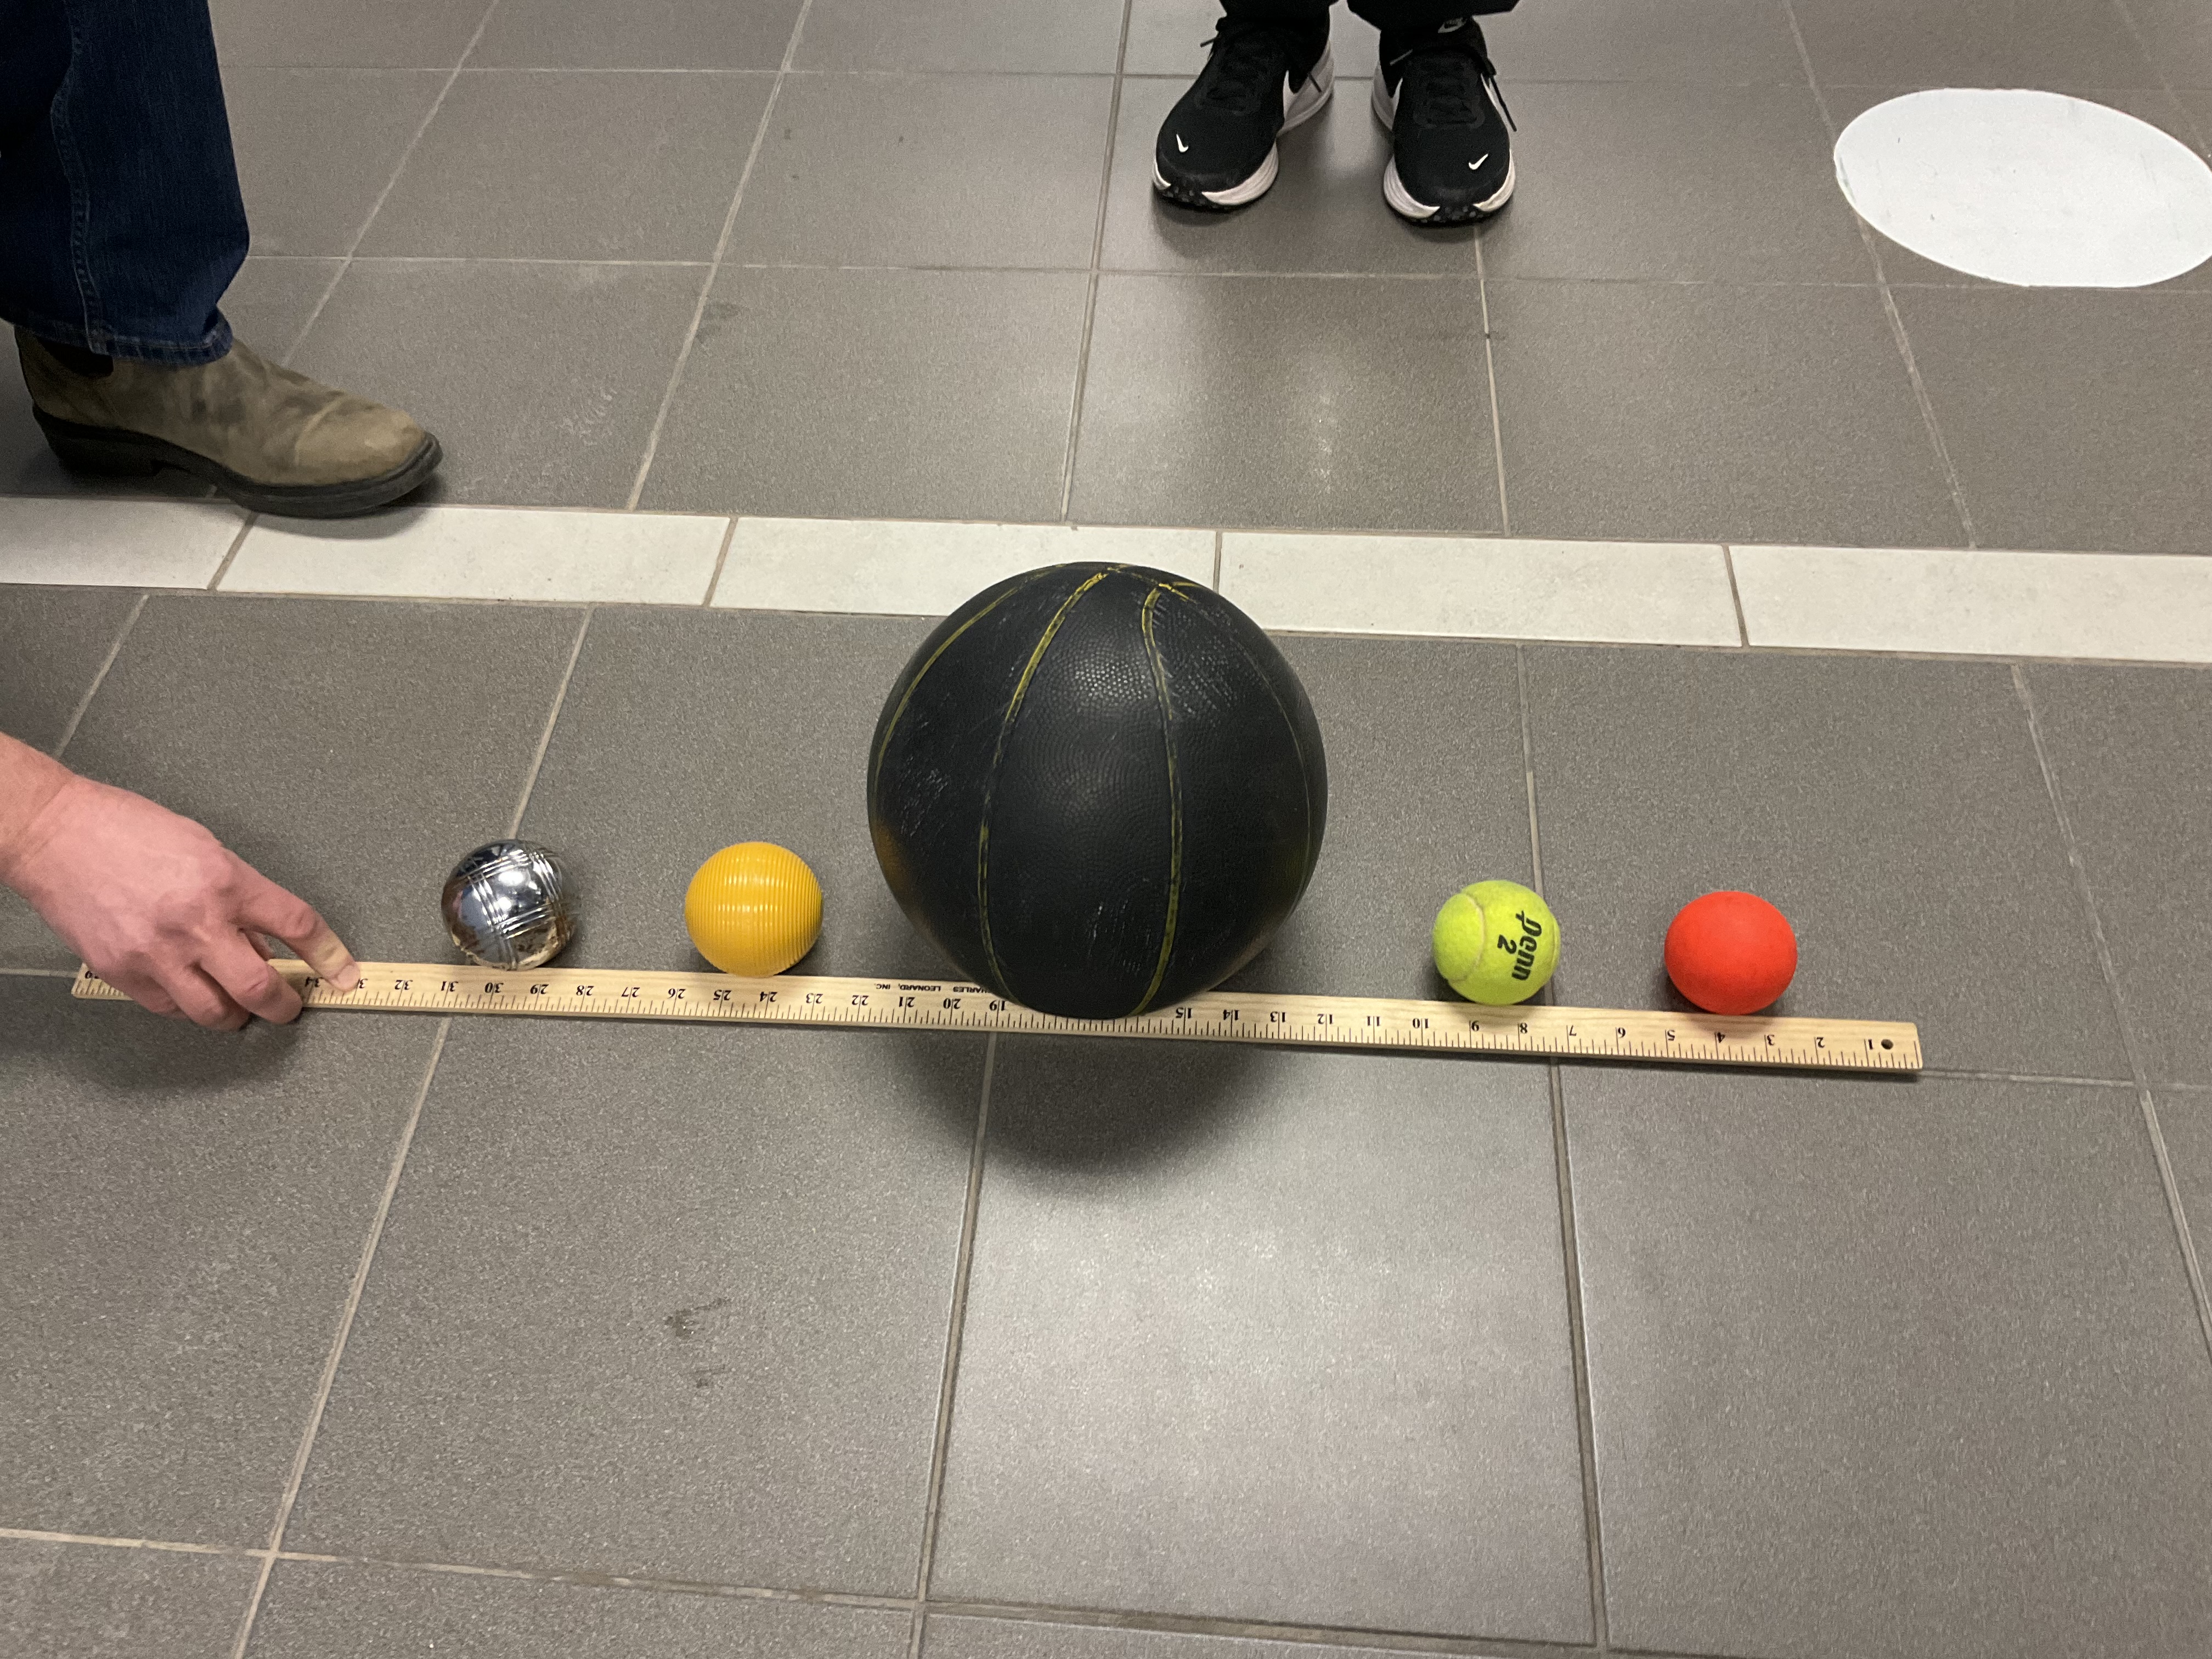
They didn’t roll in straight lines which may impact results slightly. Our order of finishers was: metal bocce, plastic bocce, basketball, ball hockey ball, tennis ball. Nobody in the class guessed the correct order!
We also noticed that the times that we got from our linear predictions were off. We had predicted that it would take more time than it did for the balls to finish the race, so that’s more proof that the graphs are non-linear.
Many thanks for everyone helping to make this a smooth activity! Students worked really hard.
