Popcorn Pandemonium
Today I was invited to work with a grade 9 class with the goal of exploring systems of equations. I love the 3 act task popcorn pandemonium, so that’s was the game plan to start.
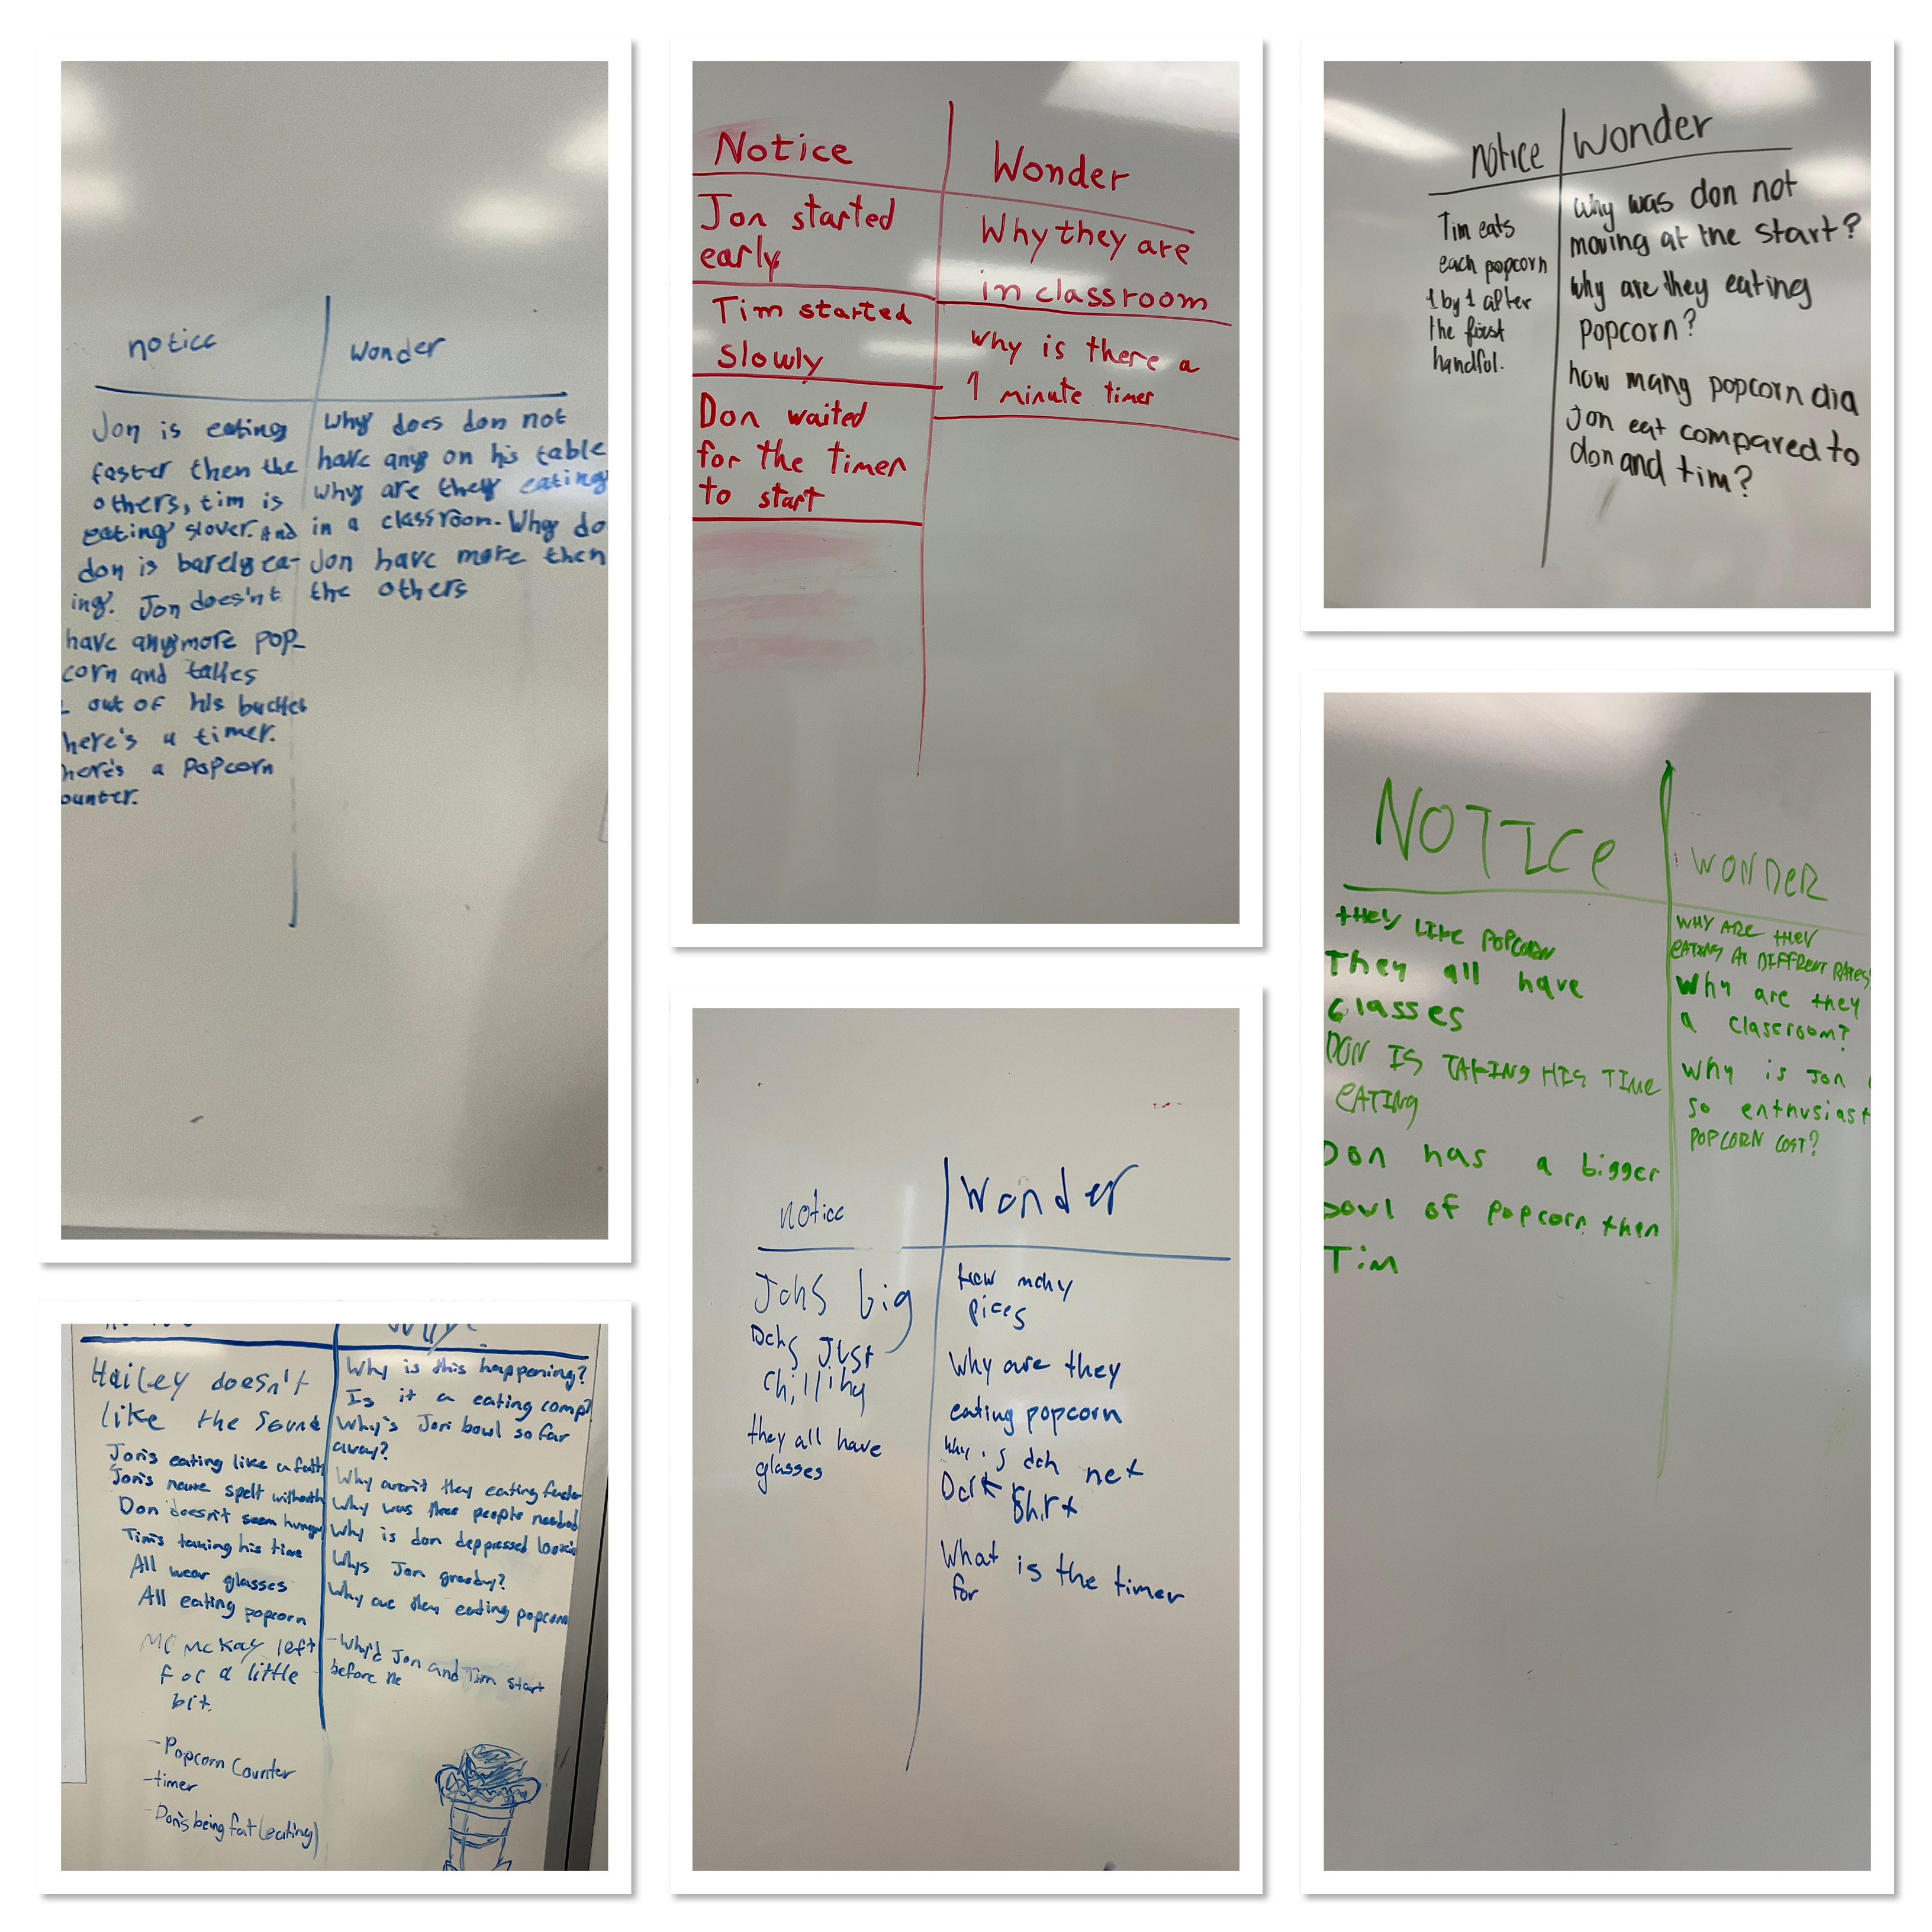
We watched the video and noticed and wondered. This class has come a long way since September with their ability to dive into a task and try to figure things out.
Next we watched the act 2 video
we made use of the extra information in the video to model the popcorn eaten, and to figure out who would eat more after 1 minute (when the timer elapsed)
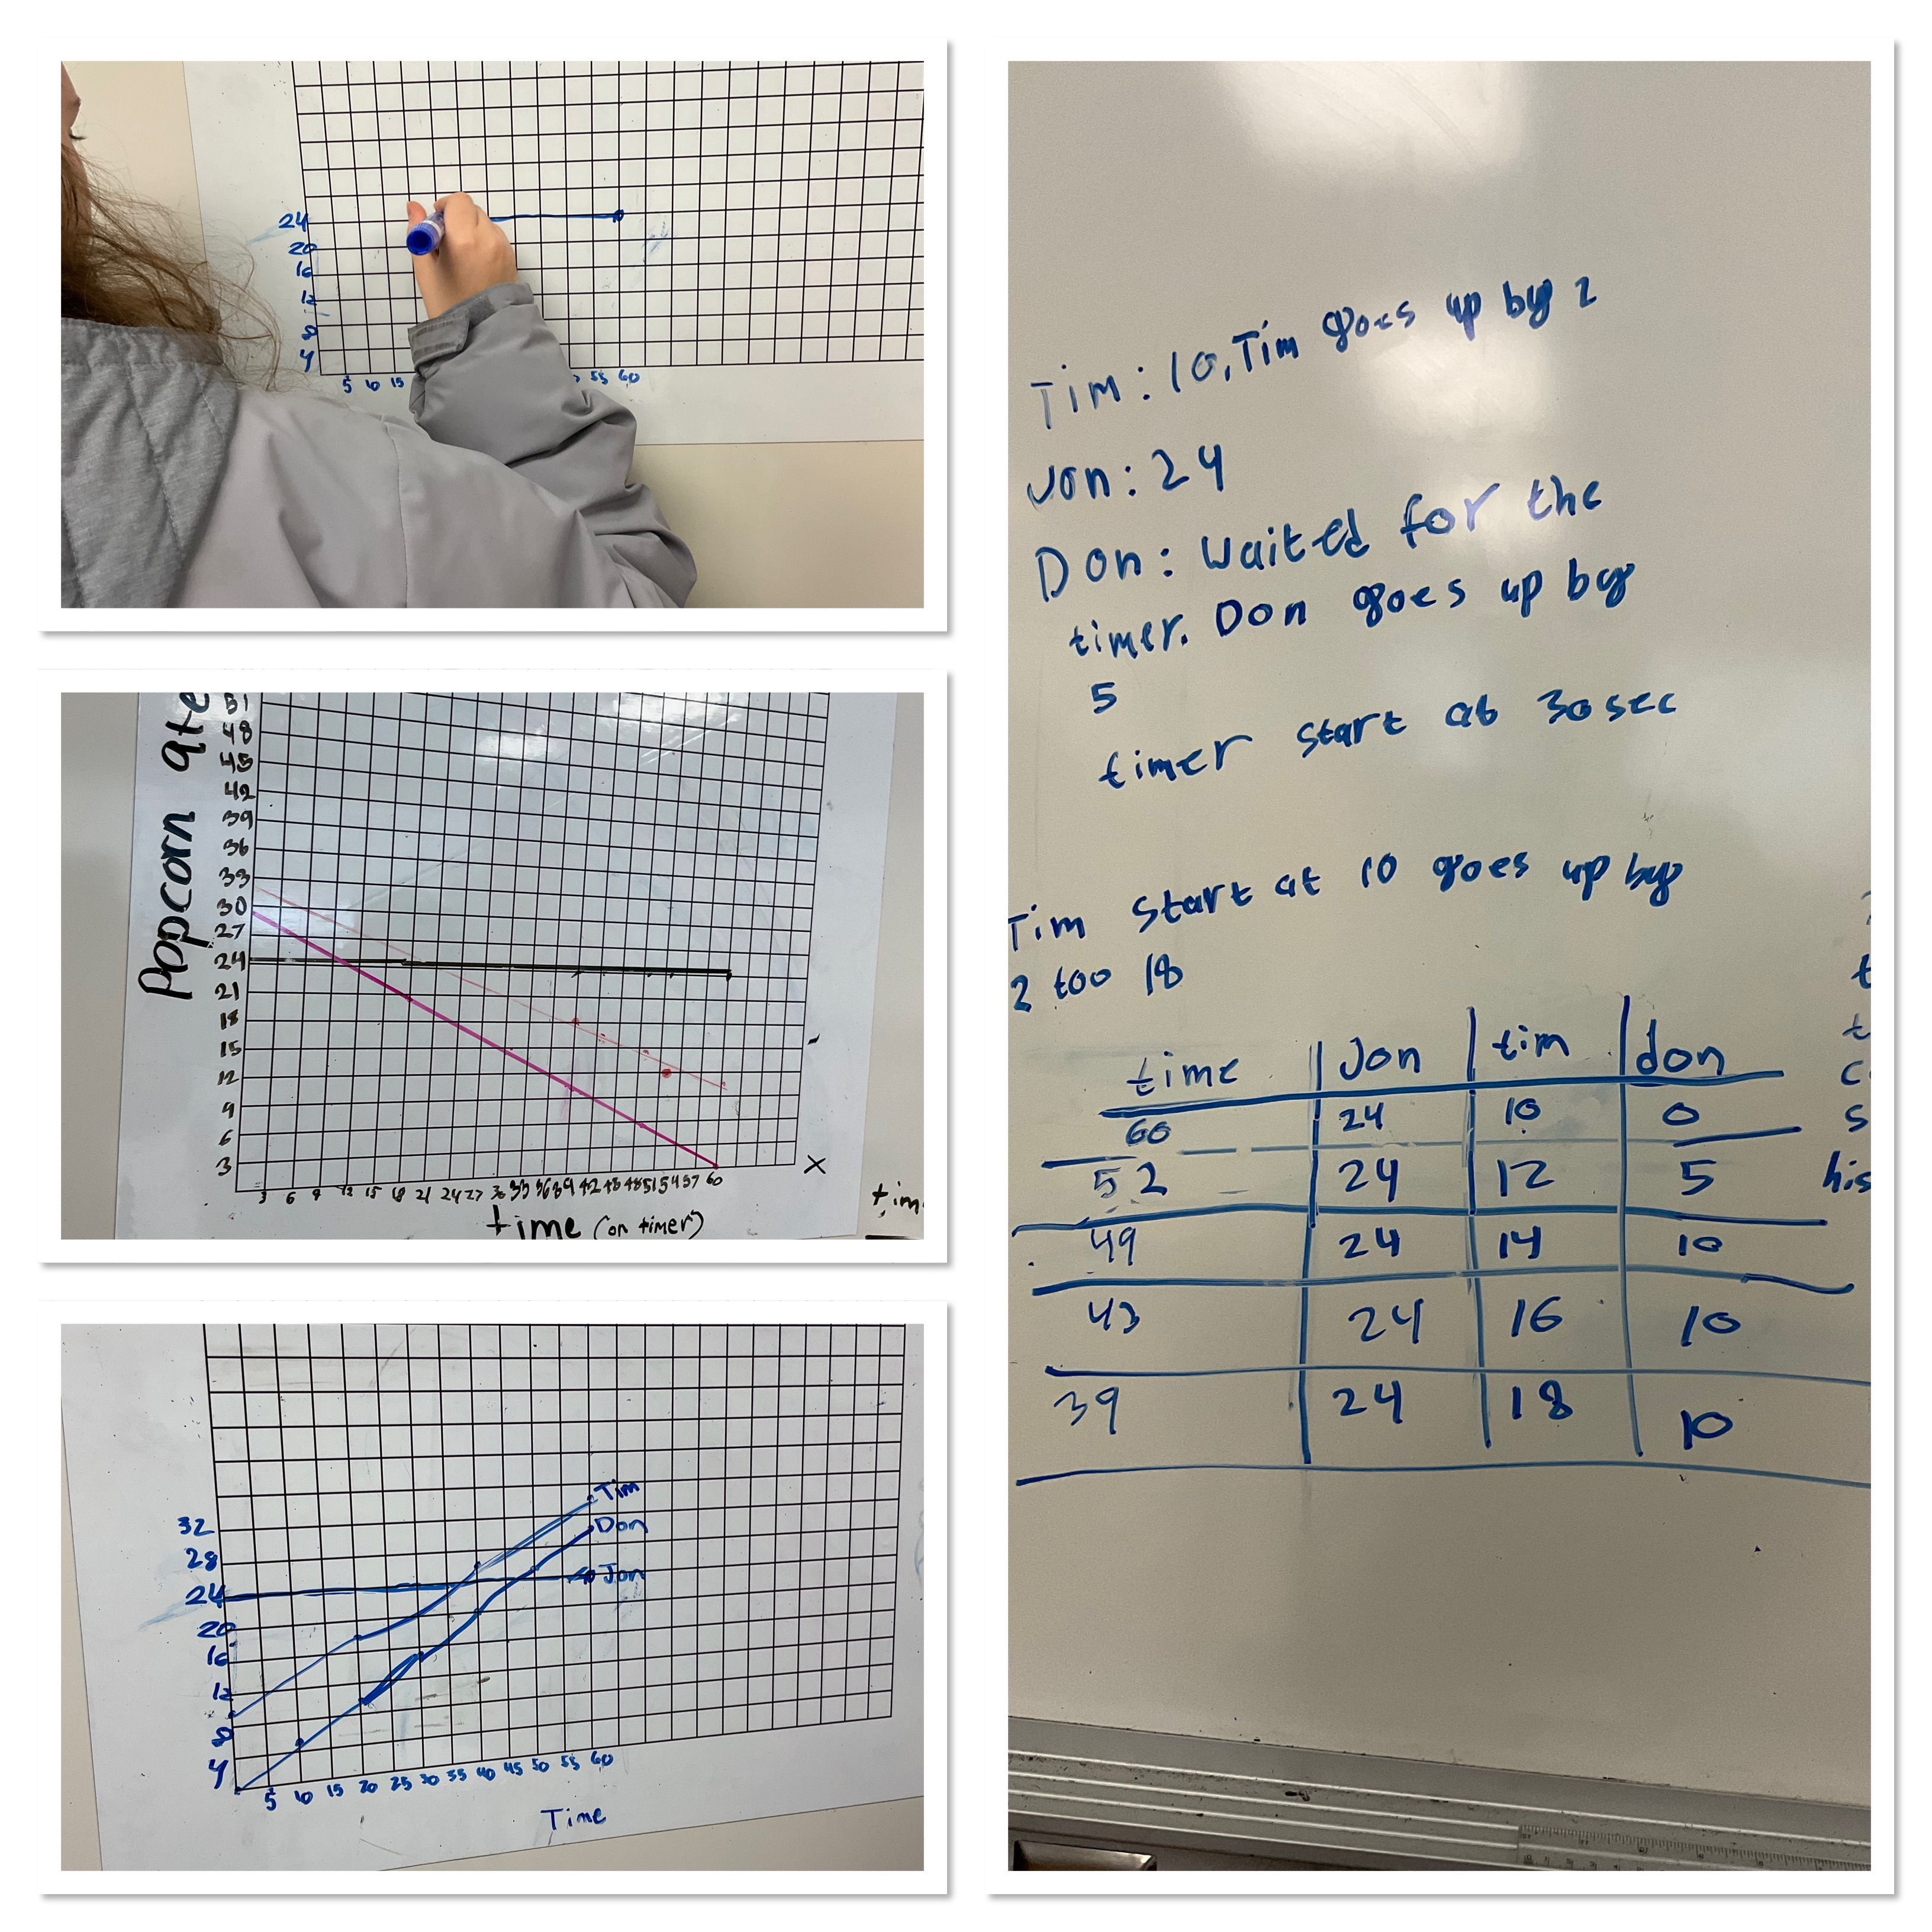
This class had a few different ways to approach time, time elapsed, or time remaining on the counter, so some saw the graphs come together in a different way, looking at what the values of popcorn would be when the timer was at 0 (the y intercept). This is why some groups had negative slopes and some had positive. We didn’t correct/clarify as they worked, because the problem could be solved by either interpretation.
Here’s the graph that we made
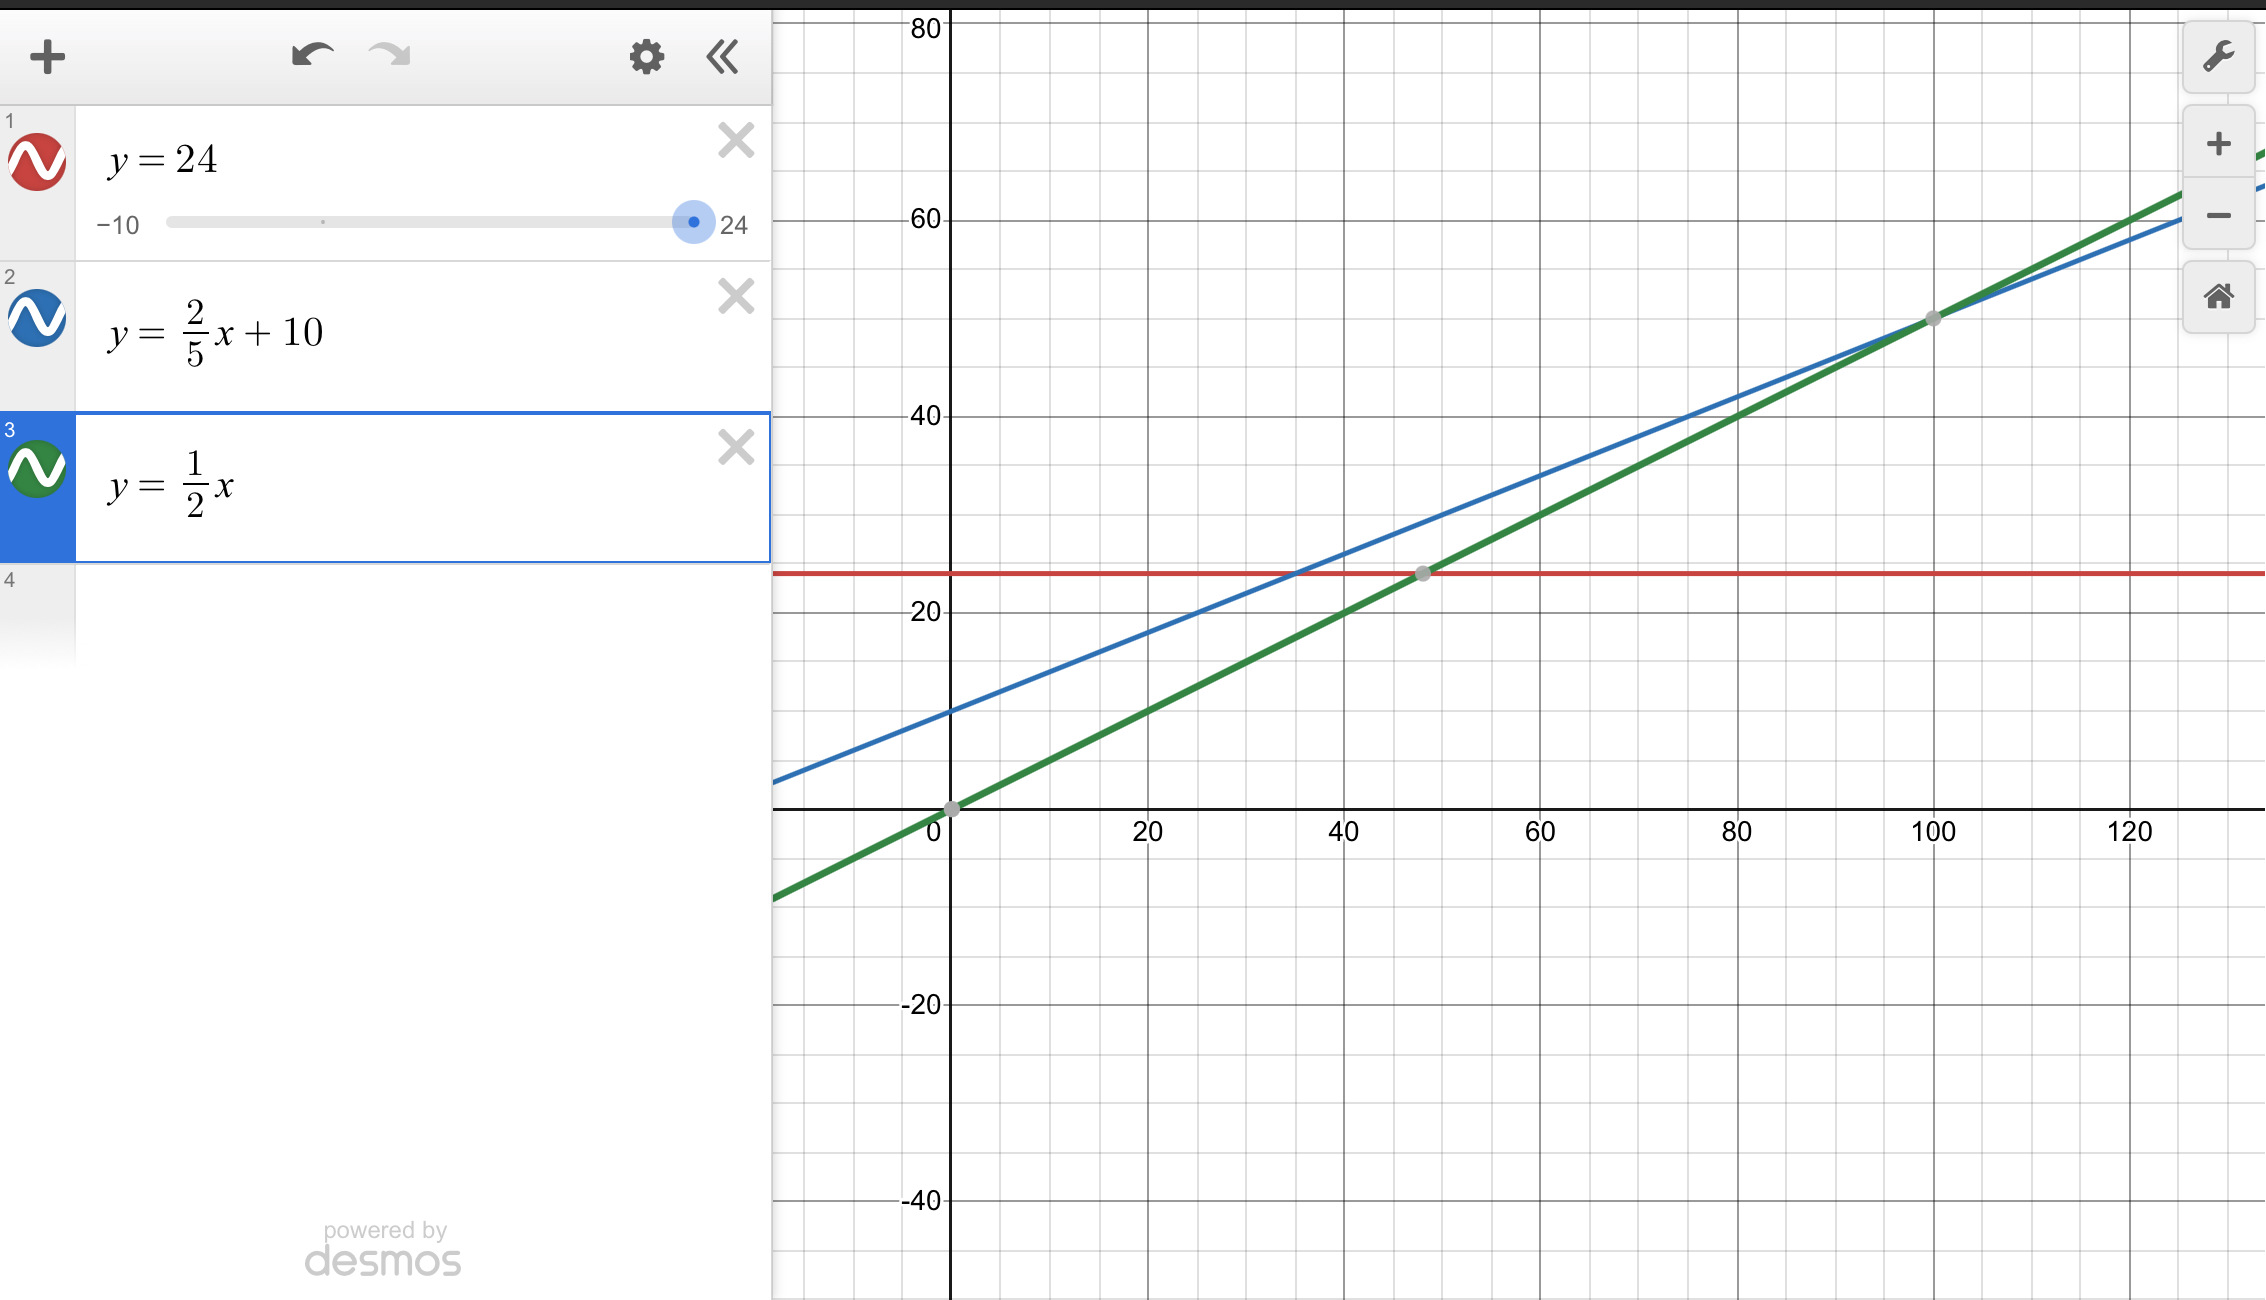
From the graph we looked at who would eat the most popcorn at the 1 minute mark. Next we looked to see if we wanted Don to win, how long would they need to eat for. This brings inequalities into the discussion. For t>100 Don wins. We looked at the point of intersection as the “tie” and then for t<35 Jon wins, and for 35<t<100 Tim wins. We could see lots of points of intersection to explore all the different “ties” possible.
Next we looked at what would happen if Don ate slower, or if Tim had a different head start, and how that would affect the graphs. If 2 ate at the same rate, but one had a head start, they’d never have an intersection because their lines would be parallel etc.
We could explore a lot through this task. It was a nice way to get them ready for EQAO and the thinking questions they’ll have to tackle then.
We didn’t get to watch the 3rd act because we were so deep into debriefing the act 2 math, but here’s the video anyway.
