Knot Tying Experiment
After we got our bean data recorded in mfm2p we started a new experiment. We had 2 different lengths and thicknesses of ropes. We measured the lengths, and then tied a knot, then repeated that process as long as we could.
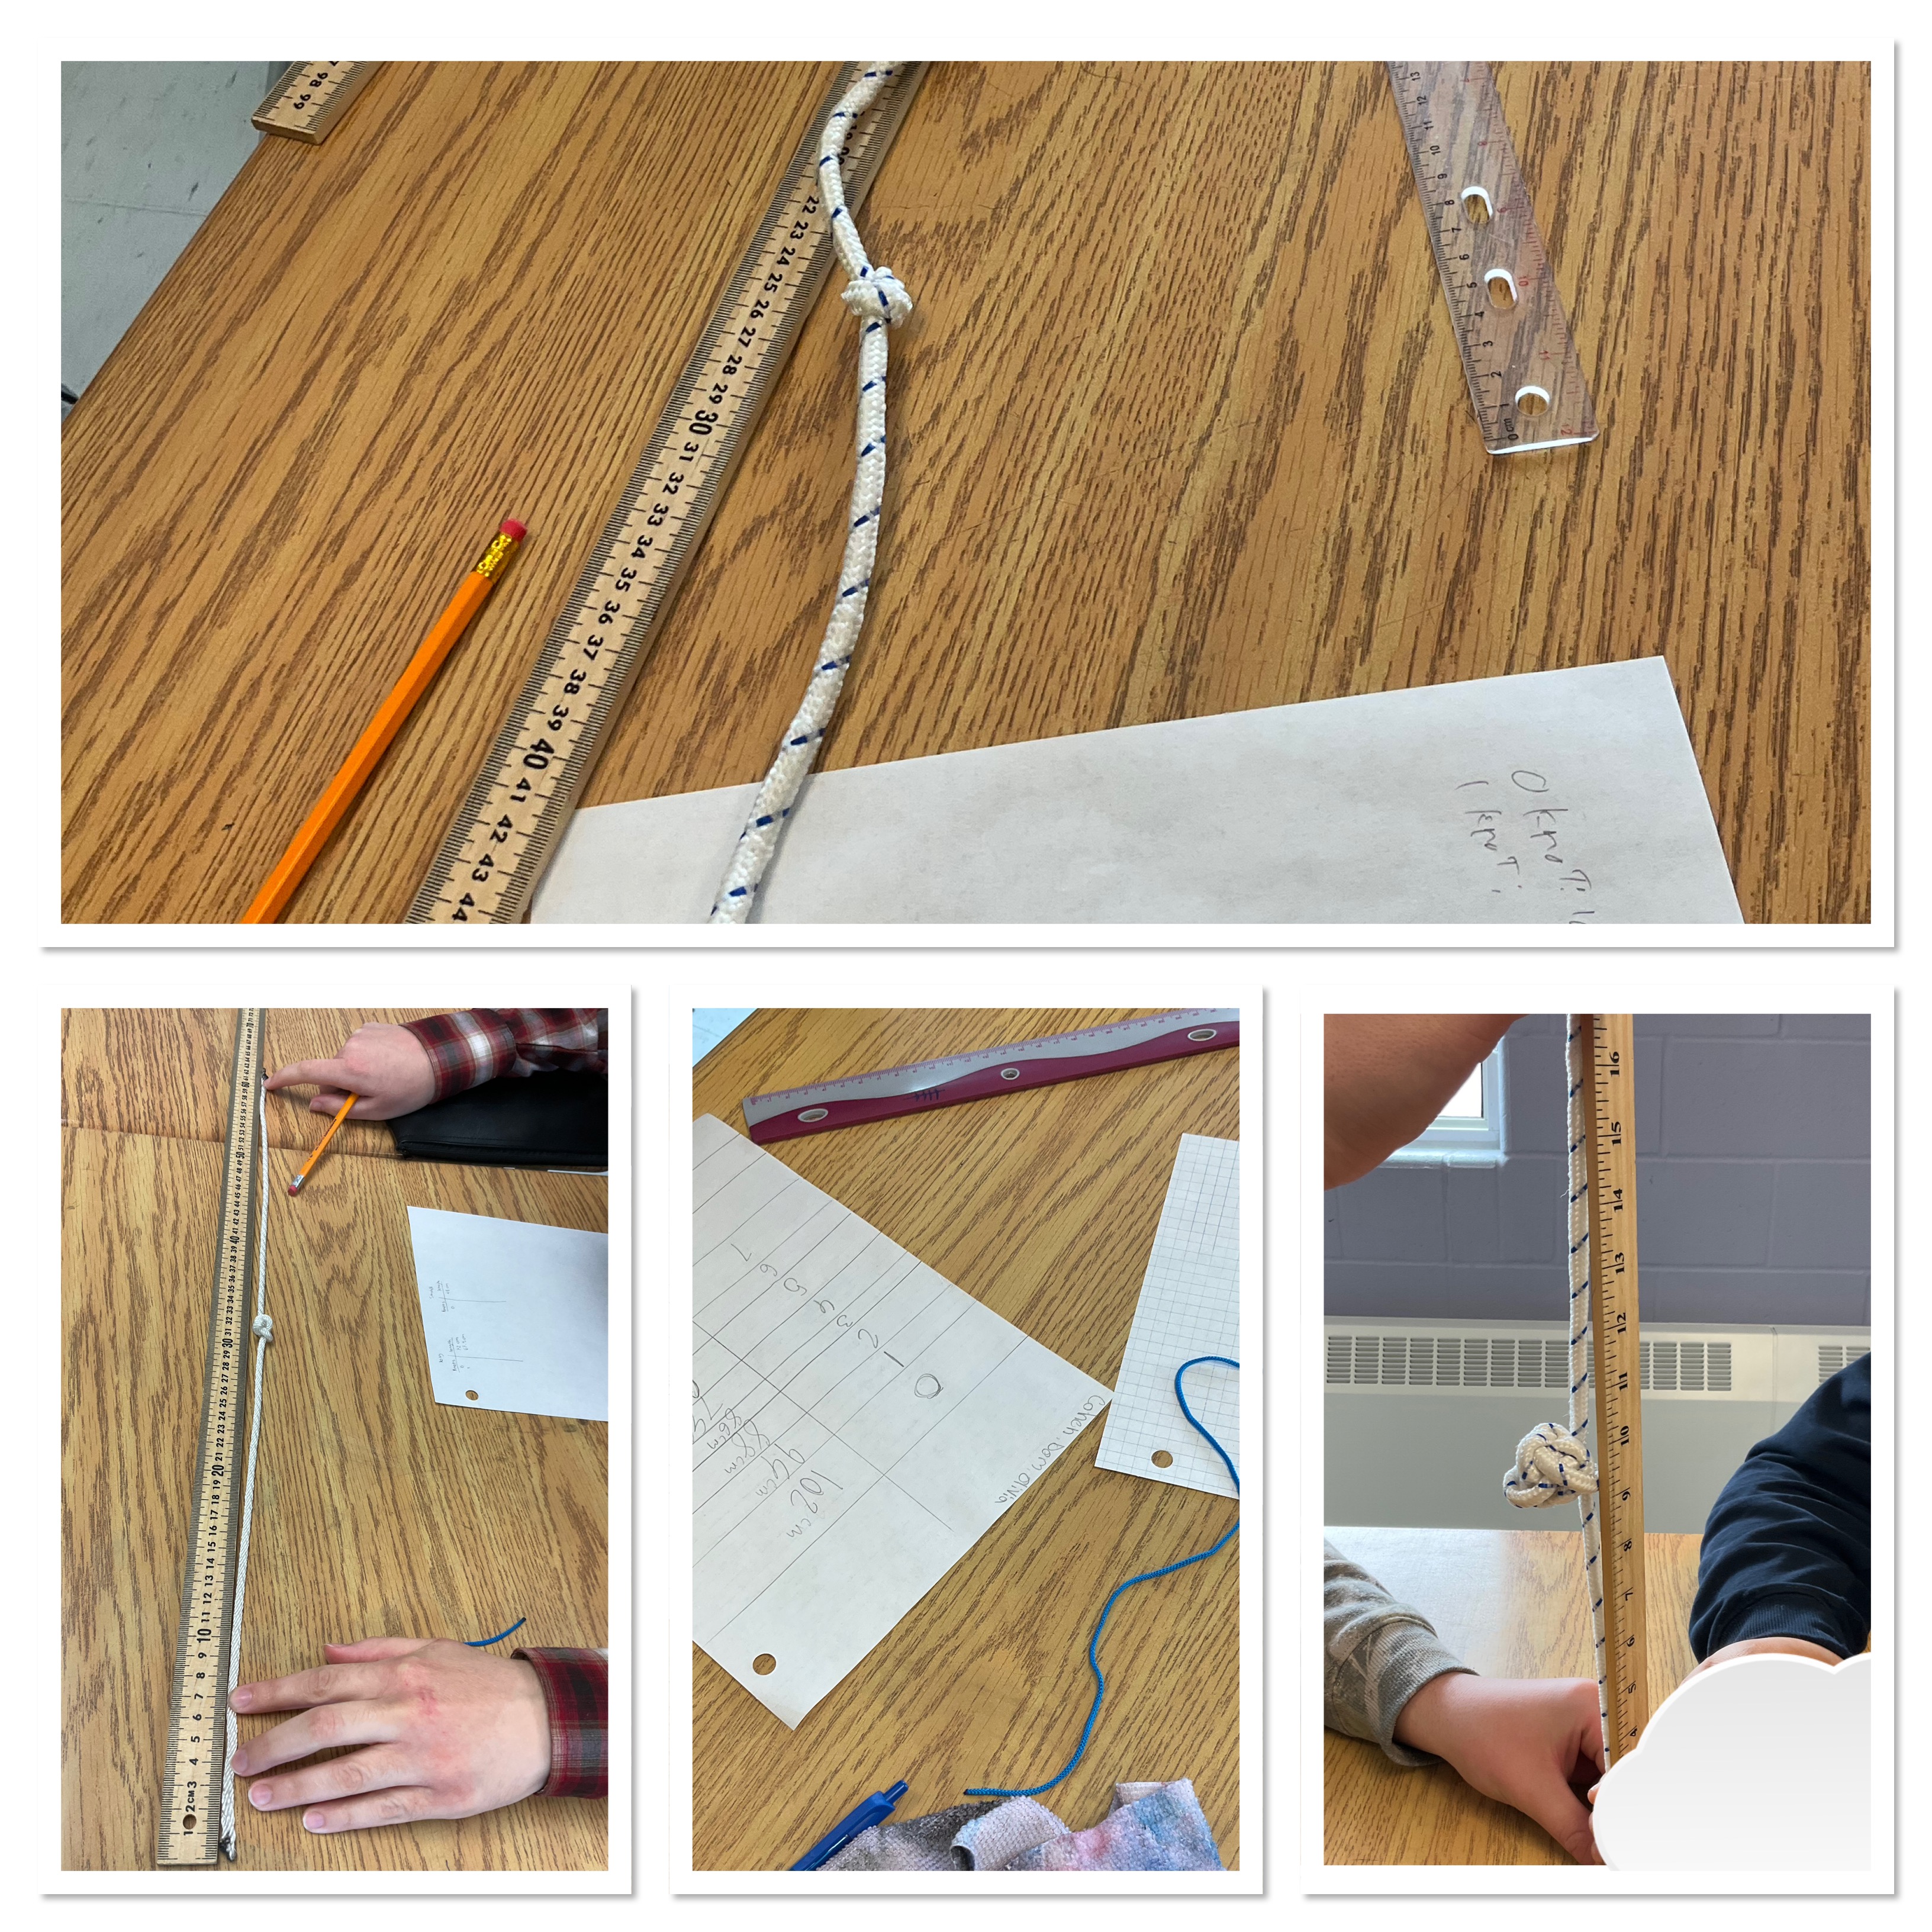
Each time we tied a knot, the rope shrunk. We kept track of the data in a table of values, and then we made graphs of our data.
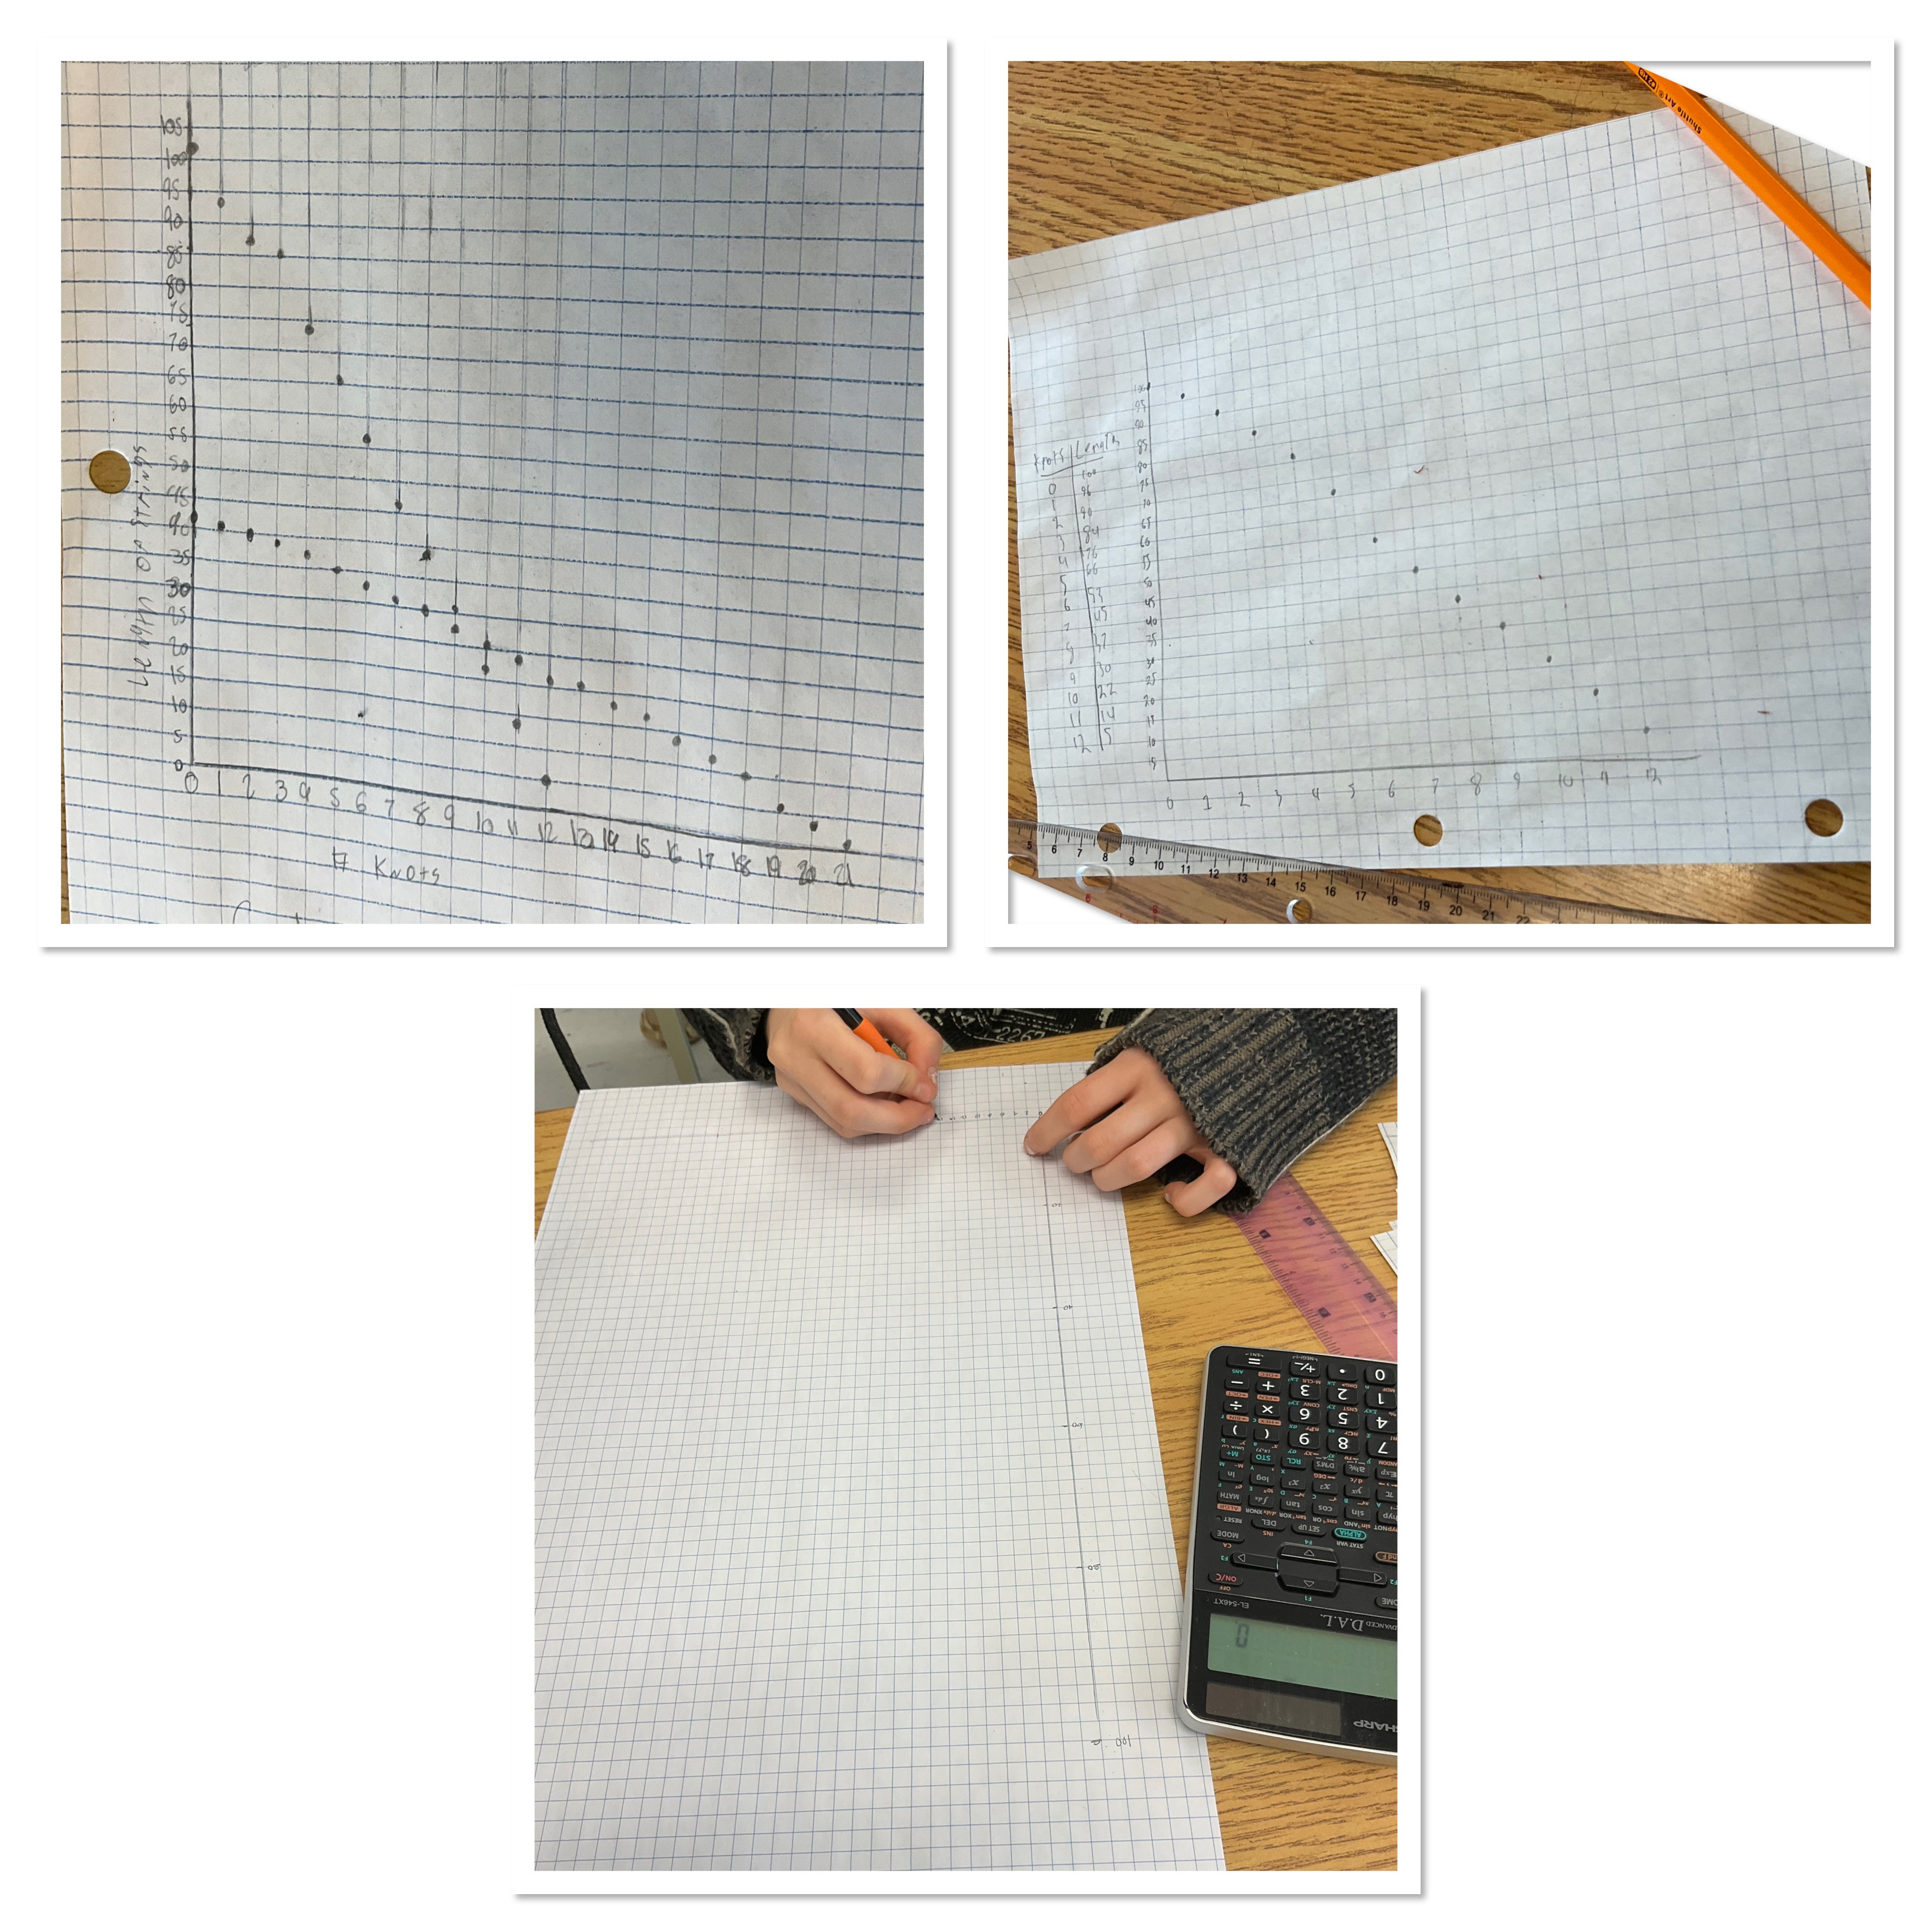
We could make some interesting observations and conclusions. Thicker ropes had lines that were steeper. Each knot used up a lot of rope, so it shrunk a lot. Thin ropes had a less steep slope. Each knot used less rope so the length shrunk less each time. When graphed we could see that the lines crossed. This is the point where the ropes would be the same length with the same number of knots tied.
Further extensions from this task could be modelling the data with equations, and then calculating intersections with an algebraic method.
I’m helping each week to incorporate a modelling/data collection task so that we can work on these skills over the term. It has been great fun so far.
