Update: Beans and Ropes in Grade 10
The grade 10 class I’m working with has been growing beans and measuring them each day.
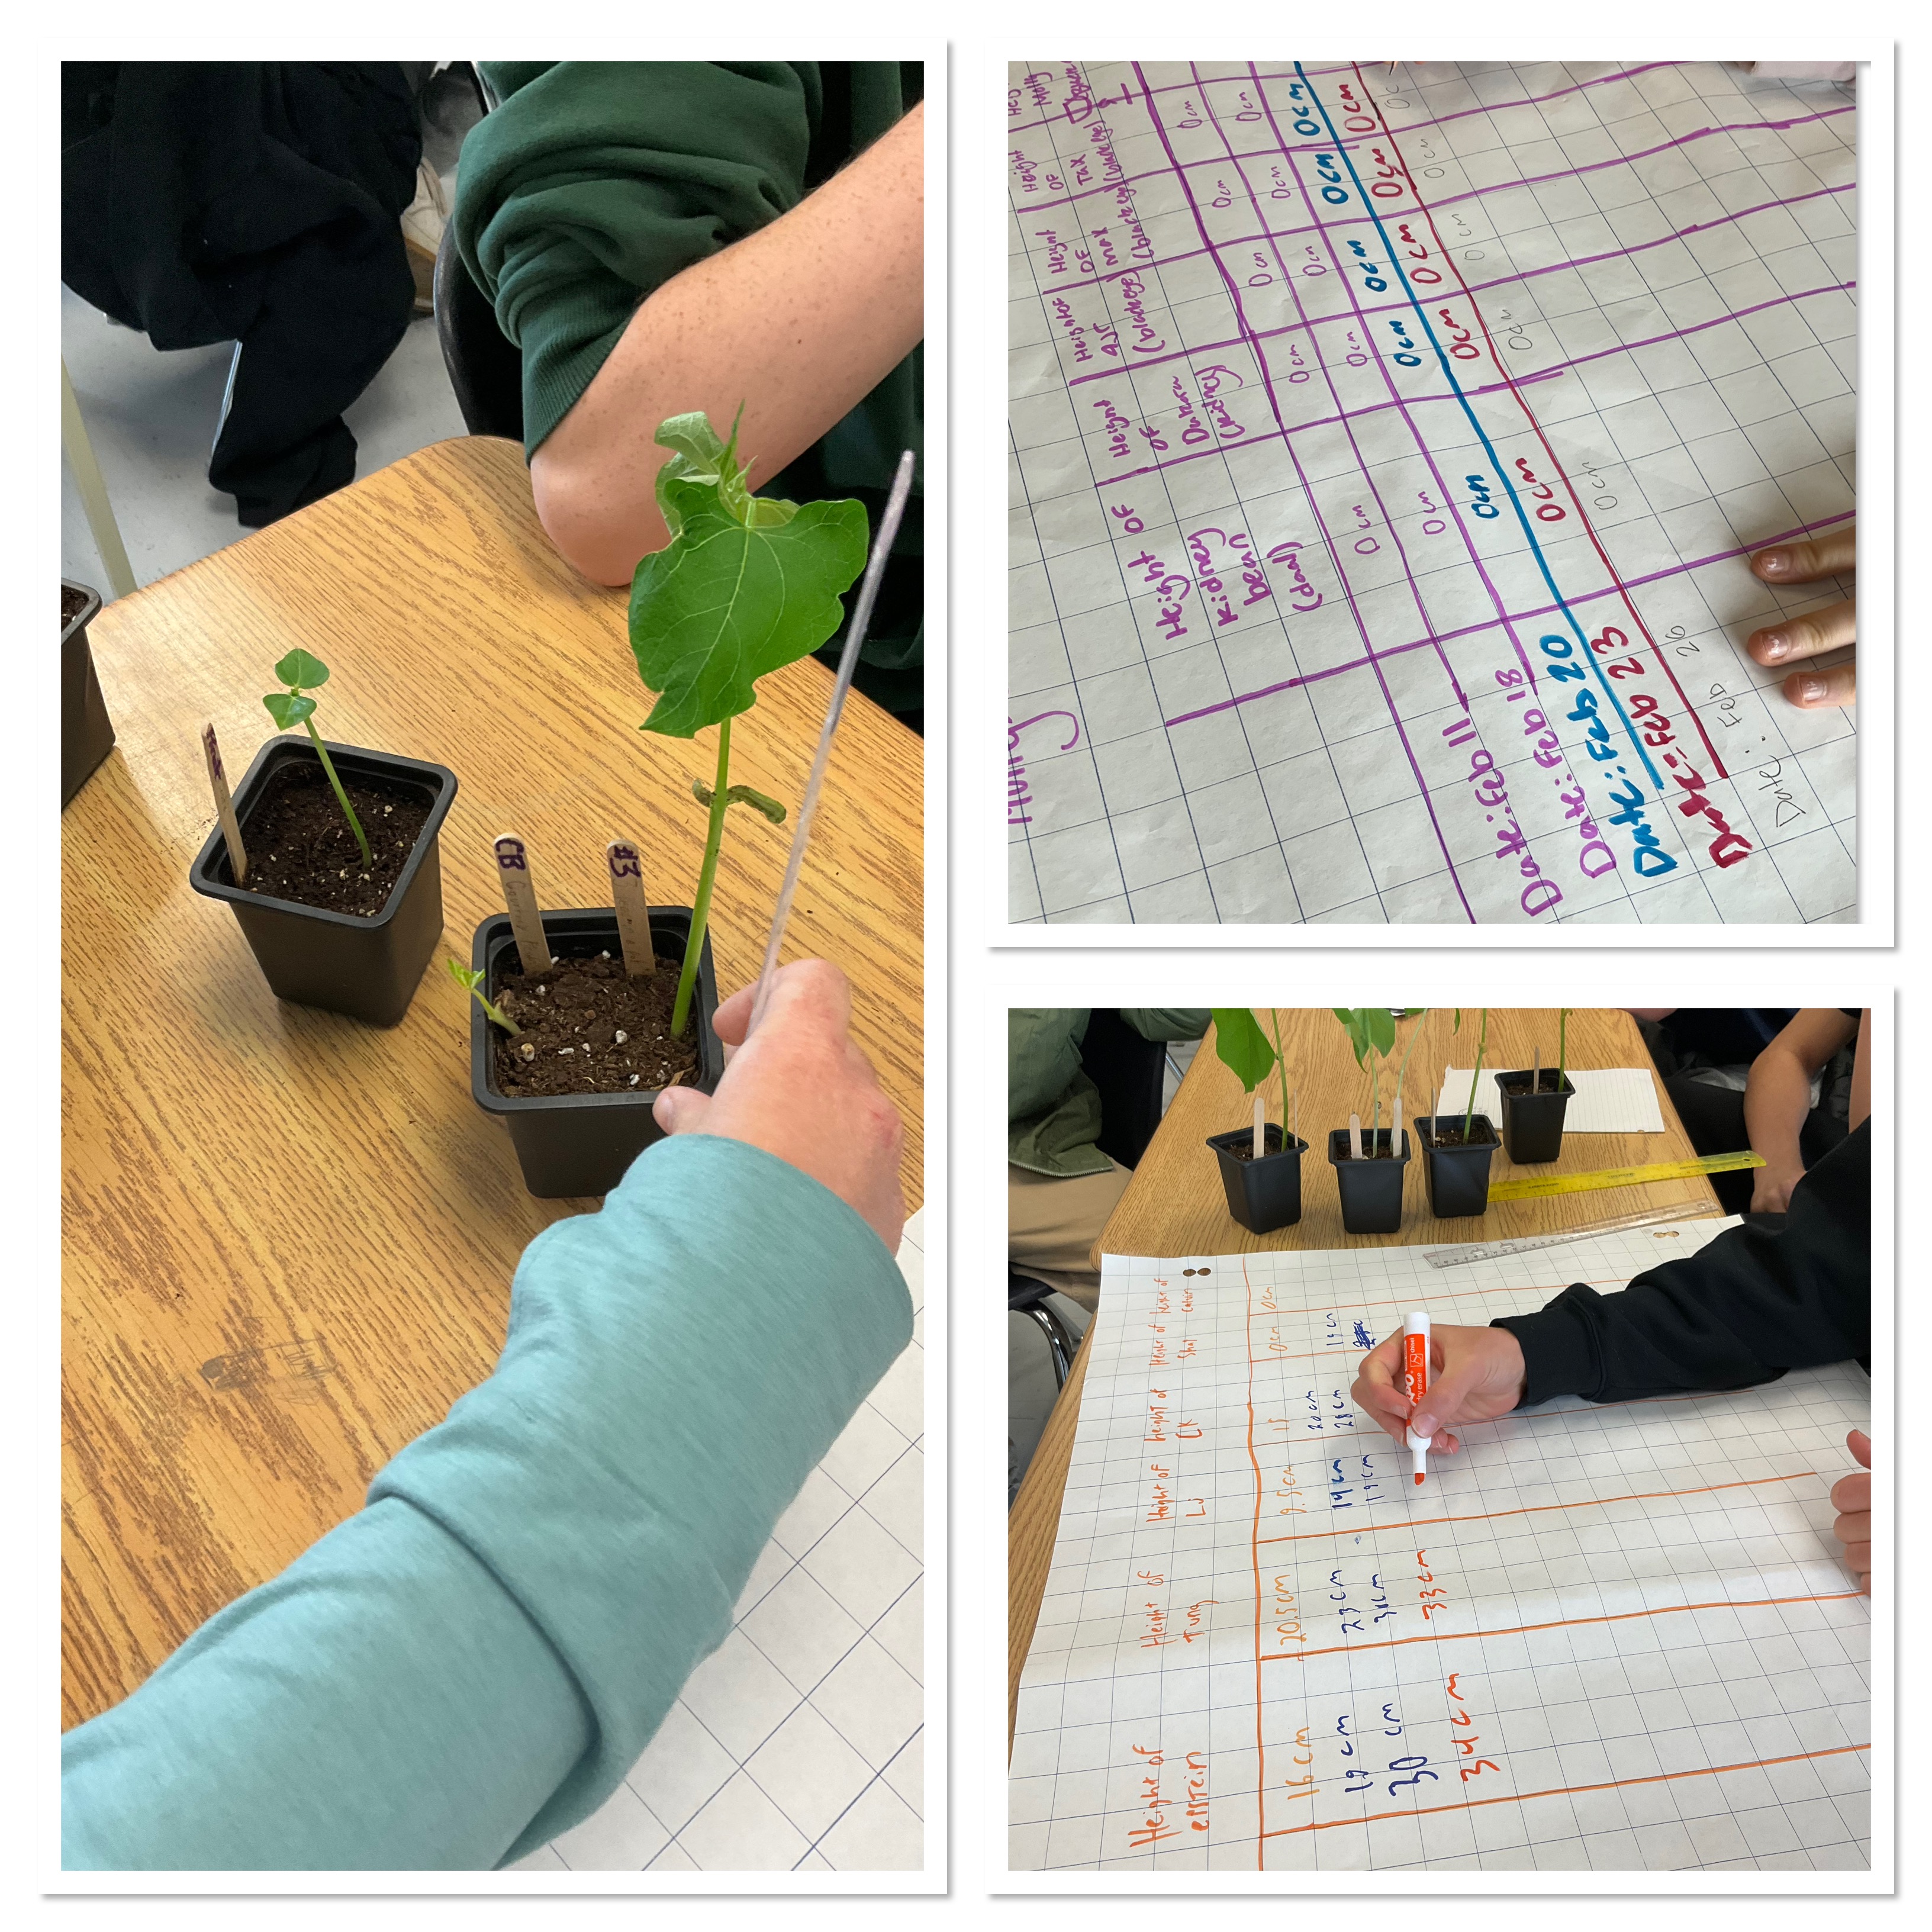
some groups have a lot of beans that are sprouting, and others are still waiting and watering. We are measuring the height each day and will do some graphs of our data after a few more days of measurements.
The other task we worked on last week was a knot tying experiment. Today we consolidated that task and worked on graphing, making equations, and interpreting the rate, initial value, and point of intersection.
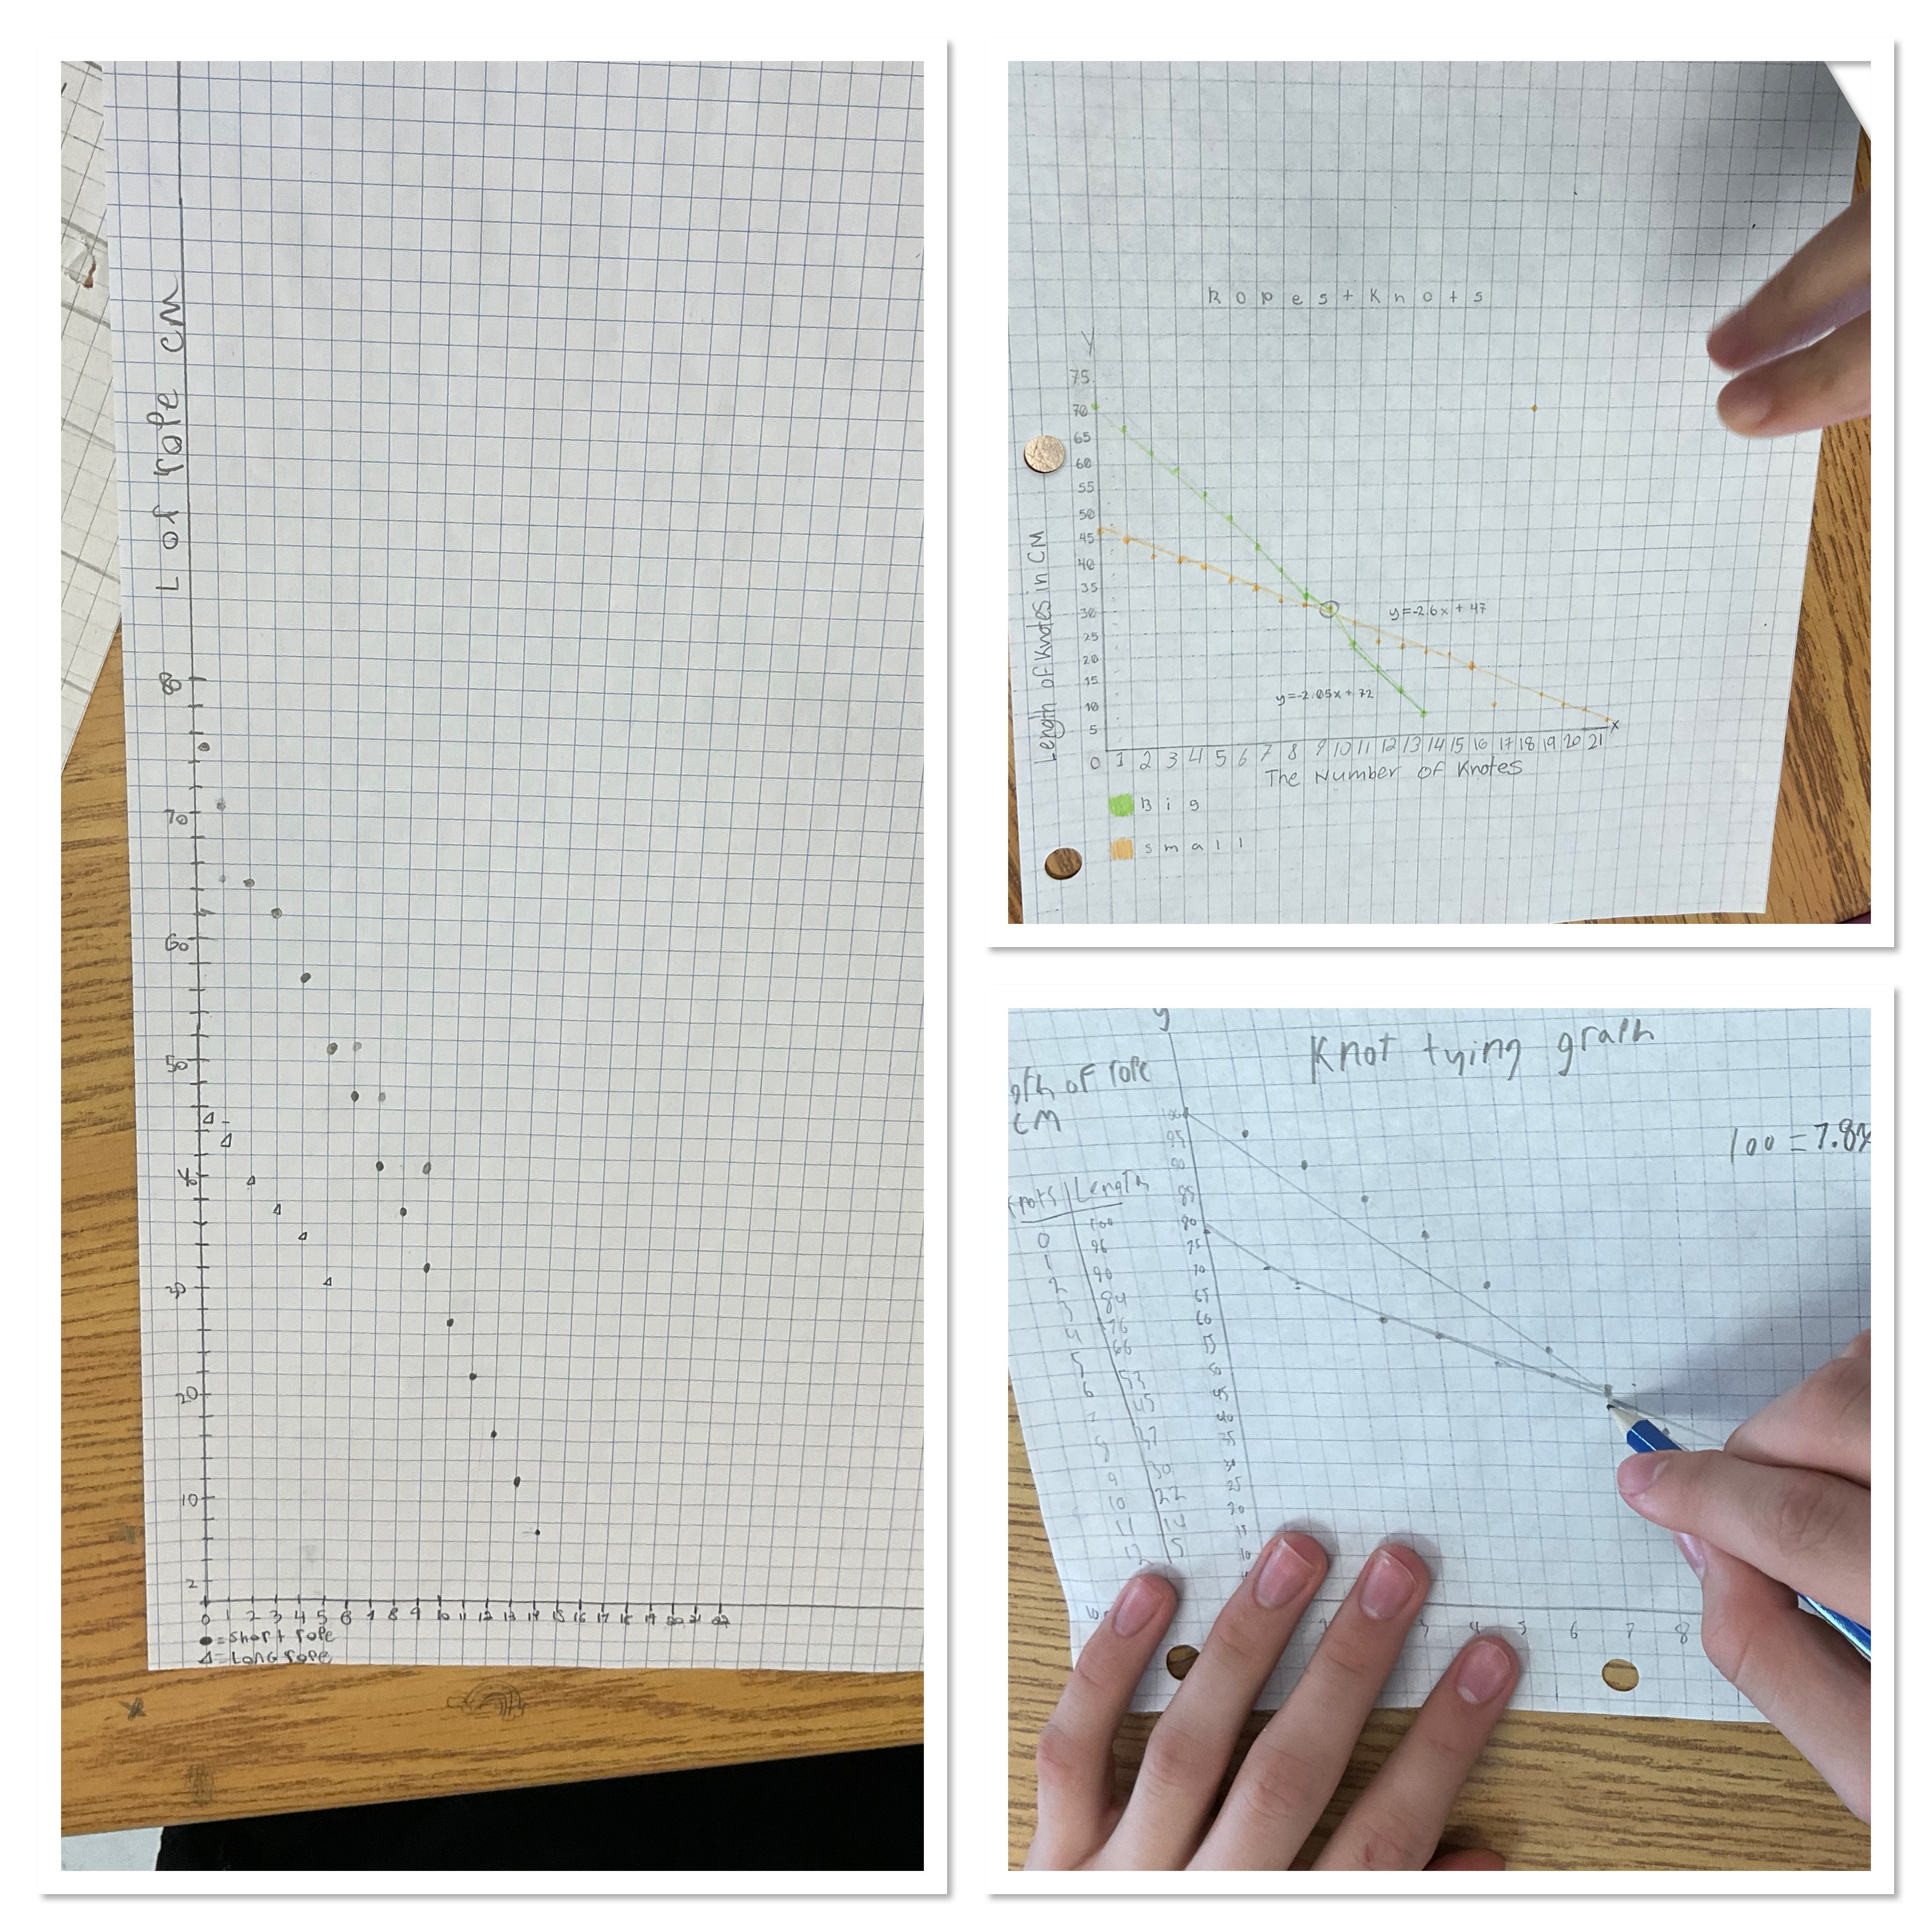
We co-constructed an exemplar of a graph, and each group made progress on interpreting their data. We made connections between the thickness of the rope and the amount of rope consumed per knot.
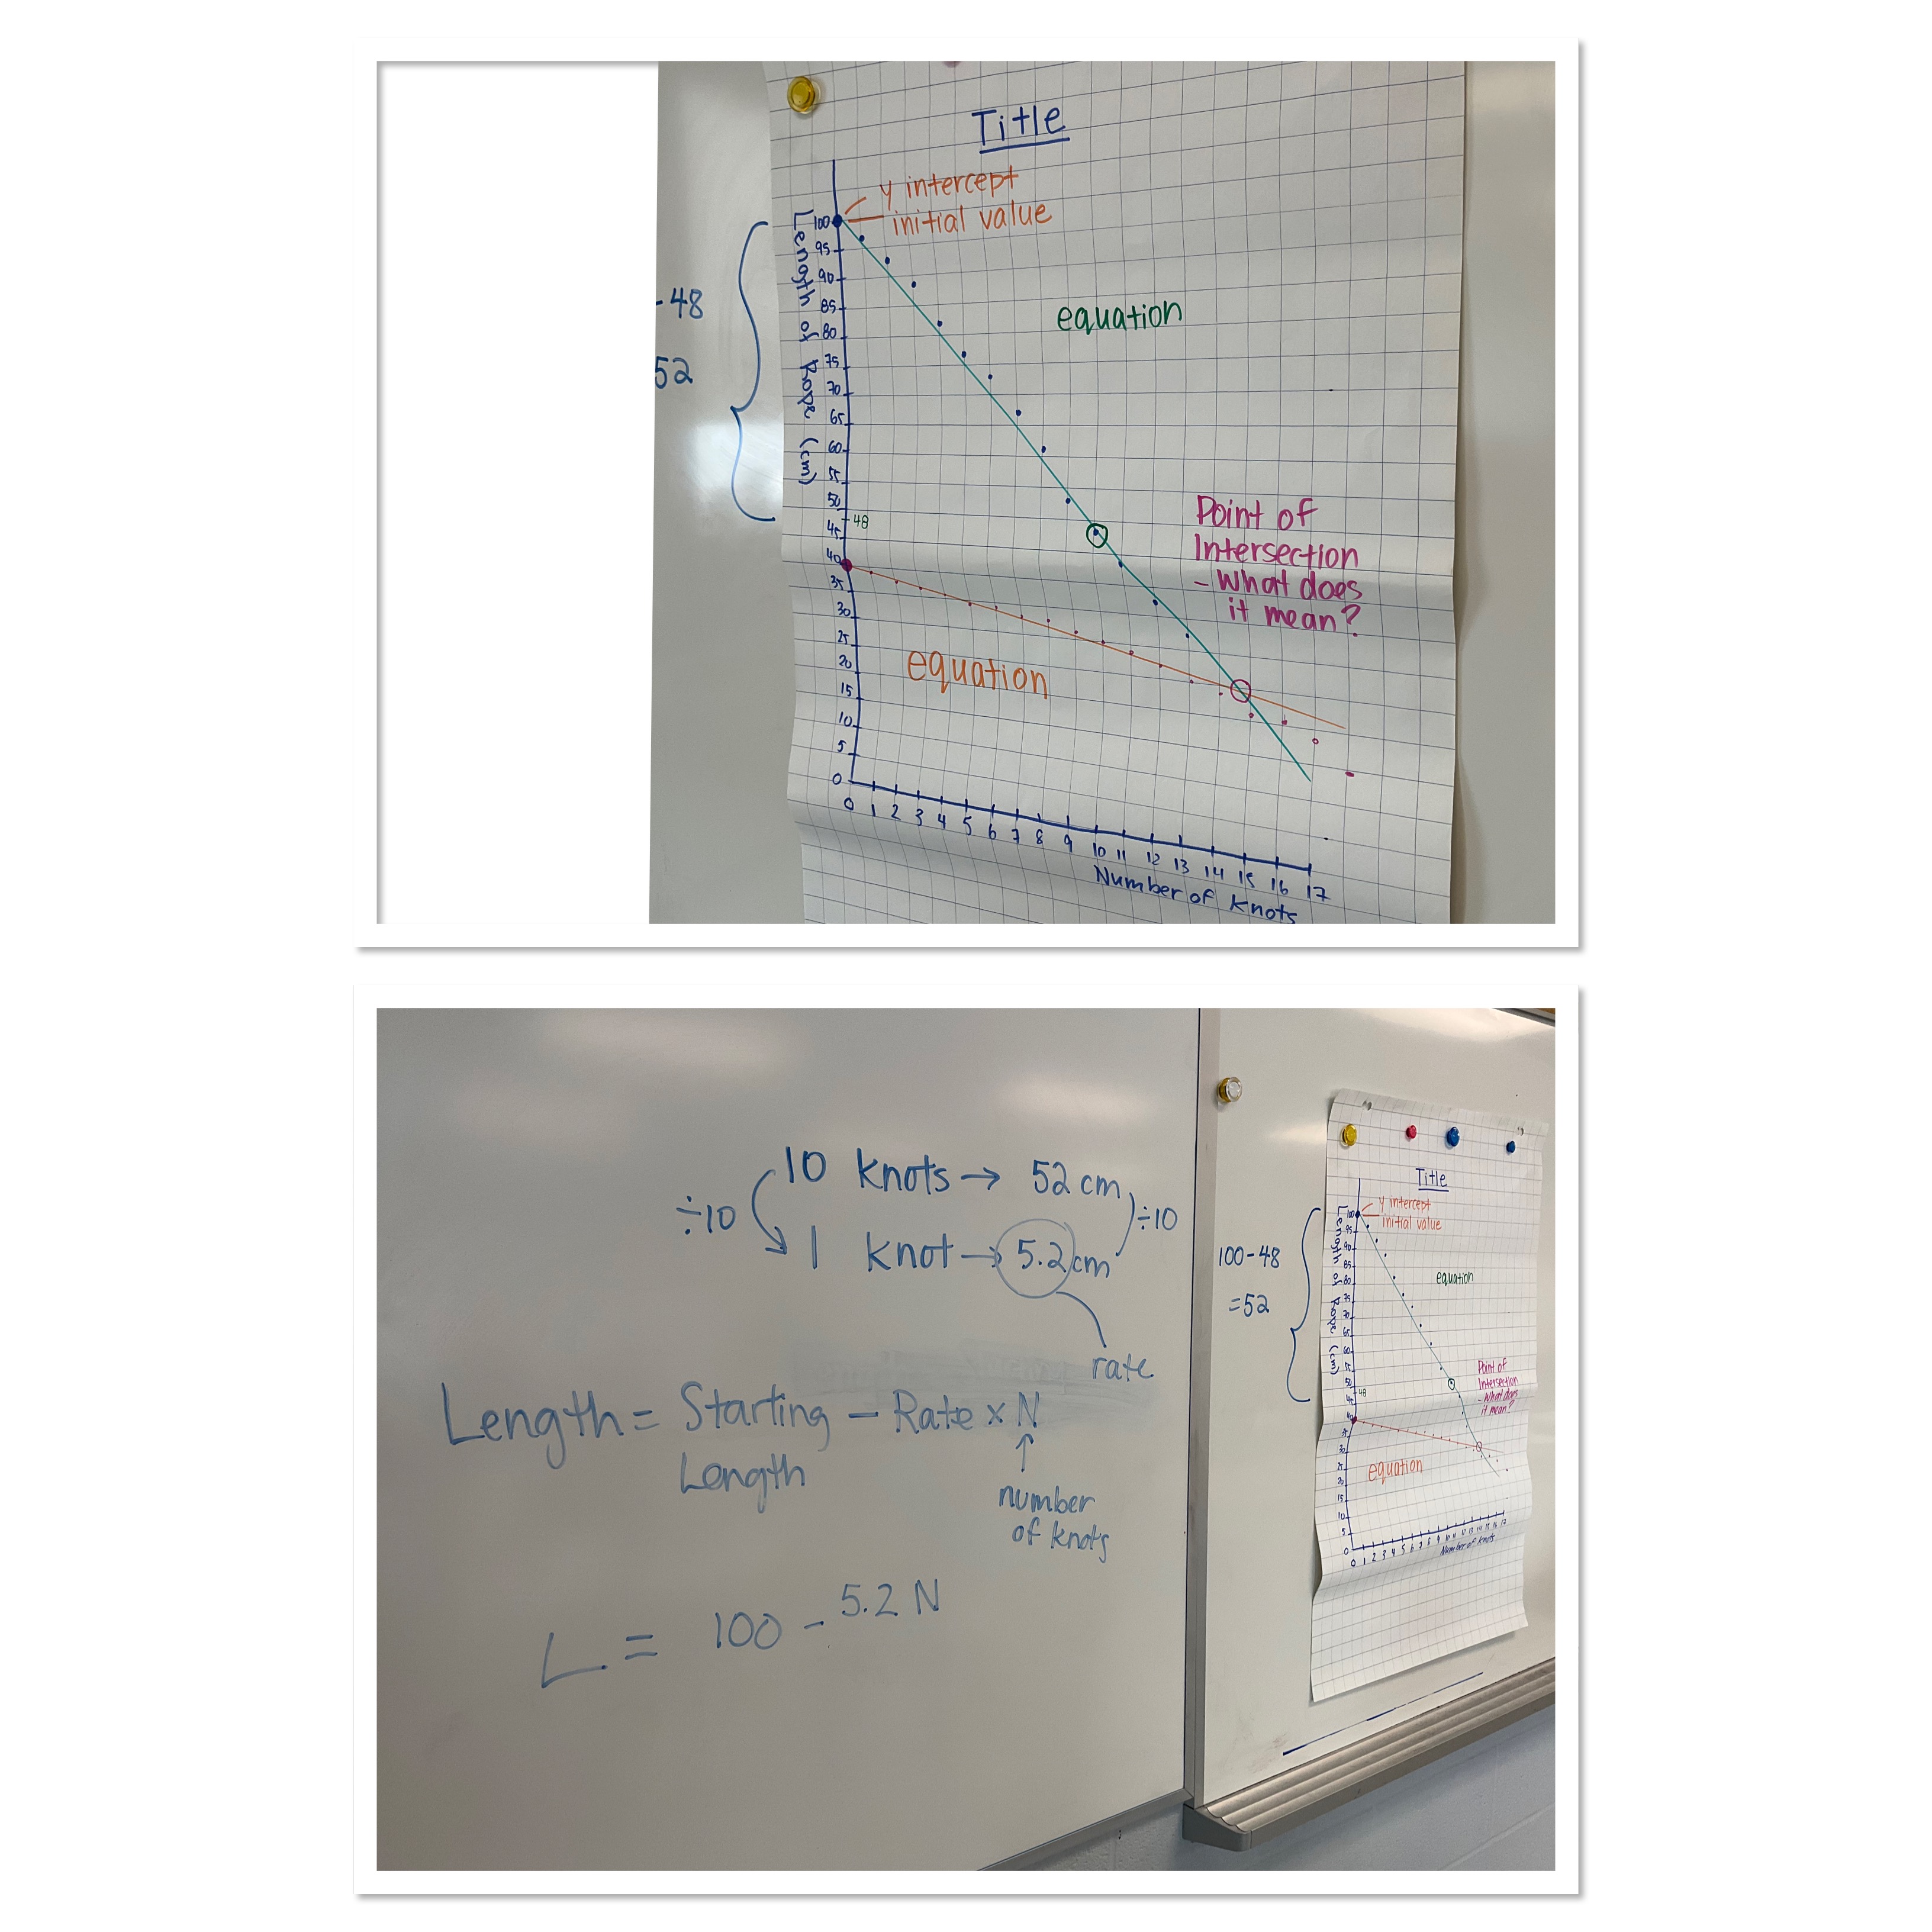
We found the average rate of change by looking at the length change for 10 knots, and then divided that number by 10 to get the average rate of change per knot.
Next week we’ll be working on some new data collecting tasks and introducing algebraic methods of solving.
