Modelling Data in Grade 10
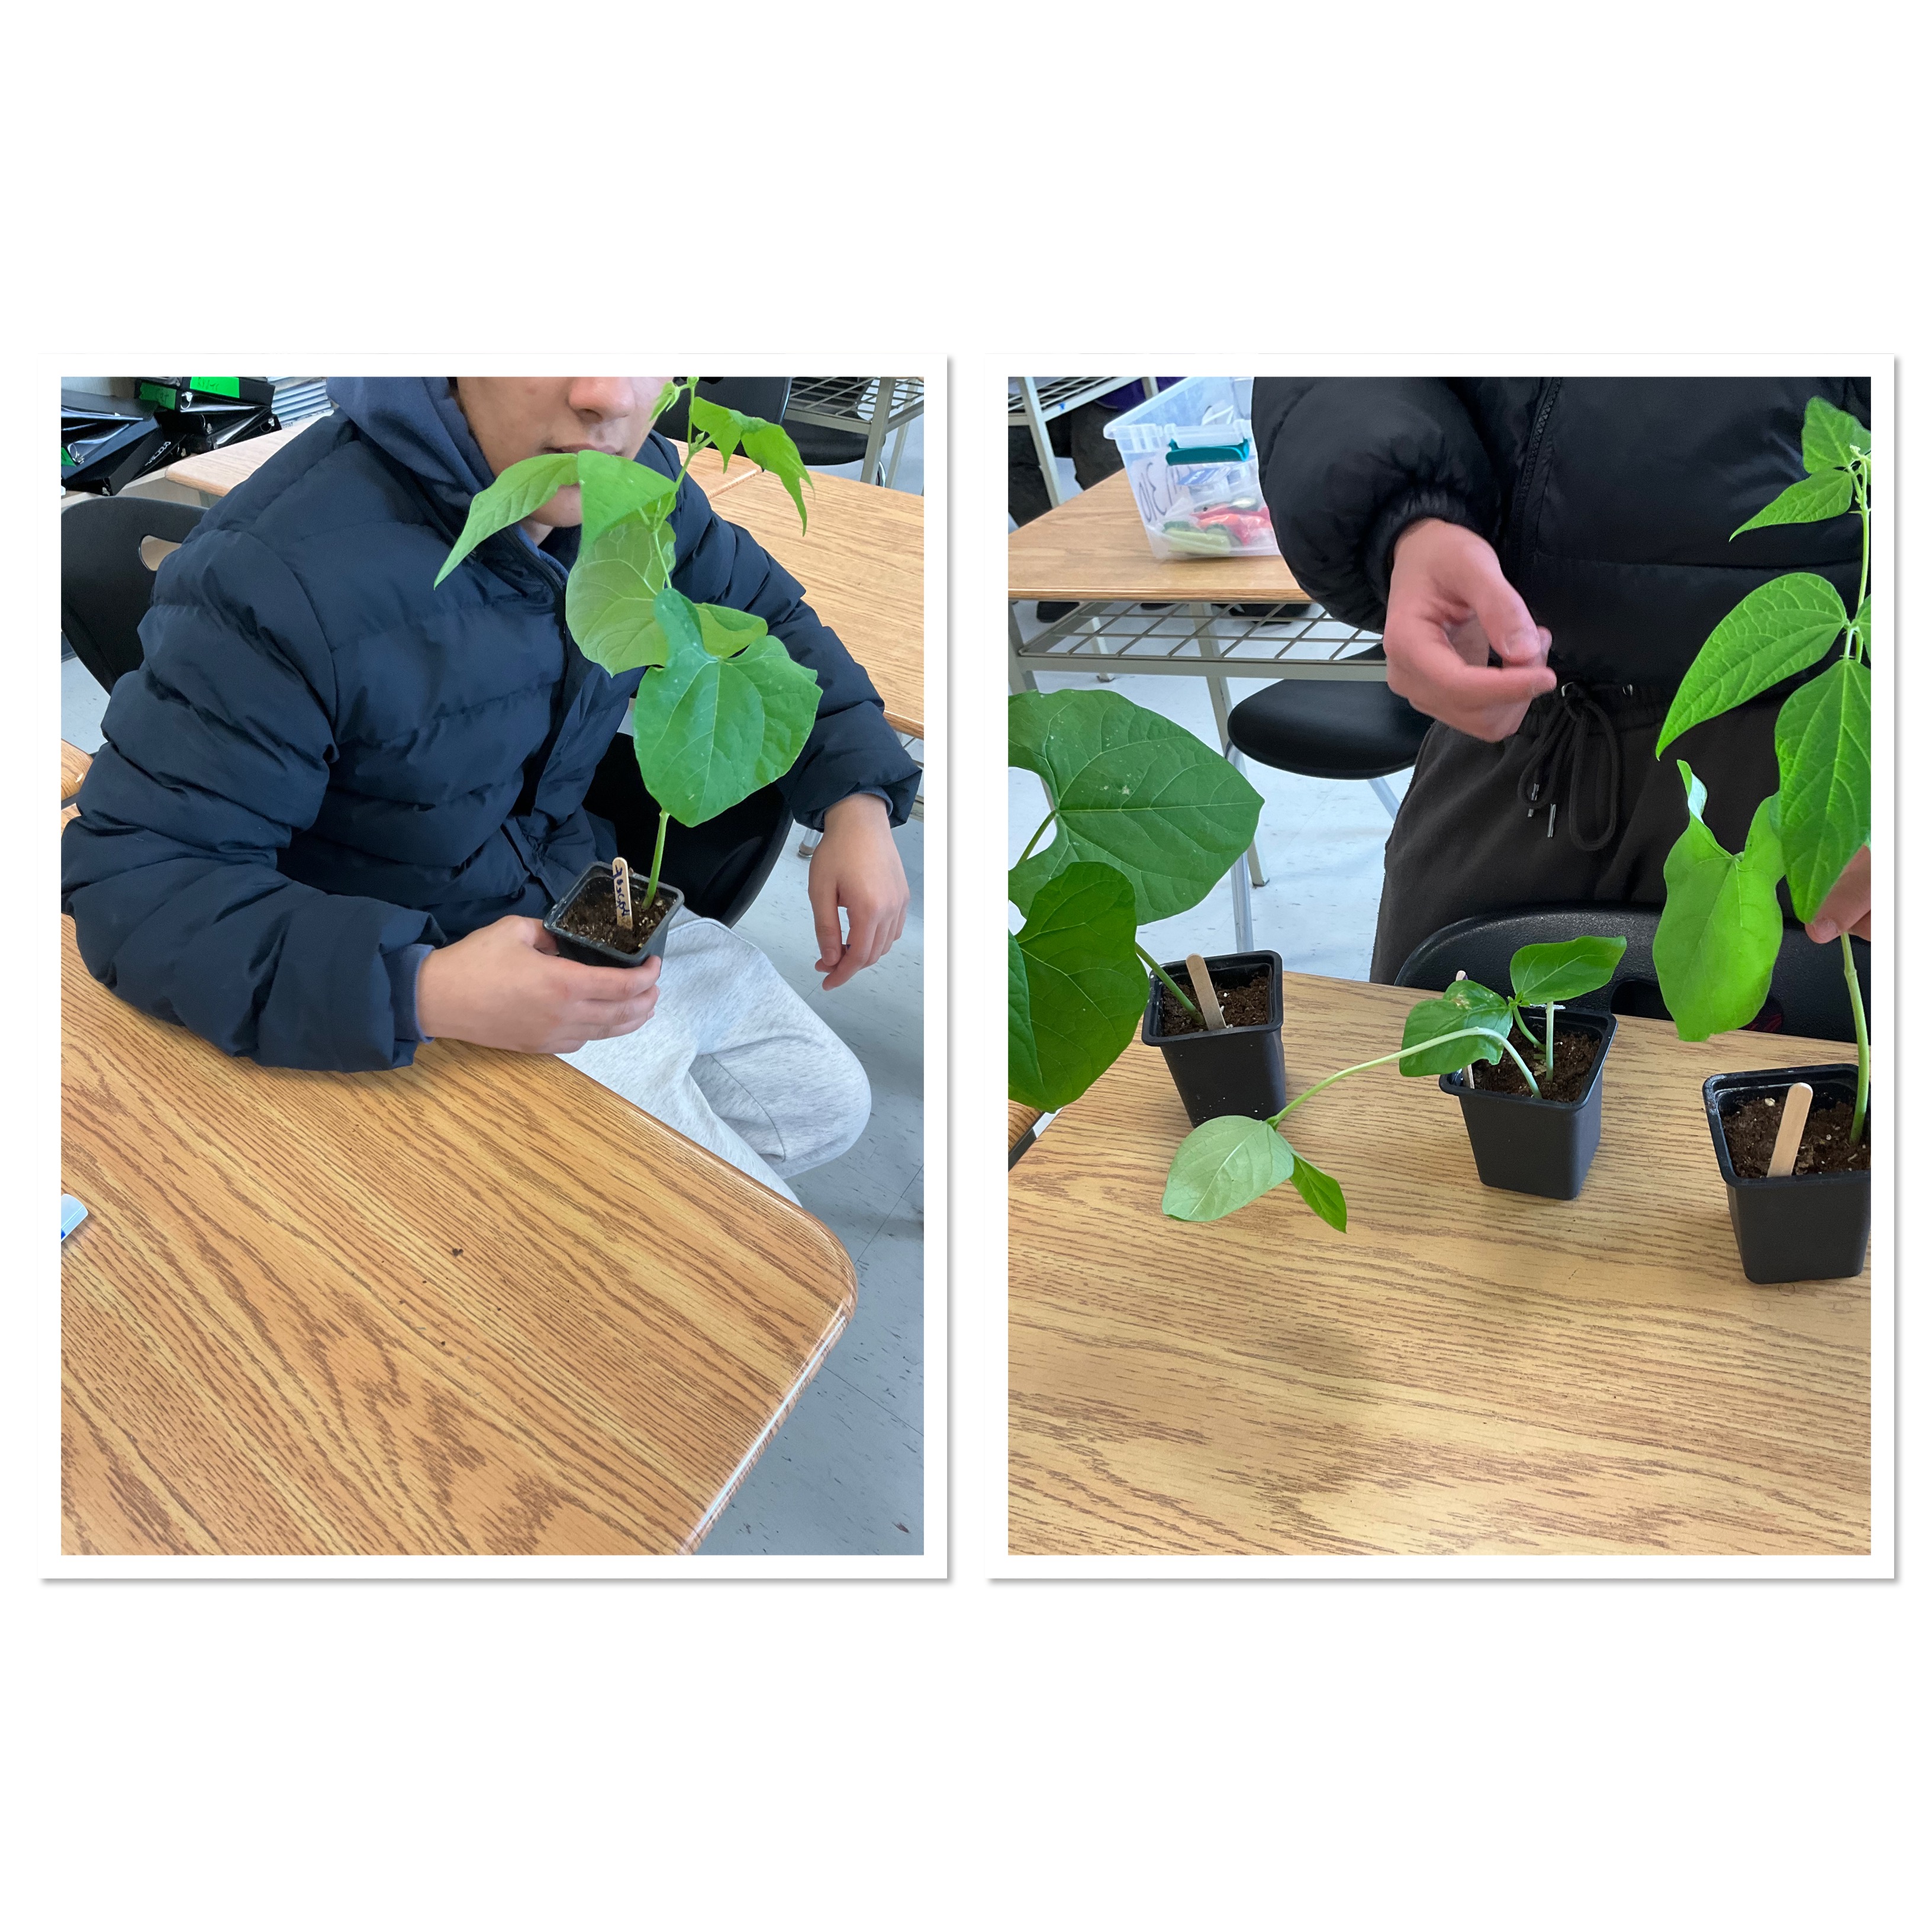
I was back helping in a MFM2P class today. We checked in on our beans. Some are getting quite big.
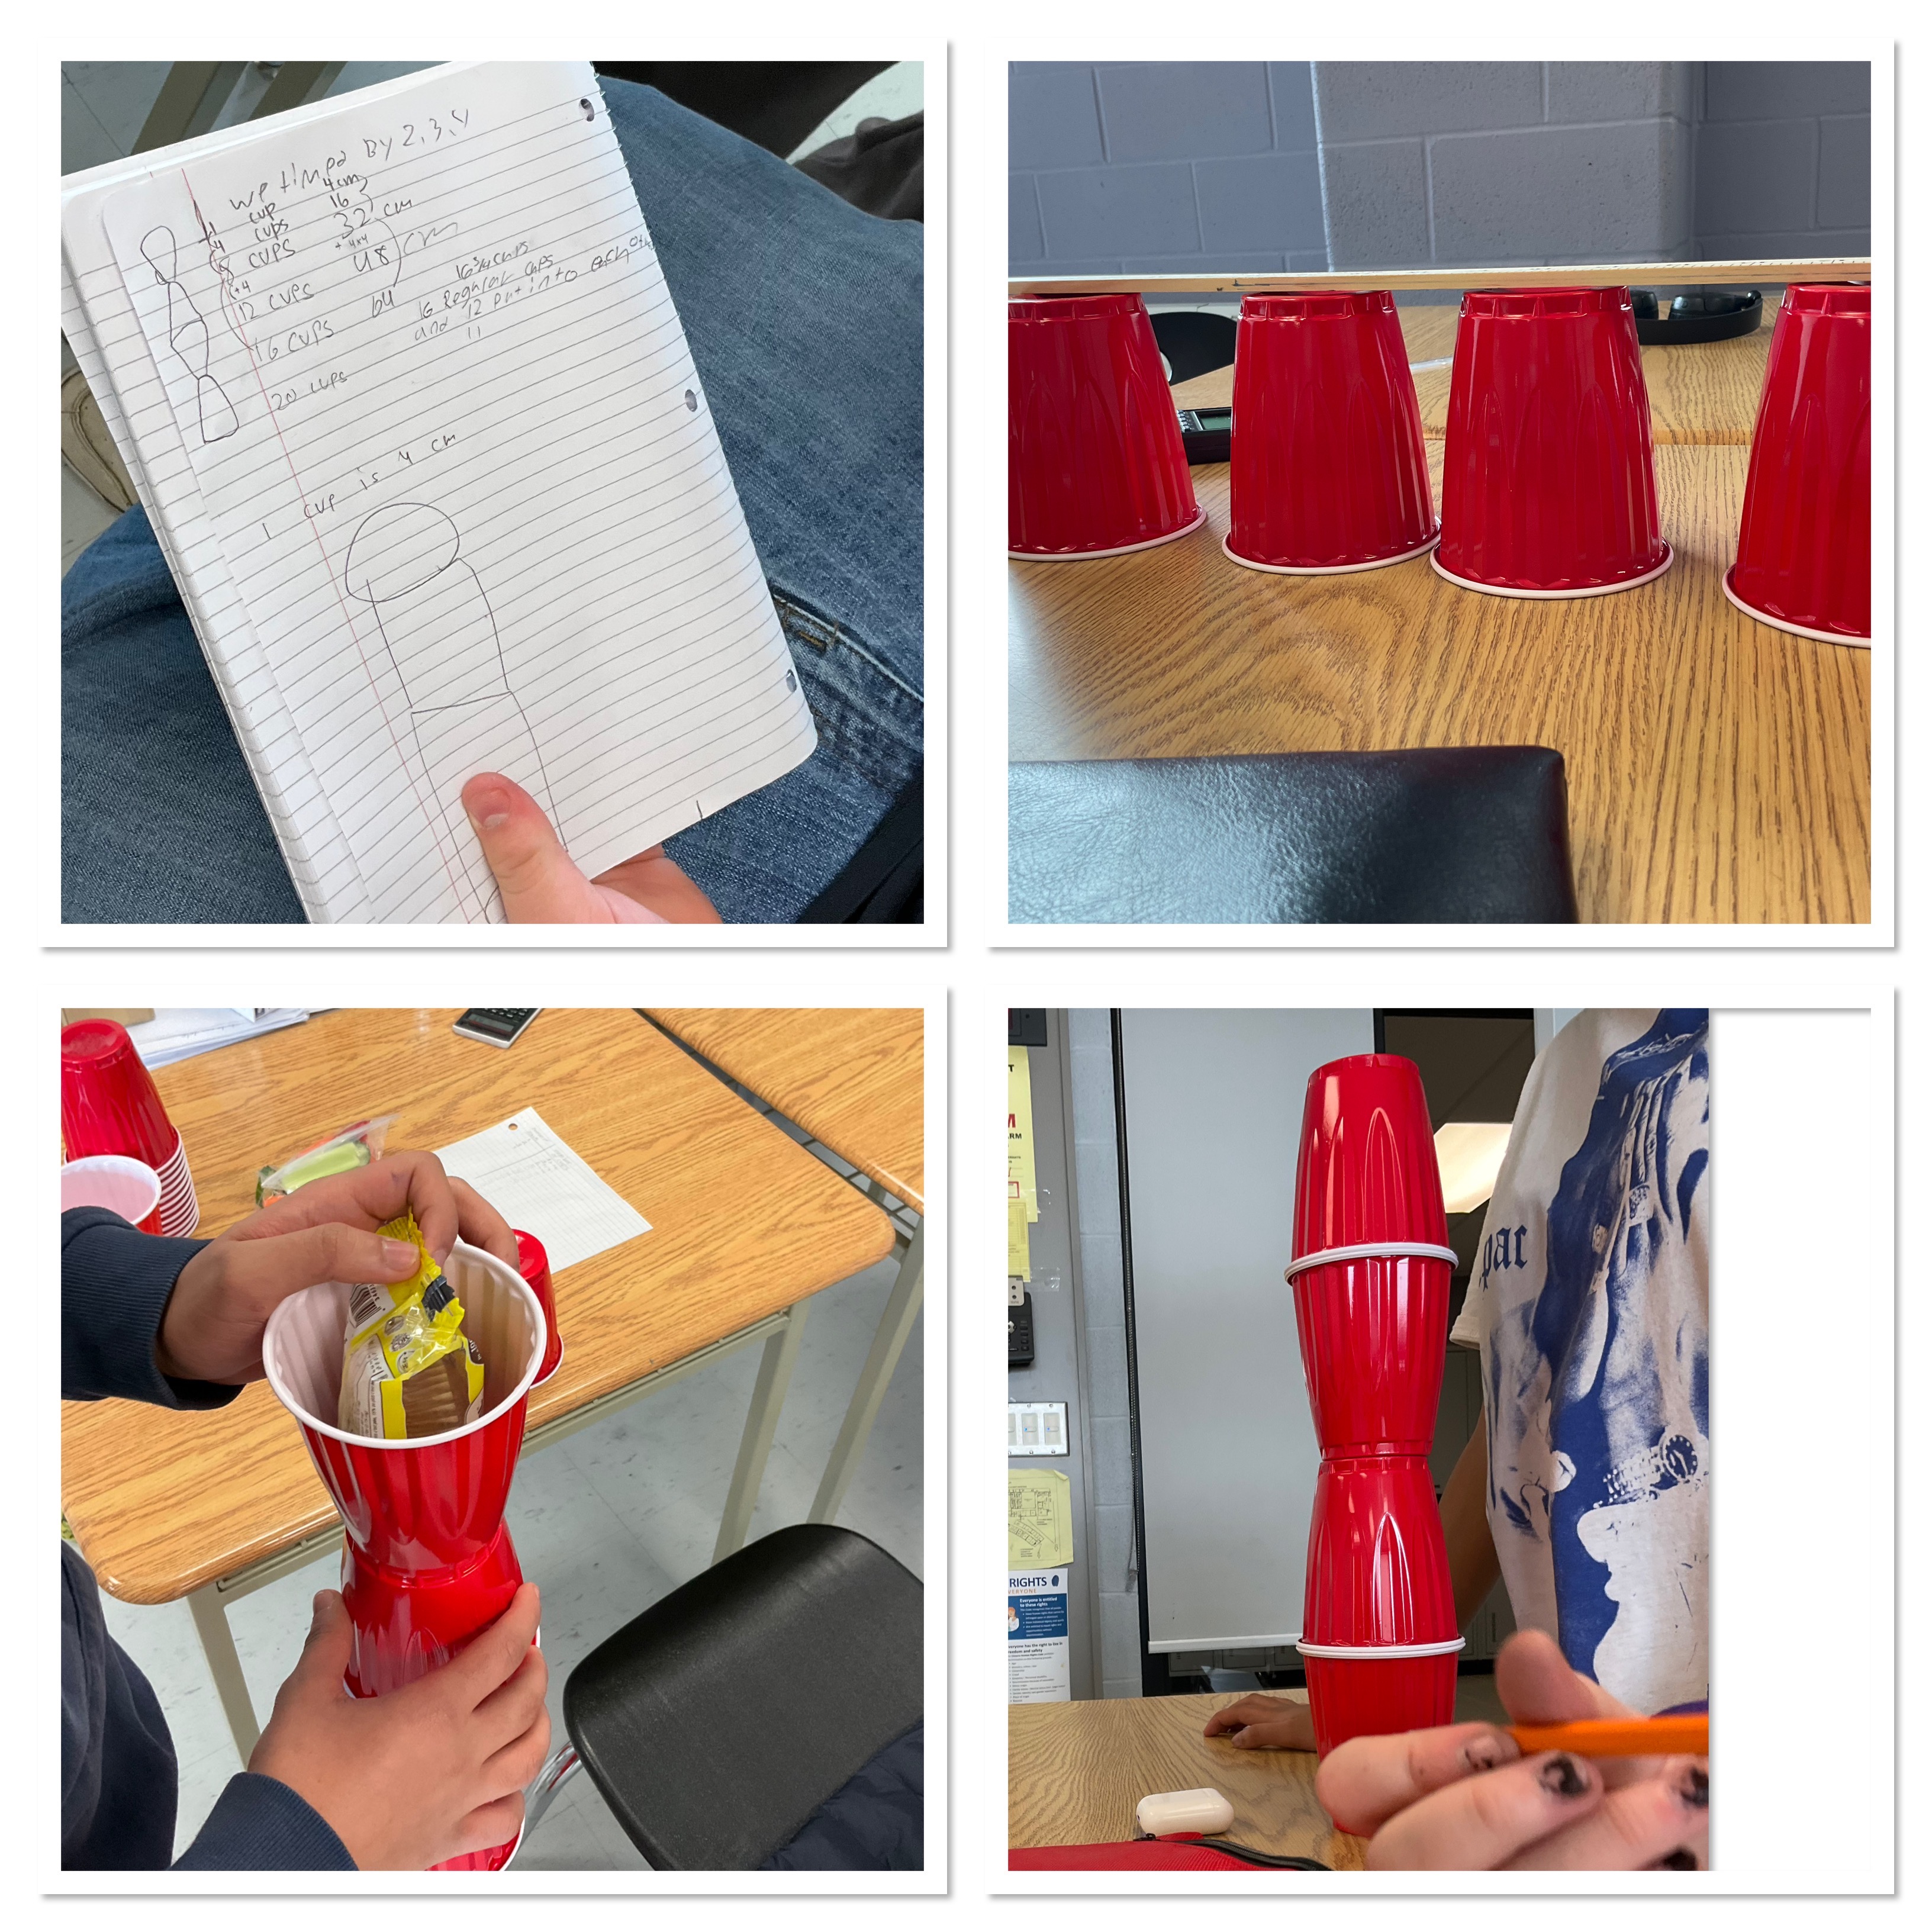
The next task we did was a “fun Friday” task where students worked in pairs to decide how many cups would be needed to make a stack as tall as their teacher. (5 foot 7). Students used unit conversions, some choosing to work in inches, and others in centimetres. They made ratio tables, or used linear tables of values to determine how many cups they’d need.

They experimented with different ways to stack the cups as well to add a little bit more height, so they could be precise. Their teacher had a prize on the line. Chocolate bars for the group that got closest to his height.
Each group had 4 cups to test out their plan, then they needed to lock in their total number of cups that they’d need, and show their thinking. Most groups had a good grip on proportions. If 4 cups would stack to a certain height 8 cups would stack to double that height, and they’d double again to know what 16 cups would stack to.
Some groups used weights to help balance their stacks, and others decided that making a triangle stack would be the best approach to make the base wider and more stable. The triangle stack quickly evolved to needing all the cups in the room.
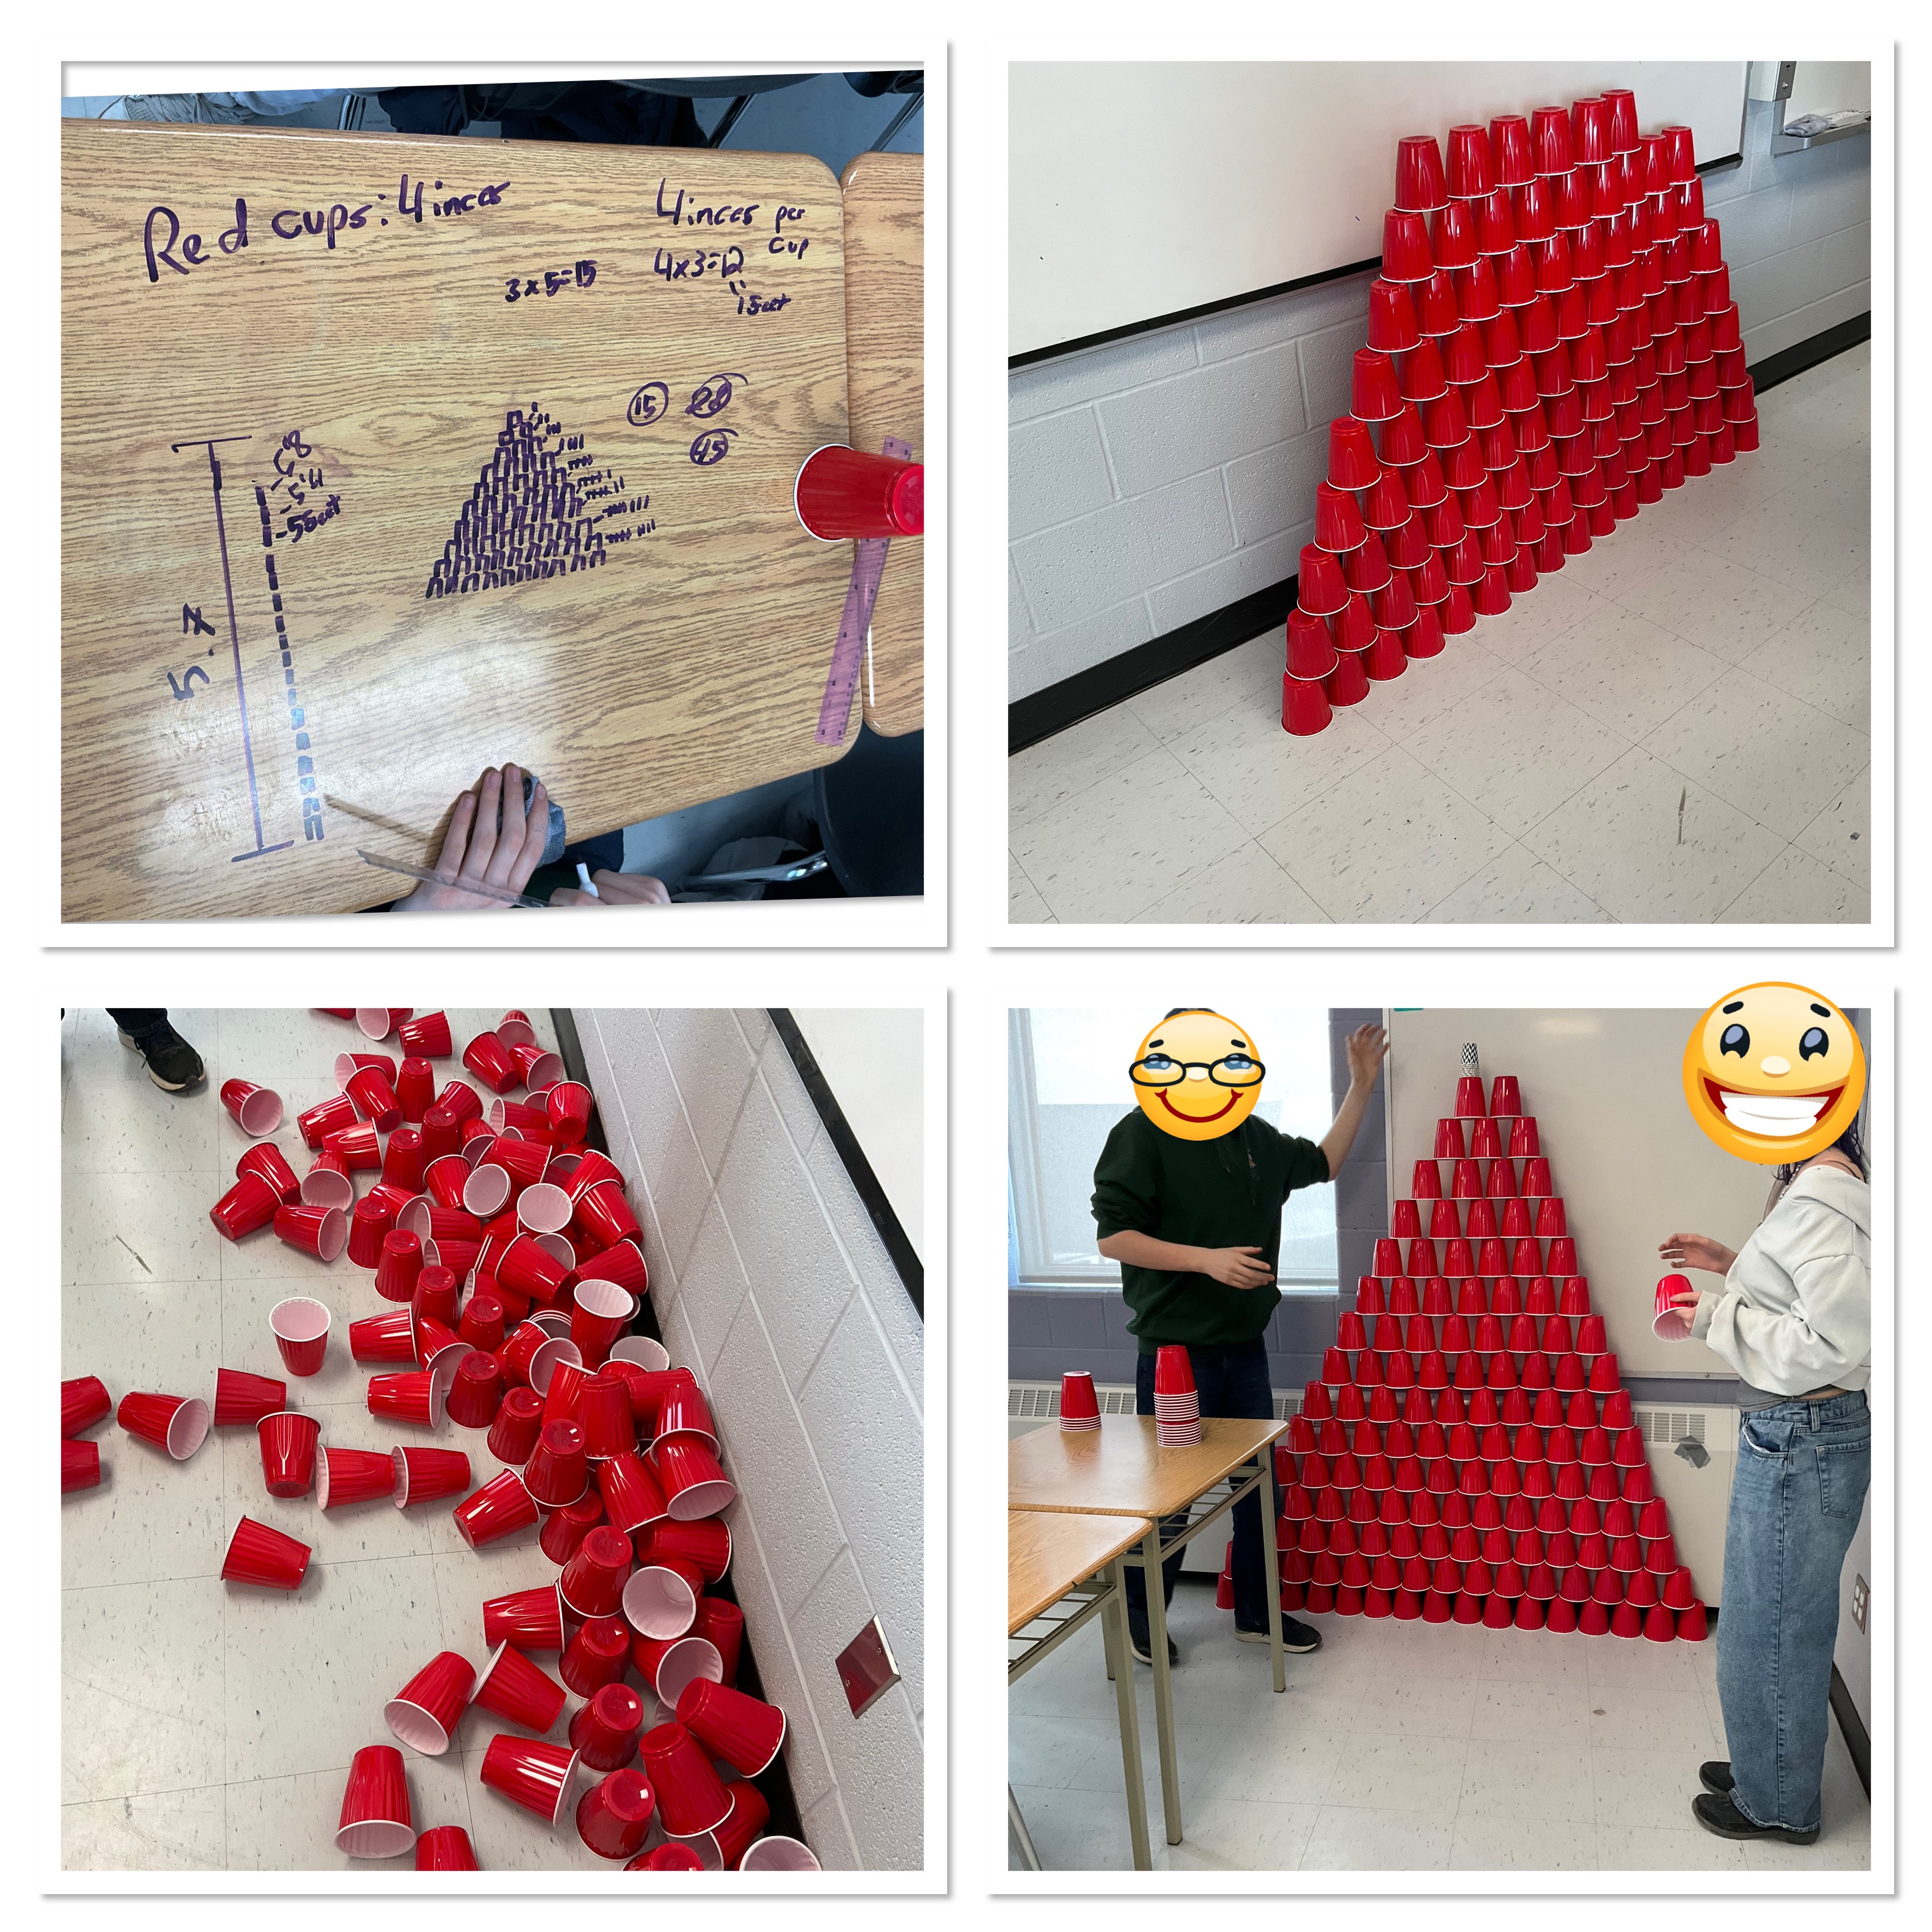
It fell down once or twice, but dedicated students built it back up!
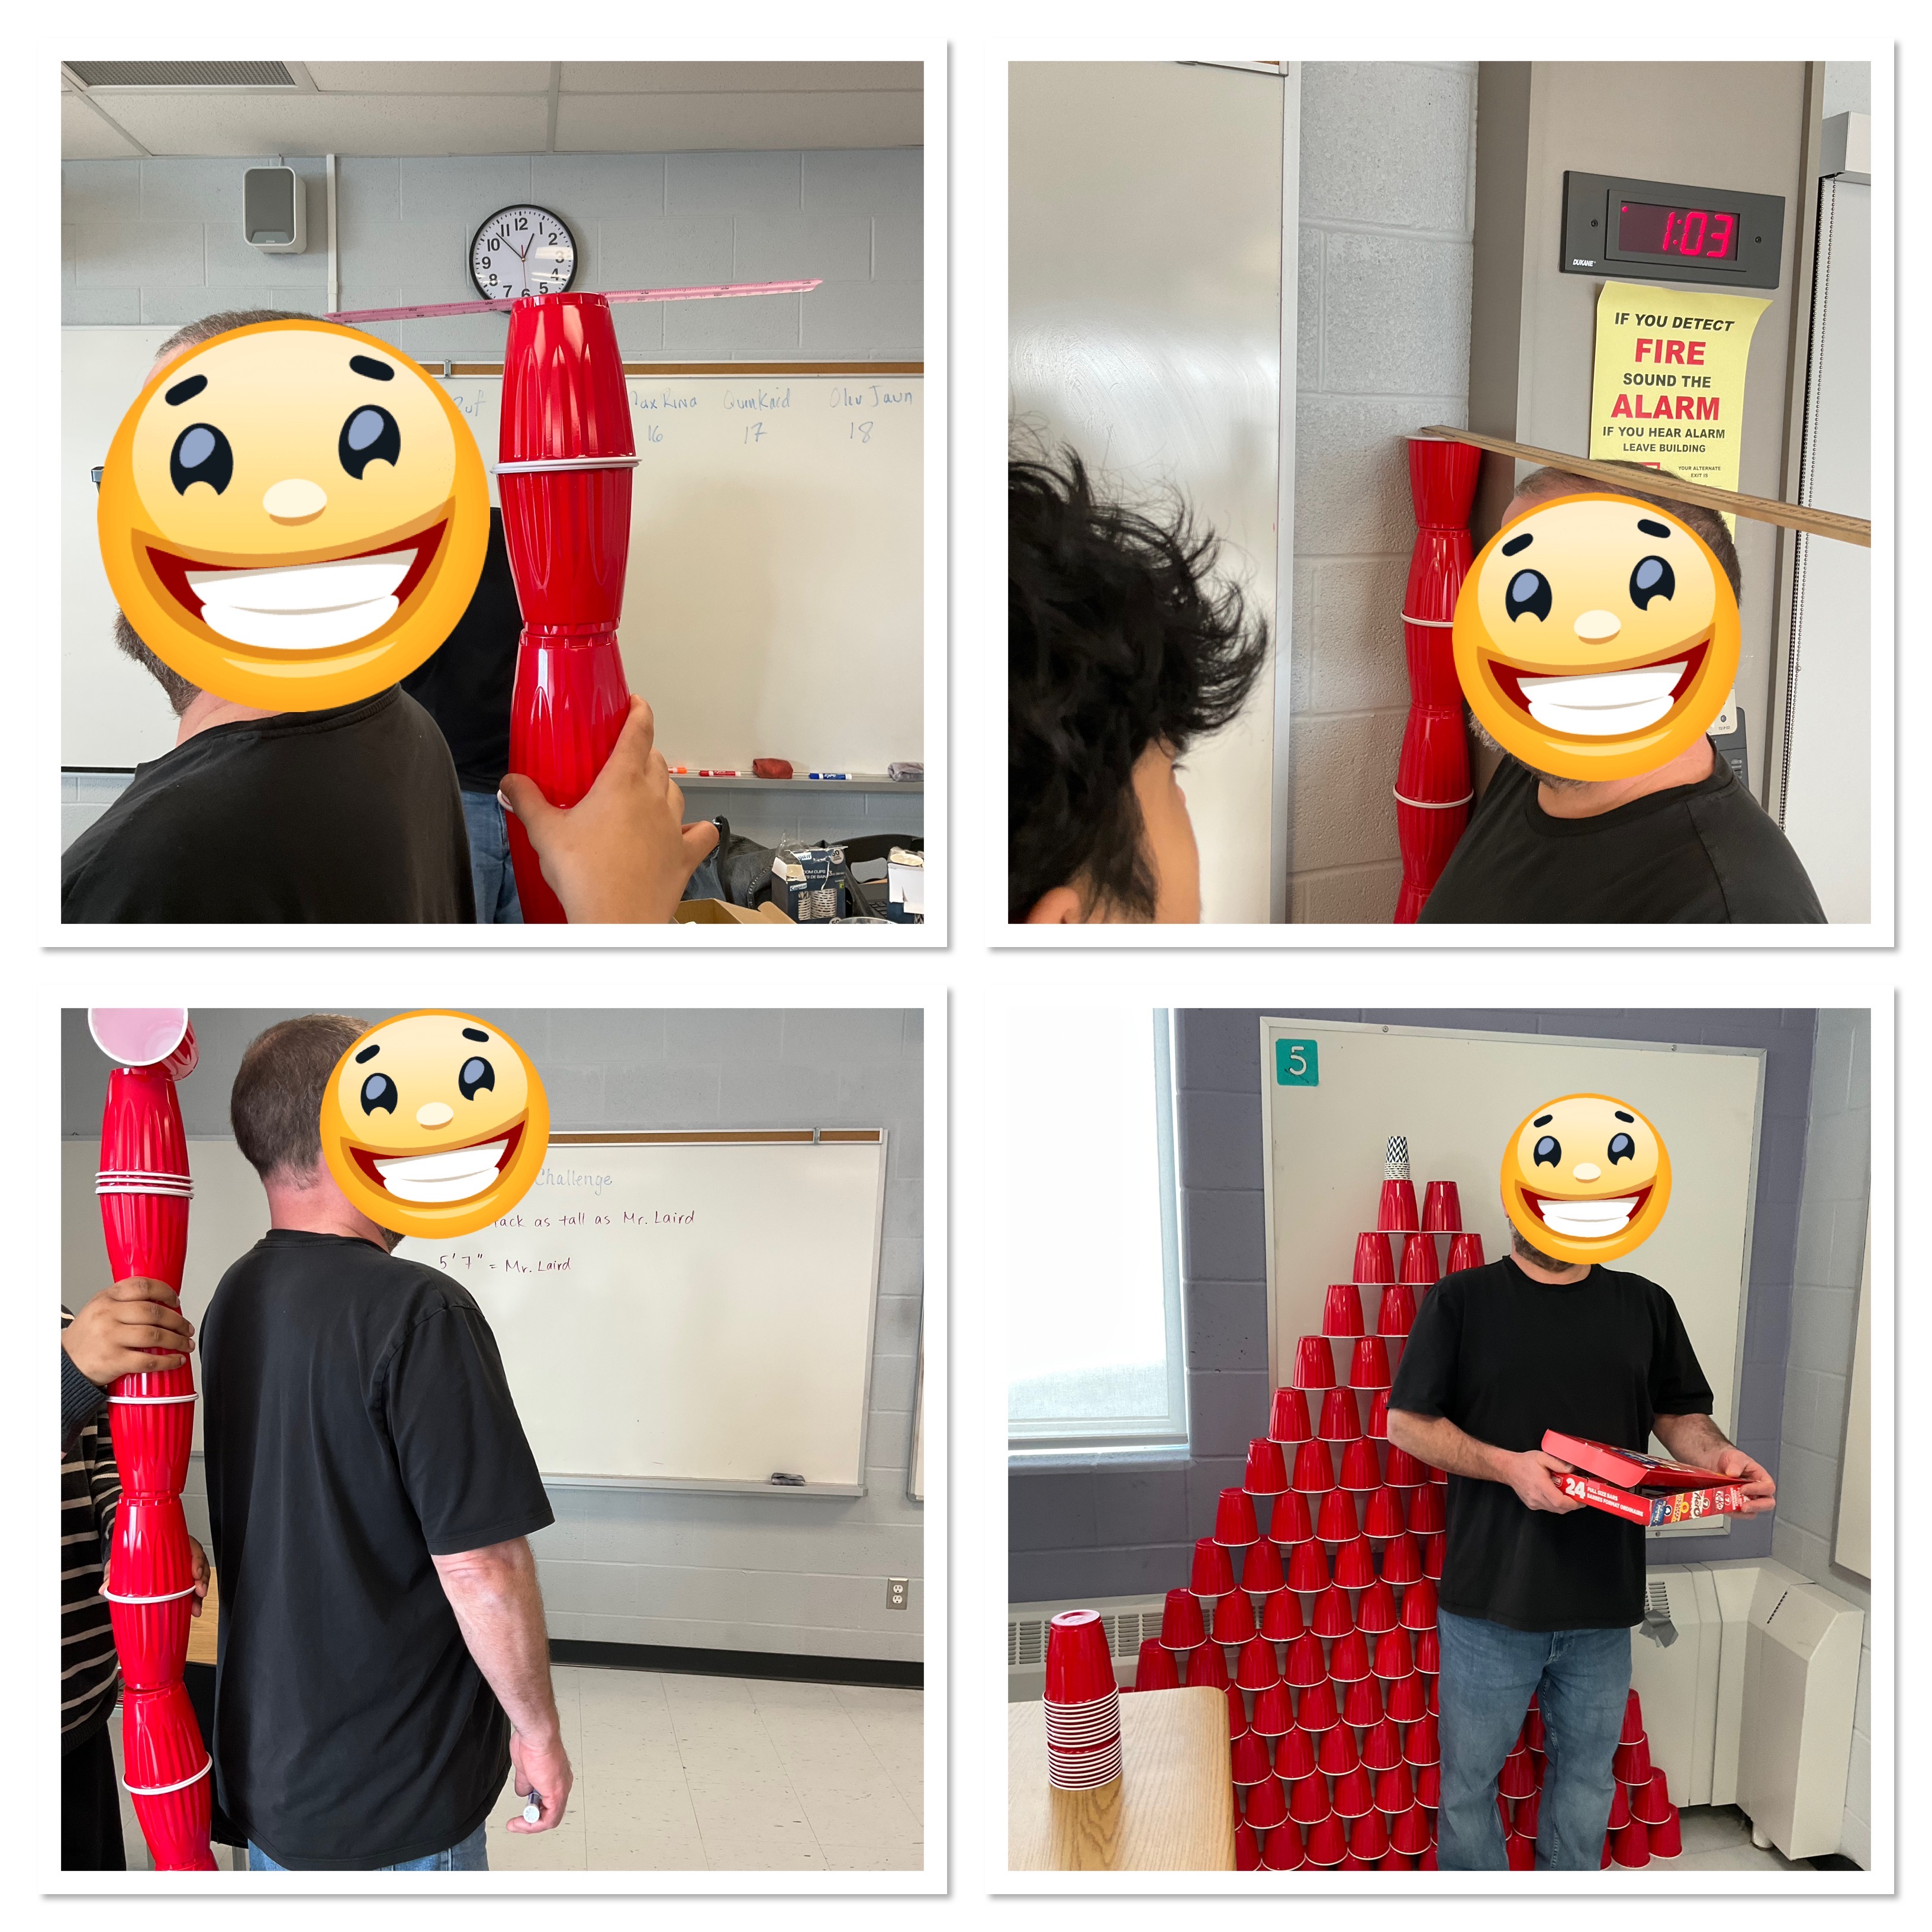
Many groups got their towers to be the desired height, but only one group did it with the number of cups they had predicted they’d need.
Lots to debrief from this task in the coming days. Linear vs quadratic growth, tables of values and graphs, proportional reasoning, and unit conversions. Other alternative approaches are to start stacks on the desk, introducing a “b” value to mx+b, and also we can note how the graphs would produce parallel lines starting from the floor and the desk.
It was a great Friday challenge. The groups worked very hard!
