Bean Finale
The grade 10 class that I have been working with are wrapping up their bean growth experiment before March Break. Today we took all of the growth data that we’d collected and we made a graph to help us calculate the growth rate.
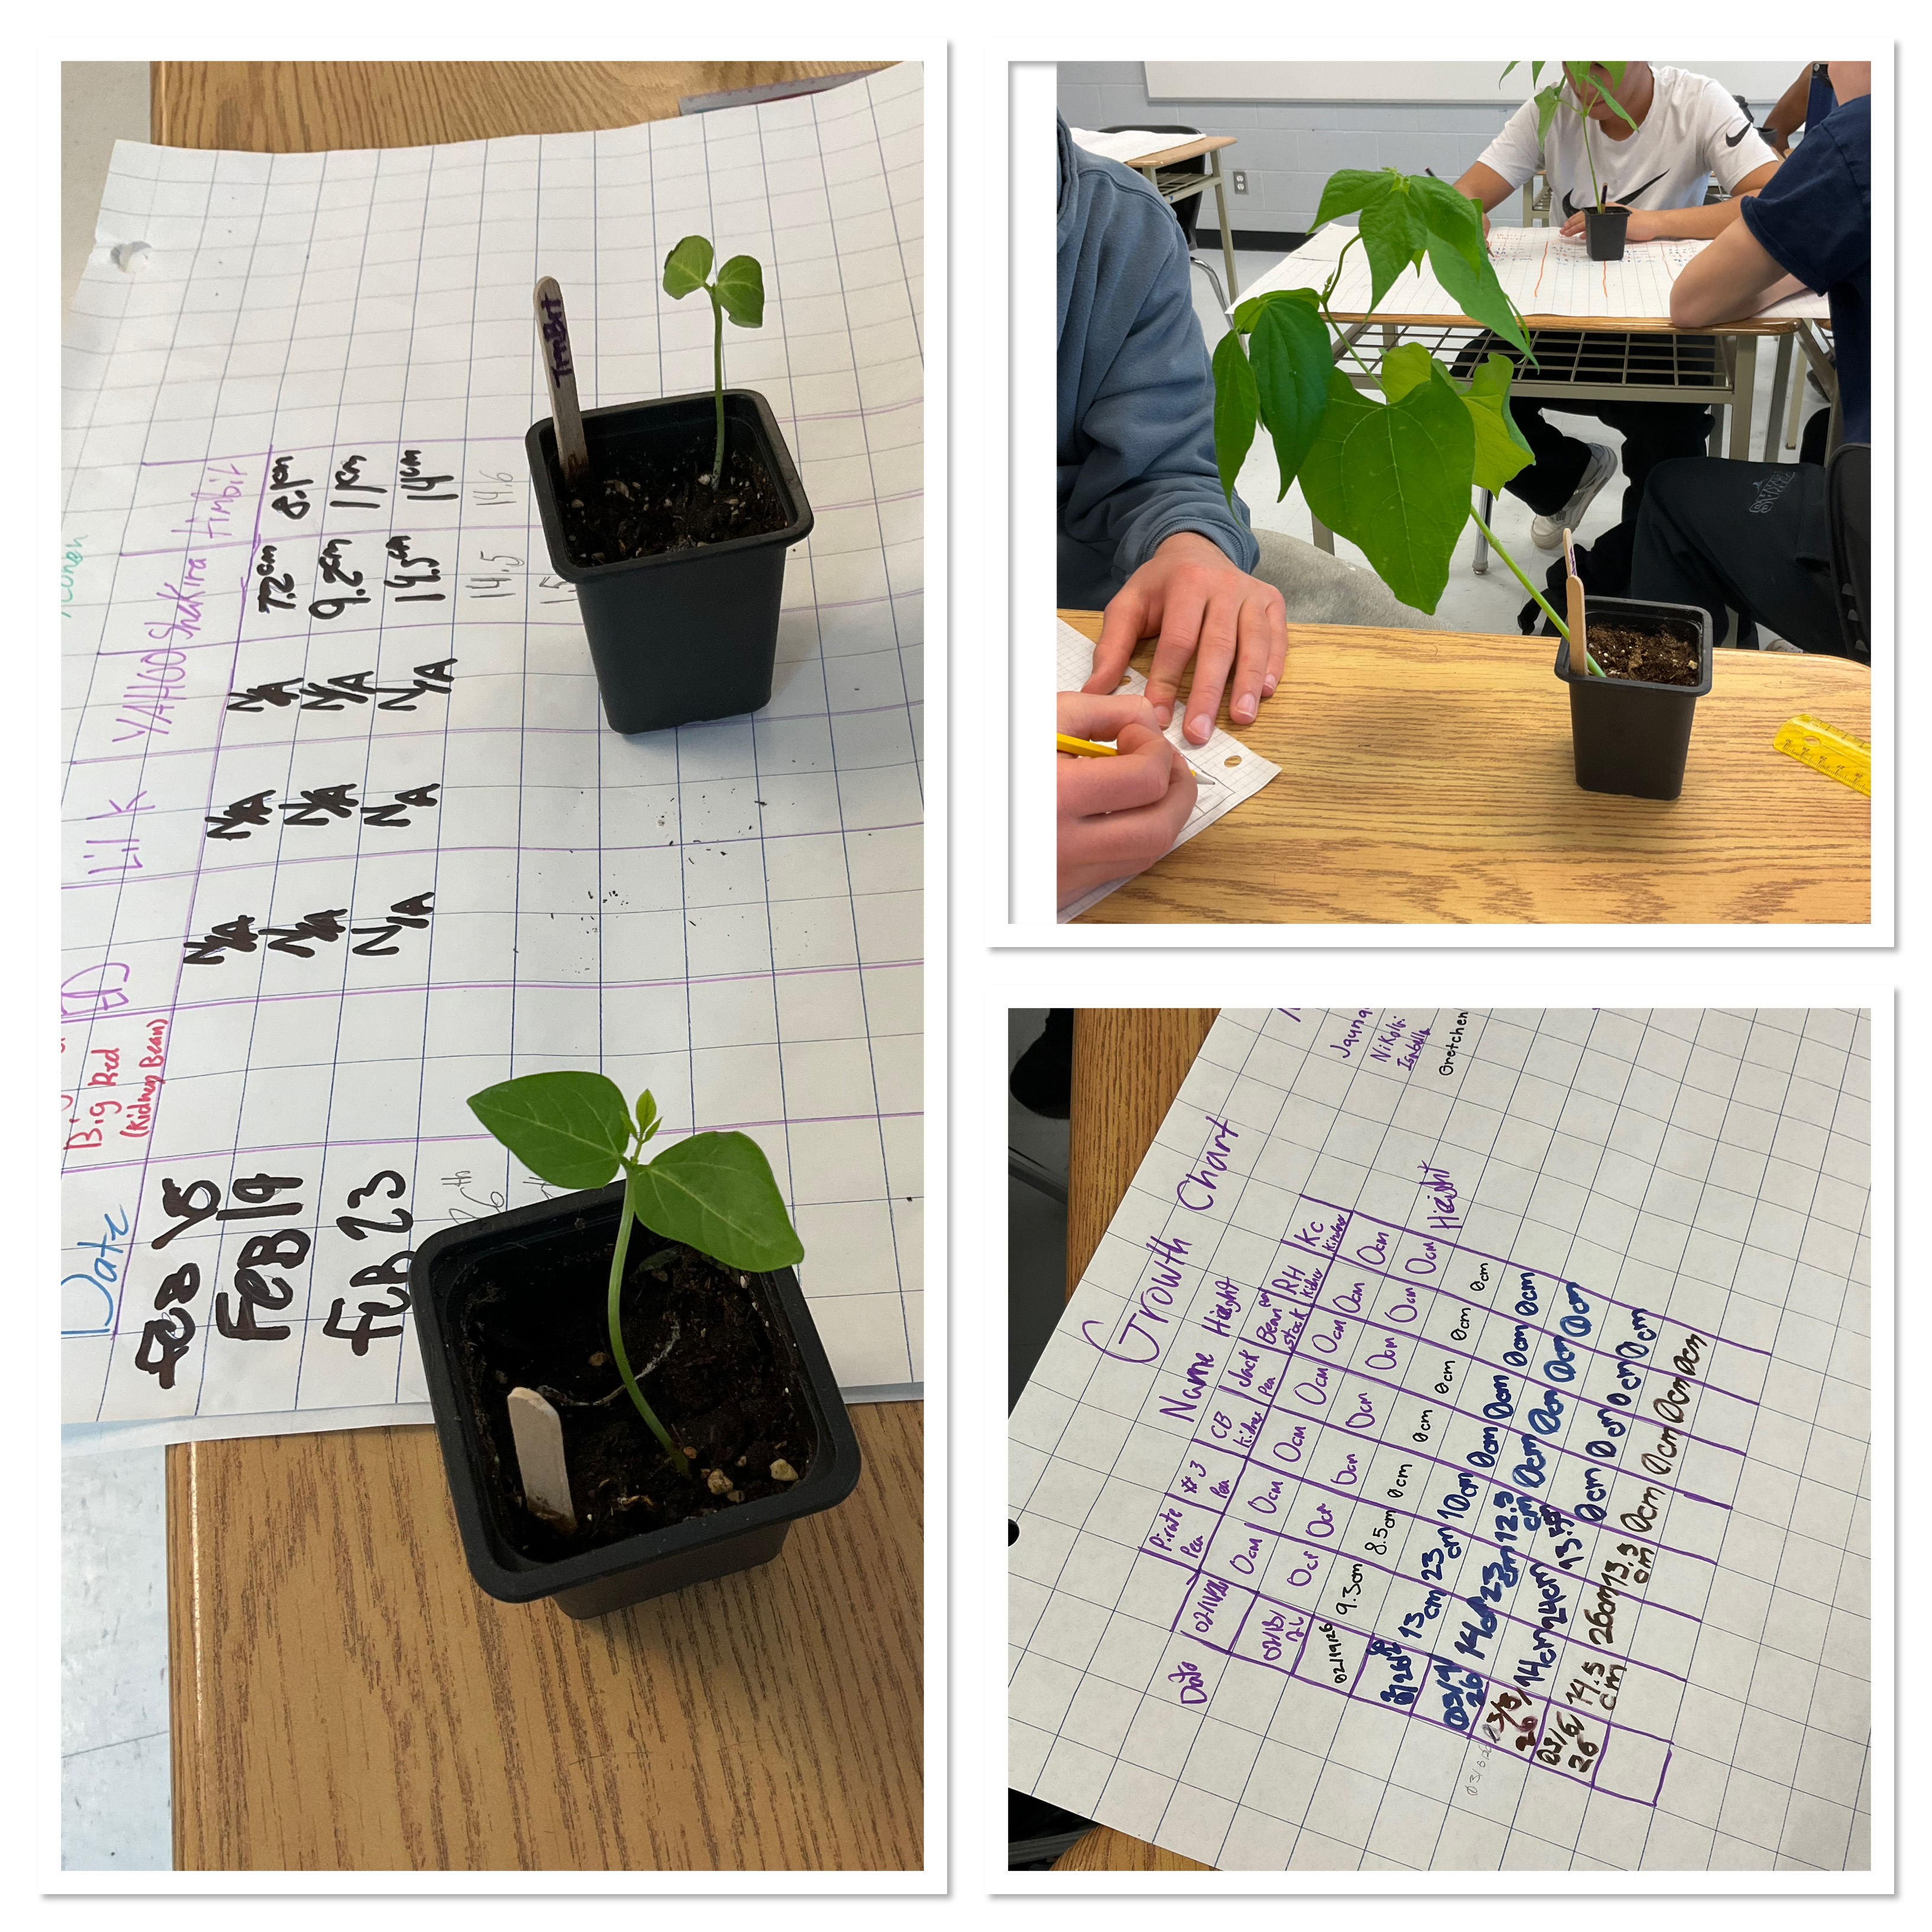
We made scatter plots, and discussed the importance of good communication like scales and titles. We talked about linear and non linear trends, and made lines and curves of best fit. For the lines we calculated the growth rate.
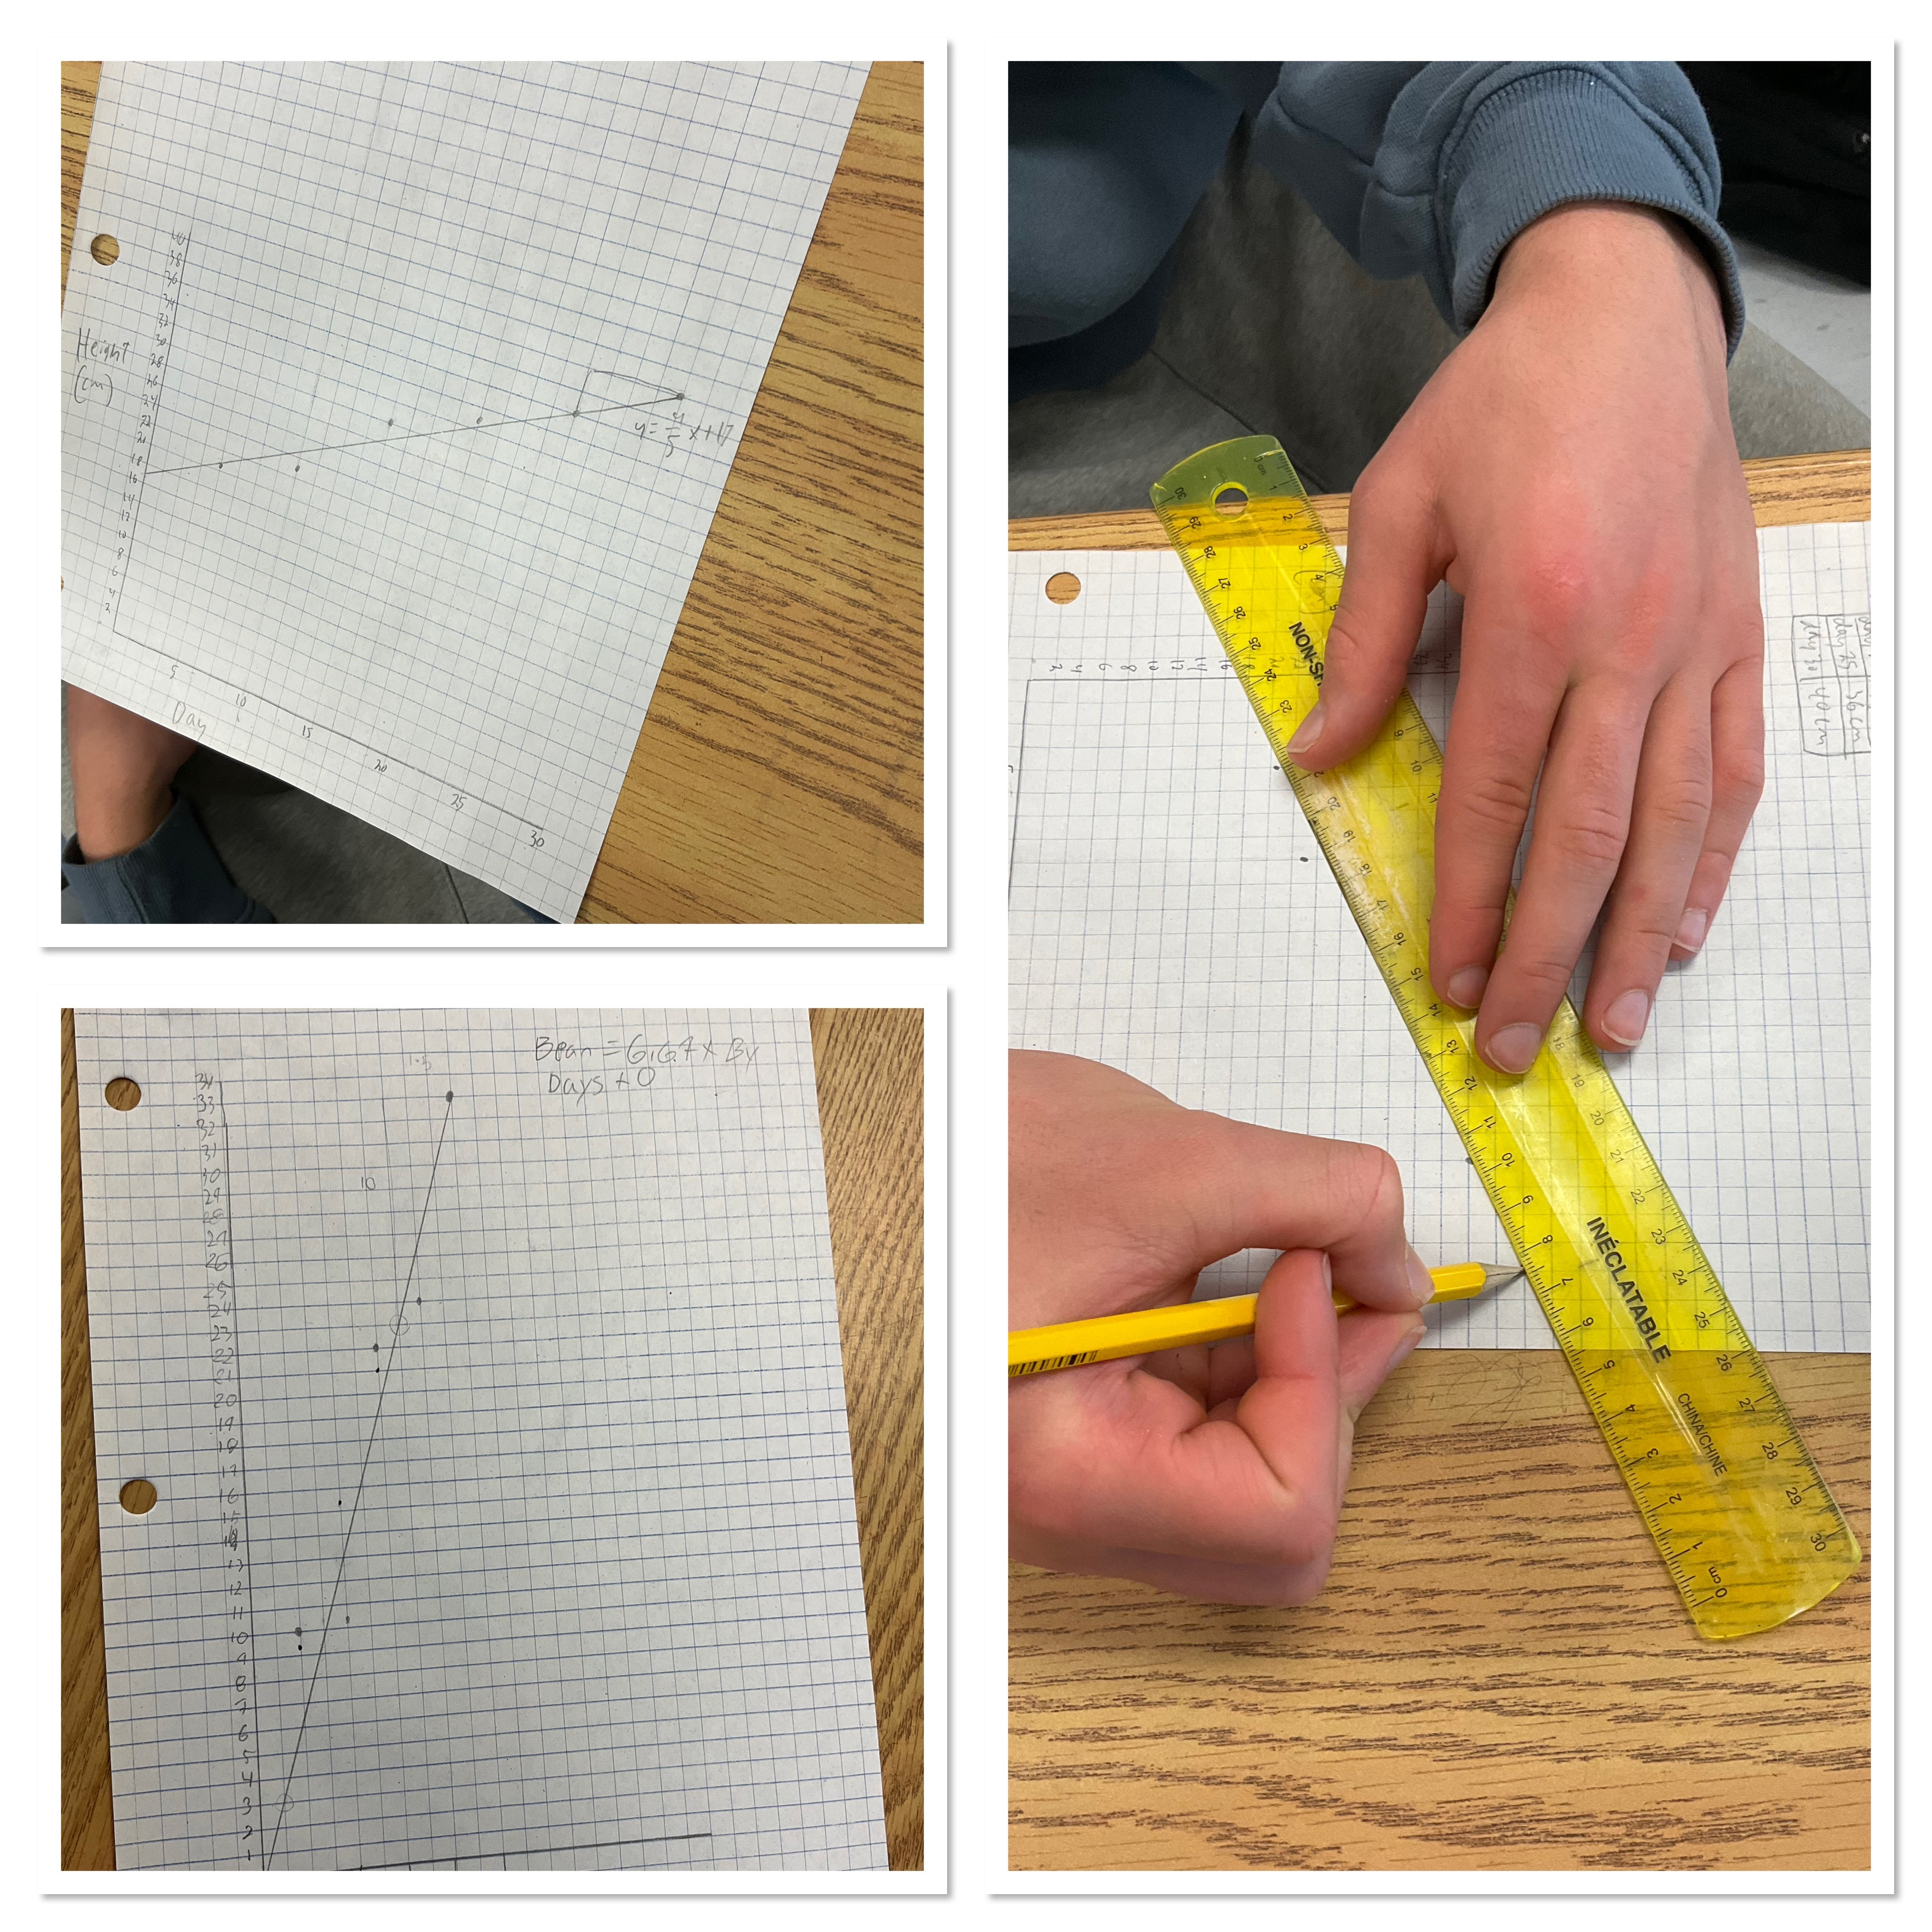
We found 2 points on our line of best fit, and then determined the rise and run between them. We simplified that fraction or made it a decimal. That is the growth rate. To find the height of the plant on any day, we needed to add the starting height to that rate. Some groups measured from the table and some from the soil level, so the initial heights were sometimes bigger than others.
It’s been a good project. Students can now being home their beans for the holiday and watch the flowers form and bloom.
