Modelling growth in grade 12
Today I was in with my colleague’s grade 12 college math class. We were working on modelling various patterns yesterday, and continued today.
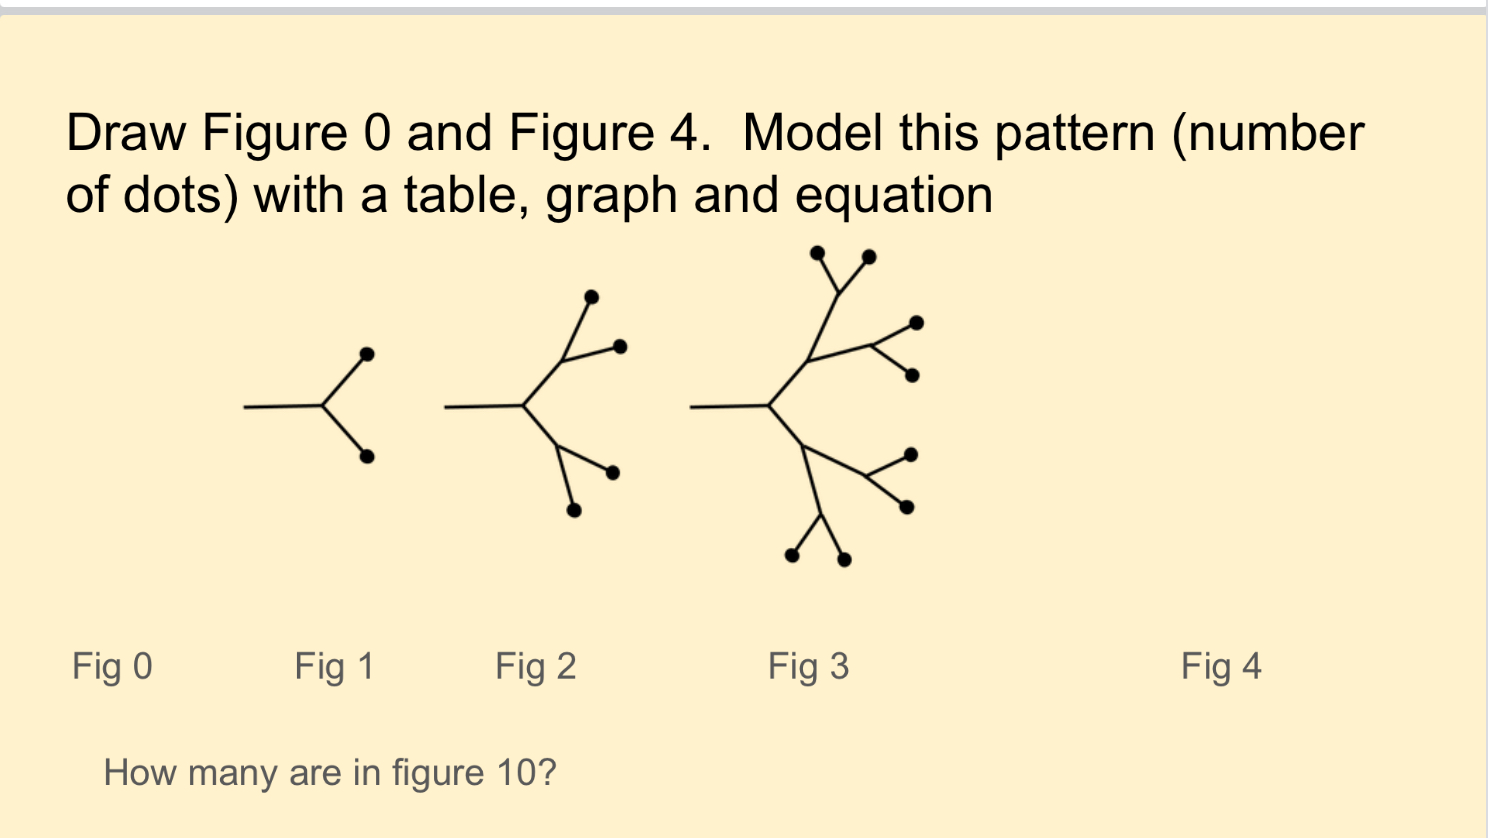
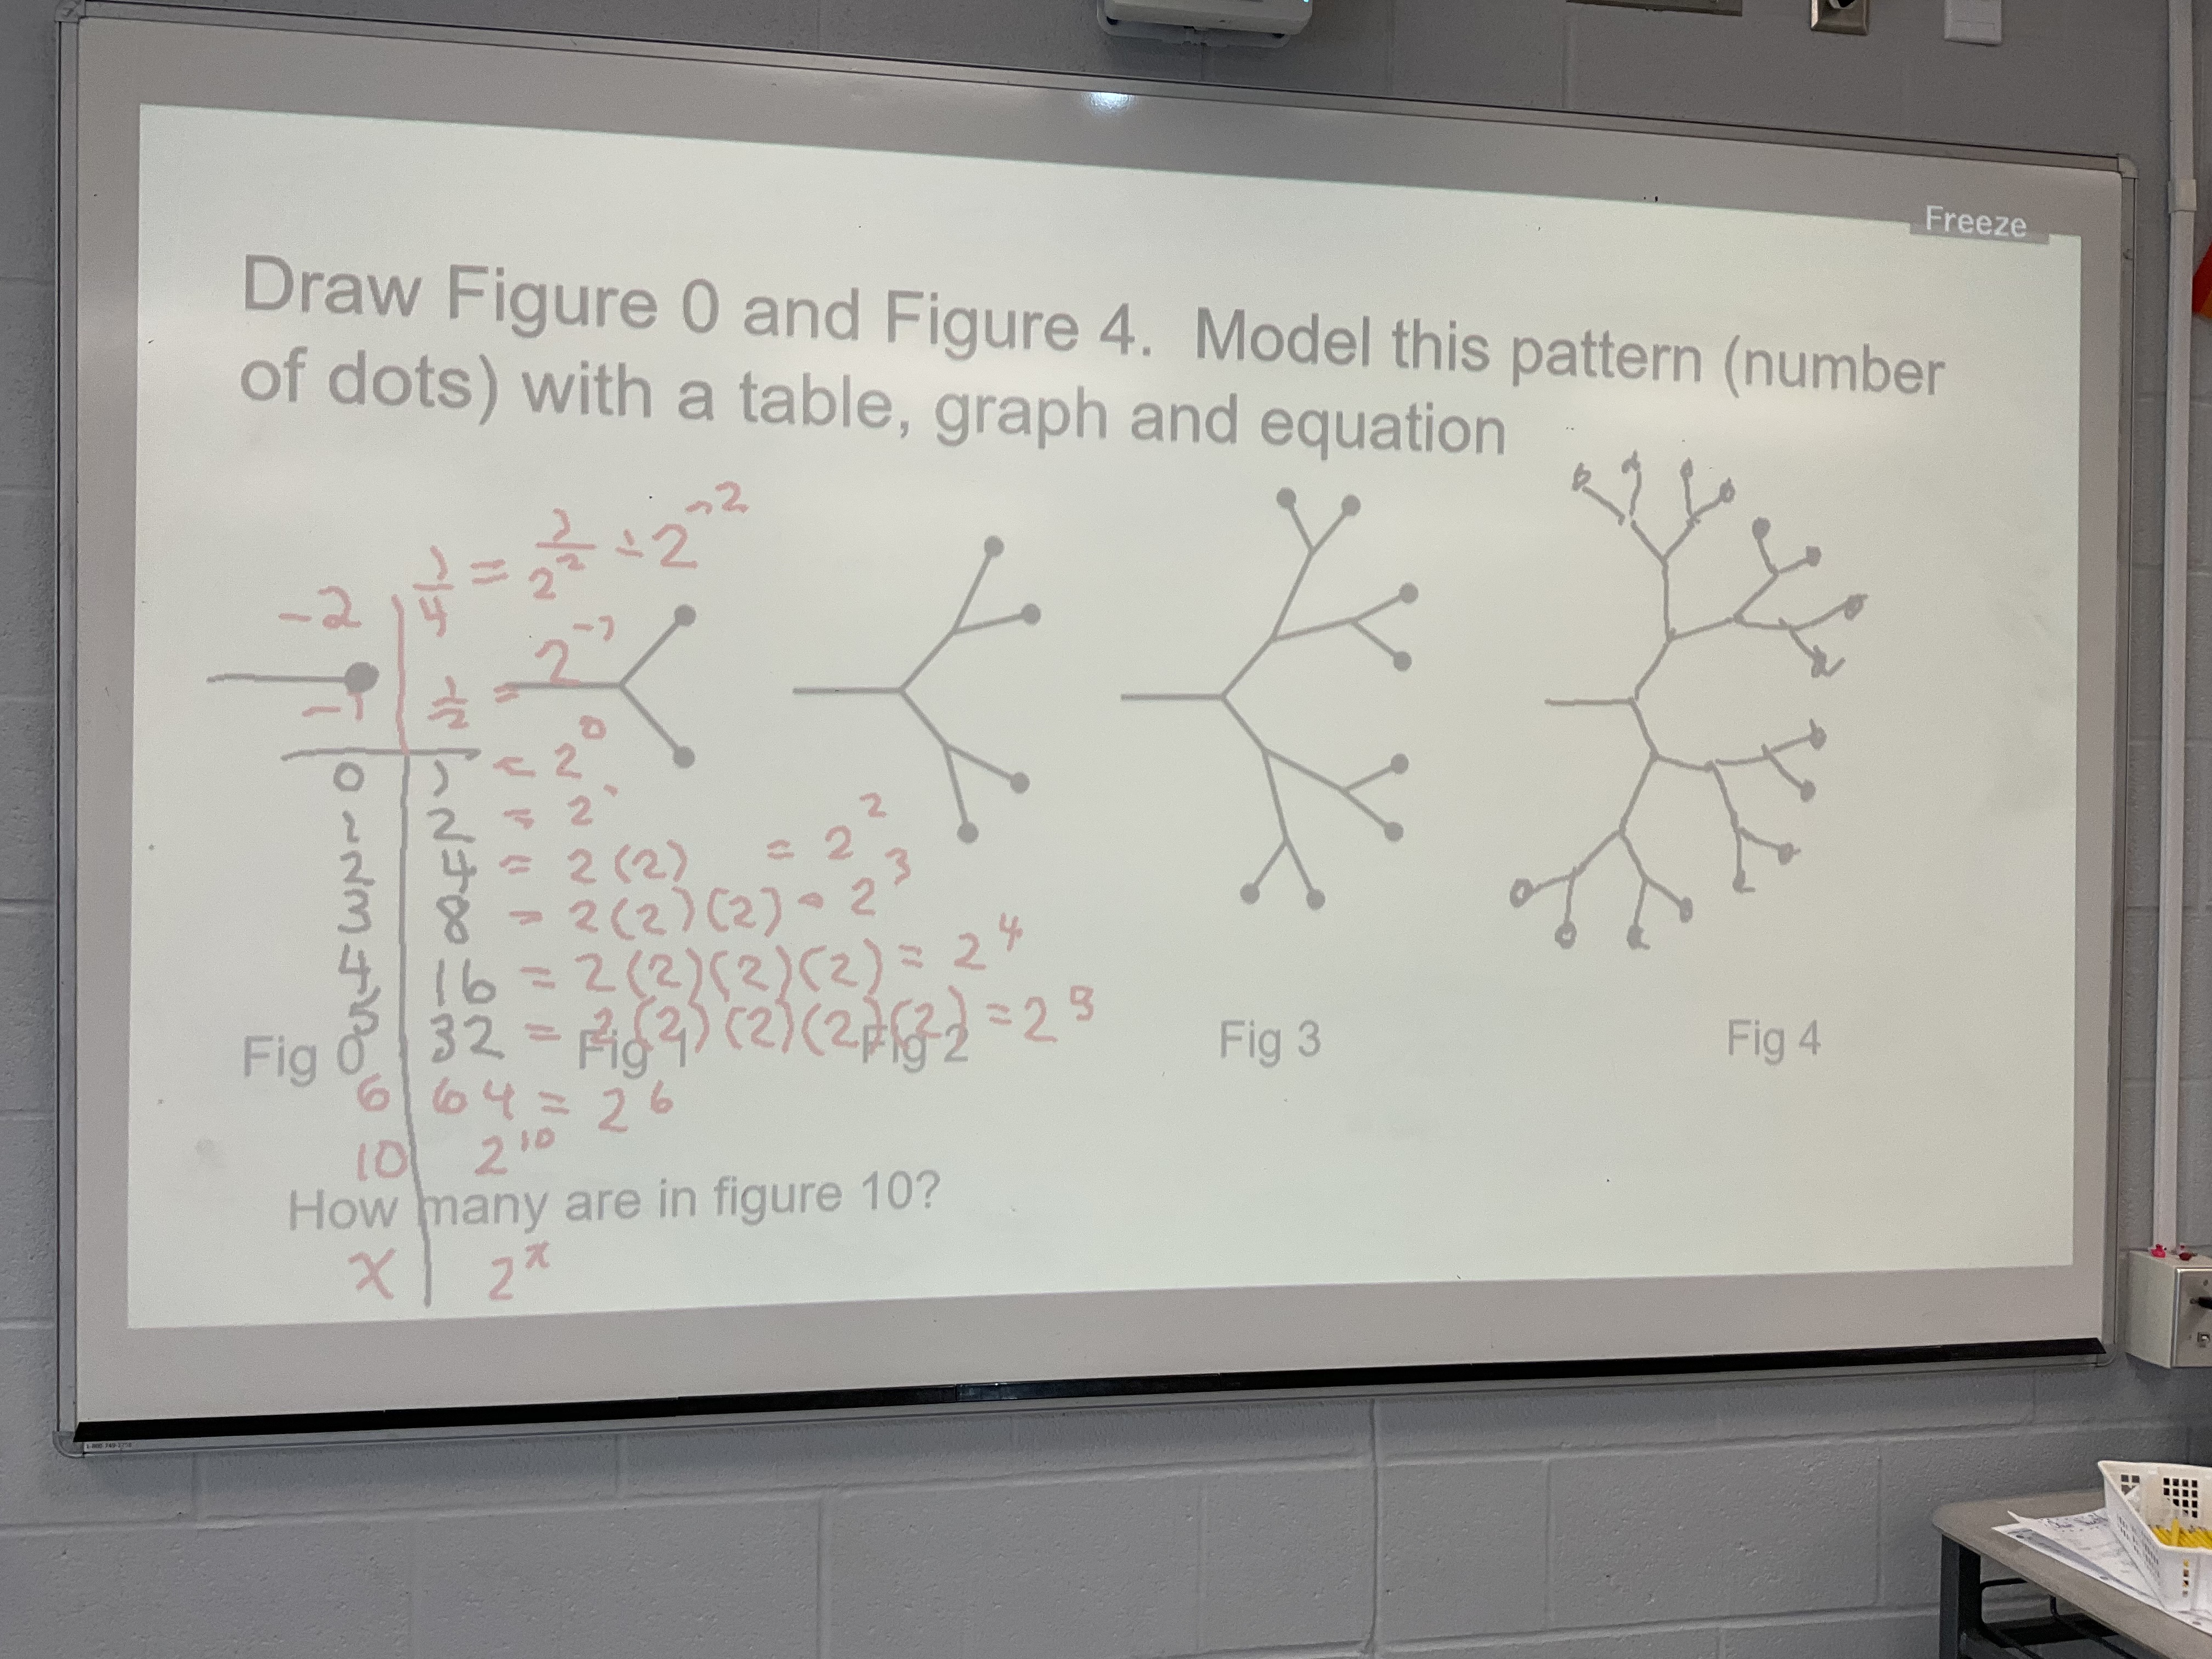
We made pictures, then tables, and noticed that they double and double and double. We made graphs, and explored what would happen if we went to figure -1 and figure -2 and figure -3, we’d be dividing by 2 as we move up the table.
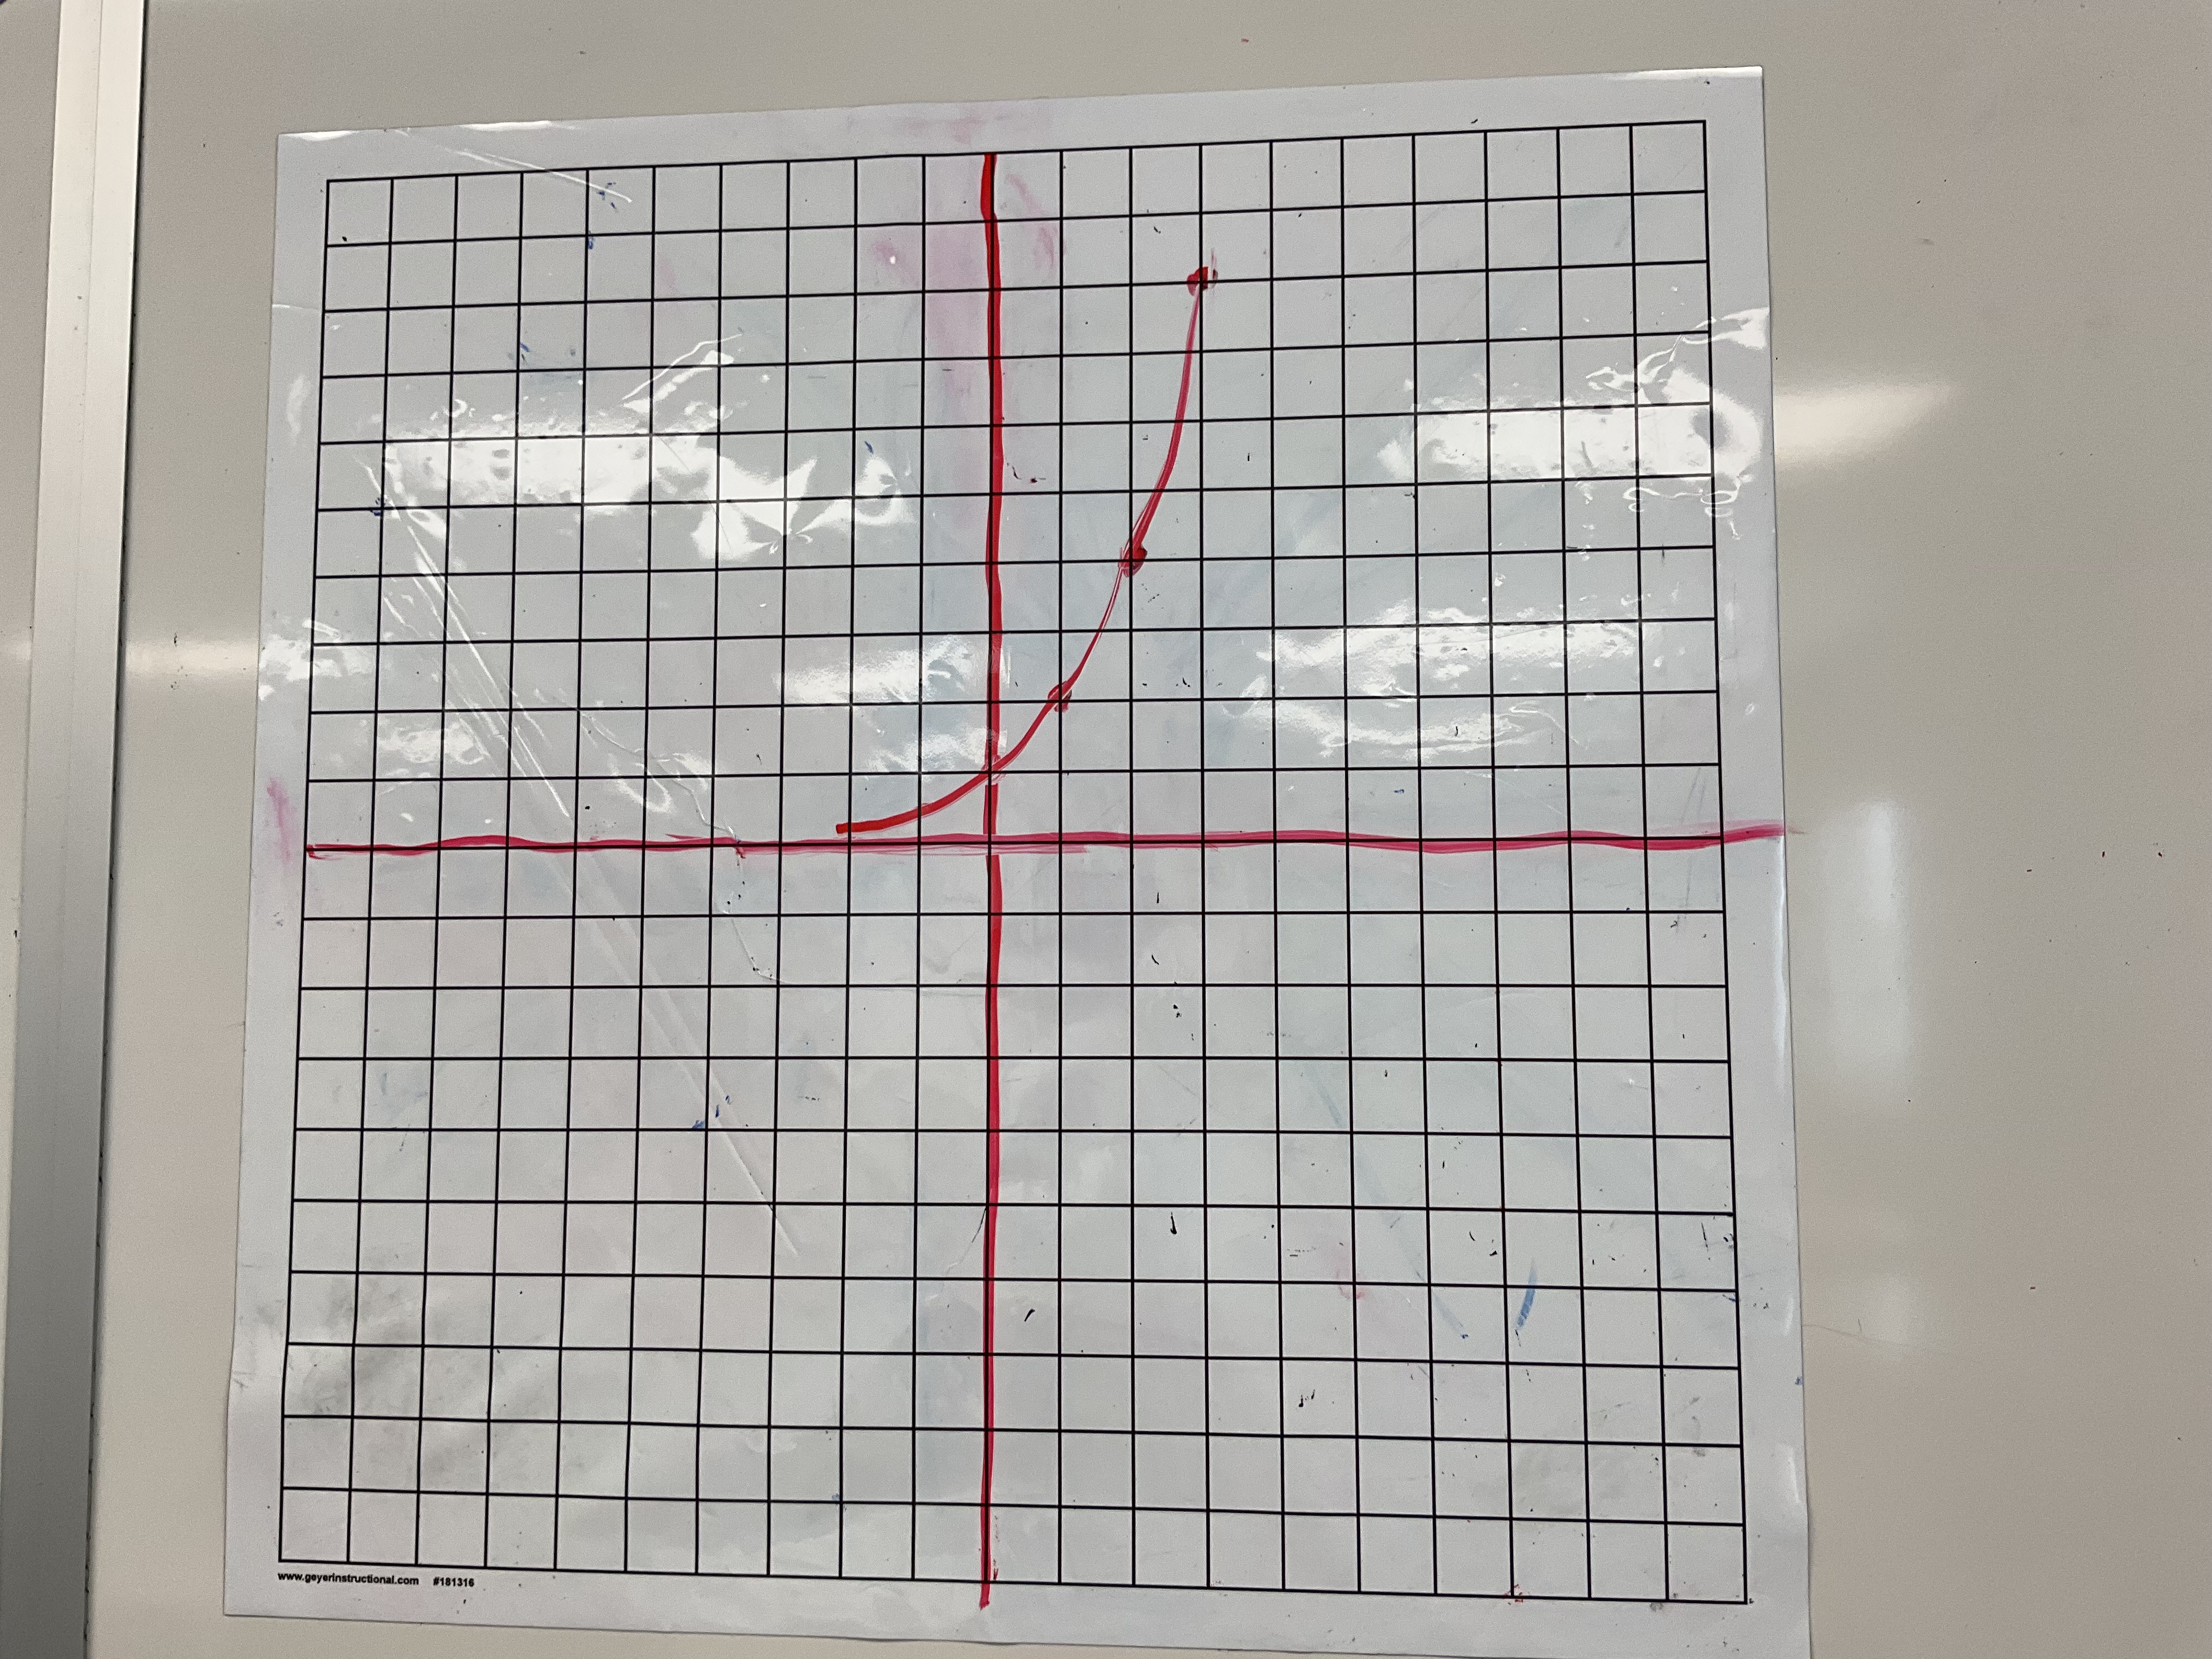
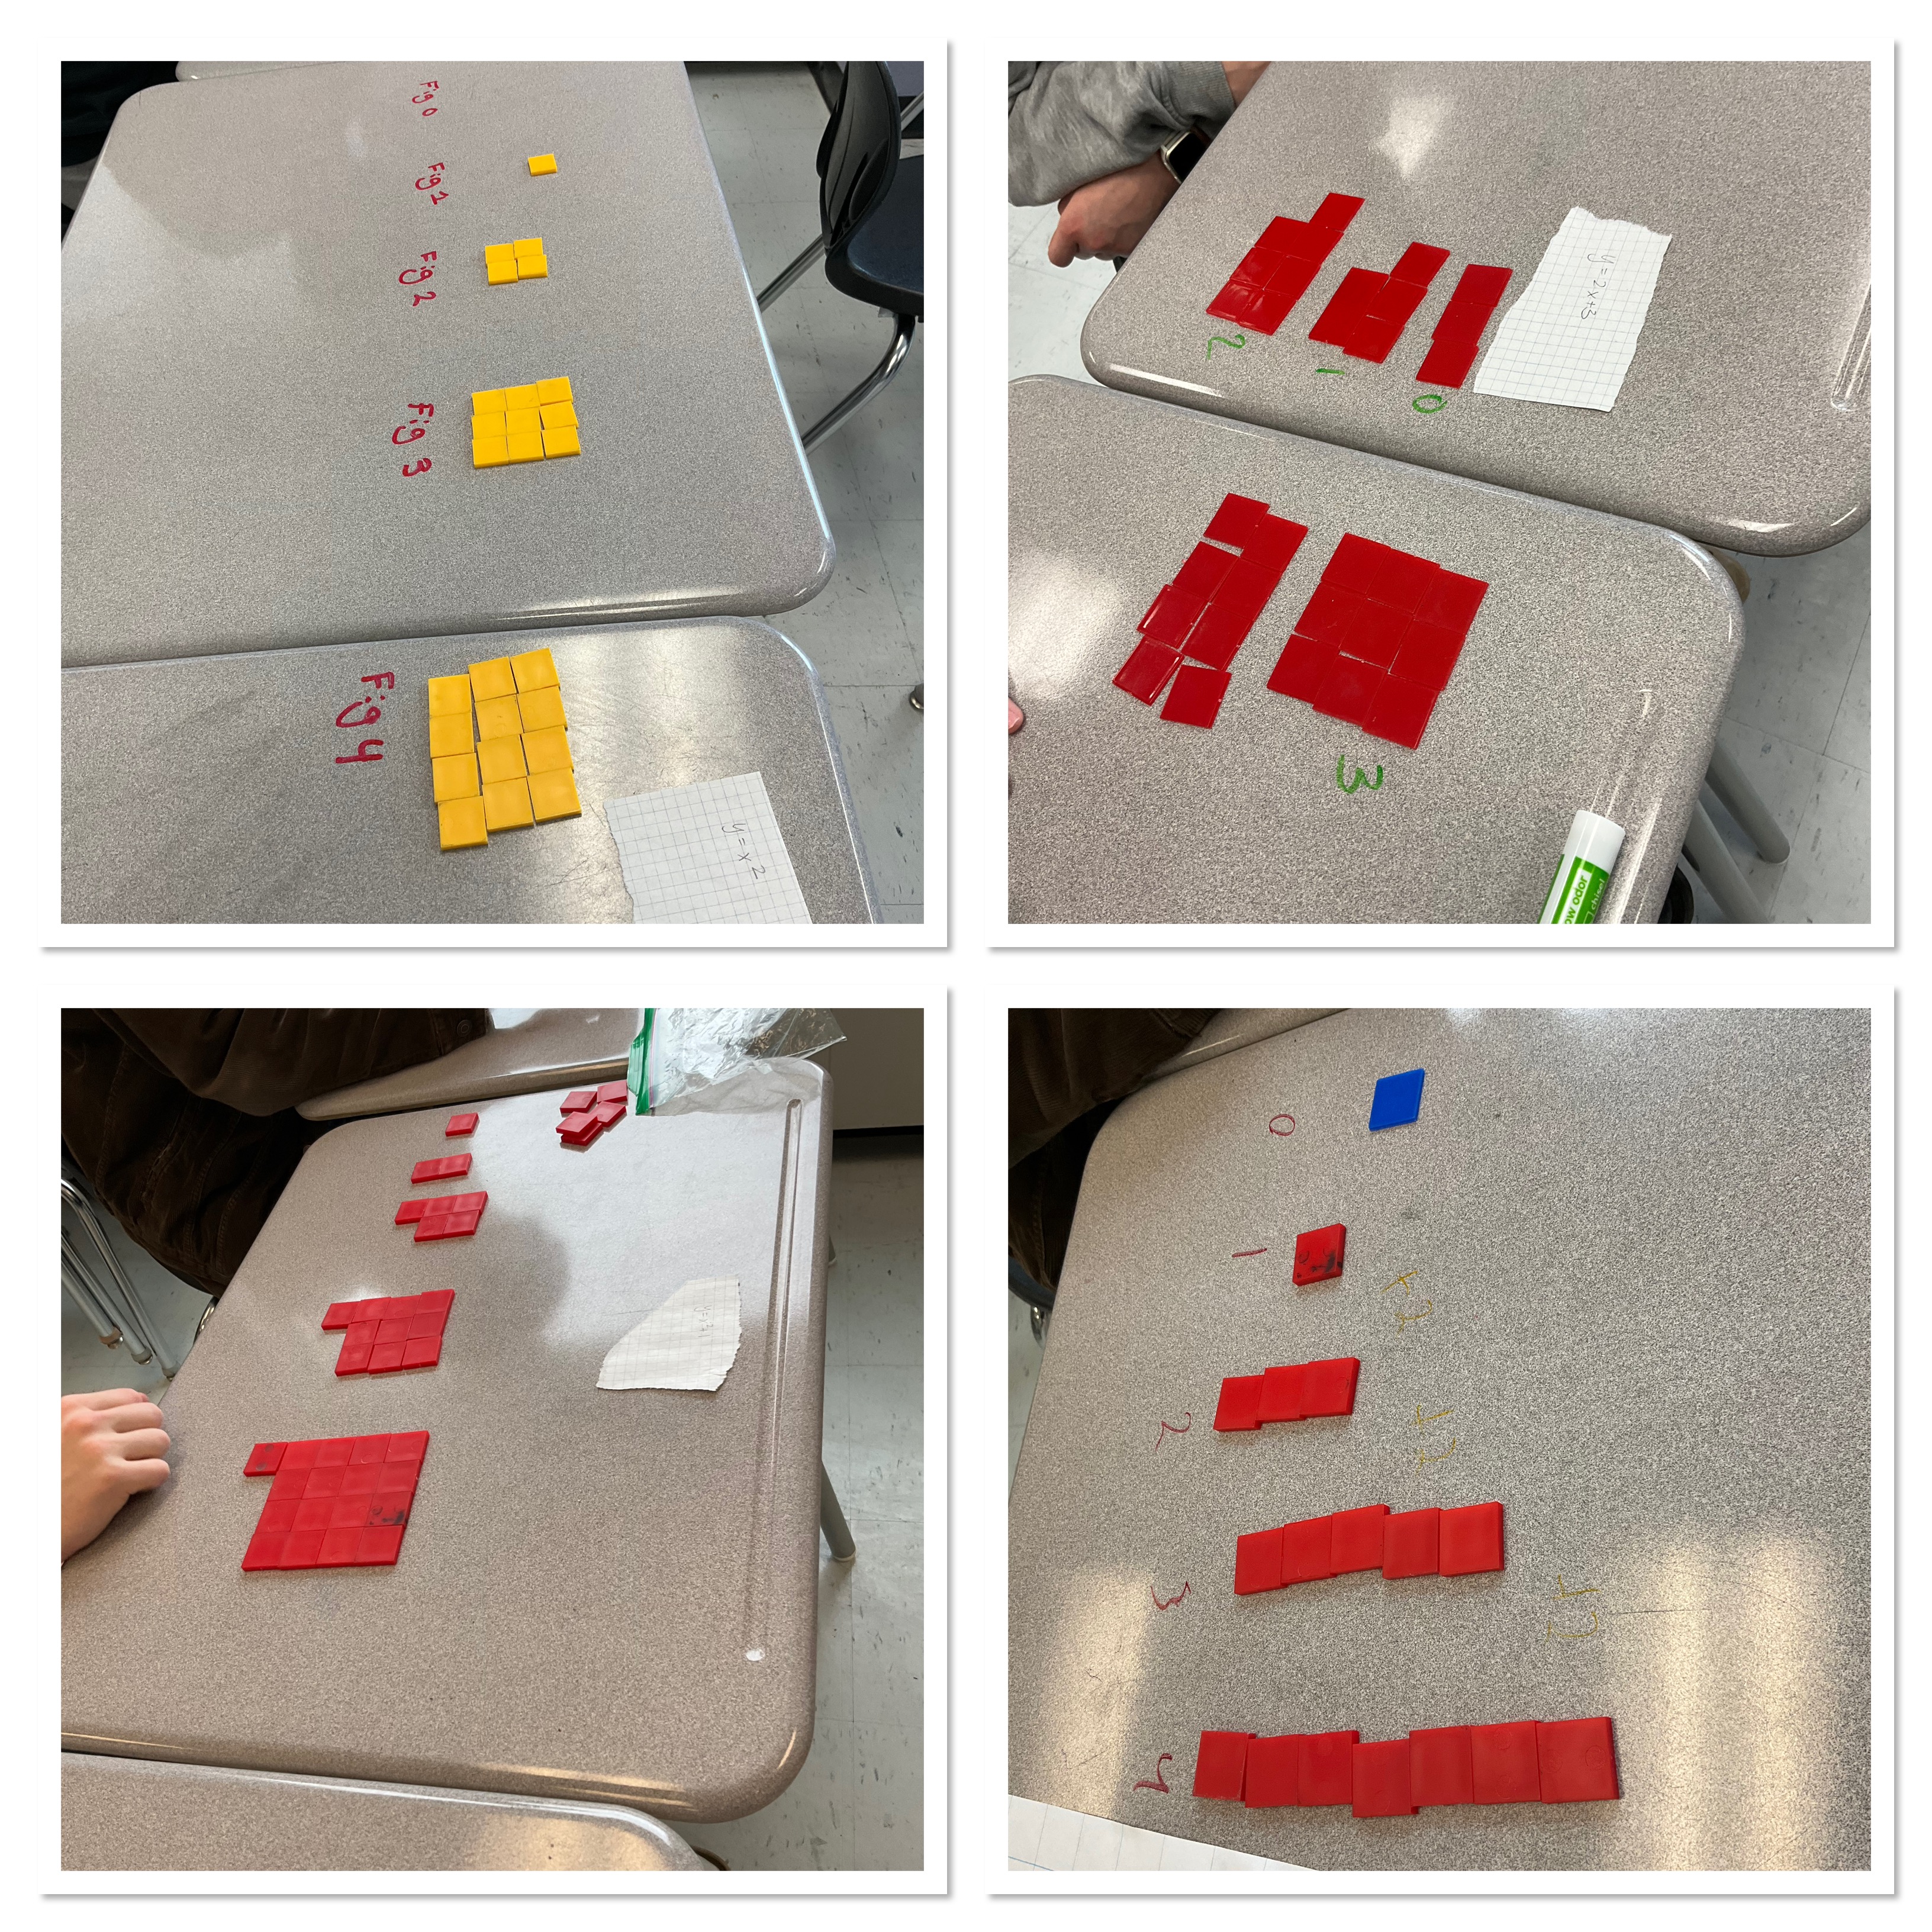
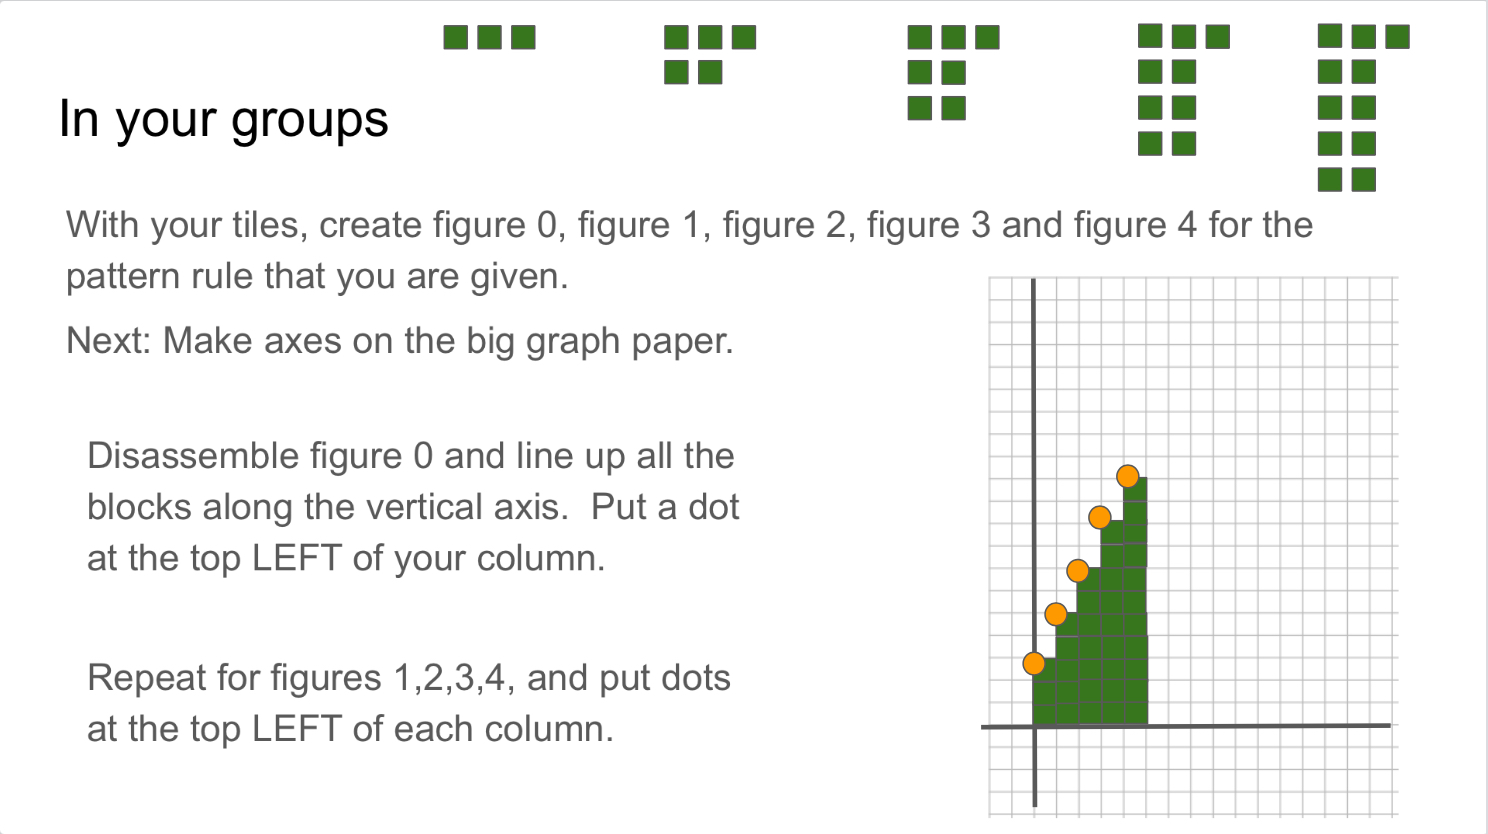
Next we explored making patterns of our own to correspond to pattern rules (equations). Some groups had linear patterns, others had quadratic, and one had exponential.
Once they represented their pattern, they got a graph paper, and transferred their tiles to make the graph.
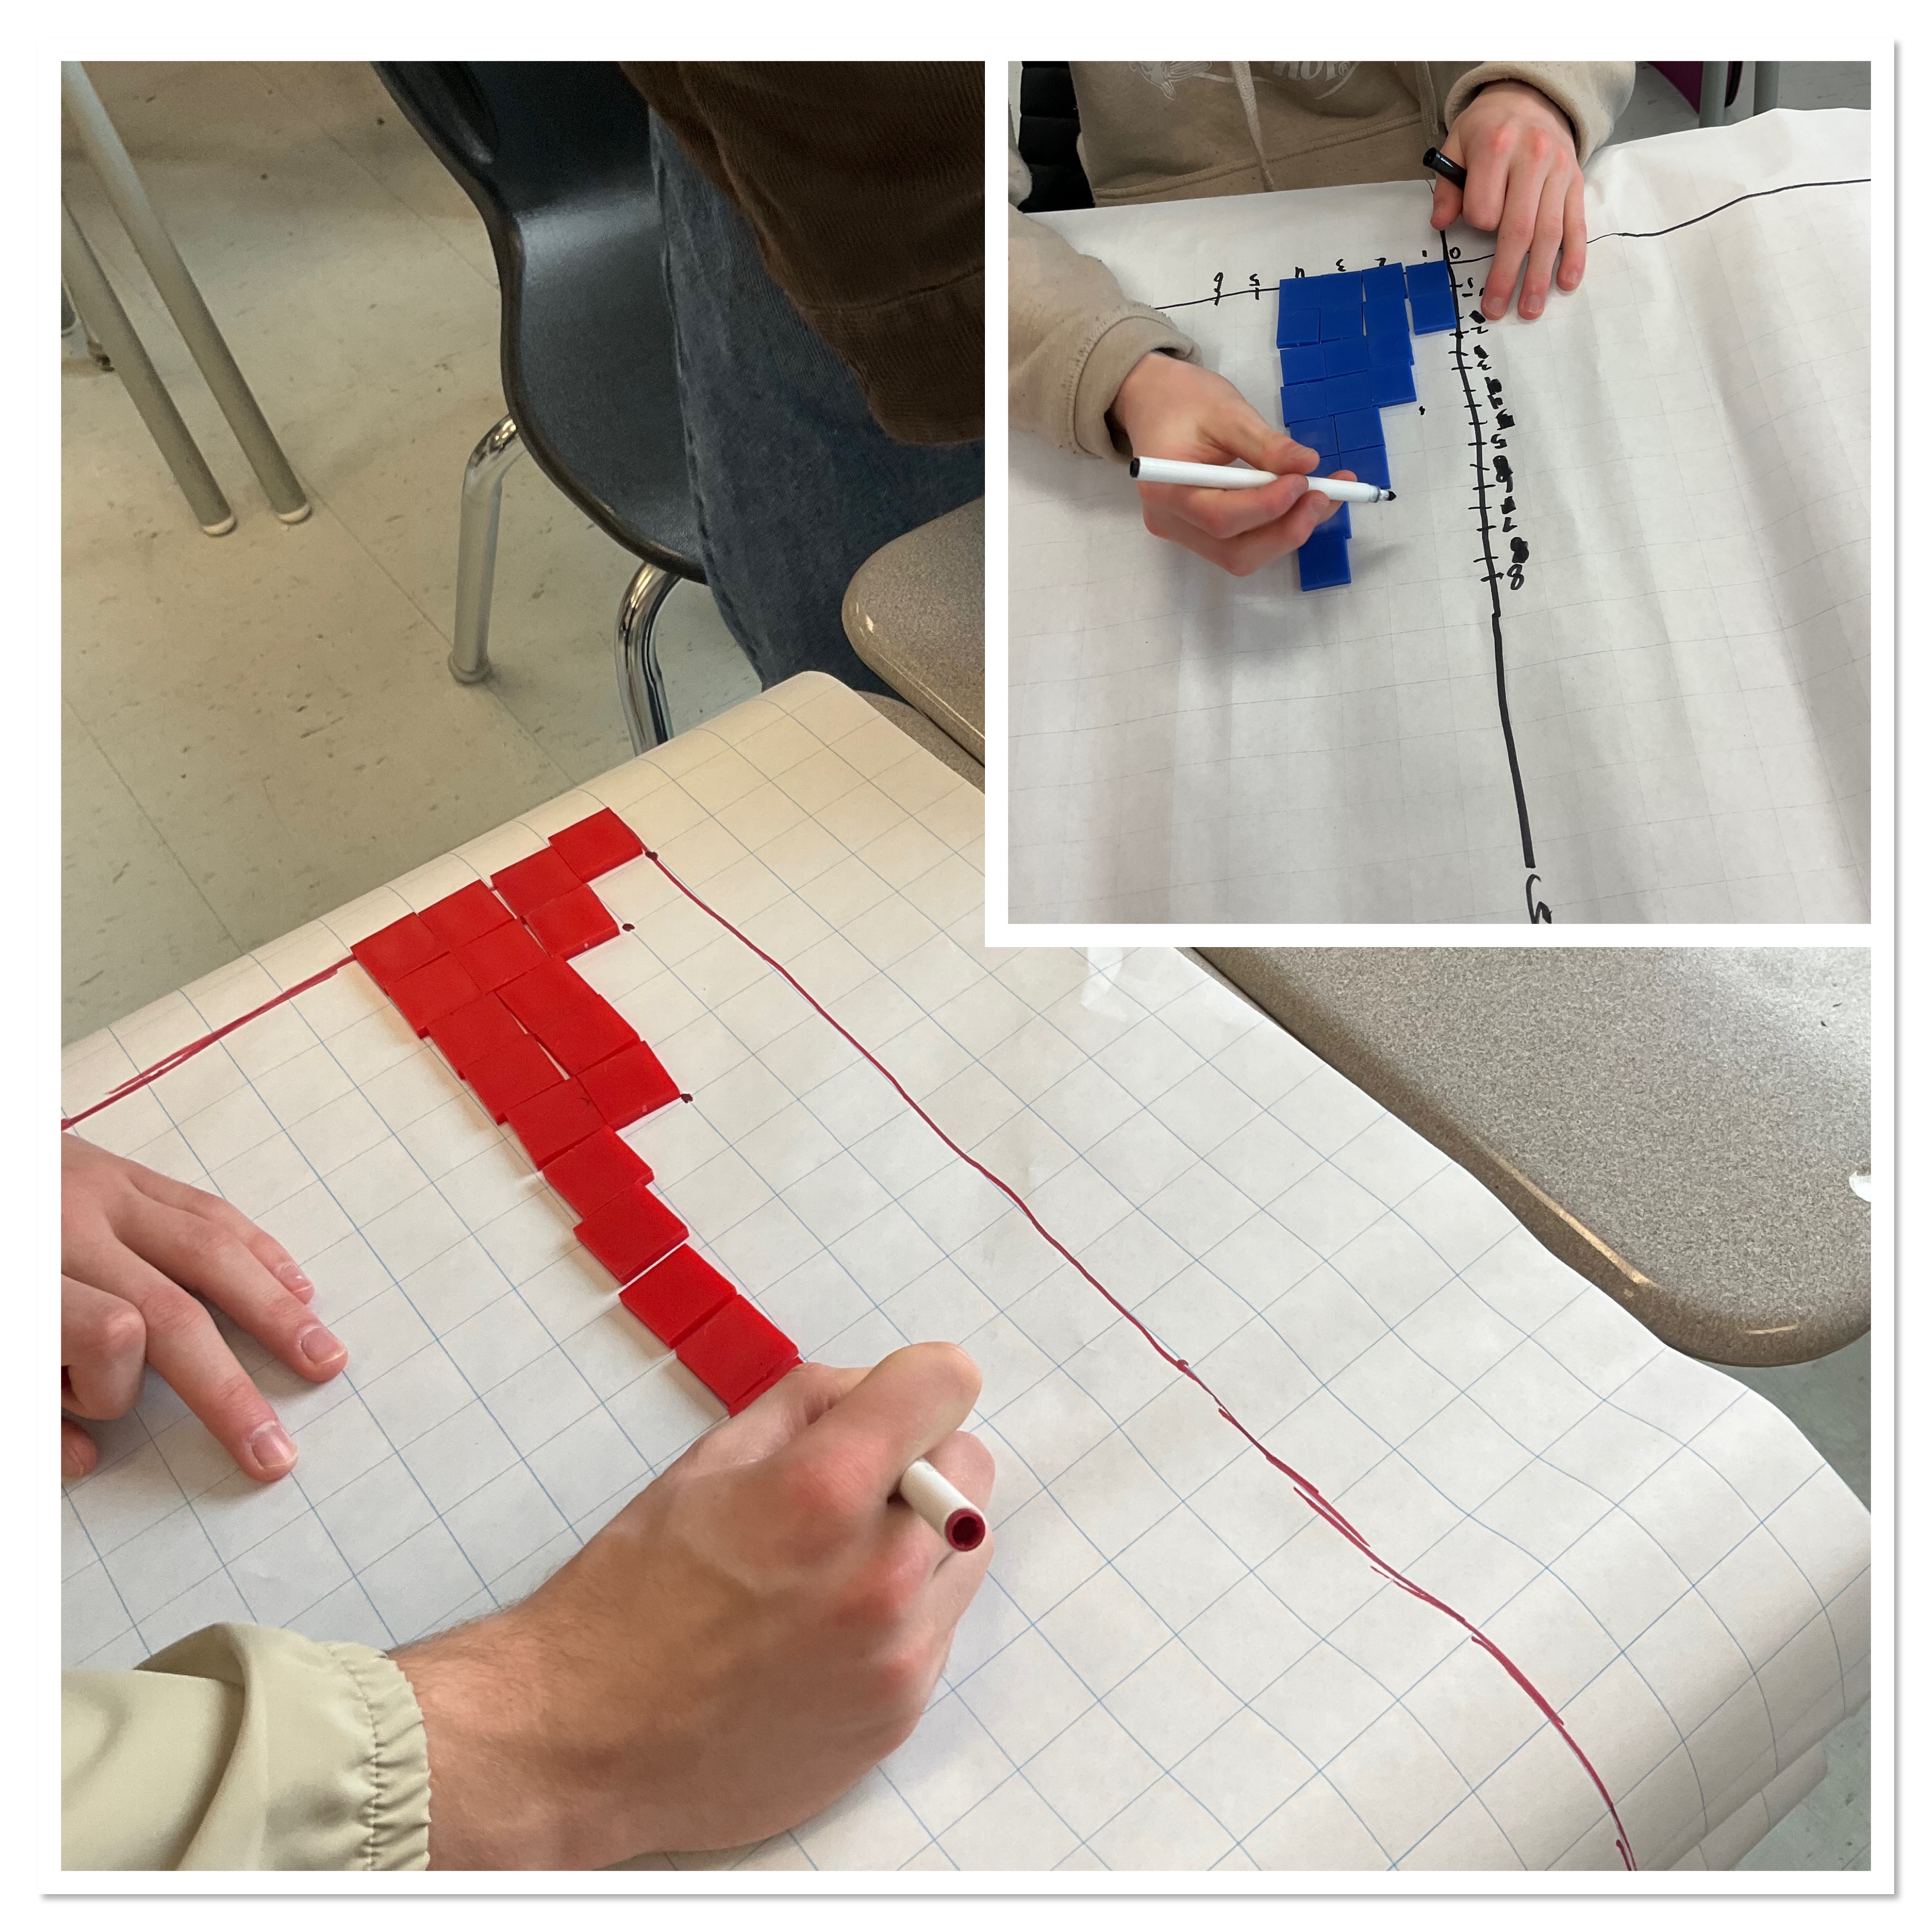
Groups got another set of rules, built the patterns, then the graphs. Some had time to do a few patterns. In the end we consolidated their work with a gallery walk and introduction of new vocabulary.
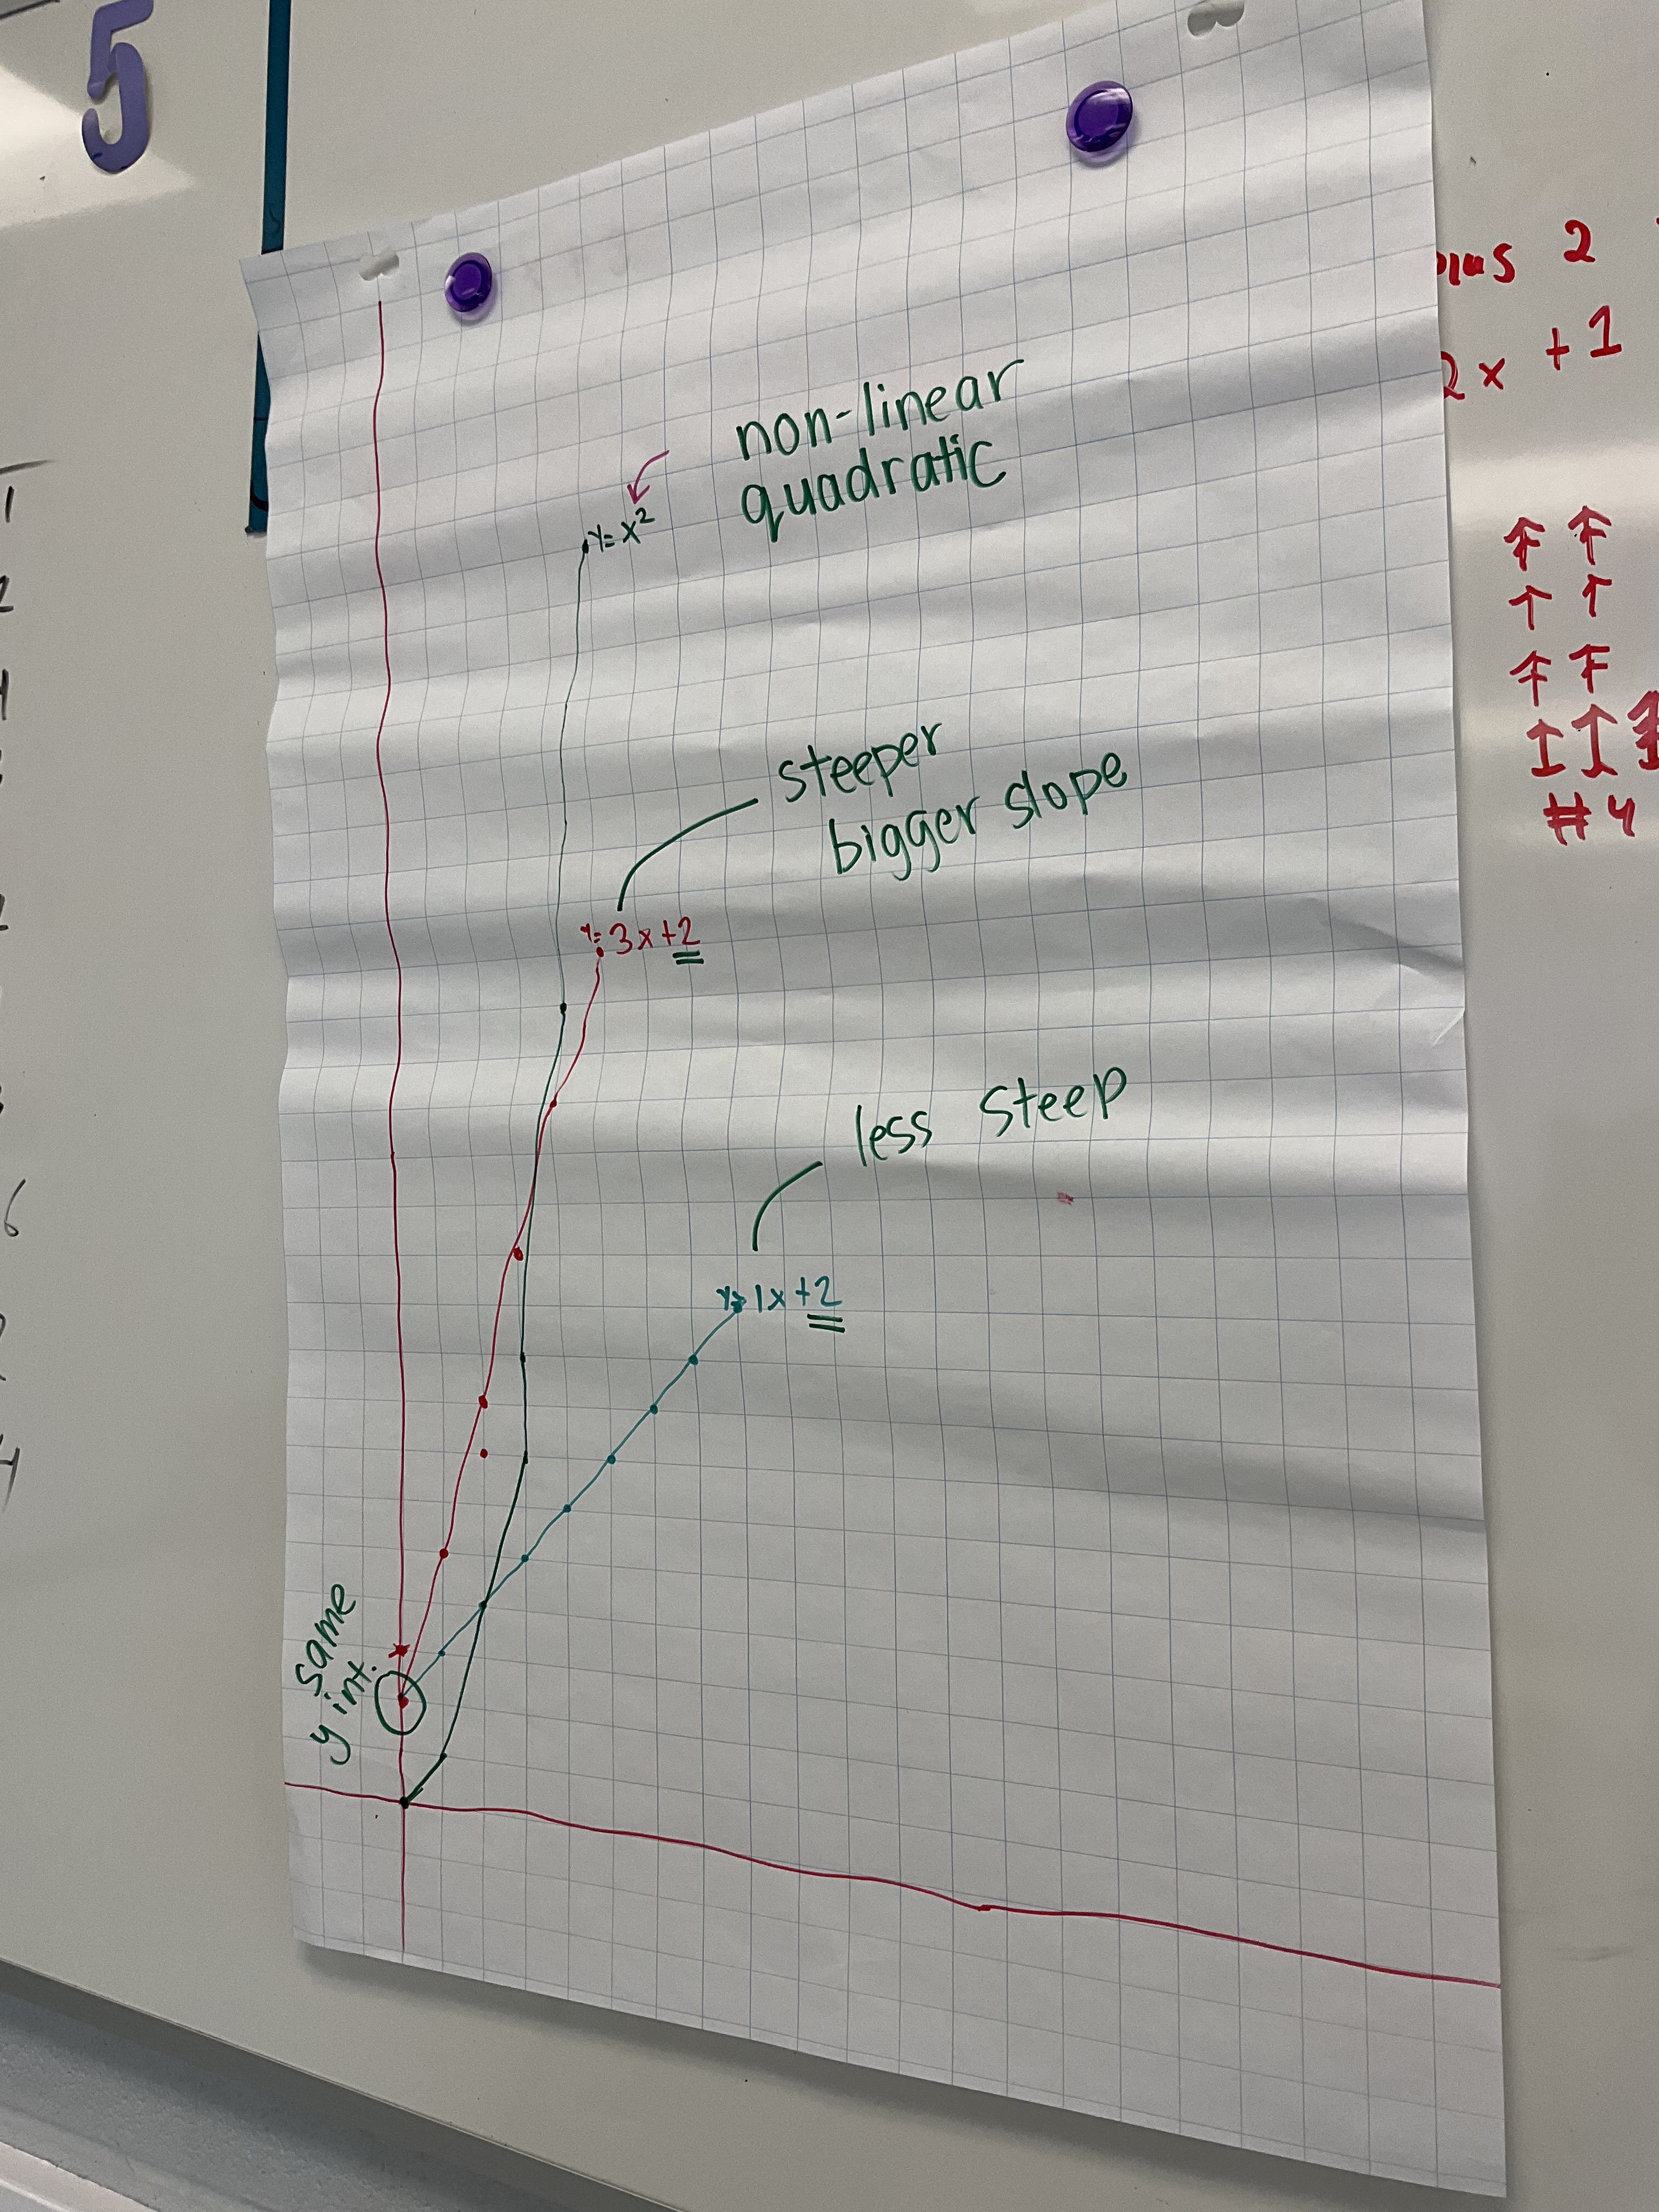
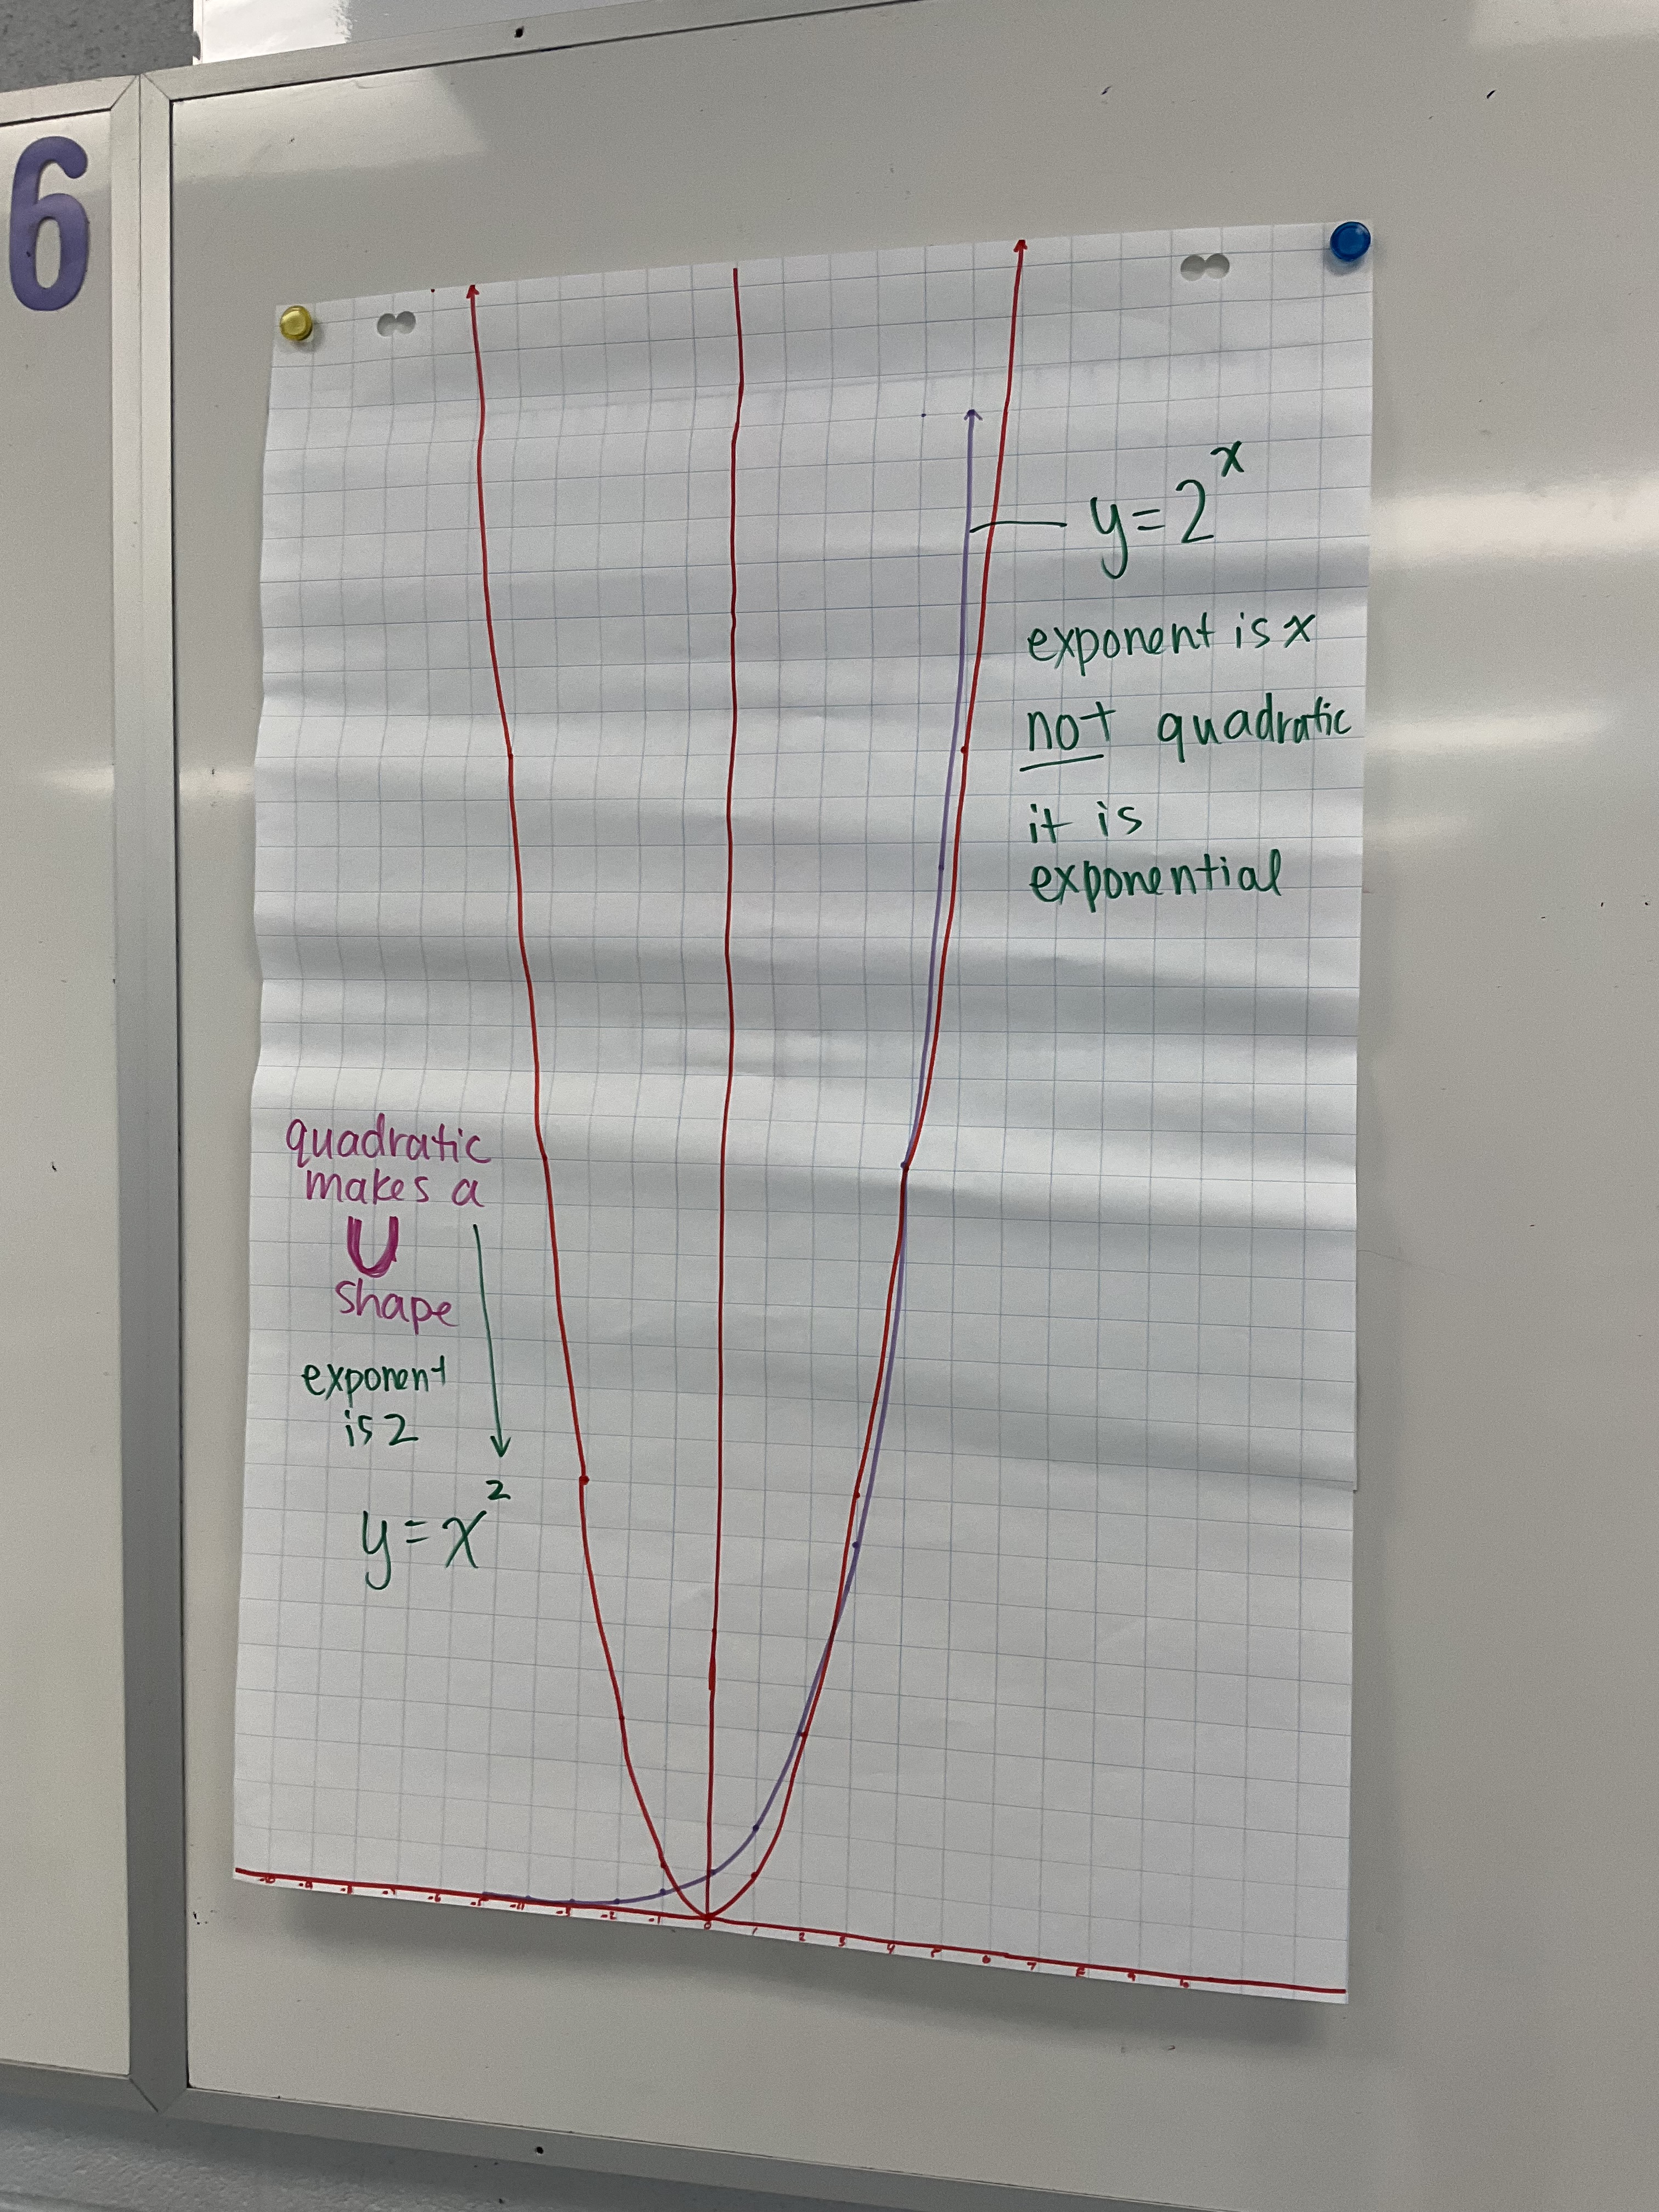
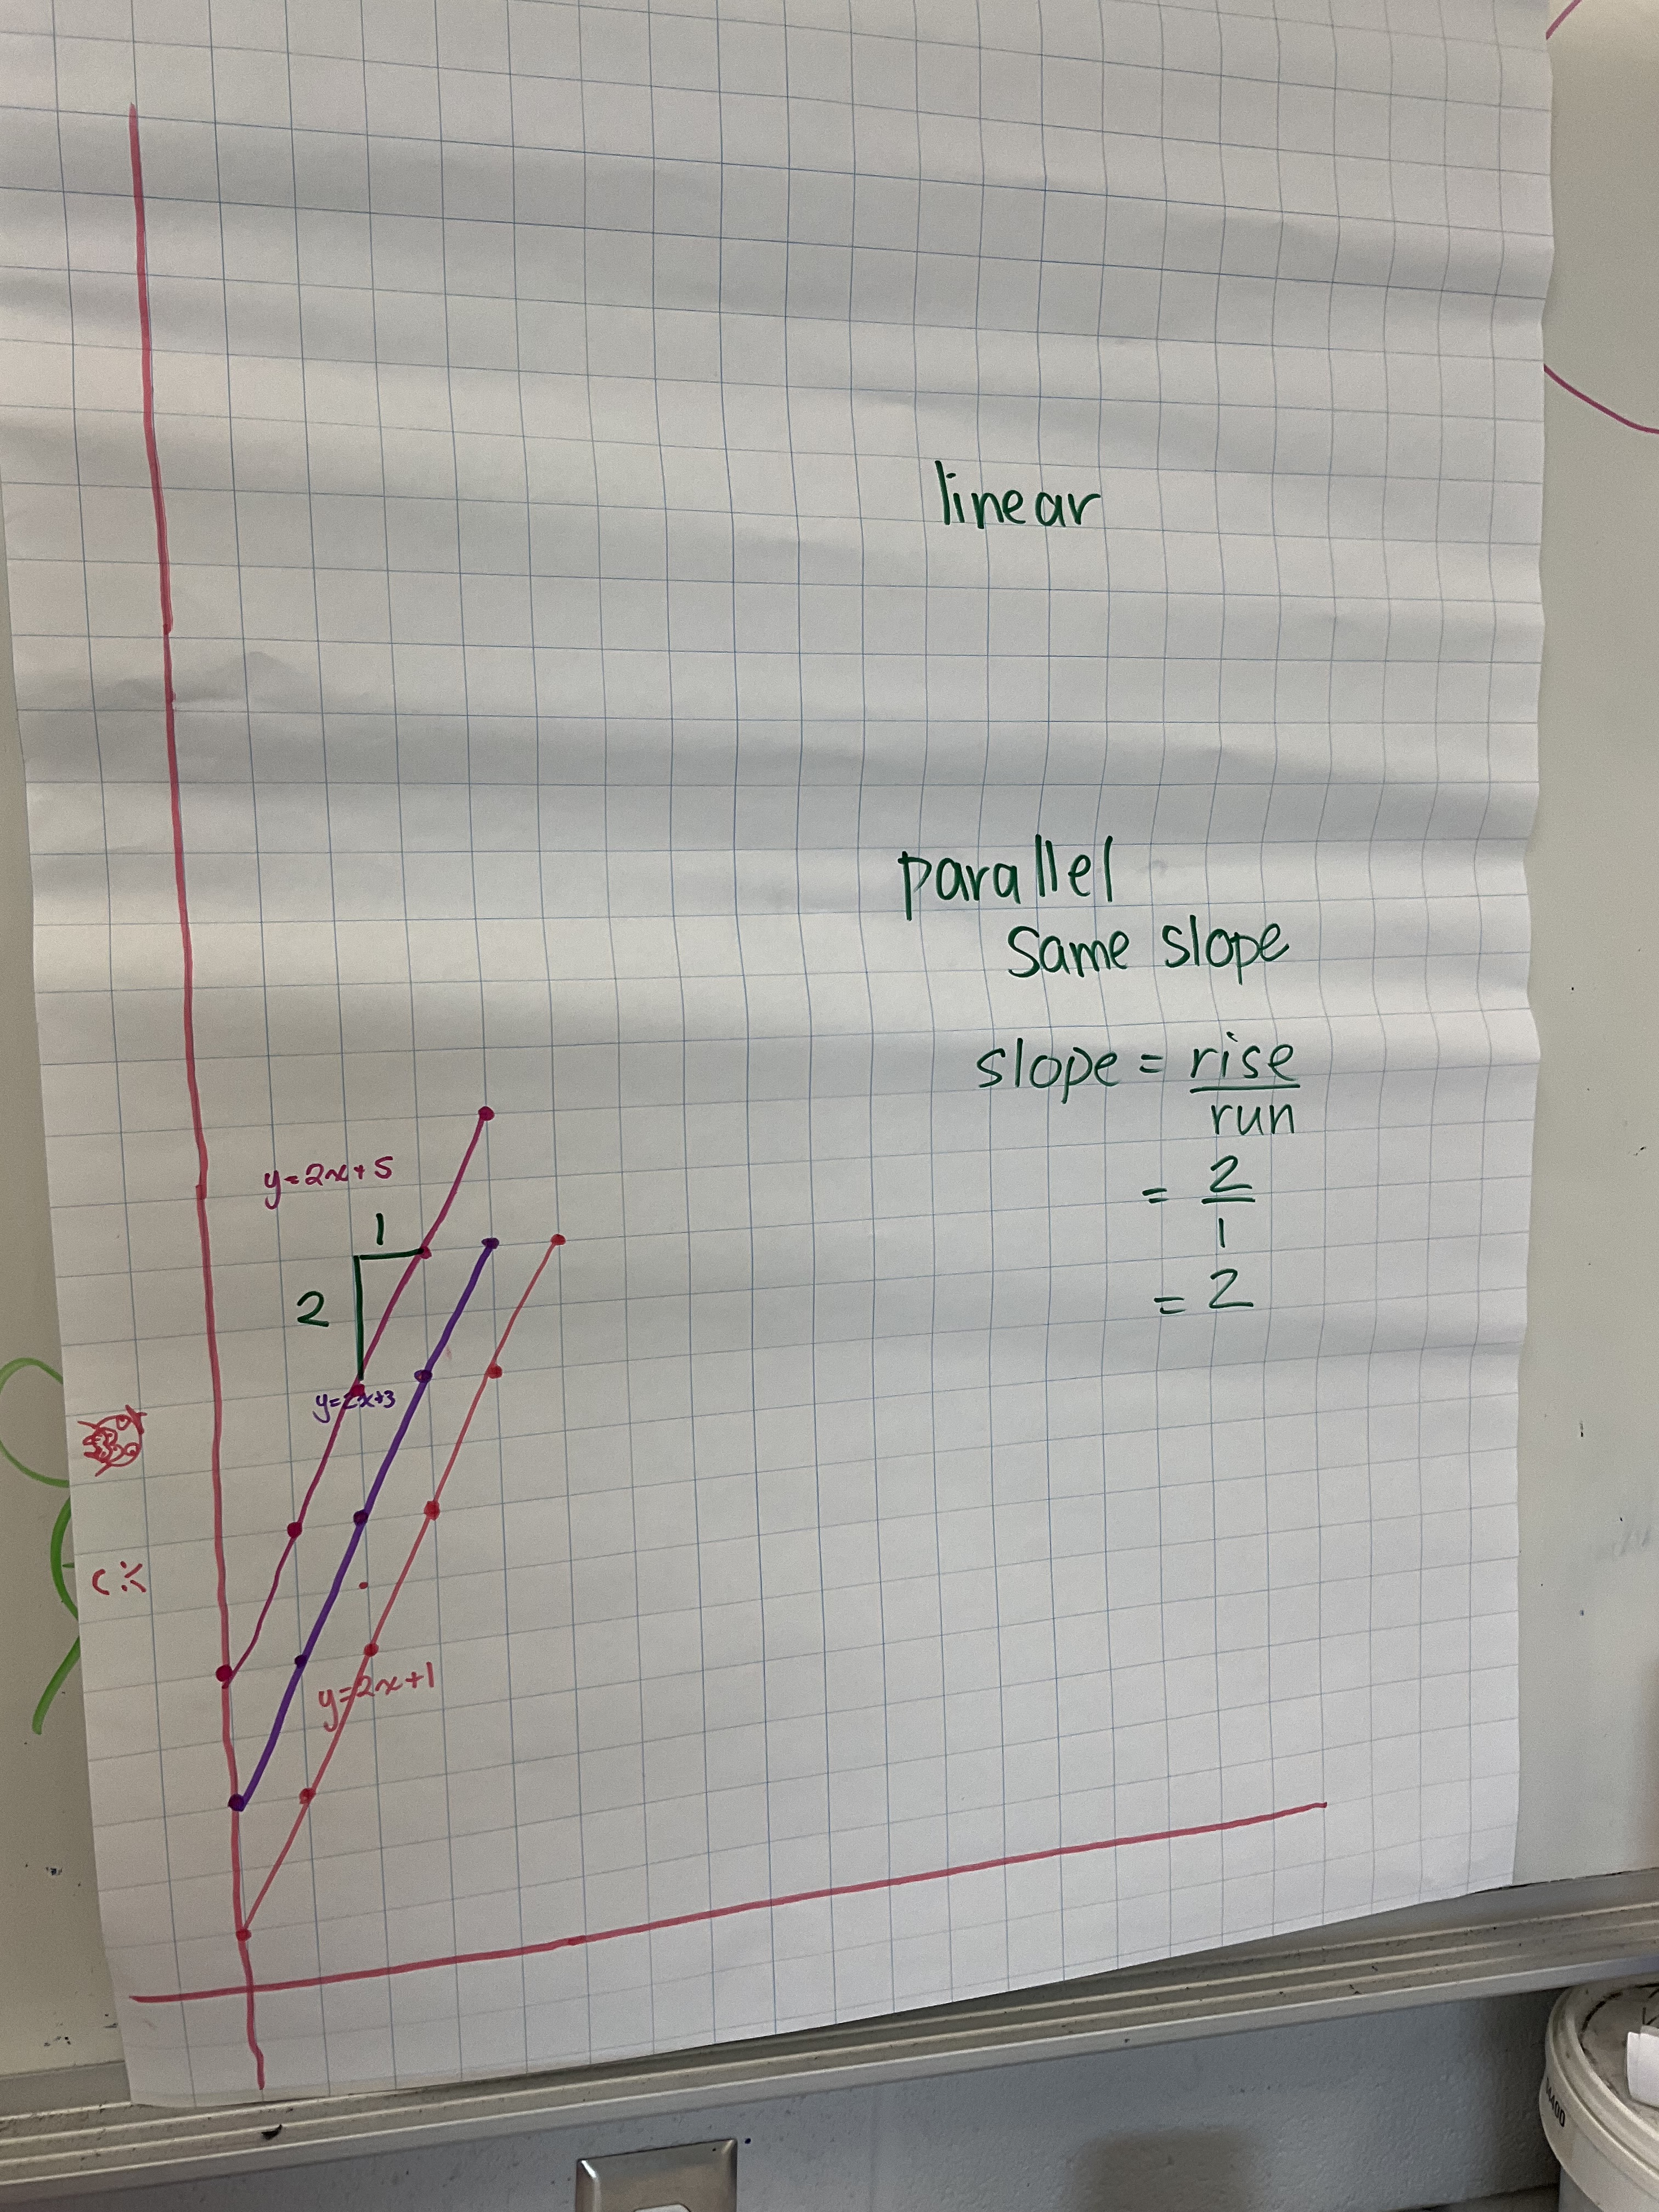
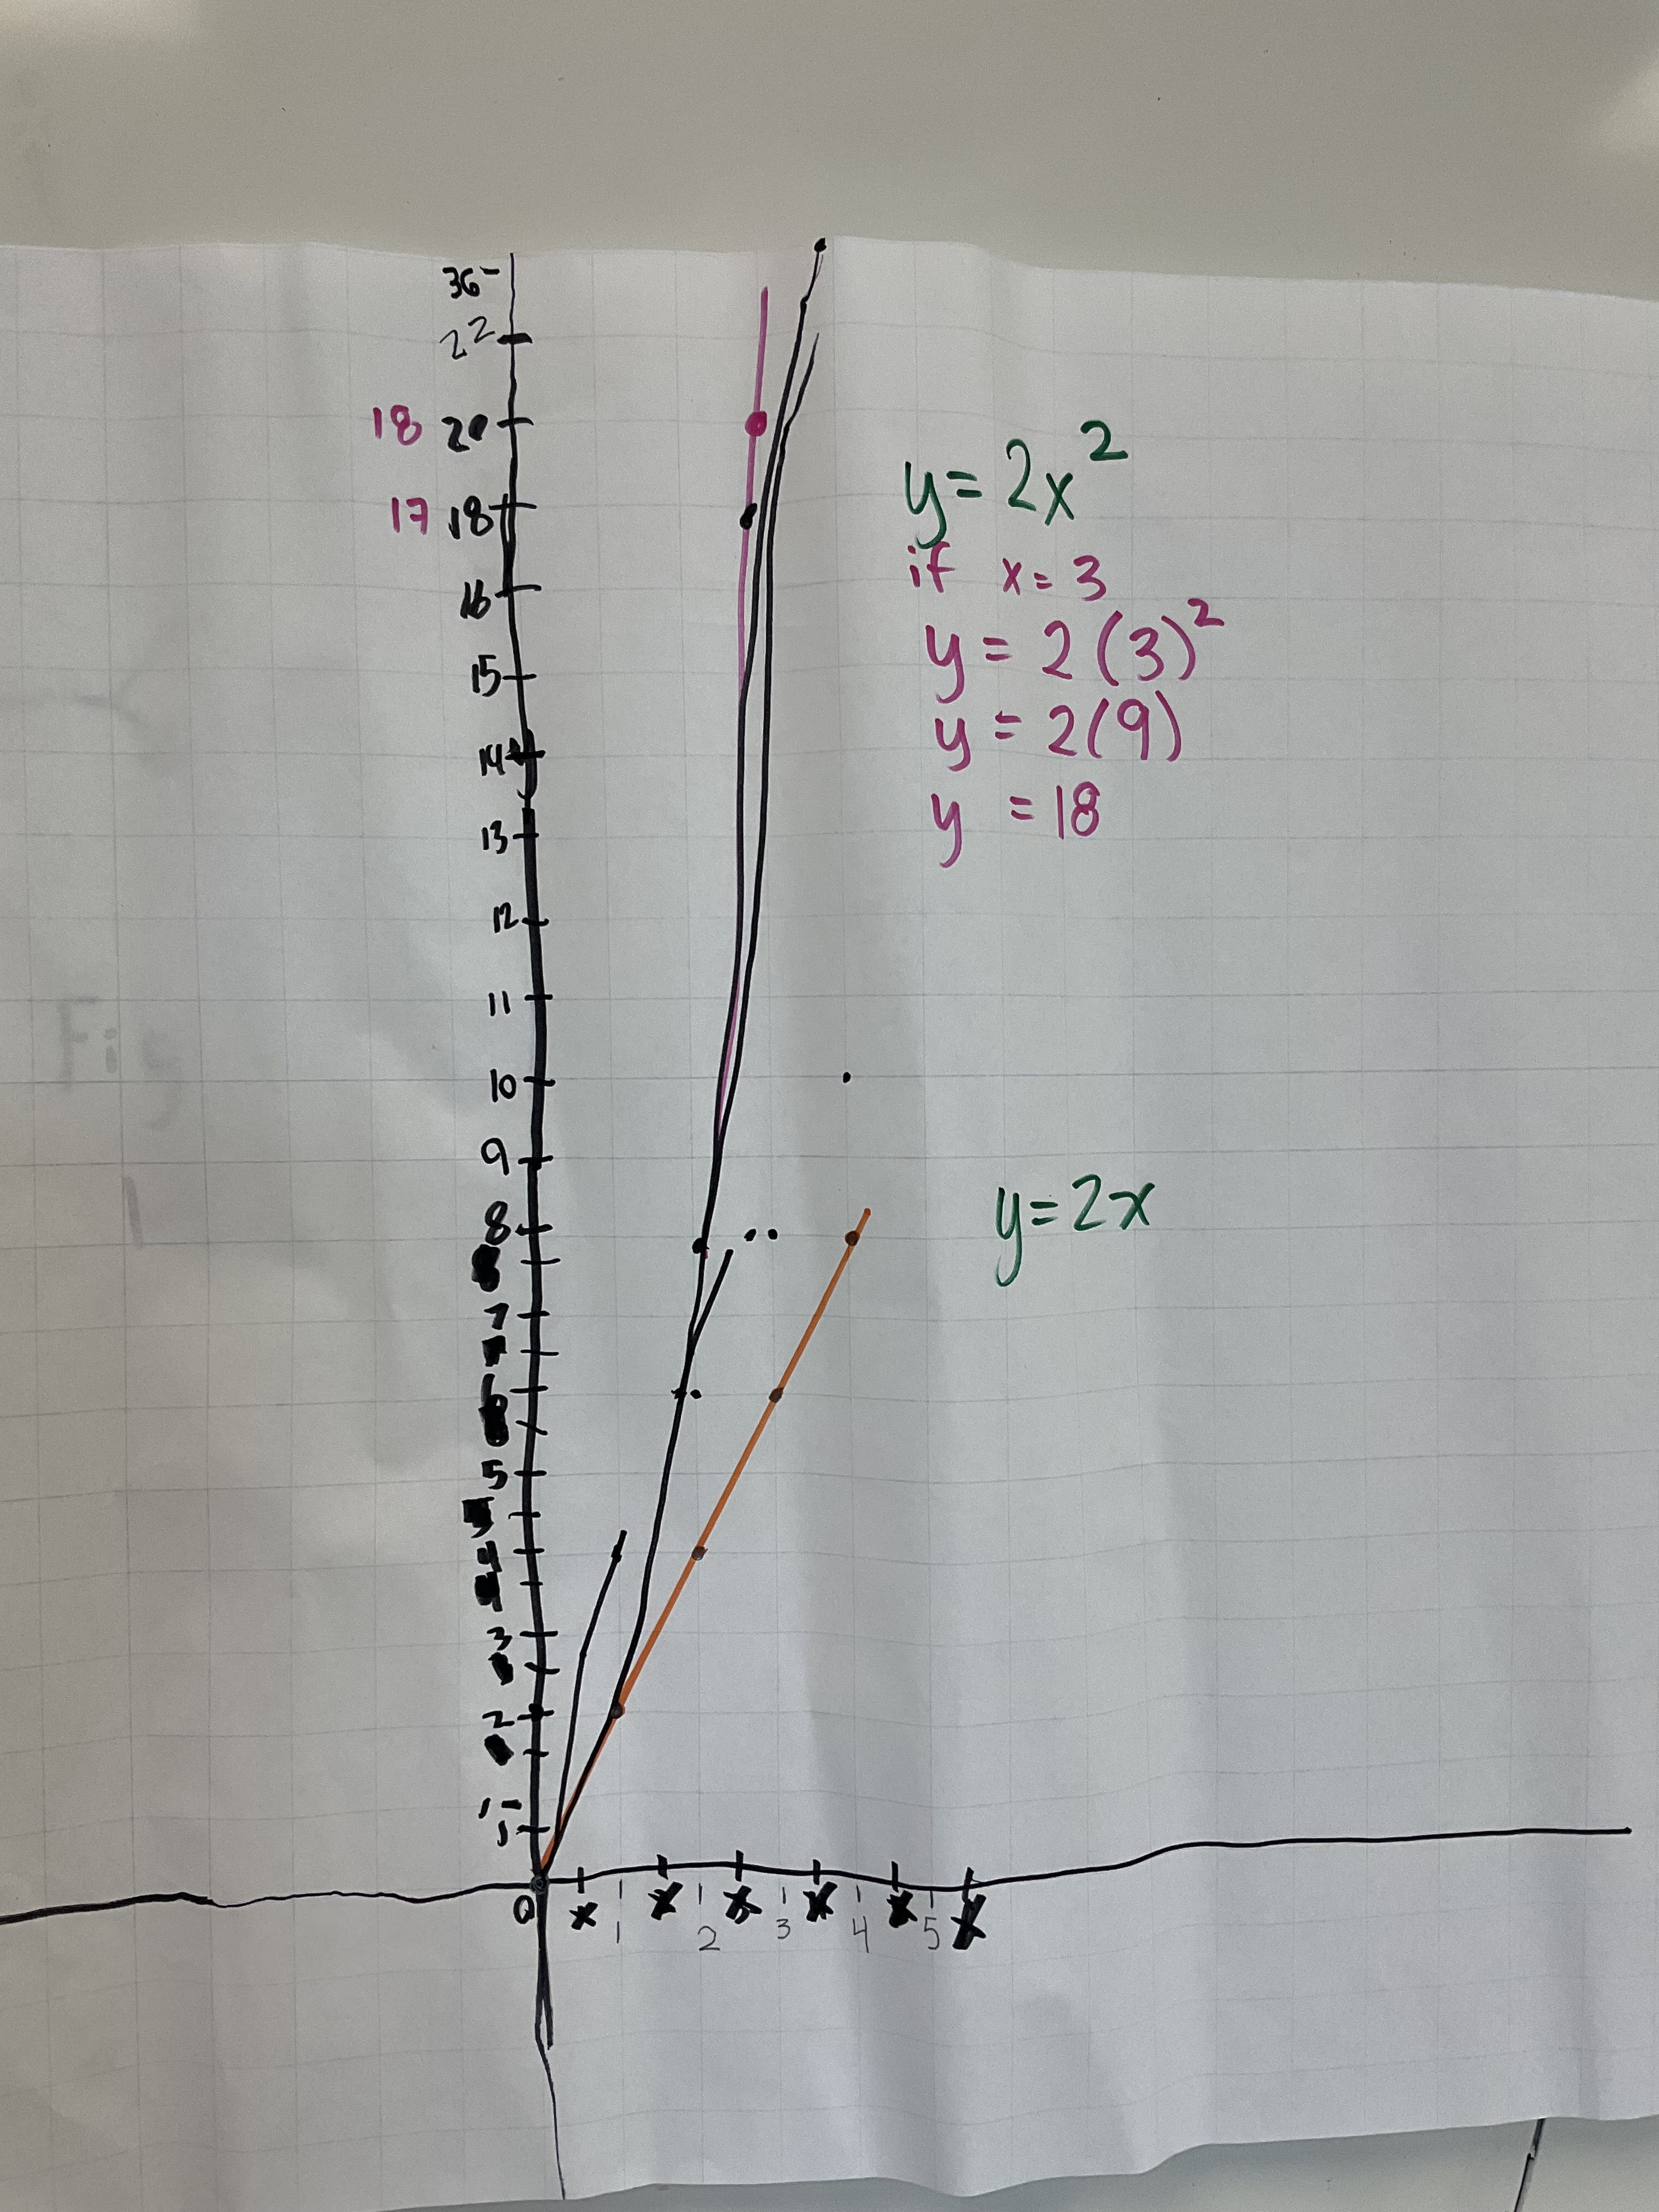
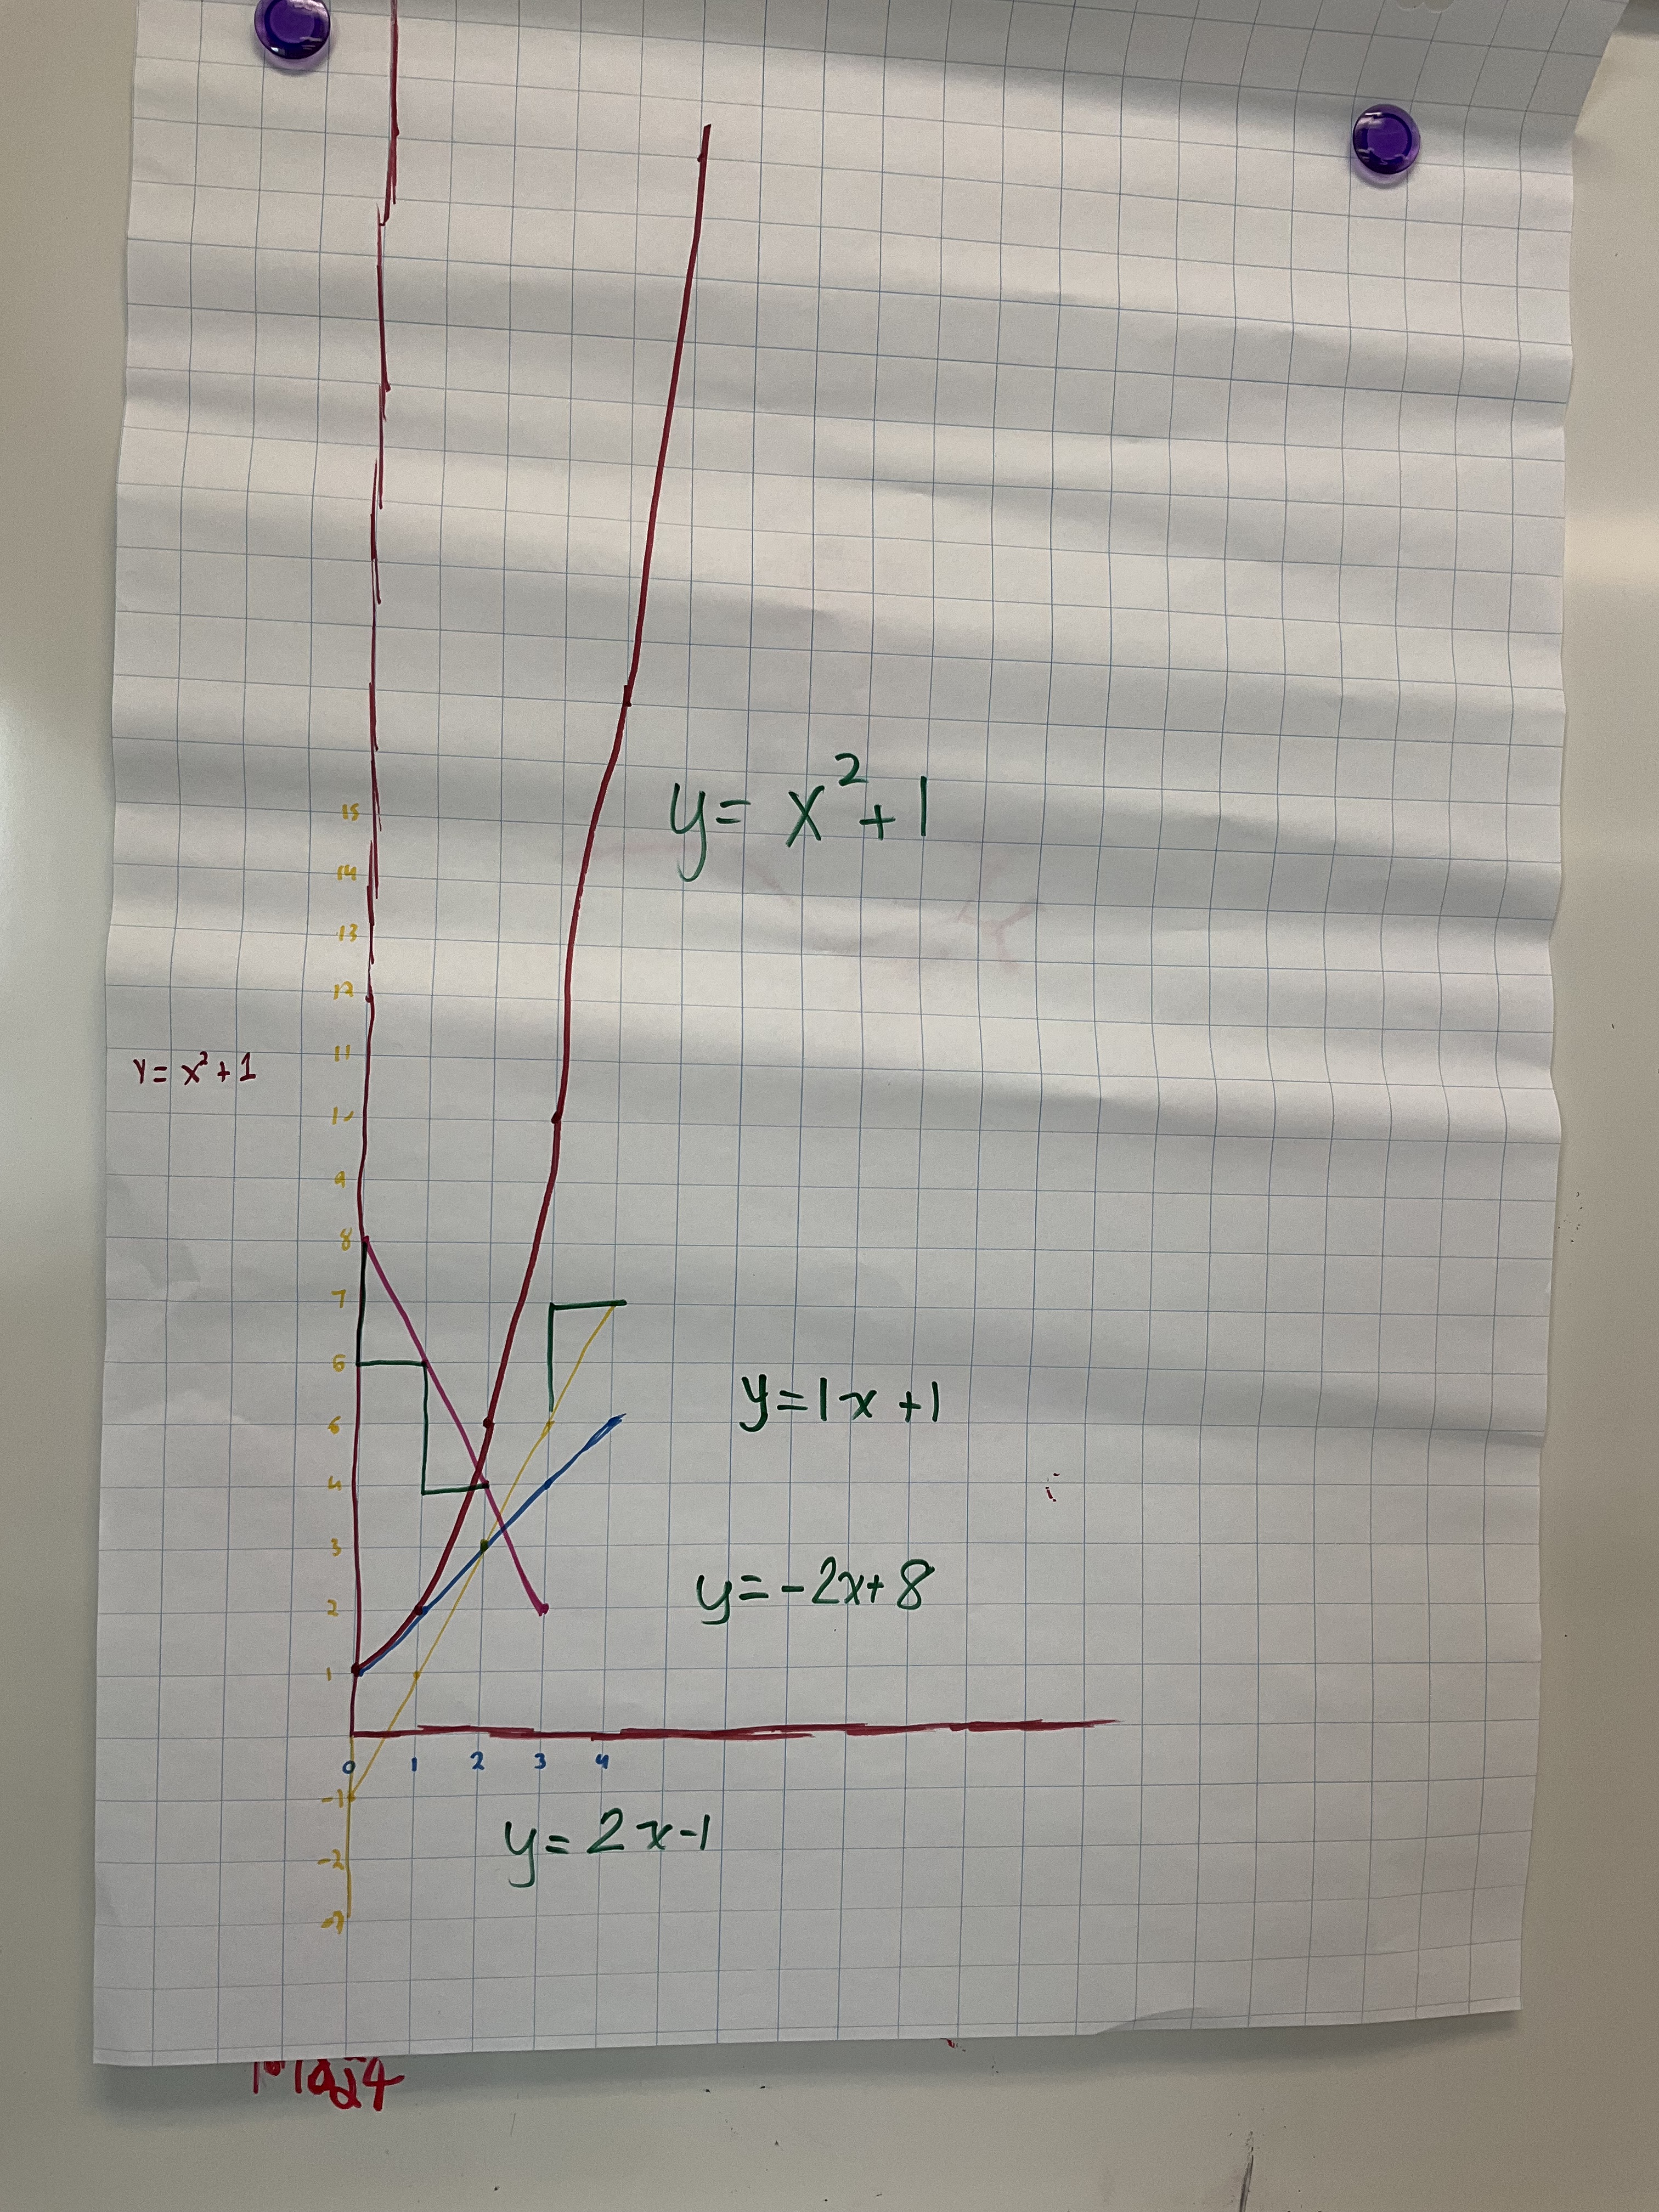
We could see how same slopes, and same y intercepts impact graphs. We could see the difference between x^2 and 2^x as well. I’ve done this task with lines often, but I am enjoying how many functions we could explore with this method.
