Looking Through Tubes
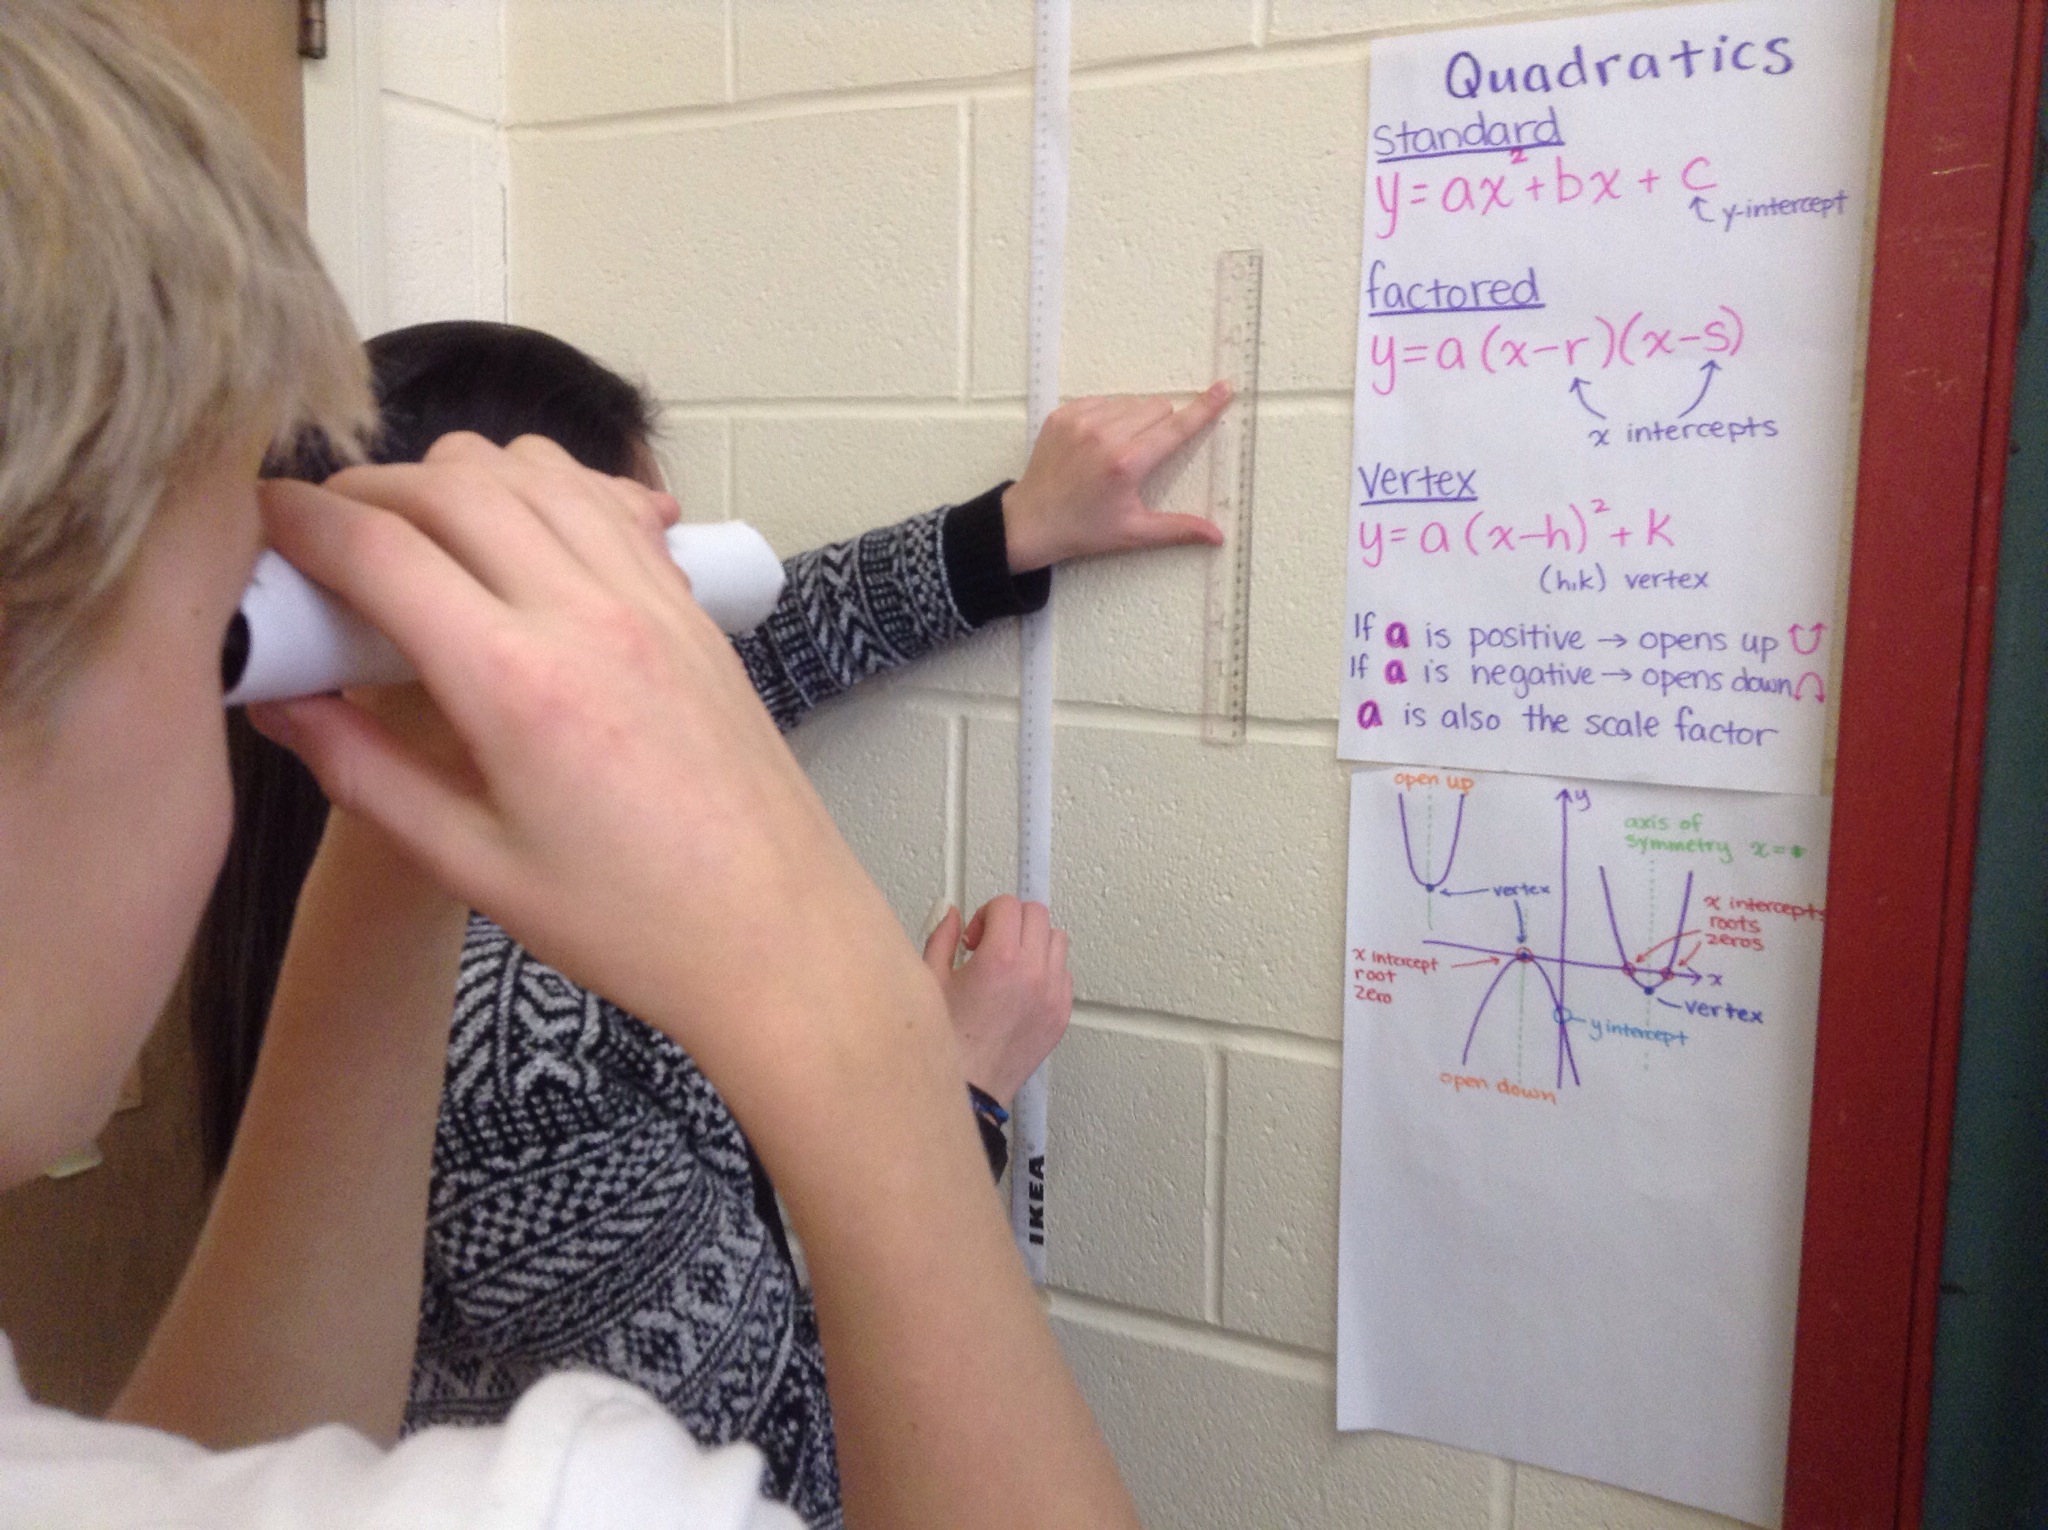
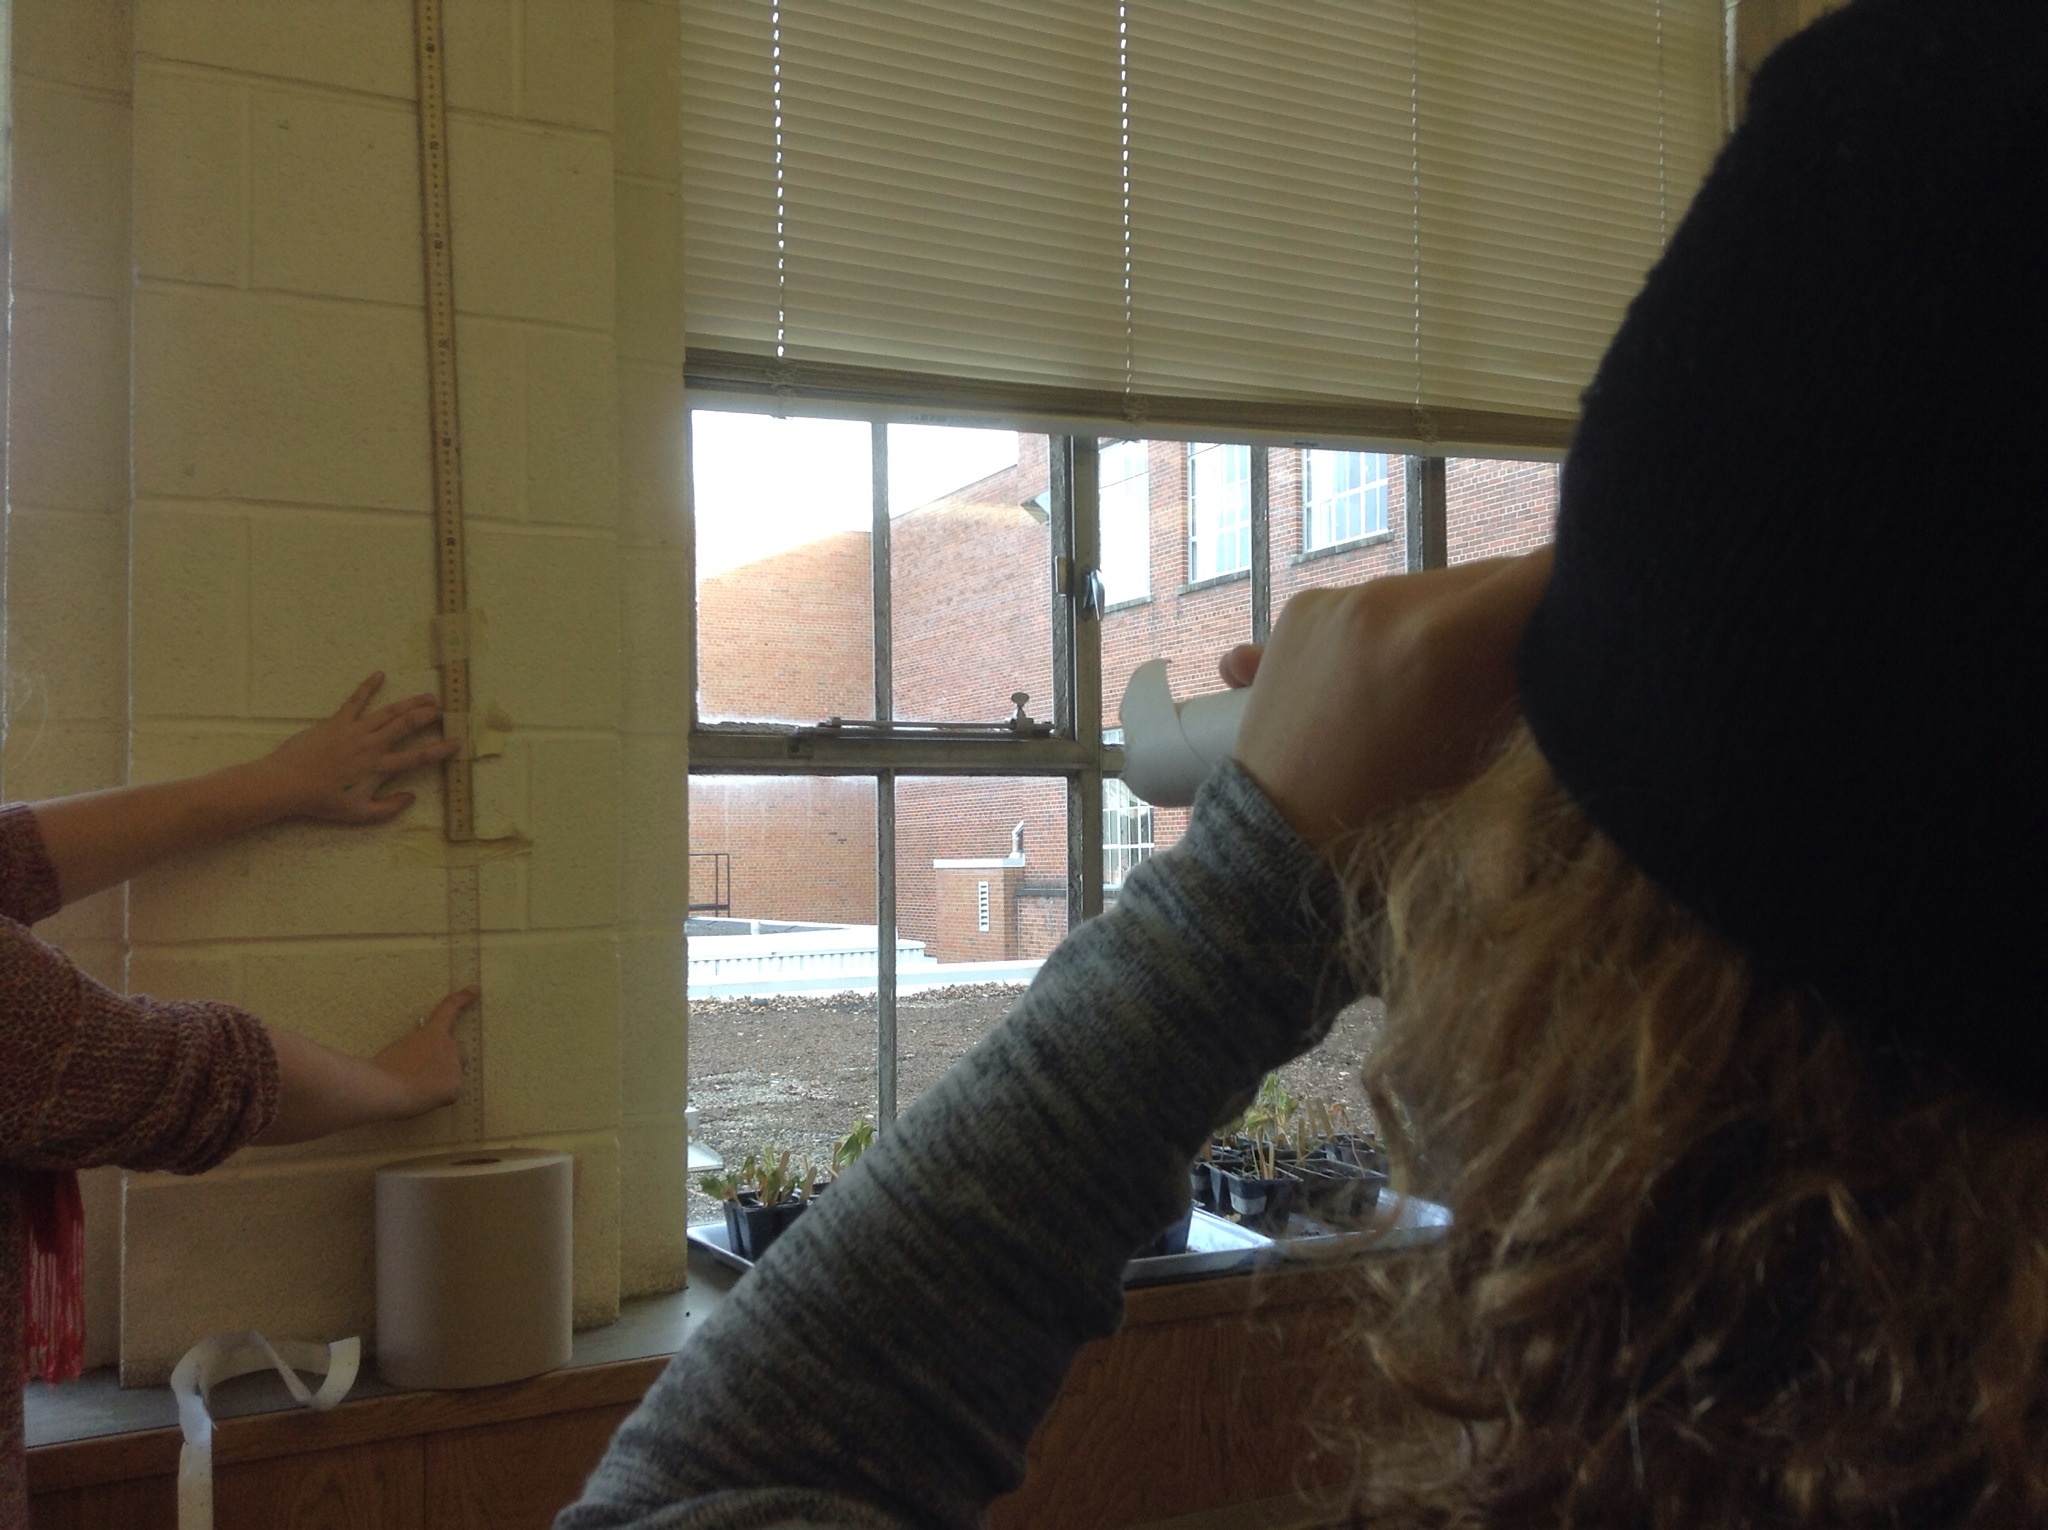
Today in grade 9 we investigated how our field of vision changes as we increase our distance from an object. To do this we used paper tubes, a few meter sticks, graph paper and desmos.com.
Each group of 3 had an observer, a measurer, and a recorder. The observer stands away from the wall and looks at a meter stick taped to the wall. The measurer records the distance to the wall, and also helps the observer determine the size of their field of view. The recorder puts all values in a table.
We created graphs and examined the correlation.
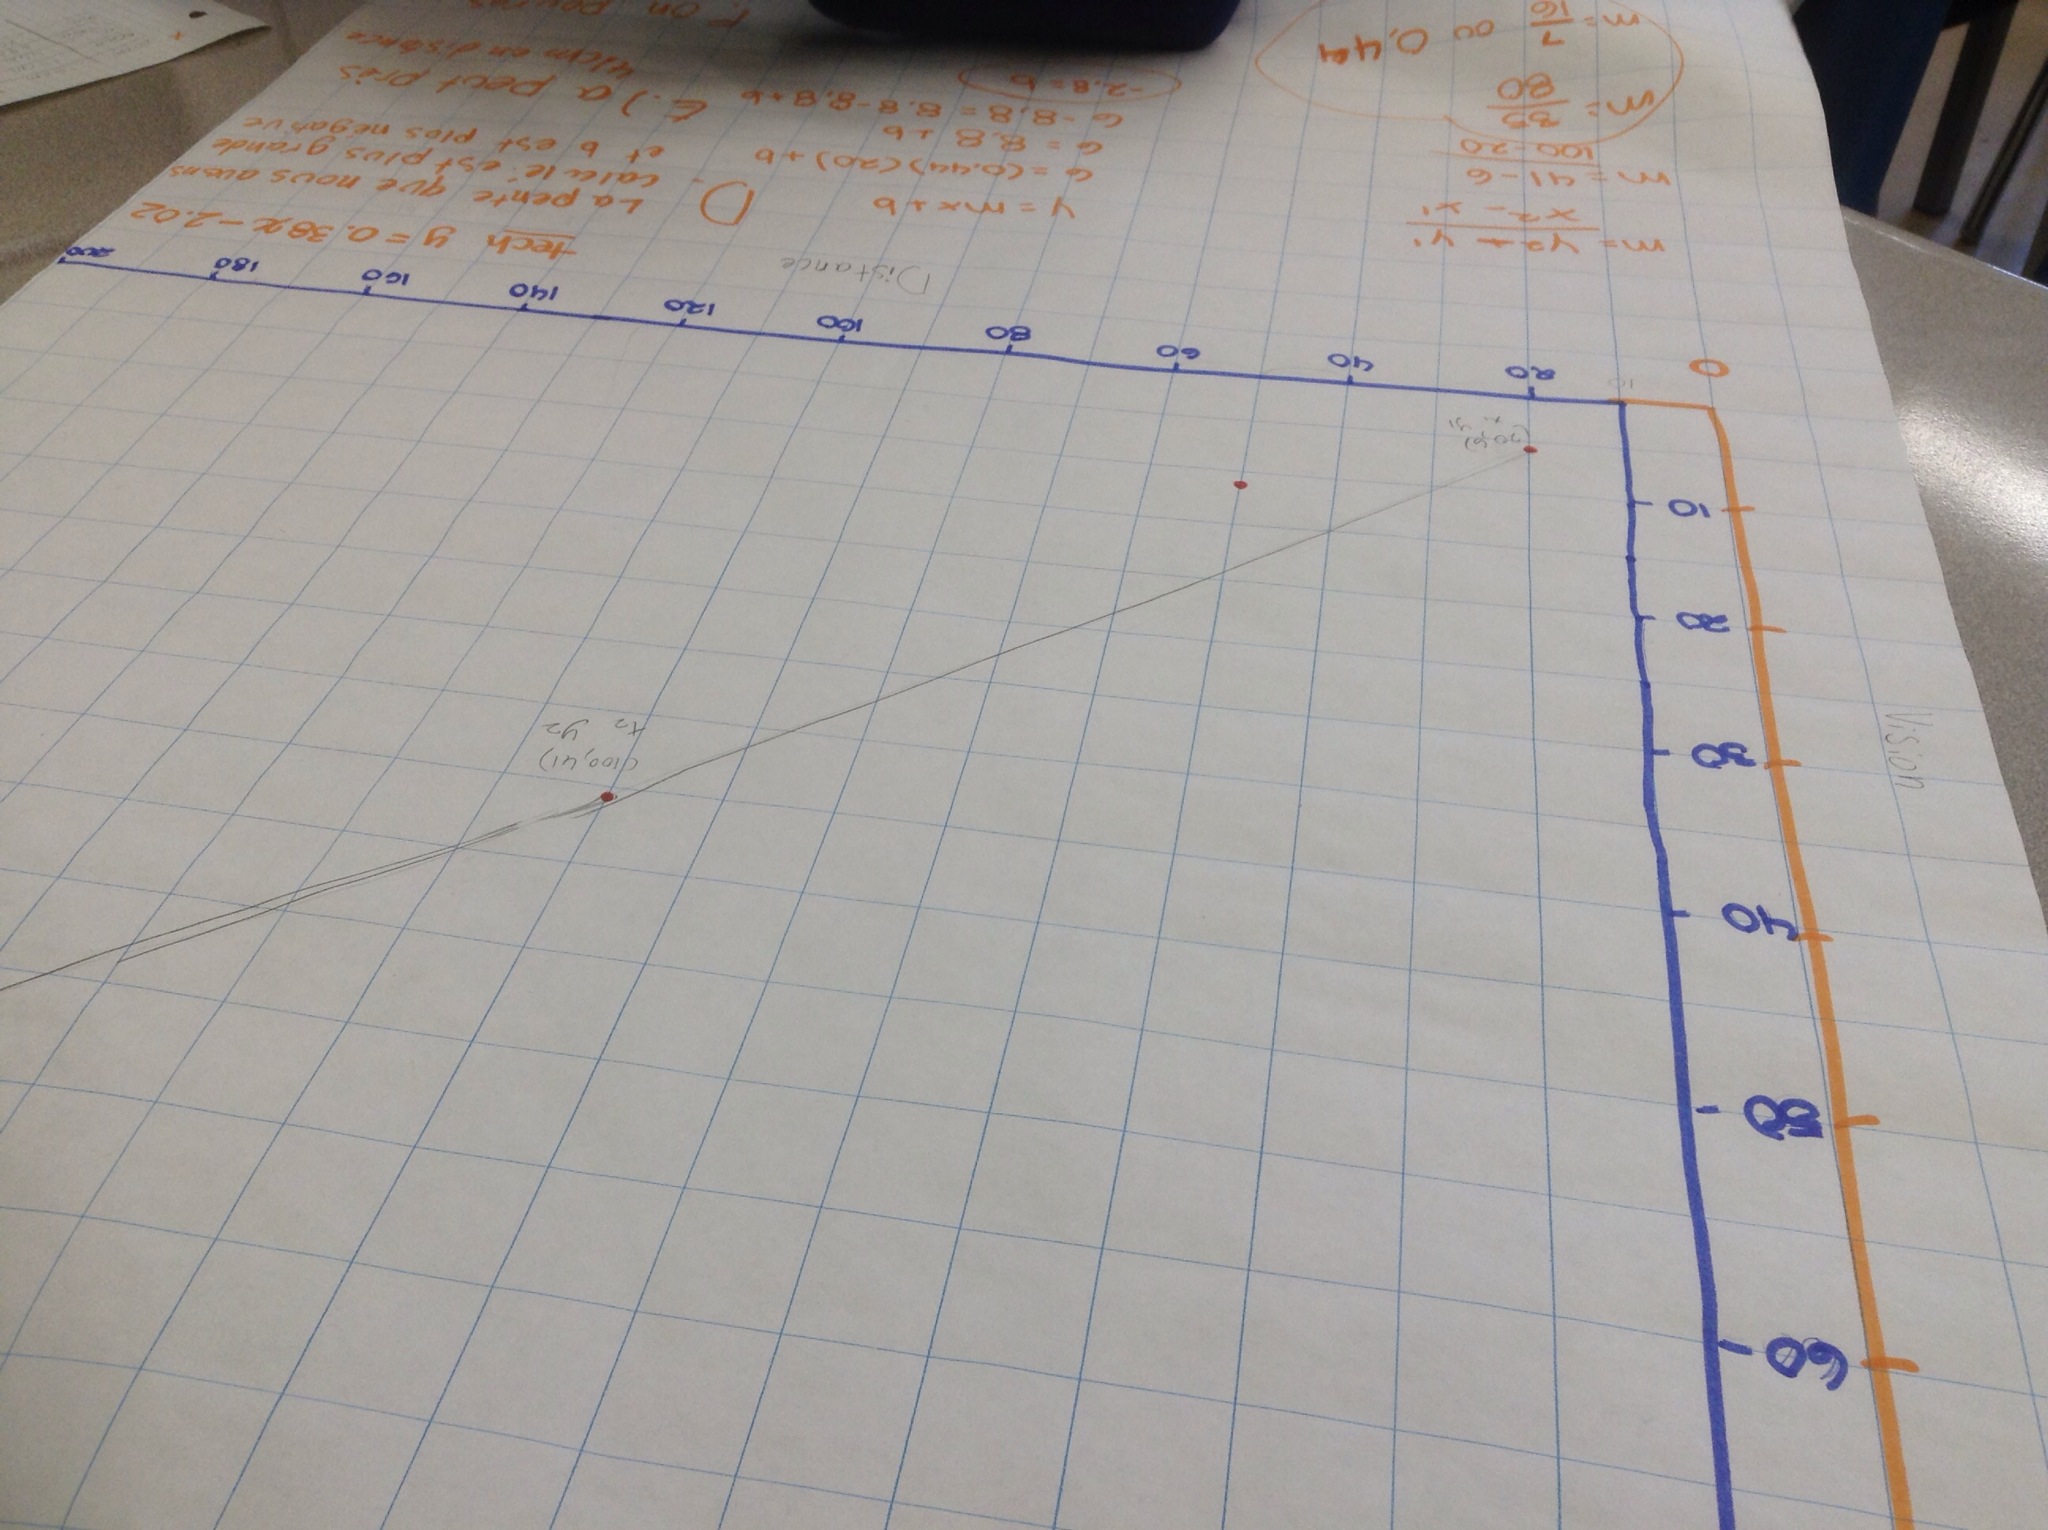
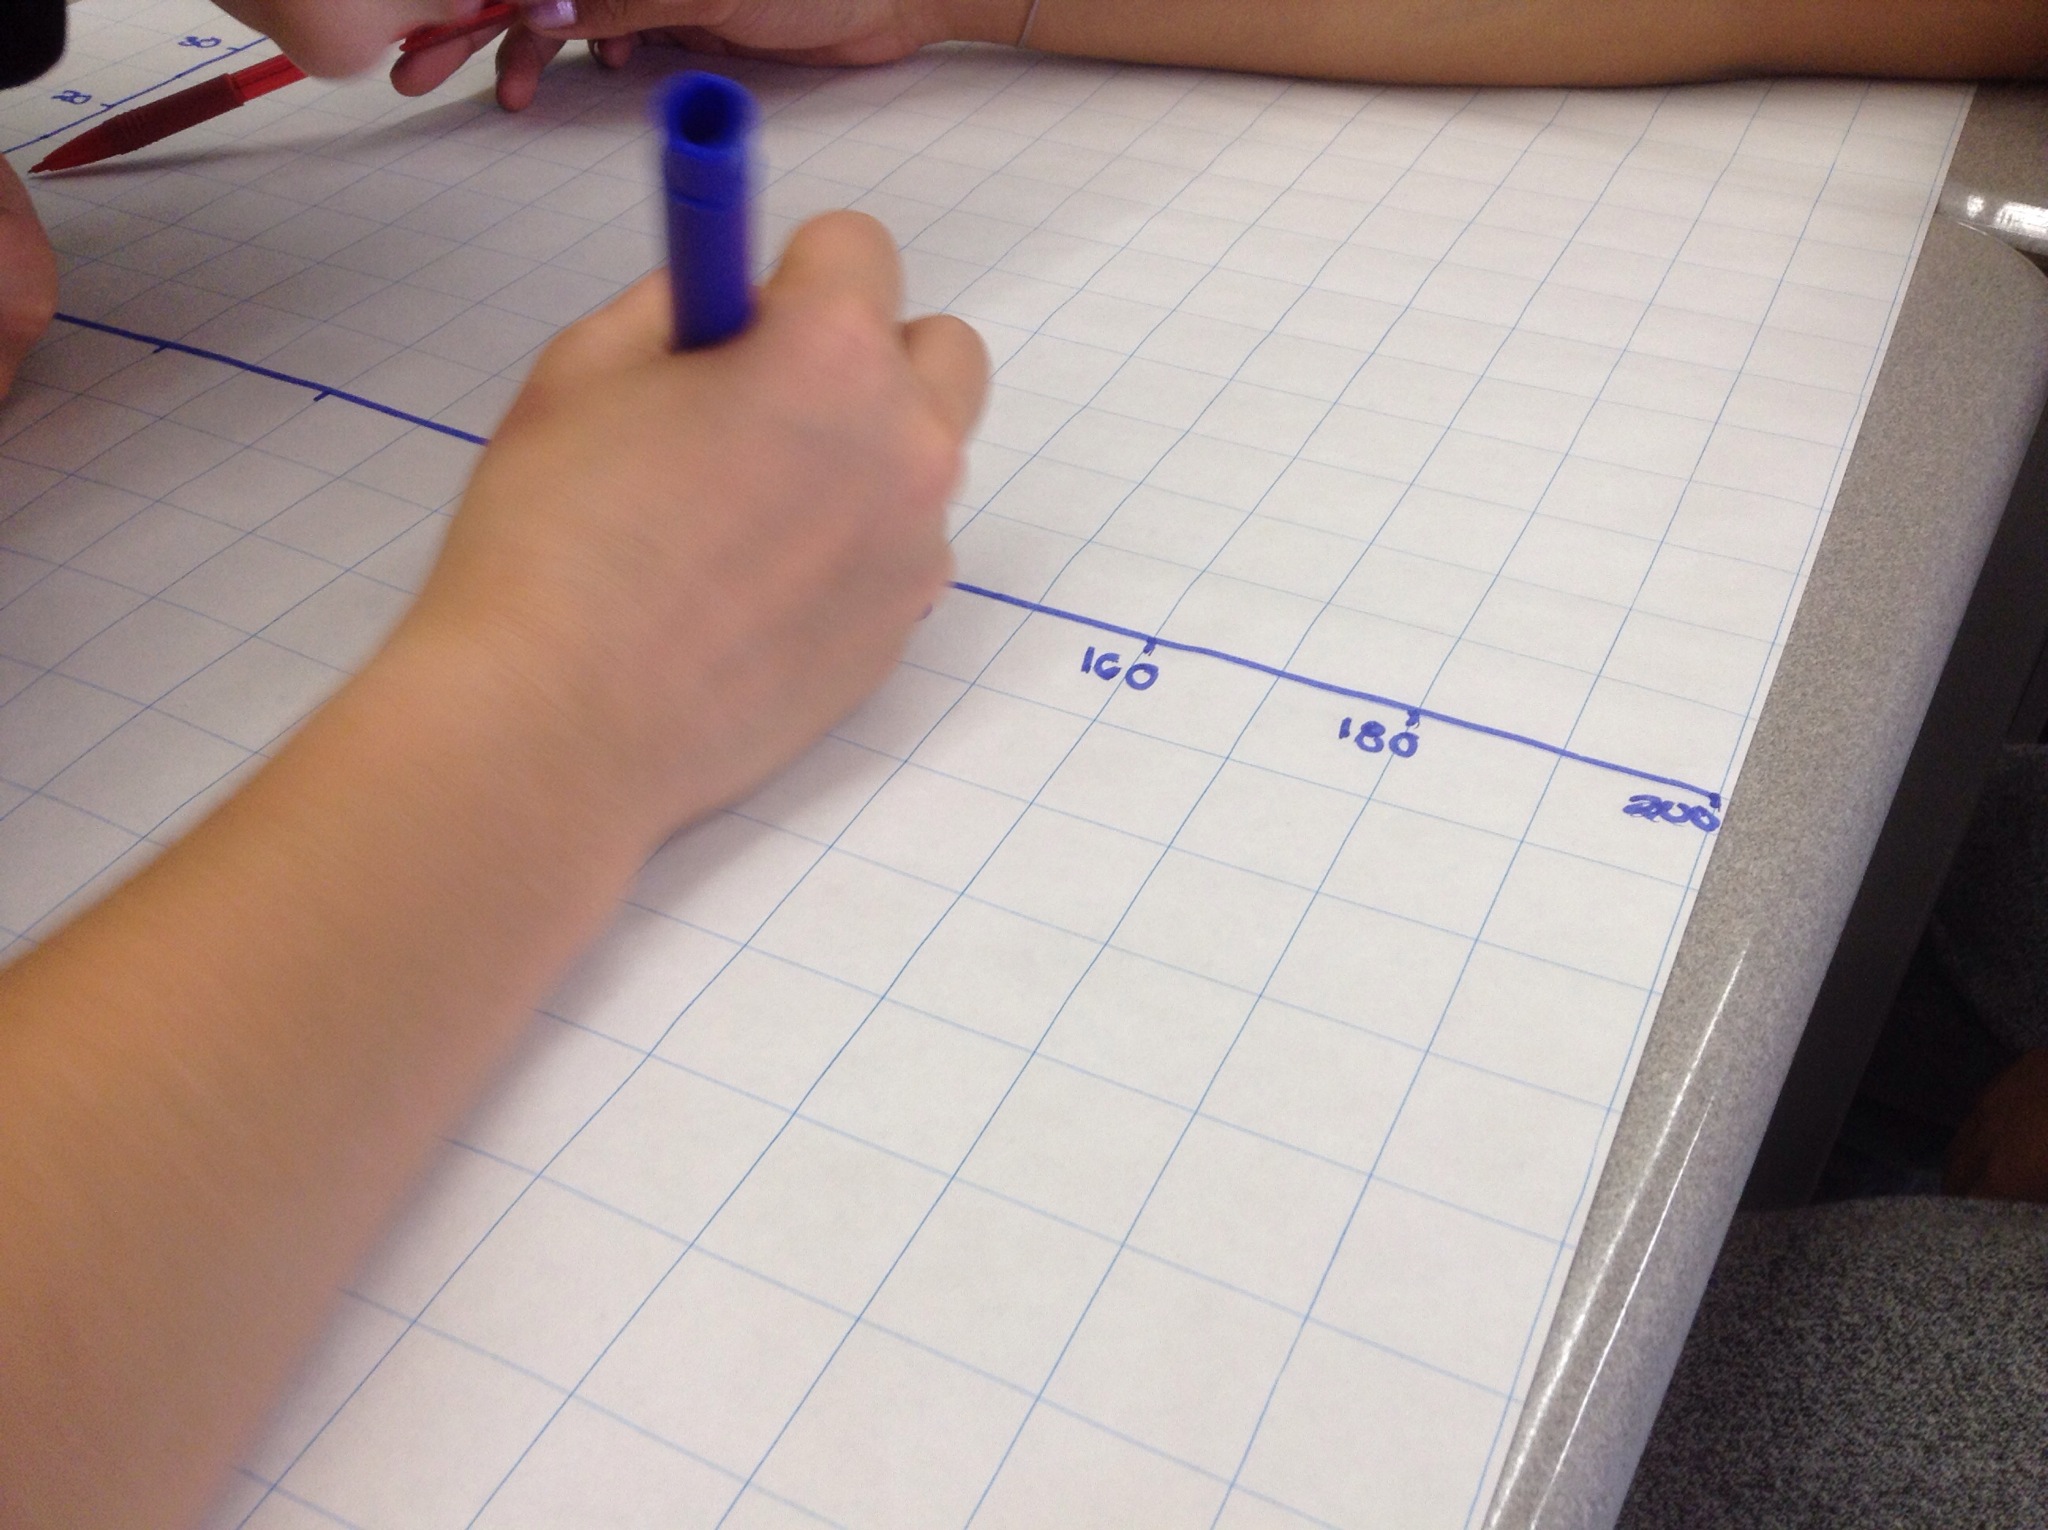
We drew a line of best fit, and calculated the slope and the y intercept.

We compared the equations to those that we got when desmos did a linear regression.
We could then make predictions and answer questions based on the best fit line (on the graph, and with the equation).
We’re getting ready for a summative investigation this Friday.
