Pi Day Party
March 13, 2015

We ate some pie on pi day. We also did some experiments with circles. This one used licorice laces to make circles. We compared the circumference and the diameter of the circle, ate some licorice, and repeated. Graphing circumference compared to diameter gives a linear graph with a slope that is pi.

We read a pi story
We also, in grade 10, looked at how many cheerios fit on circles of different sizes.
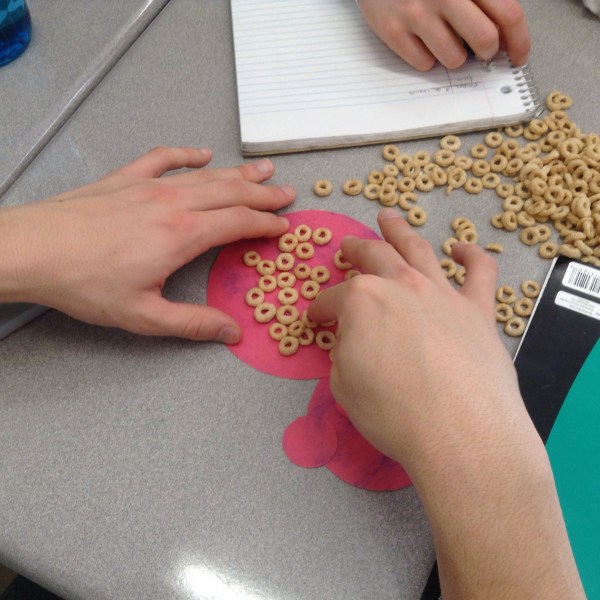

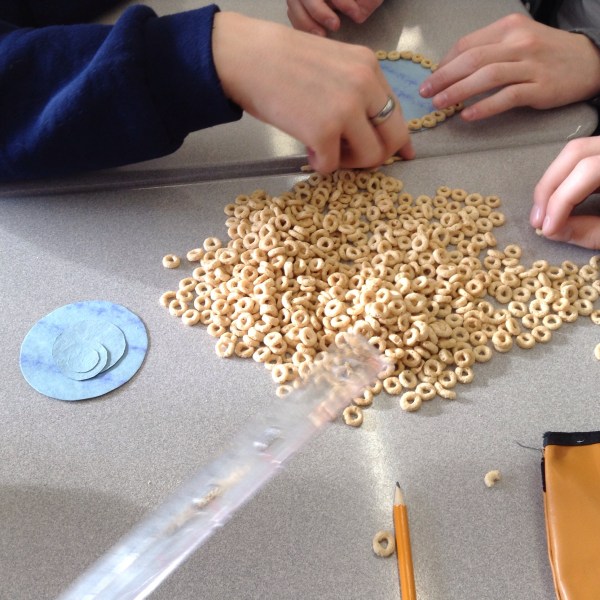
When we graph number of cheerios vs circle radius we get a curved graph.
No comments yet
