Circle Graphs
November 9, 2017
We braved the cooler weather today to go collect primary data outside.
Some of us observed clothing colours, hats/no hats, types of headphones, methods of transportation, shoe type, drivers distracted or not at the stoplight, or if they were wearing a poppy or not.
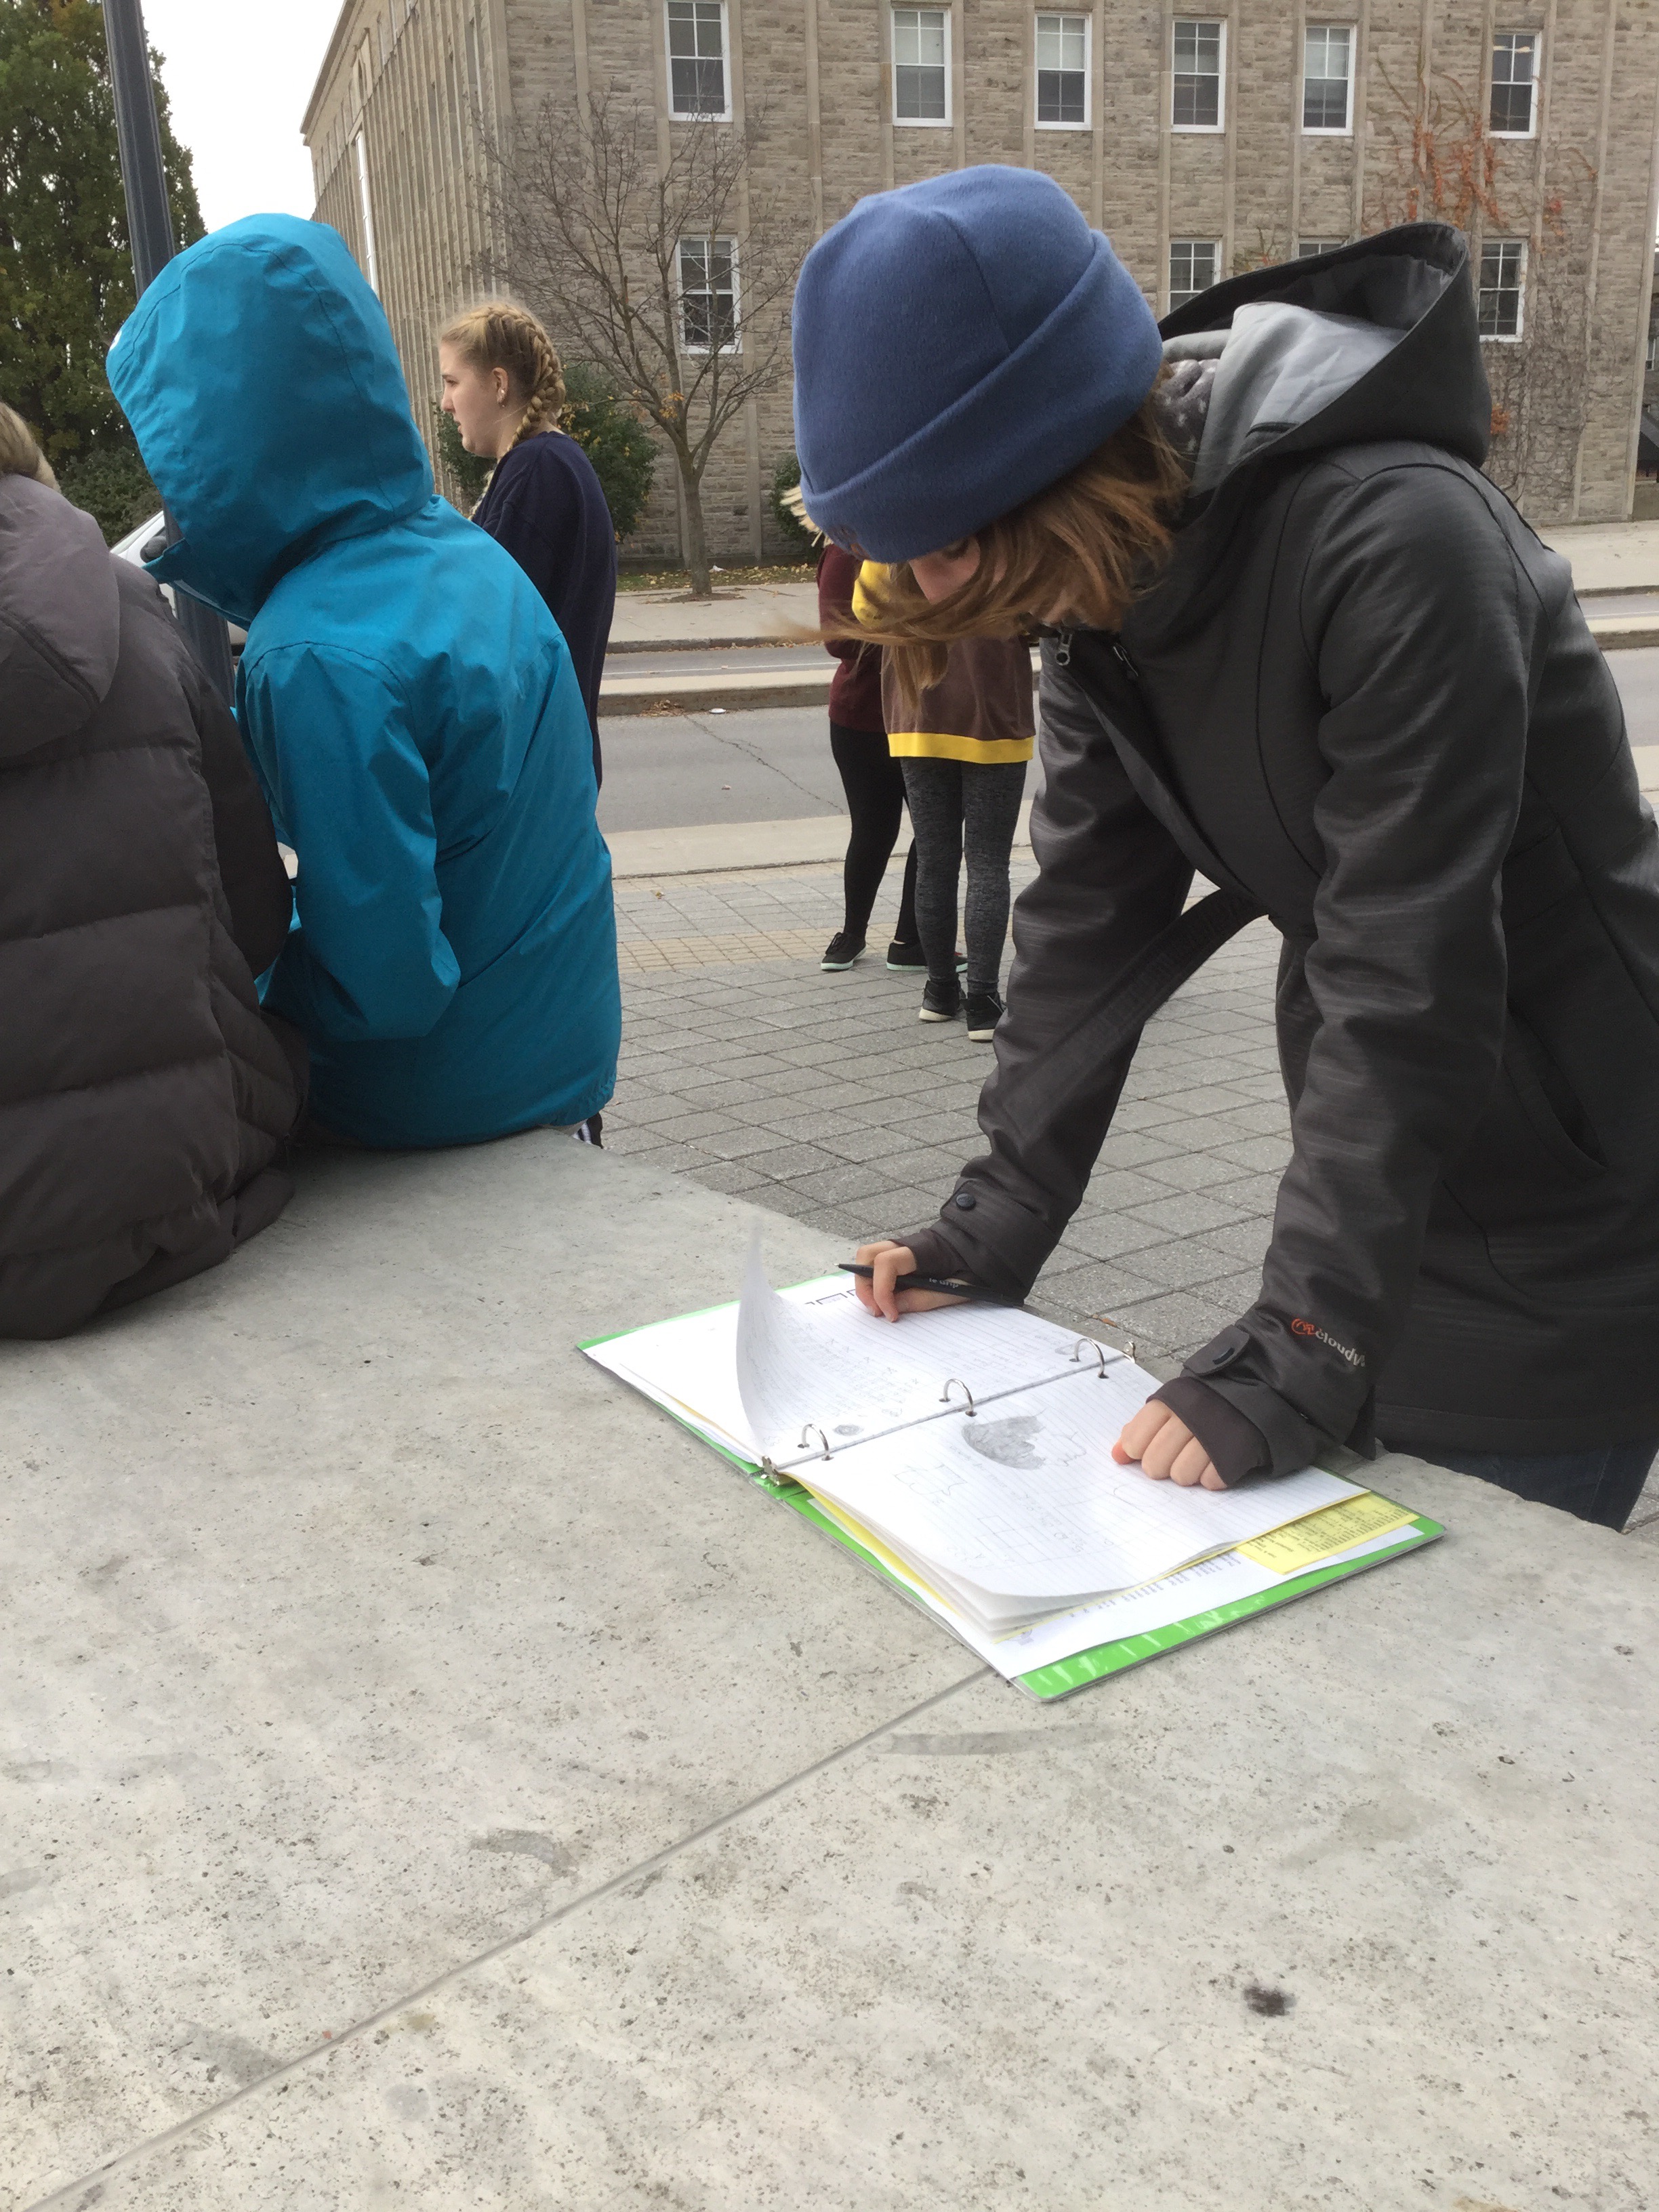
We made tallies on paper and on phones
We stayed out for almost 15 minutes then went to get some other tallying materials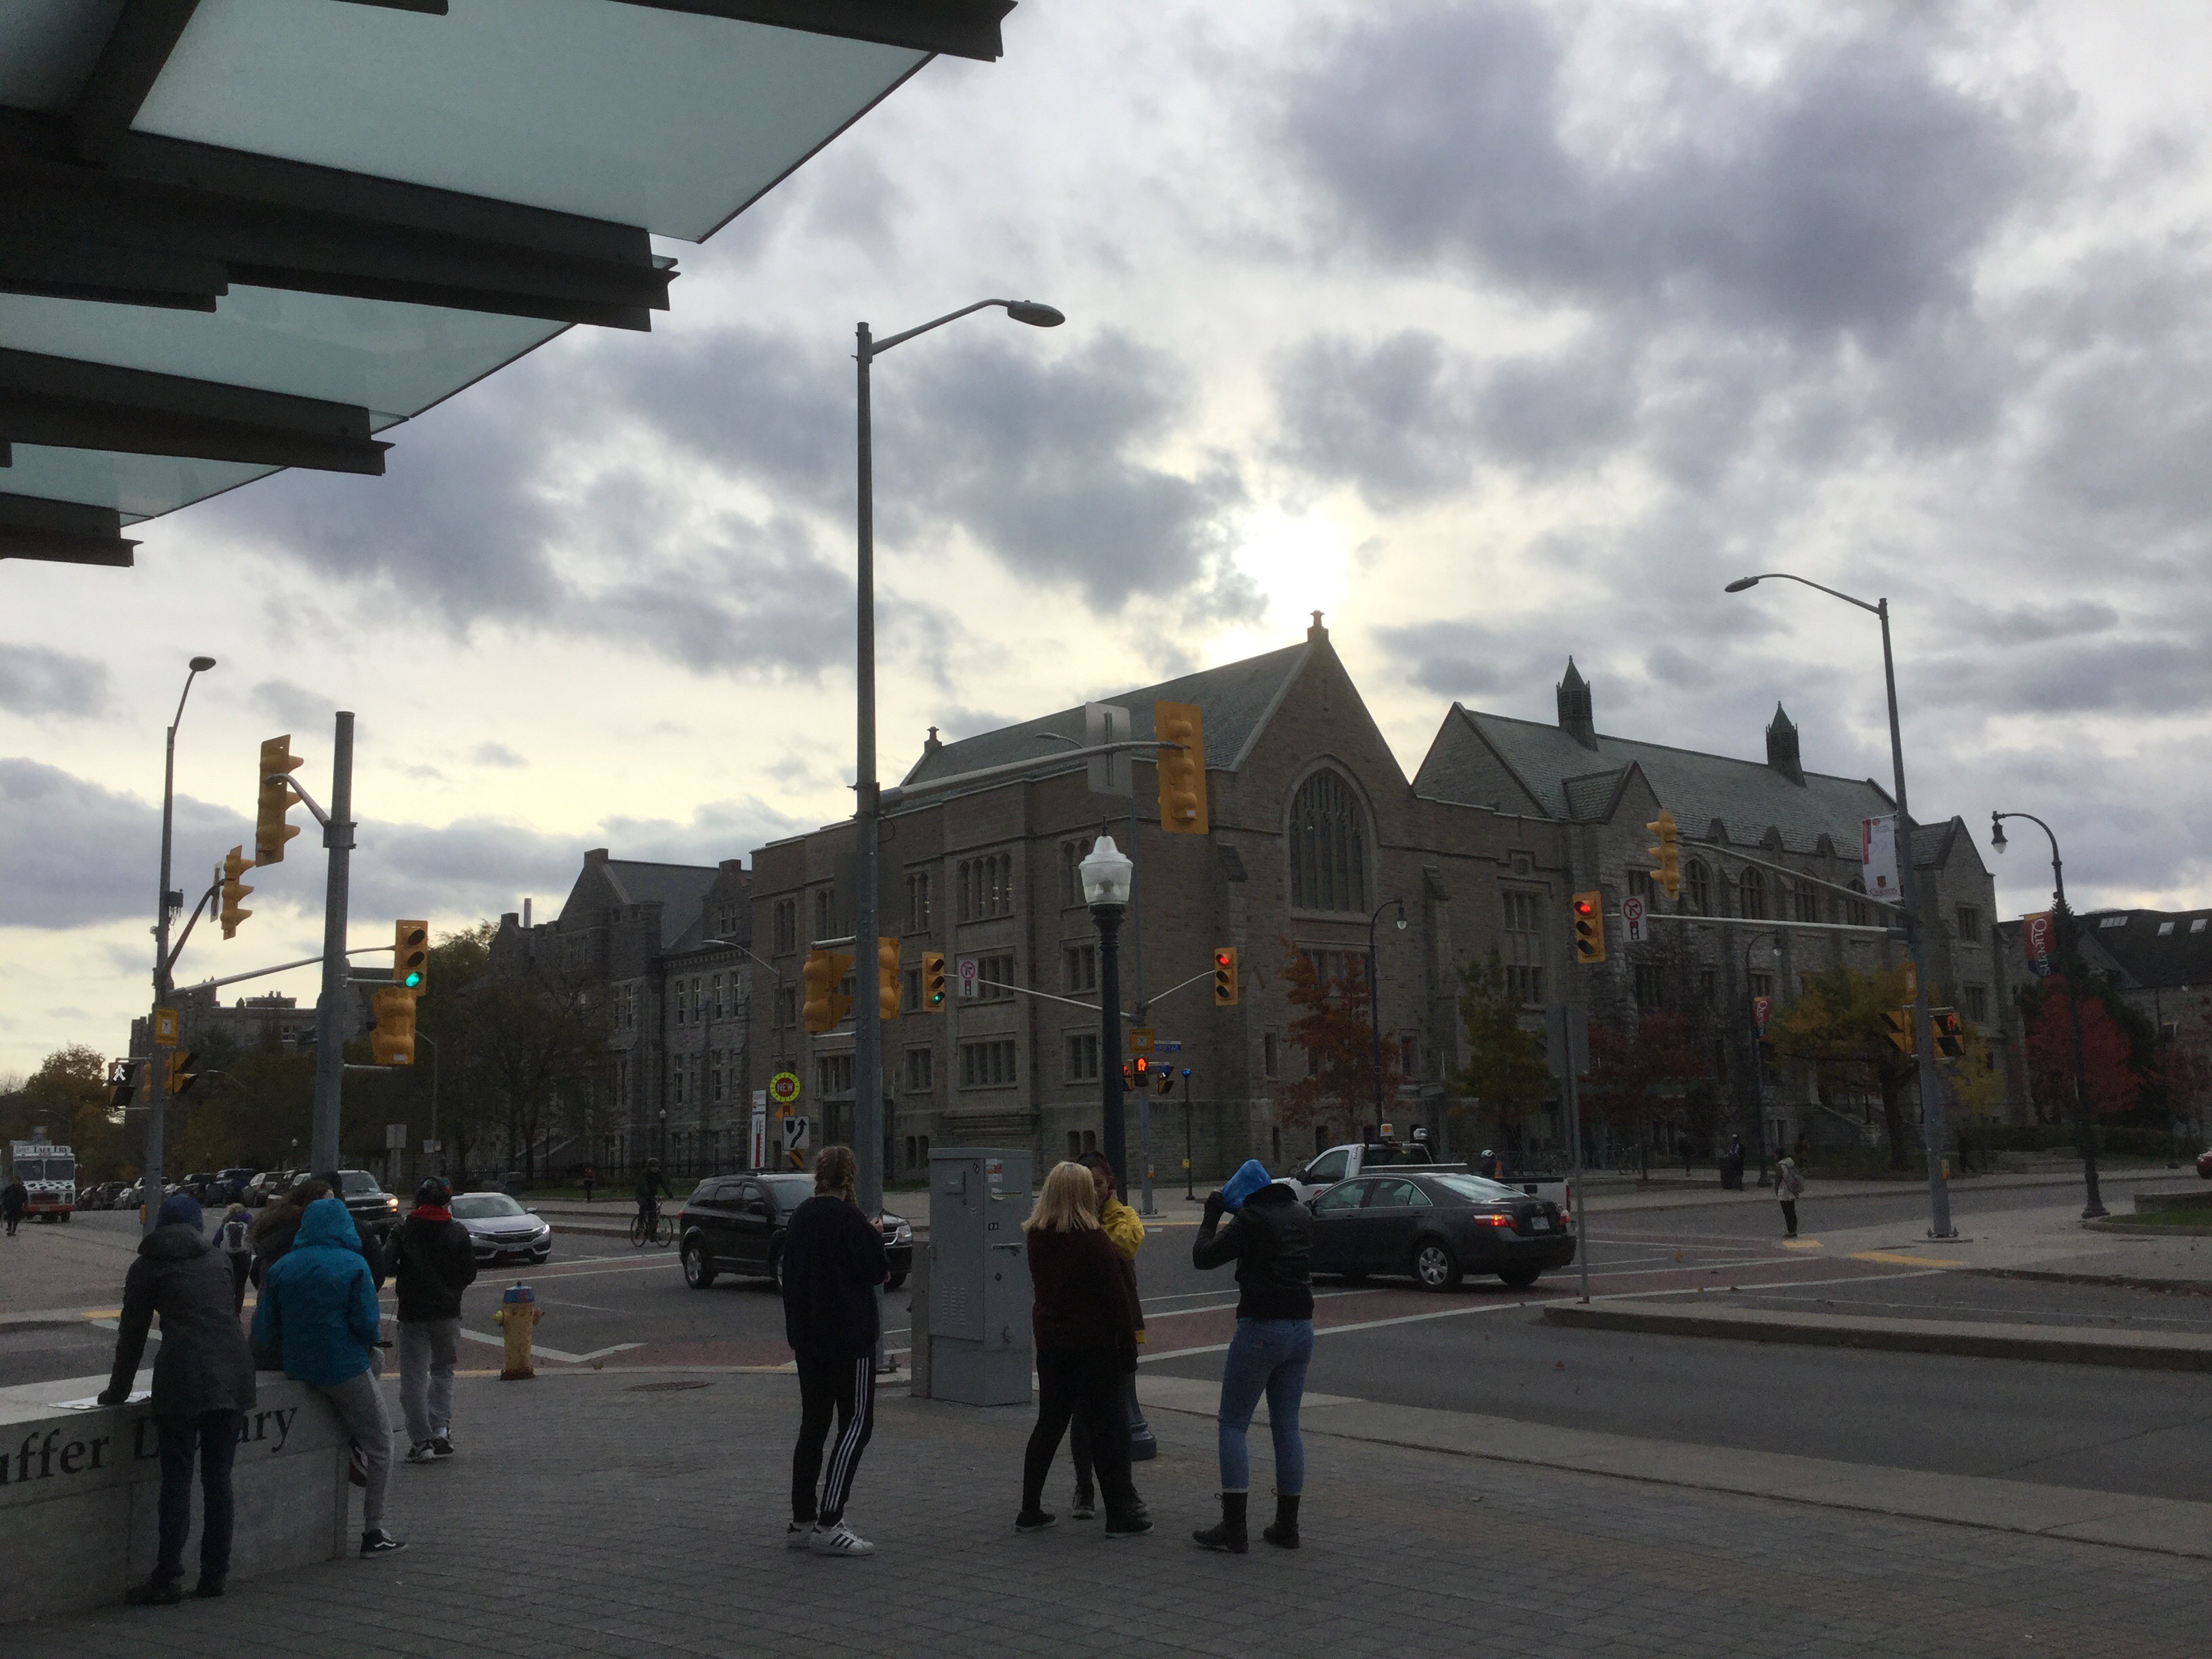
We got a box of 50 timbits (but there were only 48 in the box), and we separated them by type, and made a circle graph from that data.


No comments yet
