Parabolas
November 23, 2017
We built a growing pattern of rectangles that had dimensions (n+1)(n+2)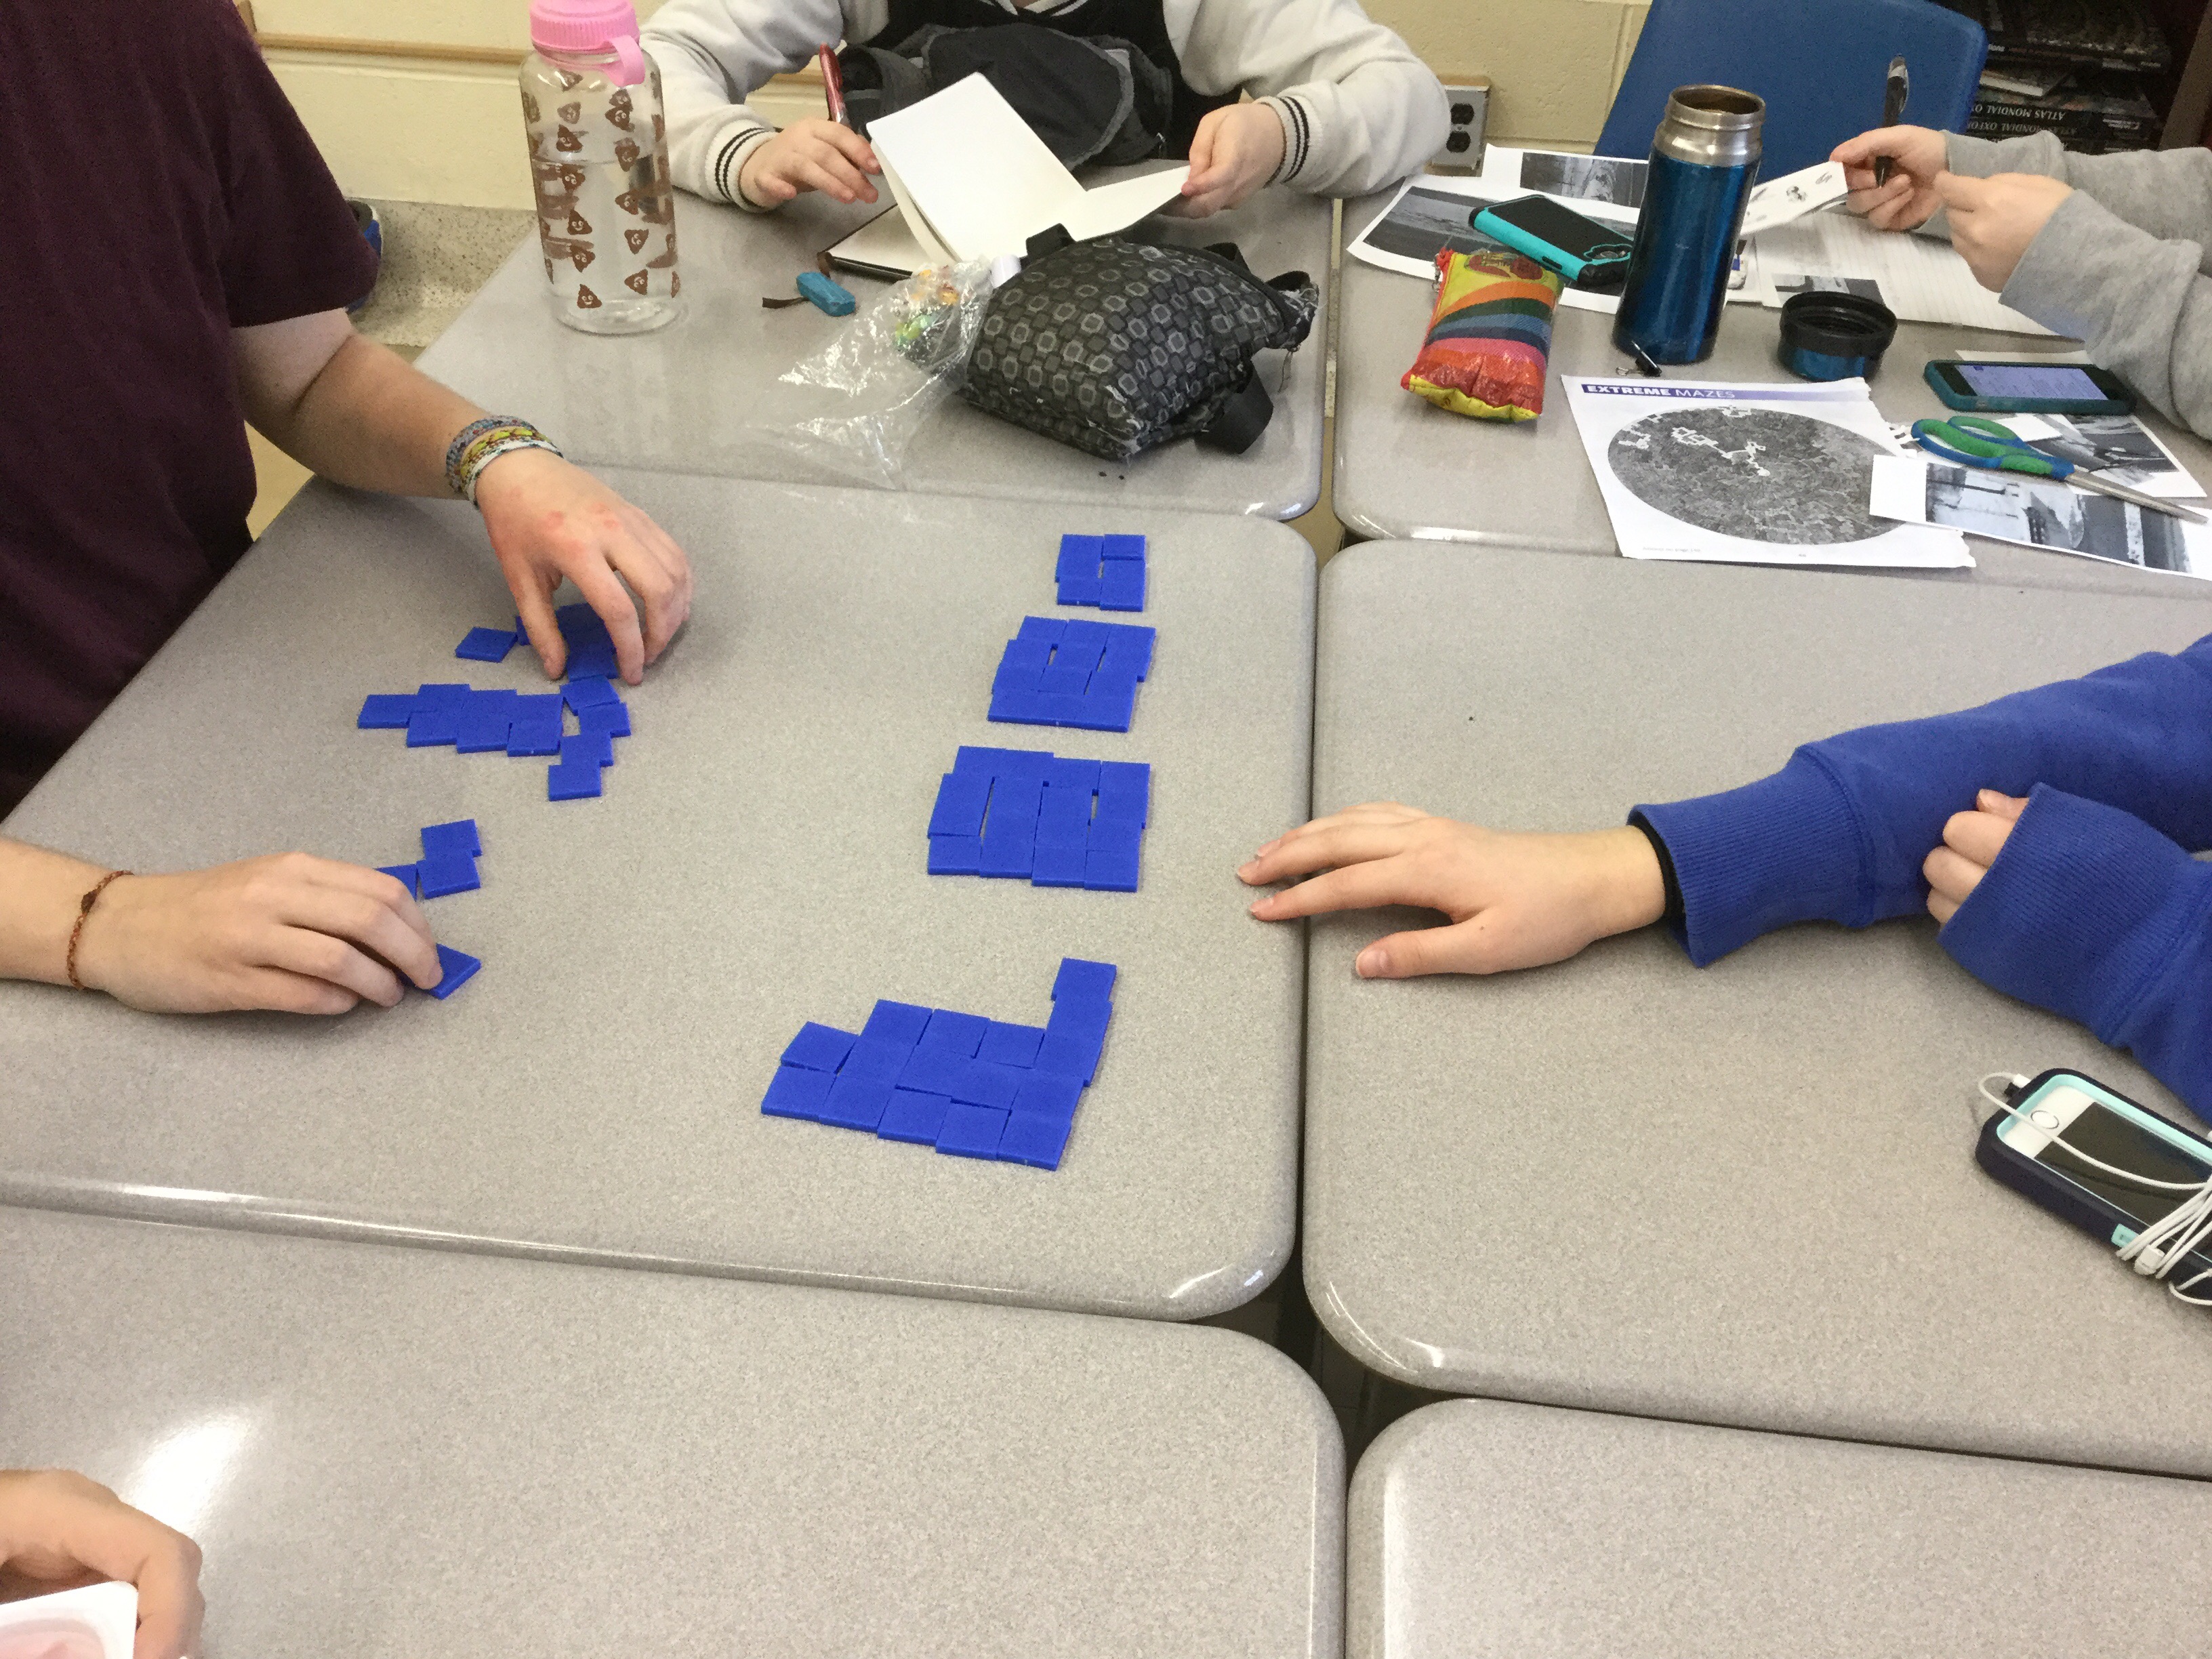
Next we lined up all the squares contained in each figure.

And we noticed that the step pattern was not consistent. The increases were bigger each time. Each time the increase got bigger by 2.
We plotted the data on desmos

And then we plotted the equation we made to describe the area of the rectangle
Y= (x+1)(x+2)

The equation hit all the points in our model! Pretty neat.
No comments yet
