The big TV experiment
Last night we measured our TV screens, and today we looked at the results.
 We tabulated the results on “desmos” to have a look at the collection of results in our scatter plot.
Period B’s results showed the following relationship. We calculated that the ratio in the data was about 3:4 or 9:12 which was not what most of us predicted. (The current TV proportions are frequently 9:16). We discussed vocabulary to describe the trend, and discussed some “outlier” points and where the variability may come in our measurements (measurement error, how to report fractions of inches, age of TV-older TVs could be more square).

Here’s period C’s results.
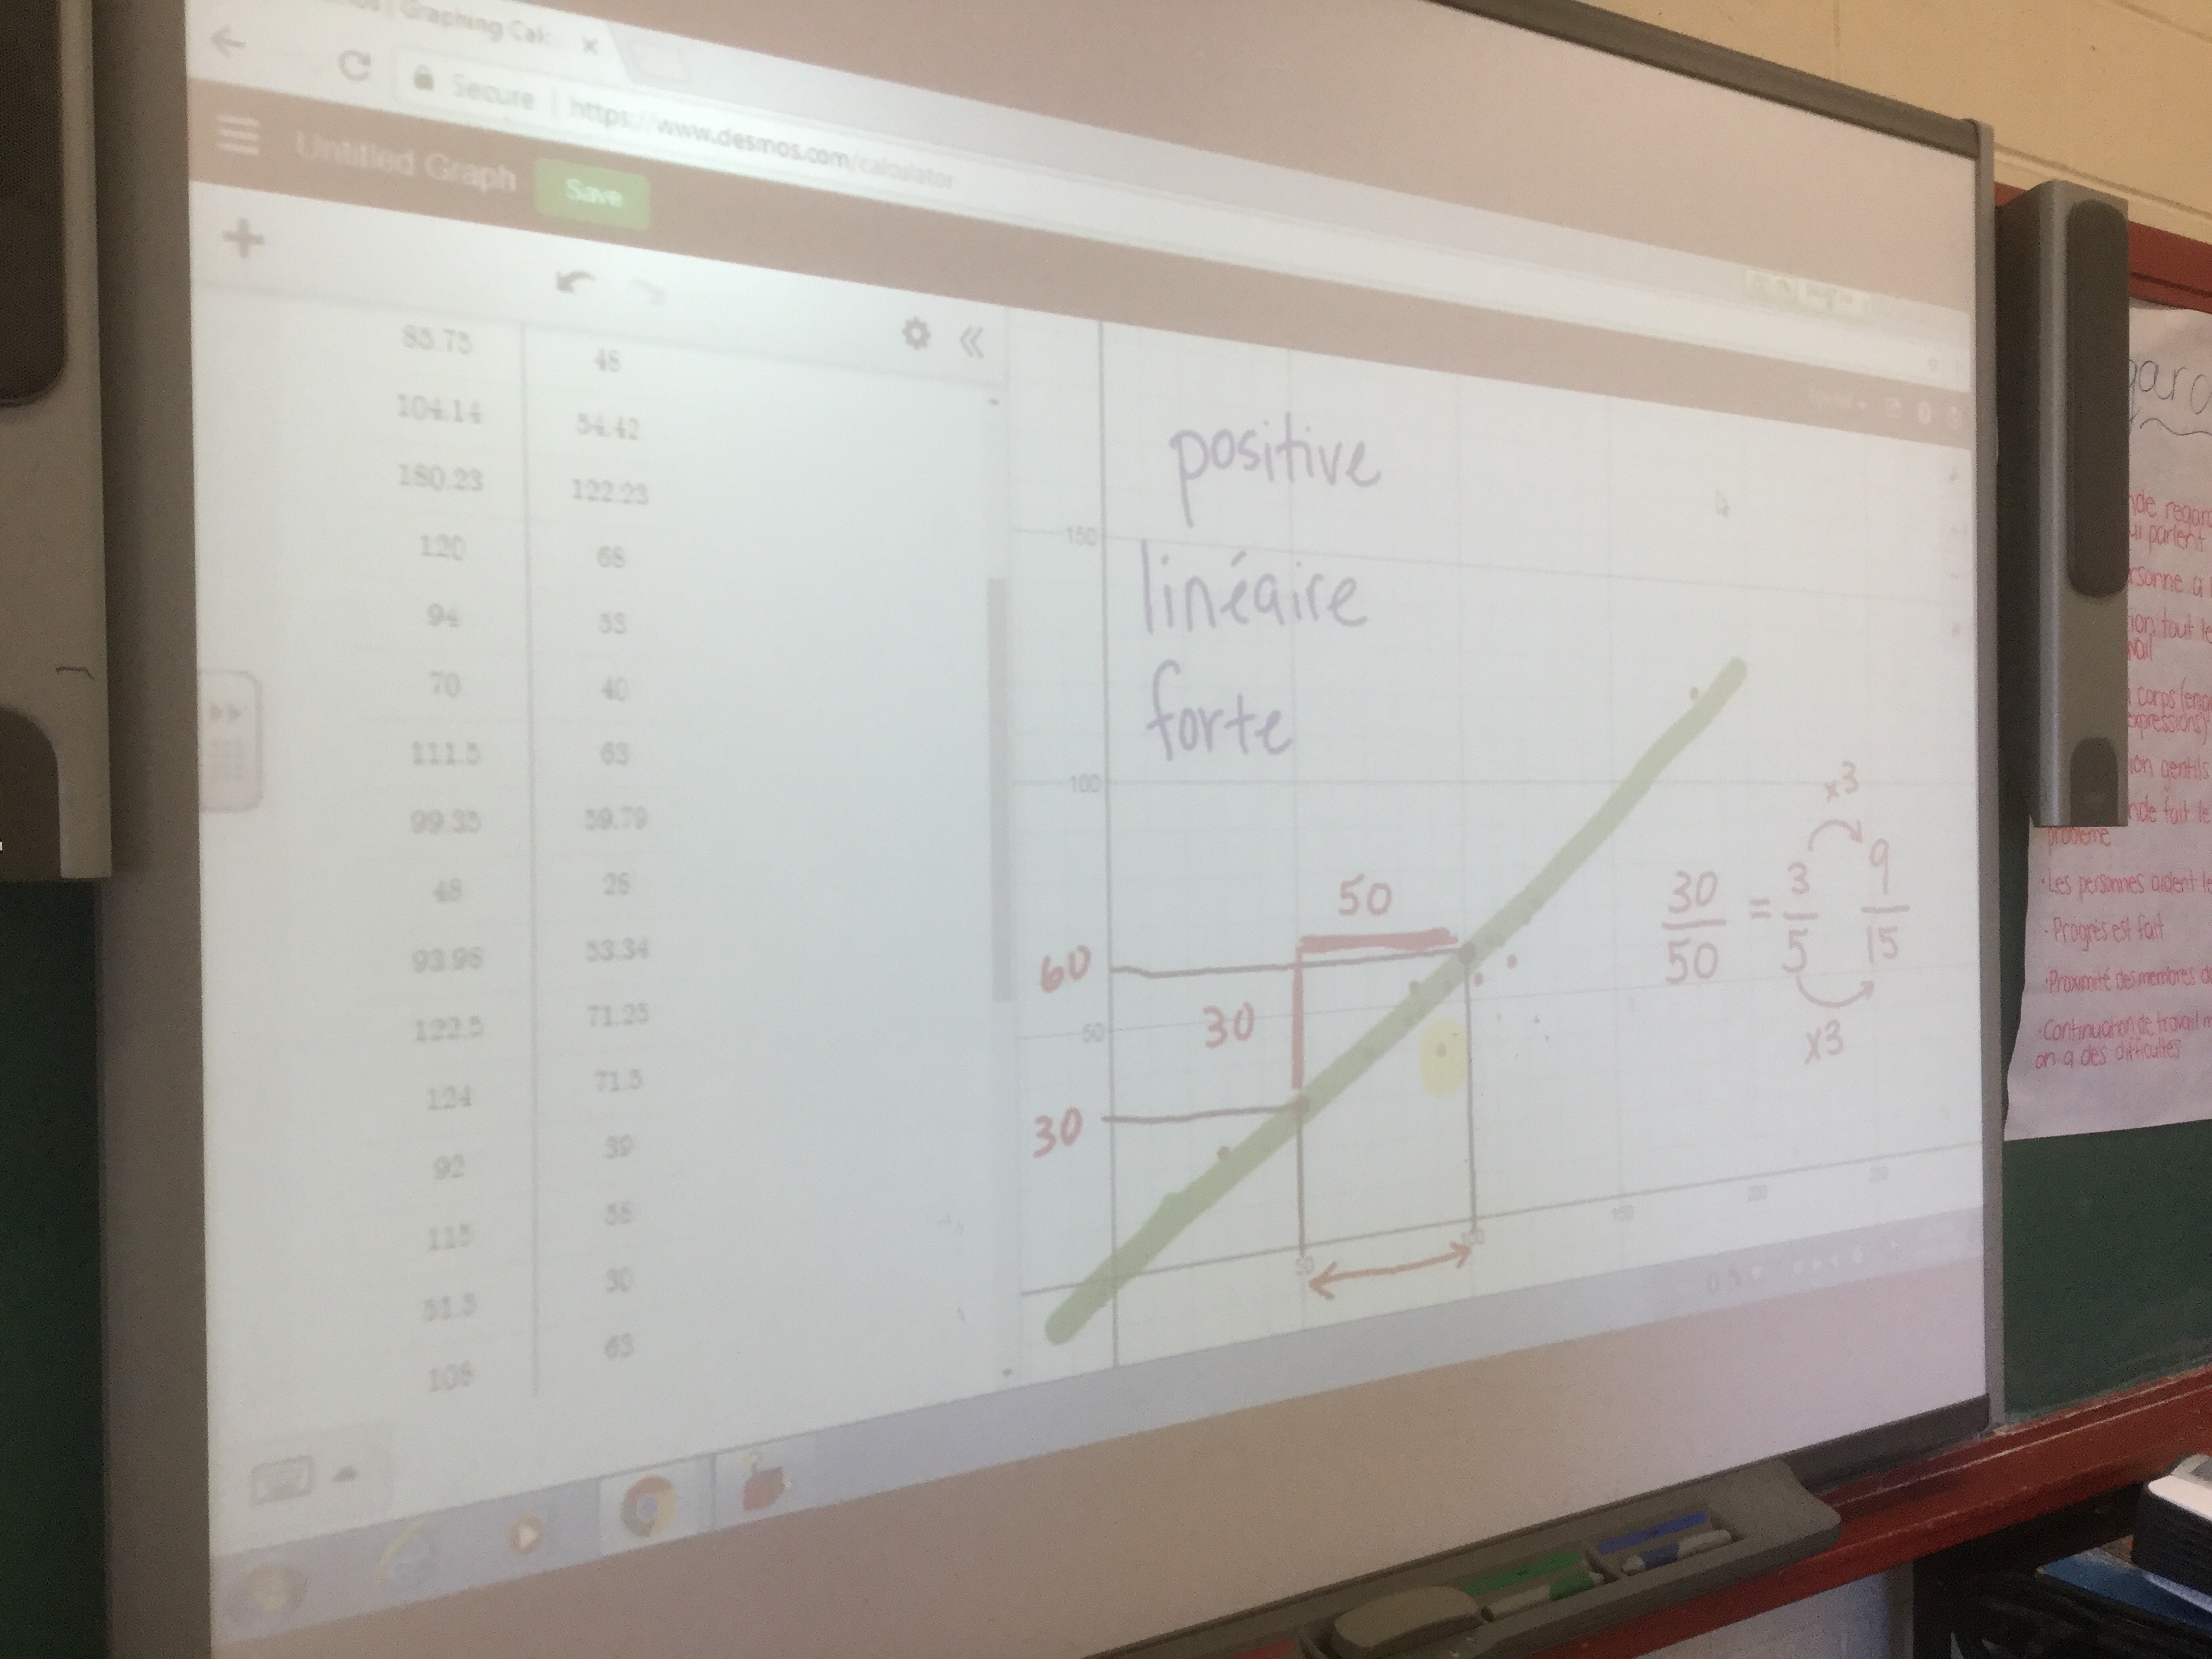
With more data, we were able to see a similar trend, but one that was more close to the predicted 9:16 ratio.
After looking at TV data we added circles to our skills of area/perimeter calculations.
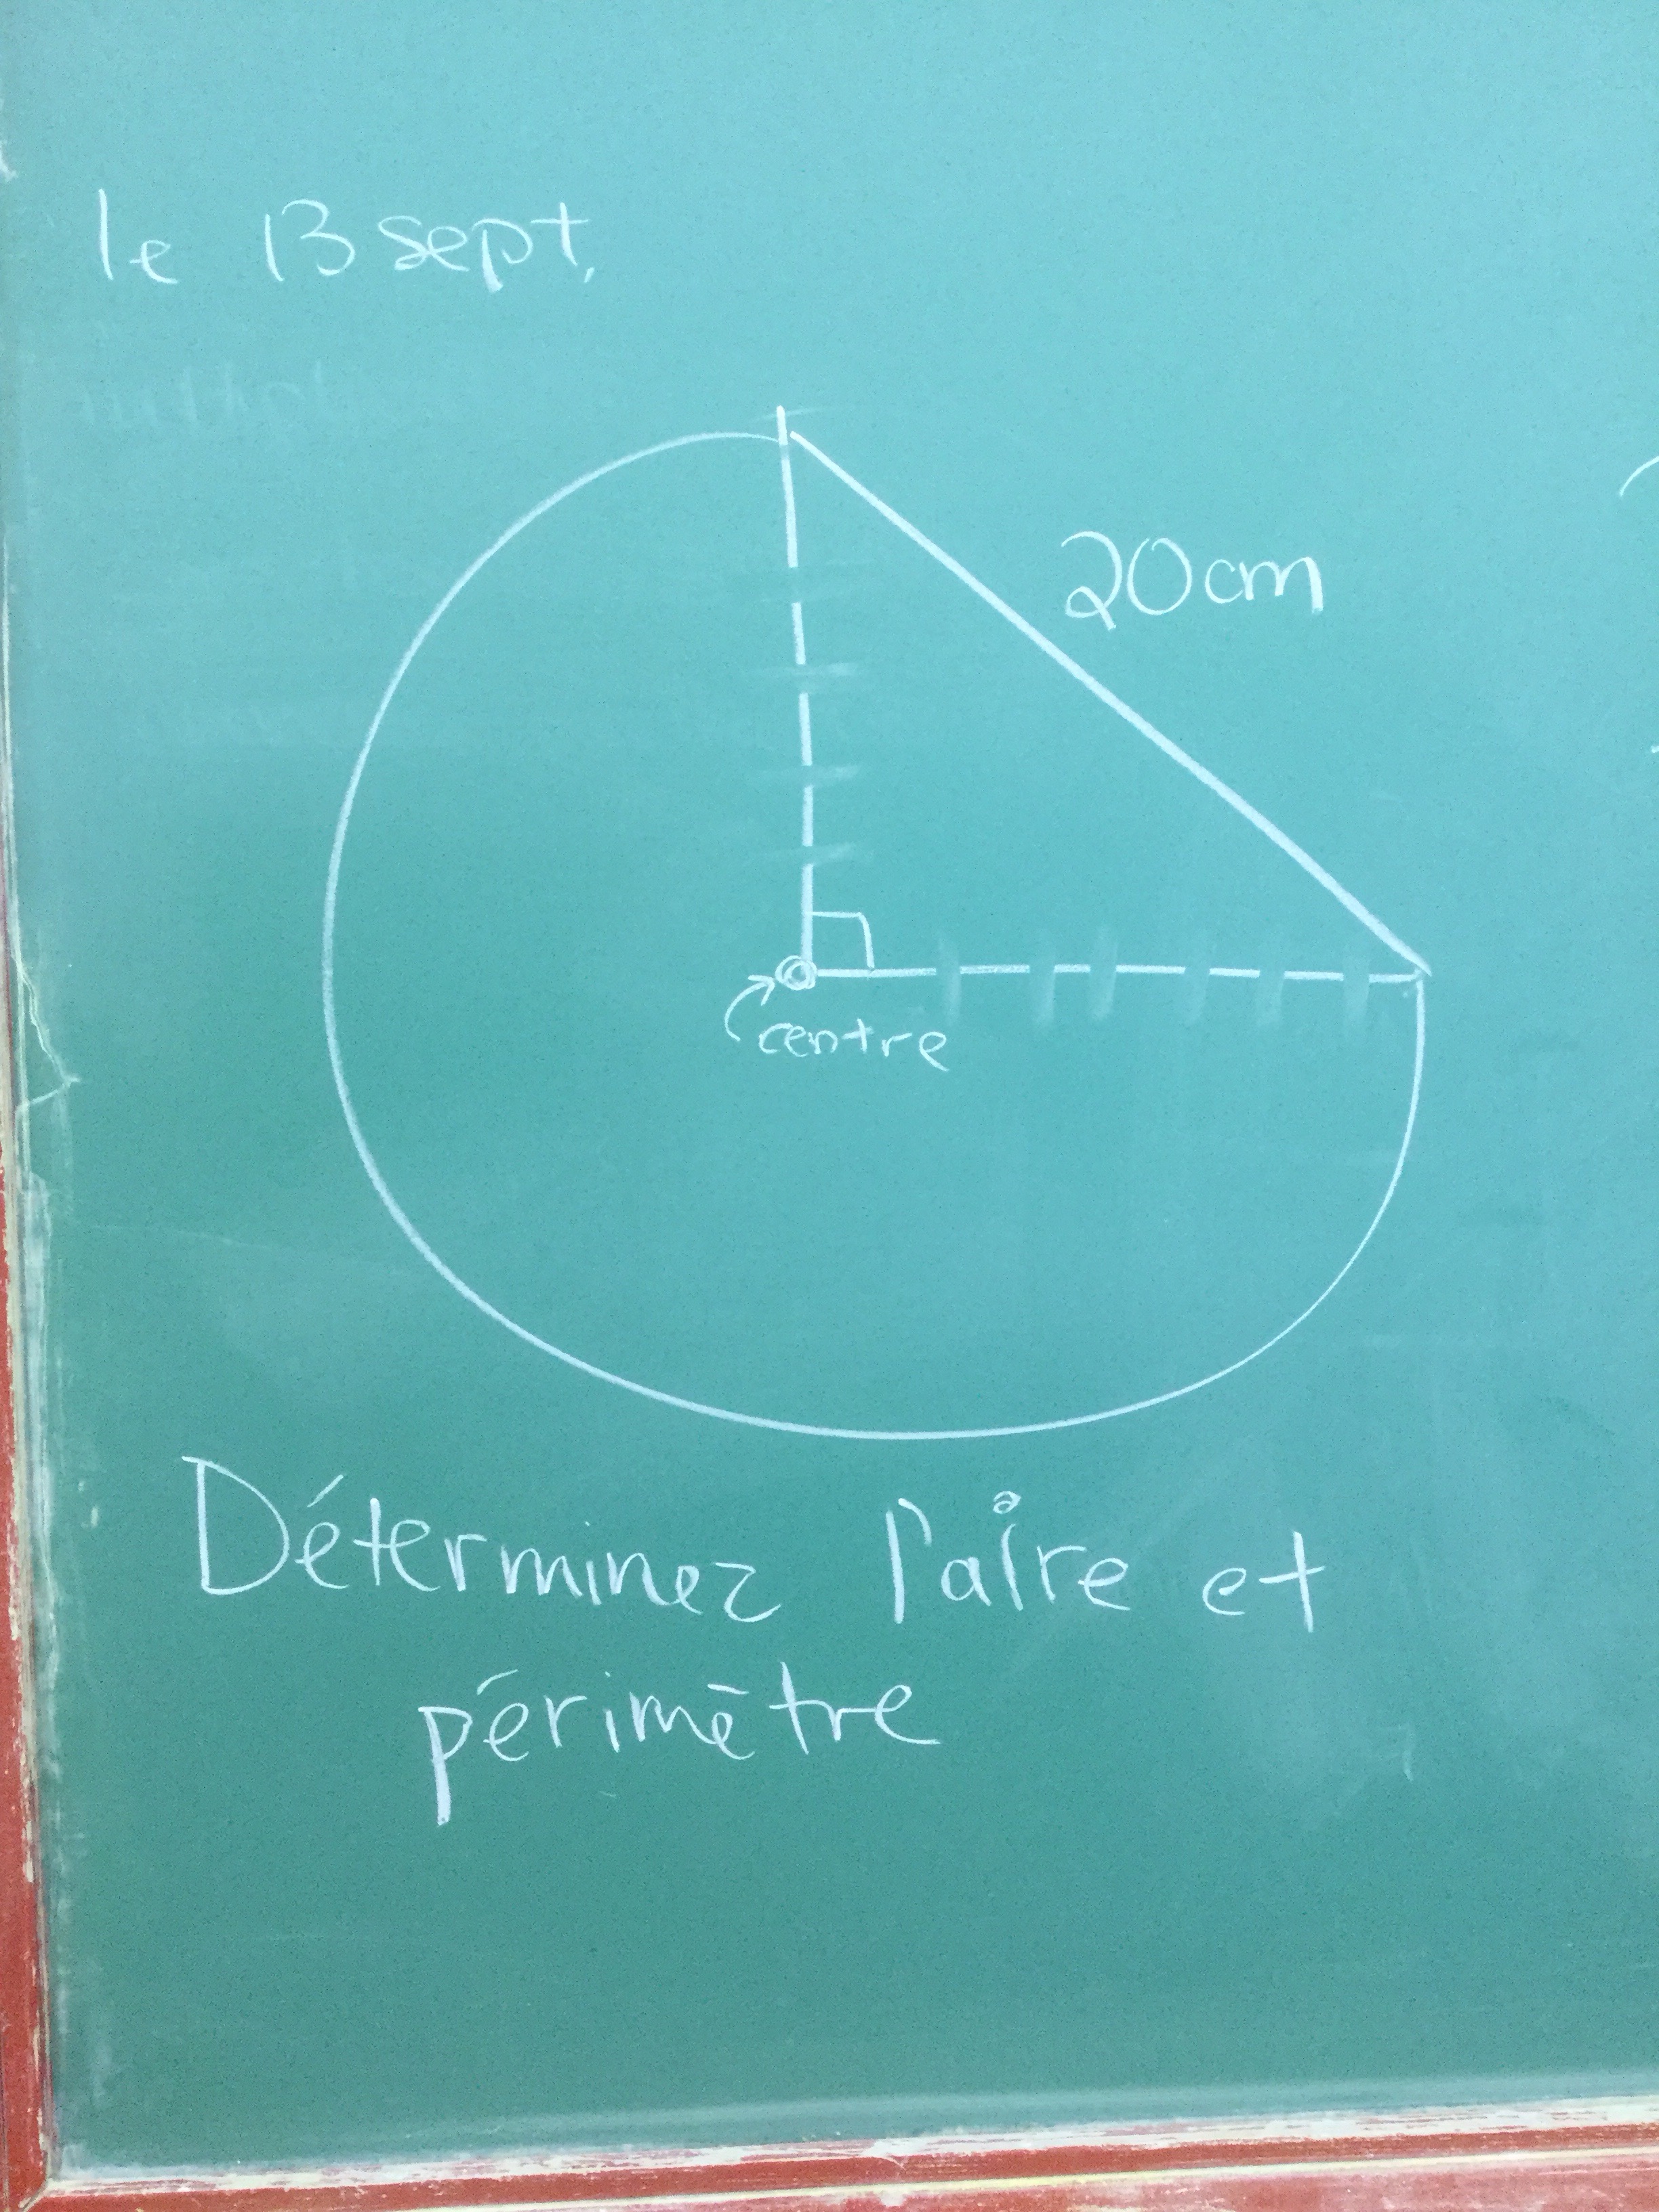
As promised, Pythagorean theorem was hidden in this question!
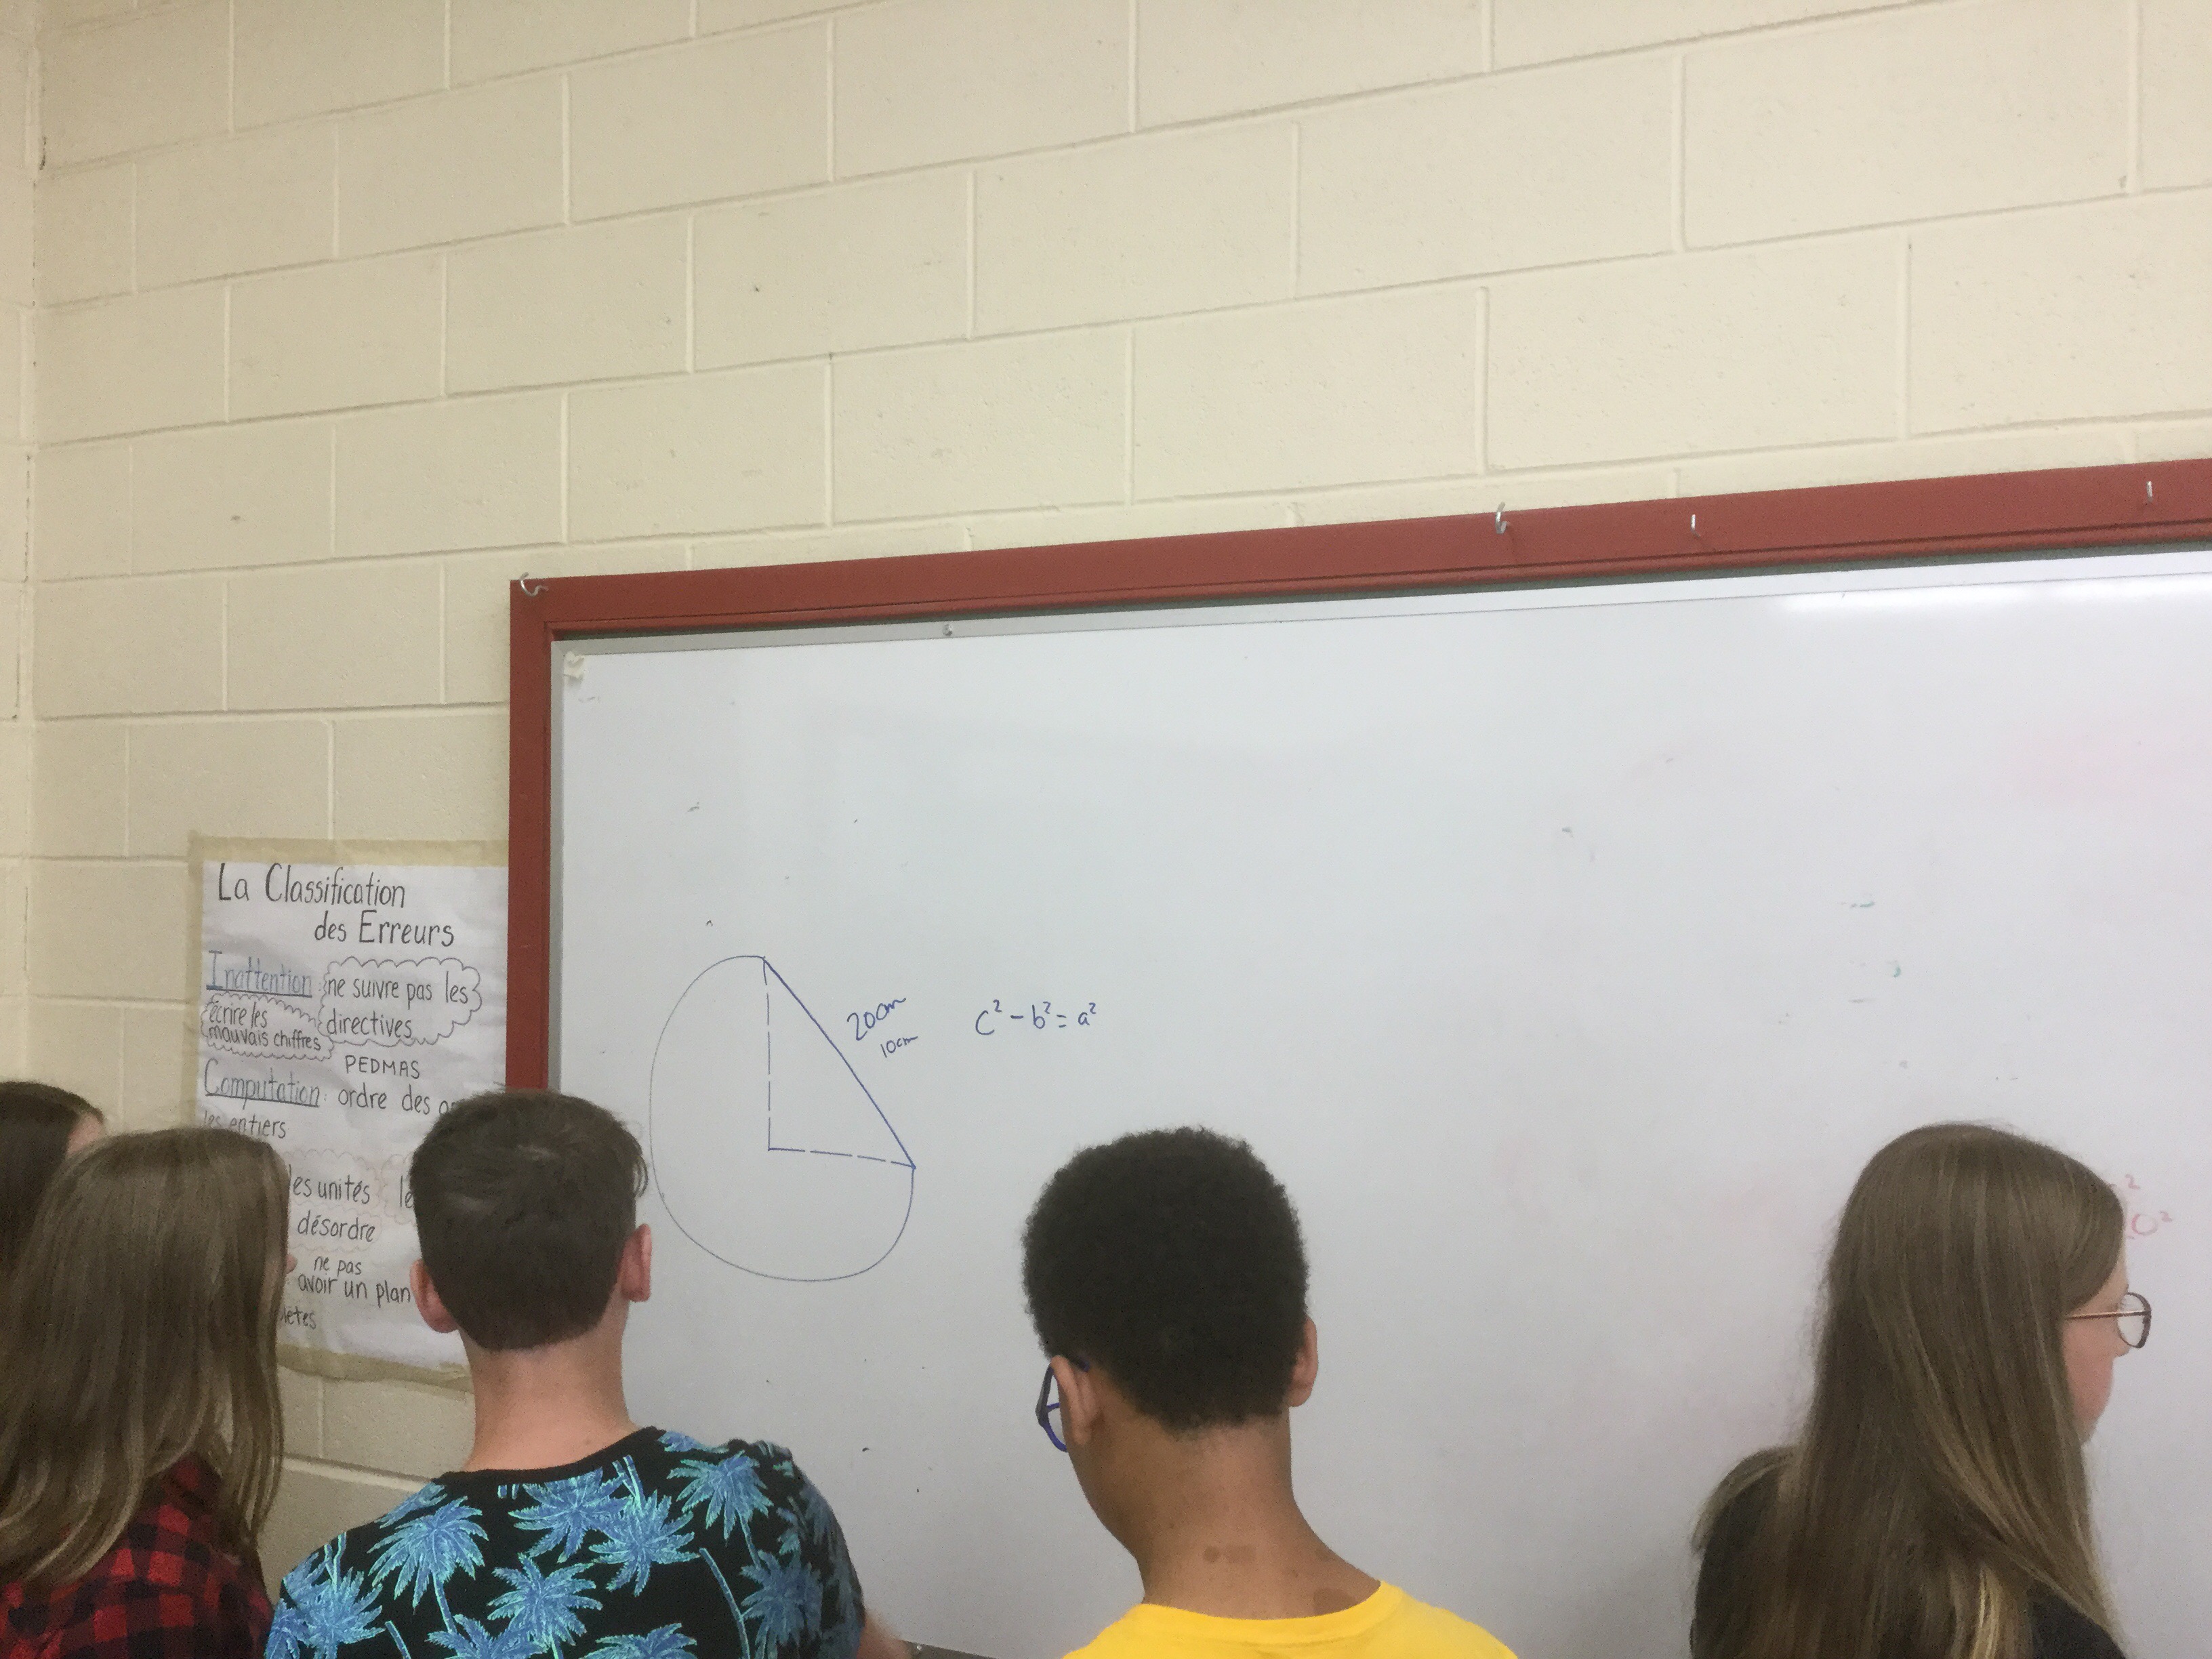
We saw some interesting approaches, and learned a lot from others in our group, and also from other groups.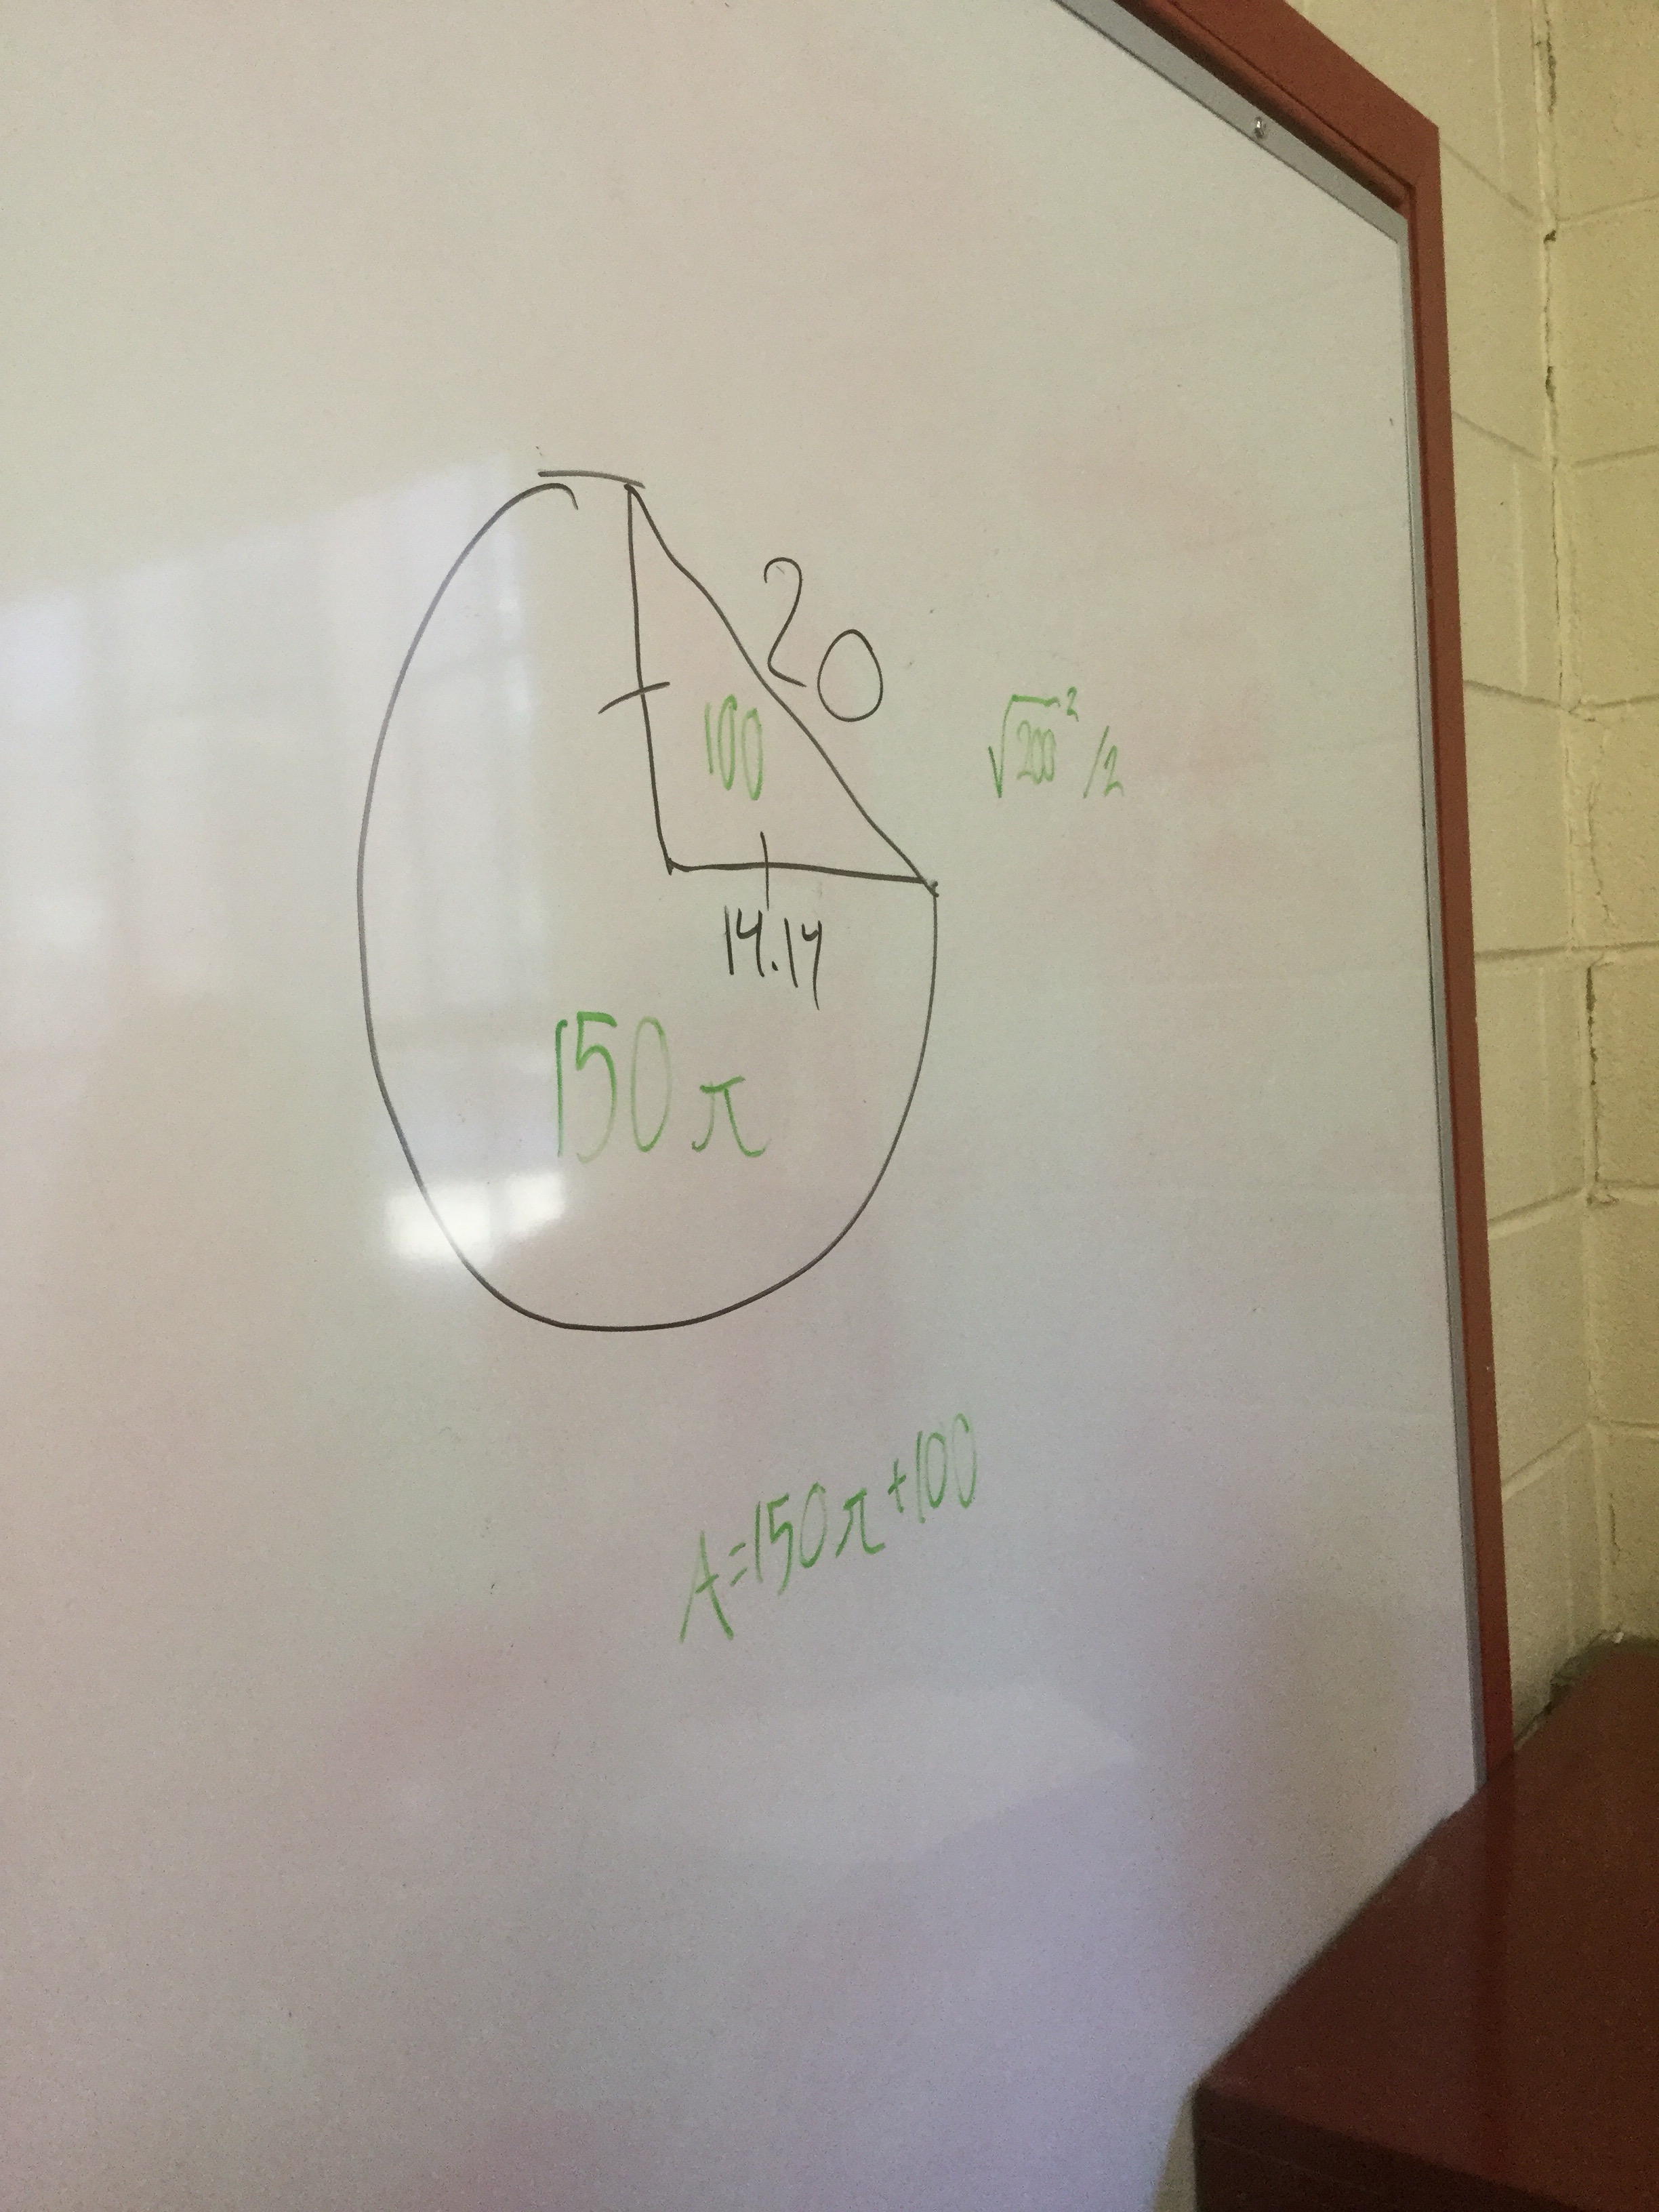
When we work at the wall it’s easy to show others our plan.
We need to work on careful communication so our work is easily followed by others. Sometimes arrows are a really helpful thing!
