How about those beans?
Remember waaaaaay back about a month ago when we planted beans? Well, they are growing now! 
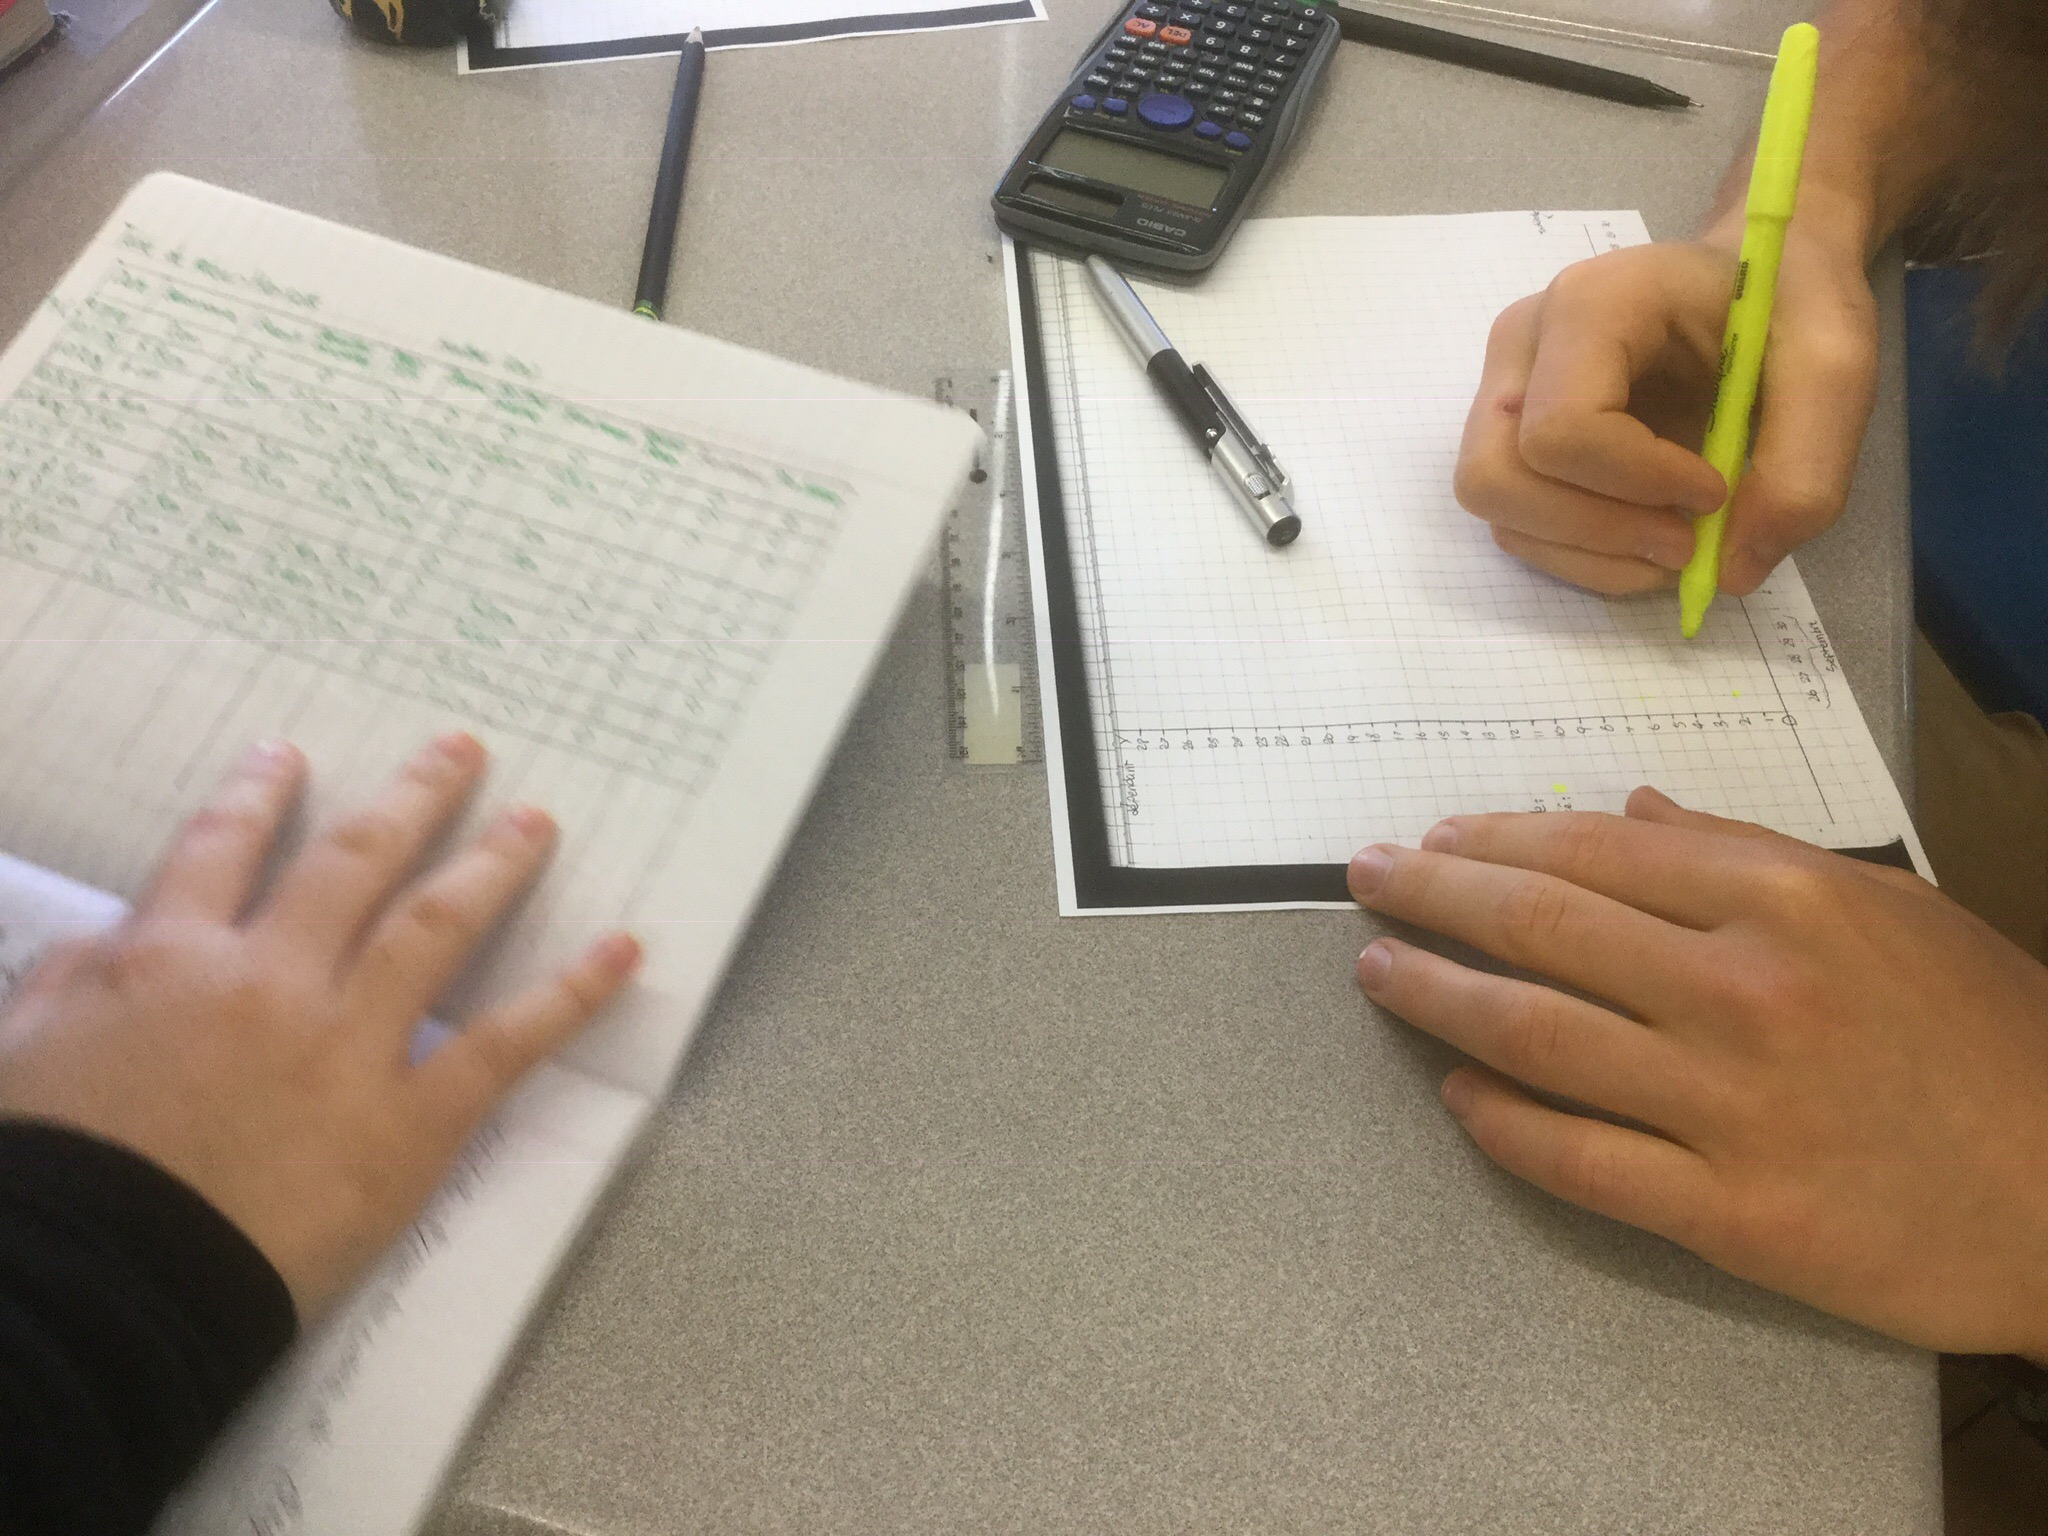
Each day we’ve been measuring their height, and today’s the day to graph the results.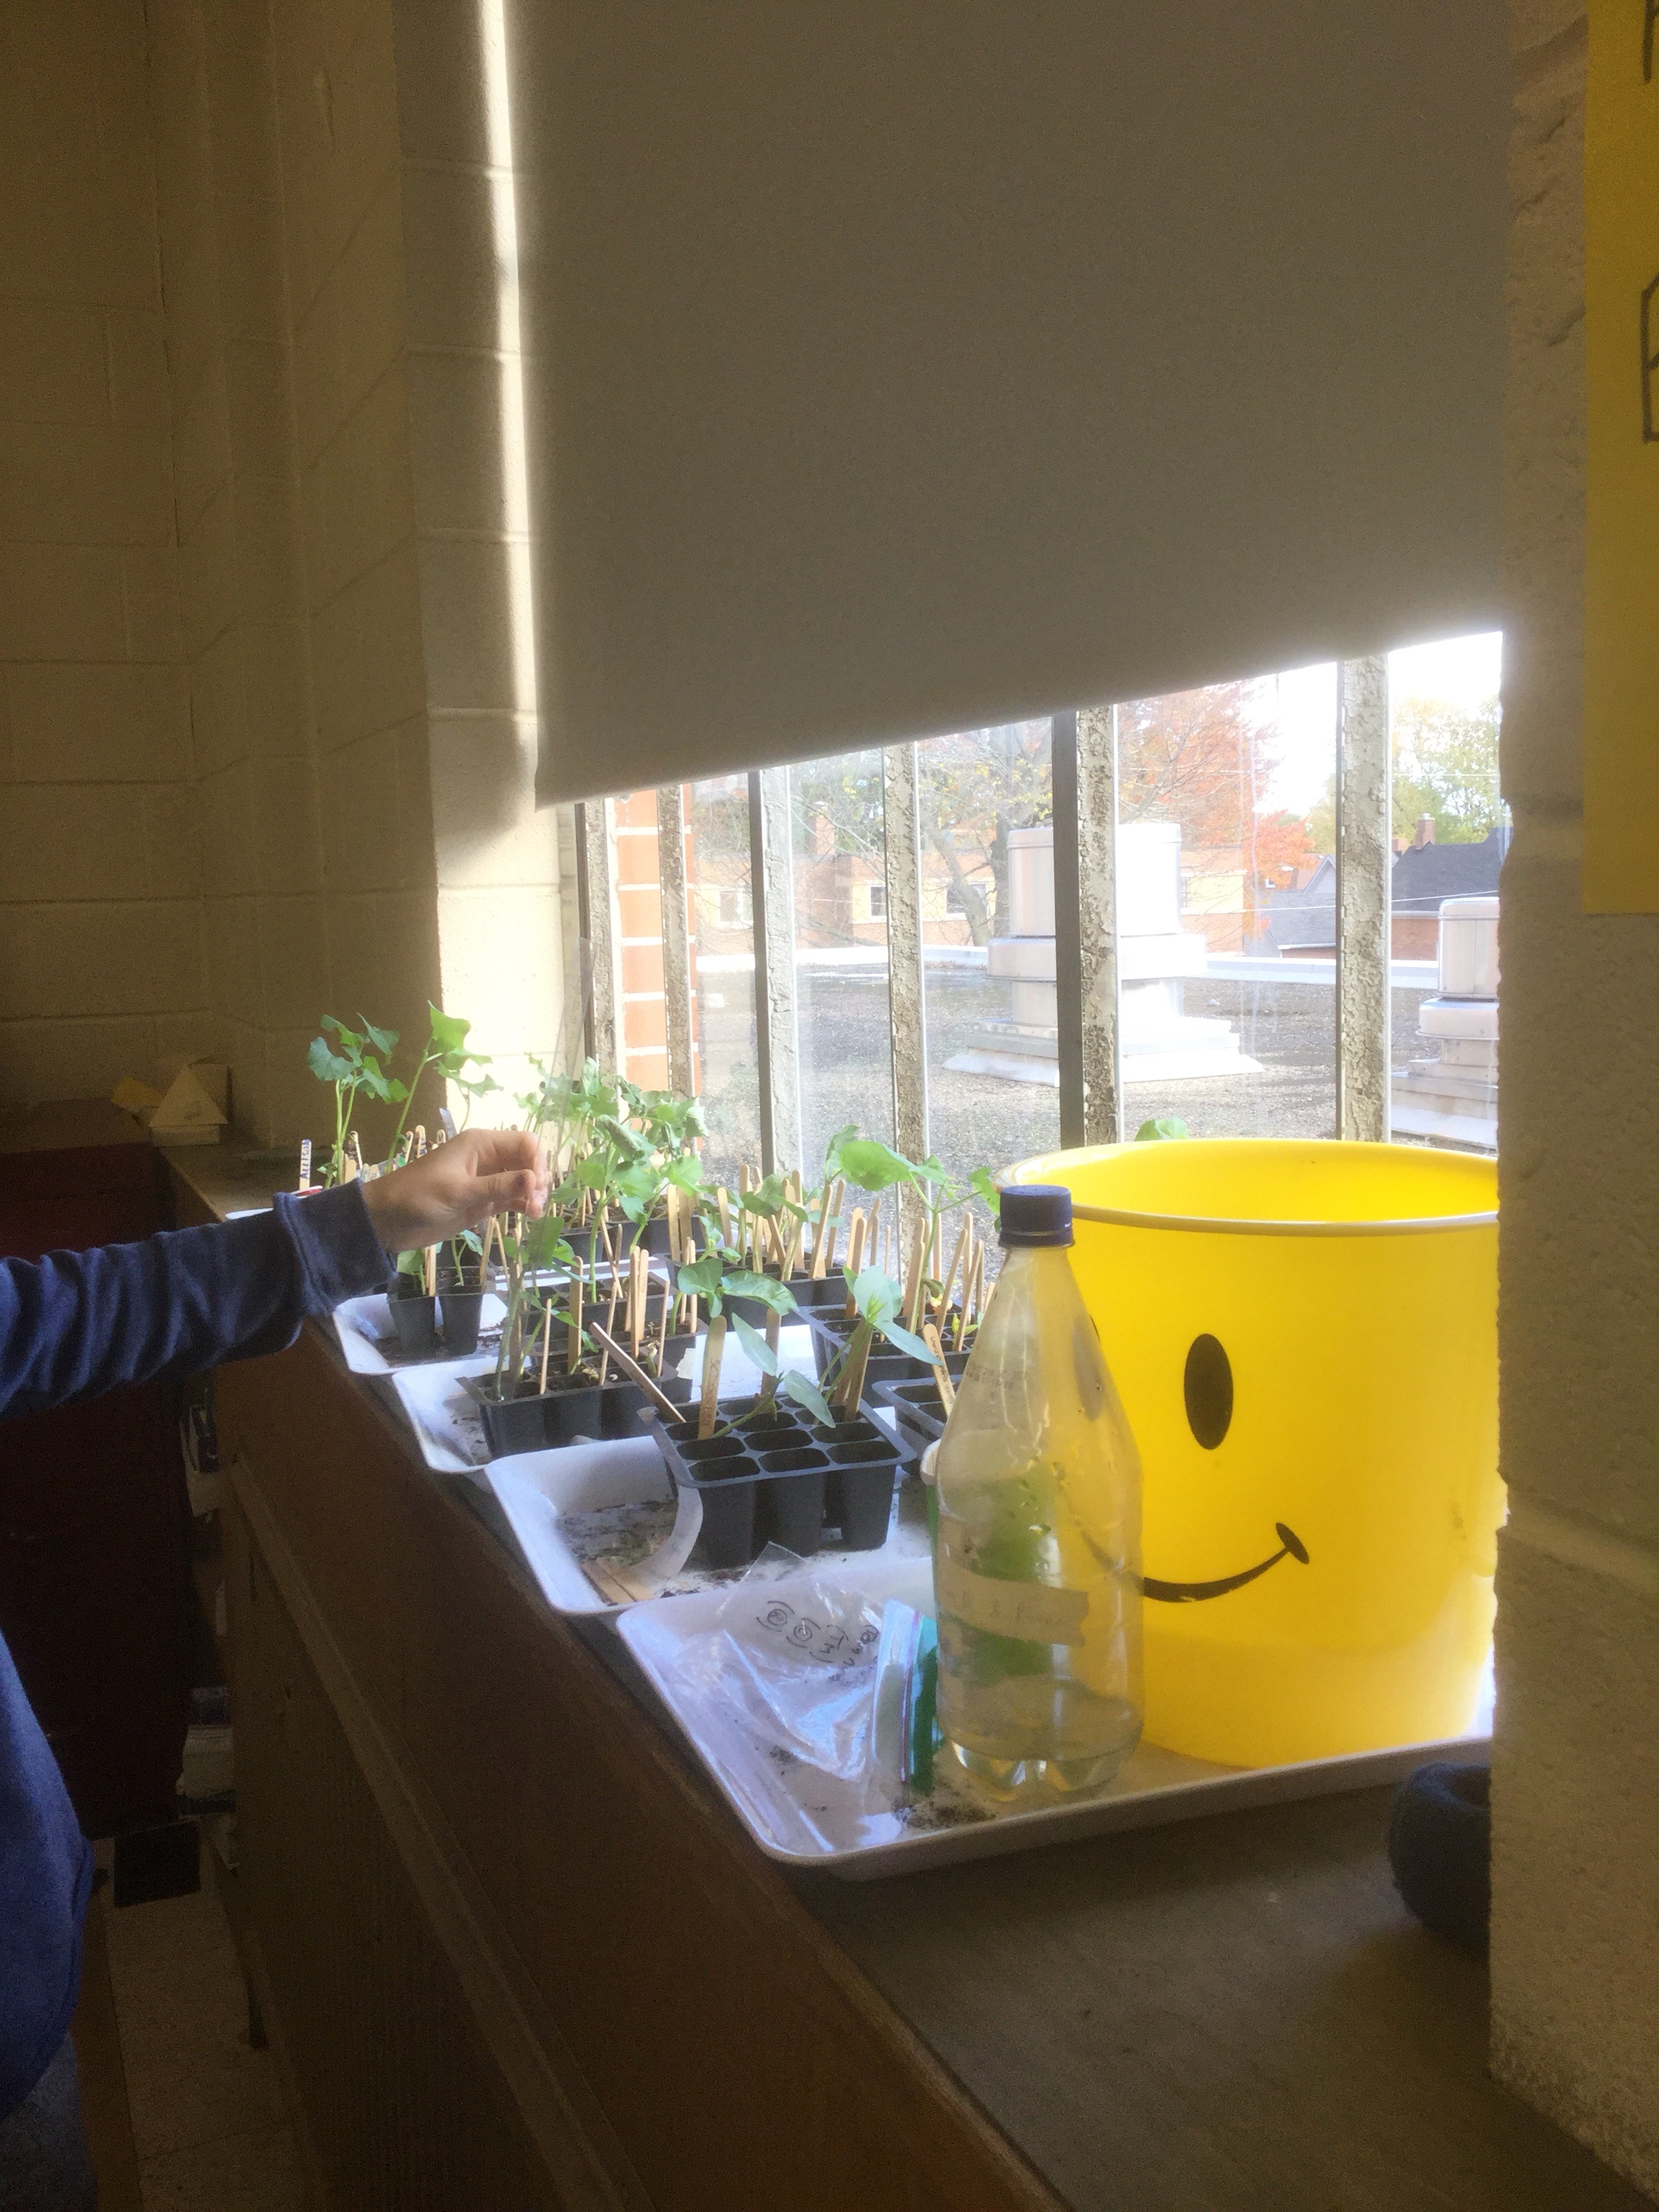
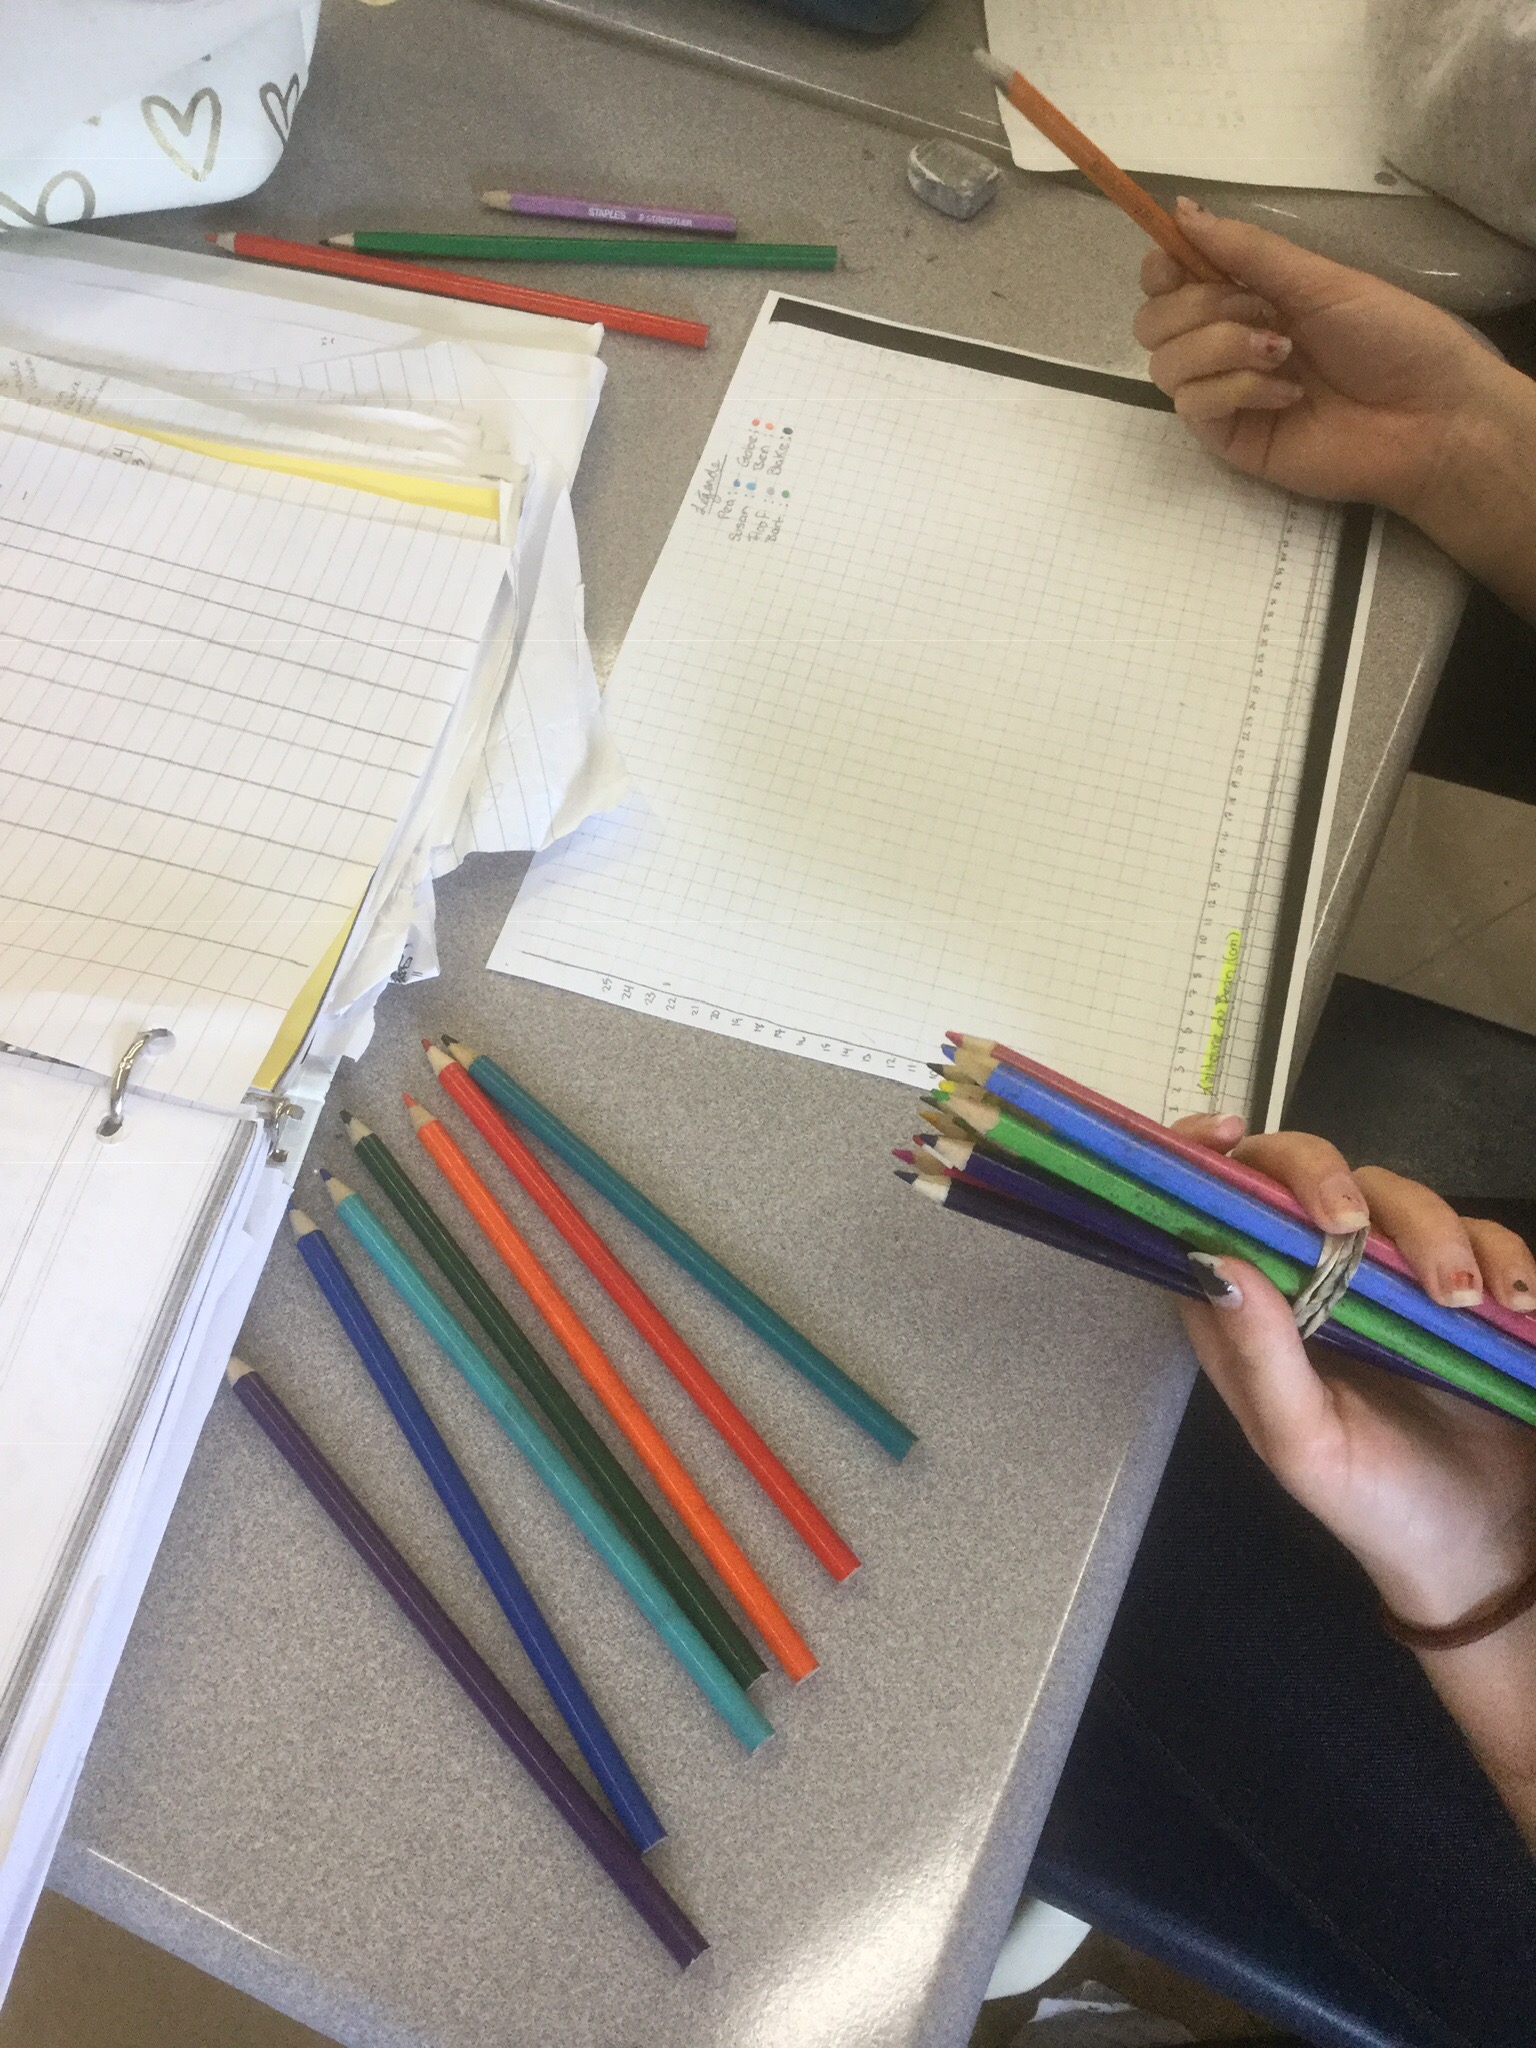
We are now pretty much experts with making scatter plots. We know the height of the bean is dependent on the day (otherwise, if i cut the bean smaller I’d go back in time….which would be a great short story, but for math class we assume that isn’t the case). We know hat our axes need consistent scales. We know that for scatter plots we don’t join up all the points, ut we show trends with lines and curves of best fit.
We now have choices about how to represent our data. We can graph each bean in a different colour, and have a different line/curve of best for for each.
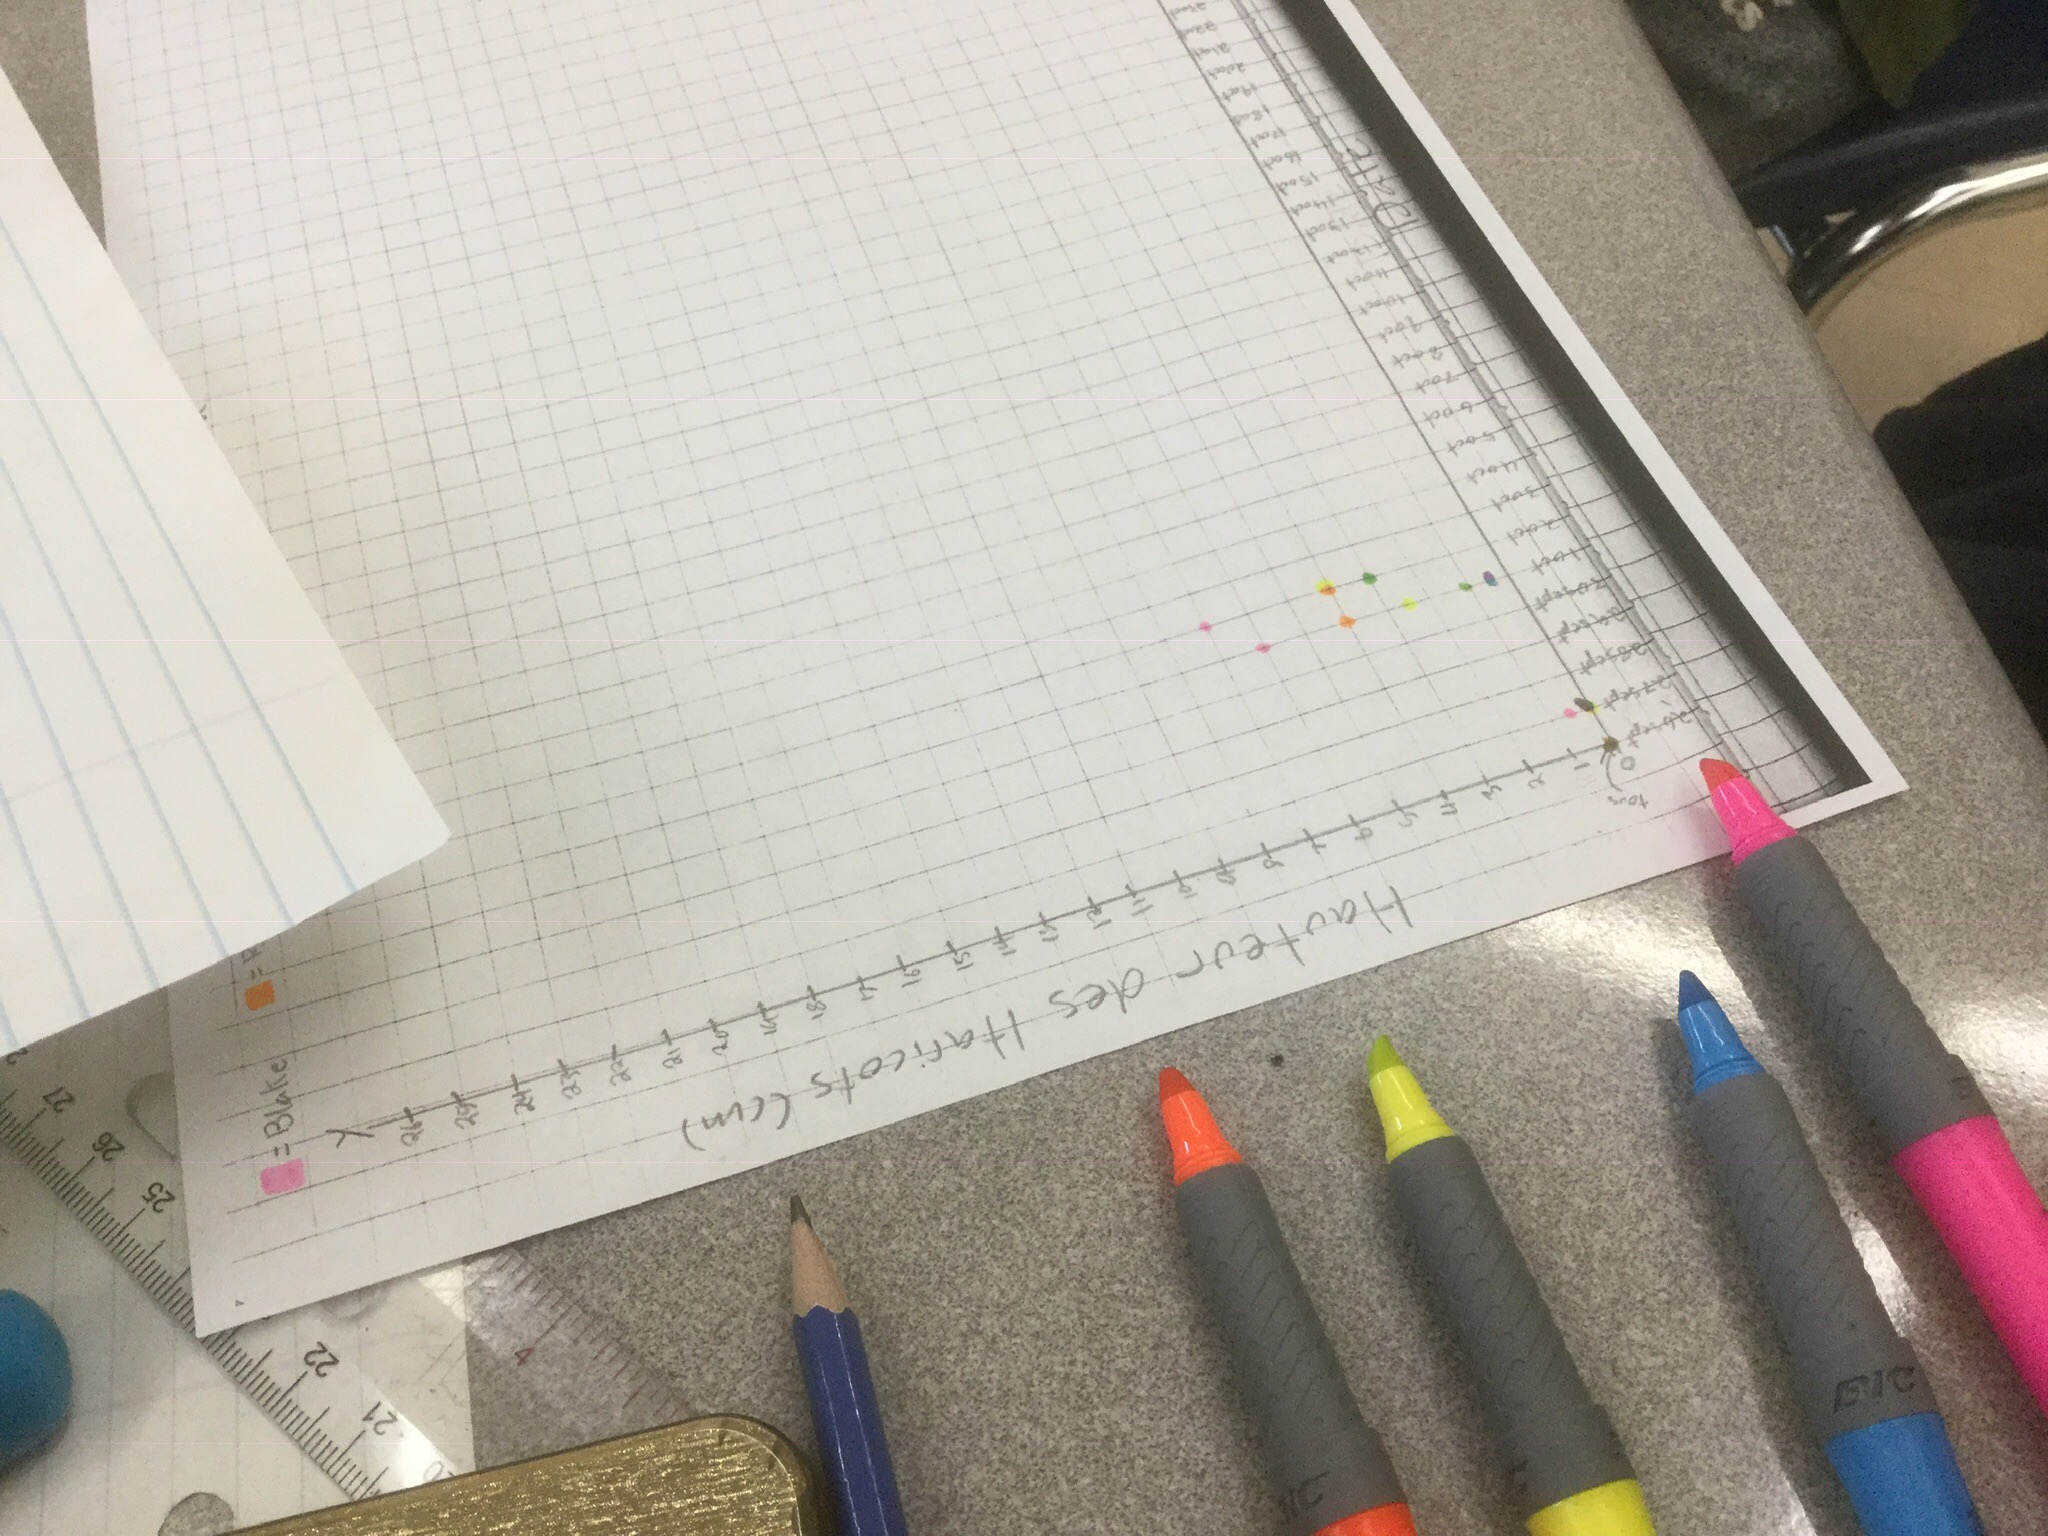
We can also decide to graph each type of bean (avid readers will remember that we planted kidney beans and black eyed peas) and we can compare one type to another.
With whatever method, we have a job to do. We need to predict what out bean plant’s height will be 2 weeks from now (oct 25). We also have to estimate how tall they were on Monday (Thanksgiving) when we were not here to measure them.
Homework this weekend is this graph, the error analysis from summative 1, and an email home about the first summative, early reports, visual patterns and beans(optional).
On a sad note…some of the beans (who grew so fast in the dark) exhausted their energy stores and have started to die, or their stalks have broken when we’ve measured them….so for a few of the plants, today marked the end of their experiment.

