Linking equations to graphs of parabolas
How are these two connected?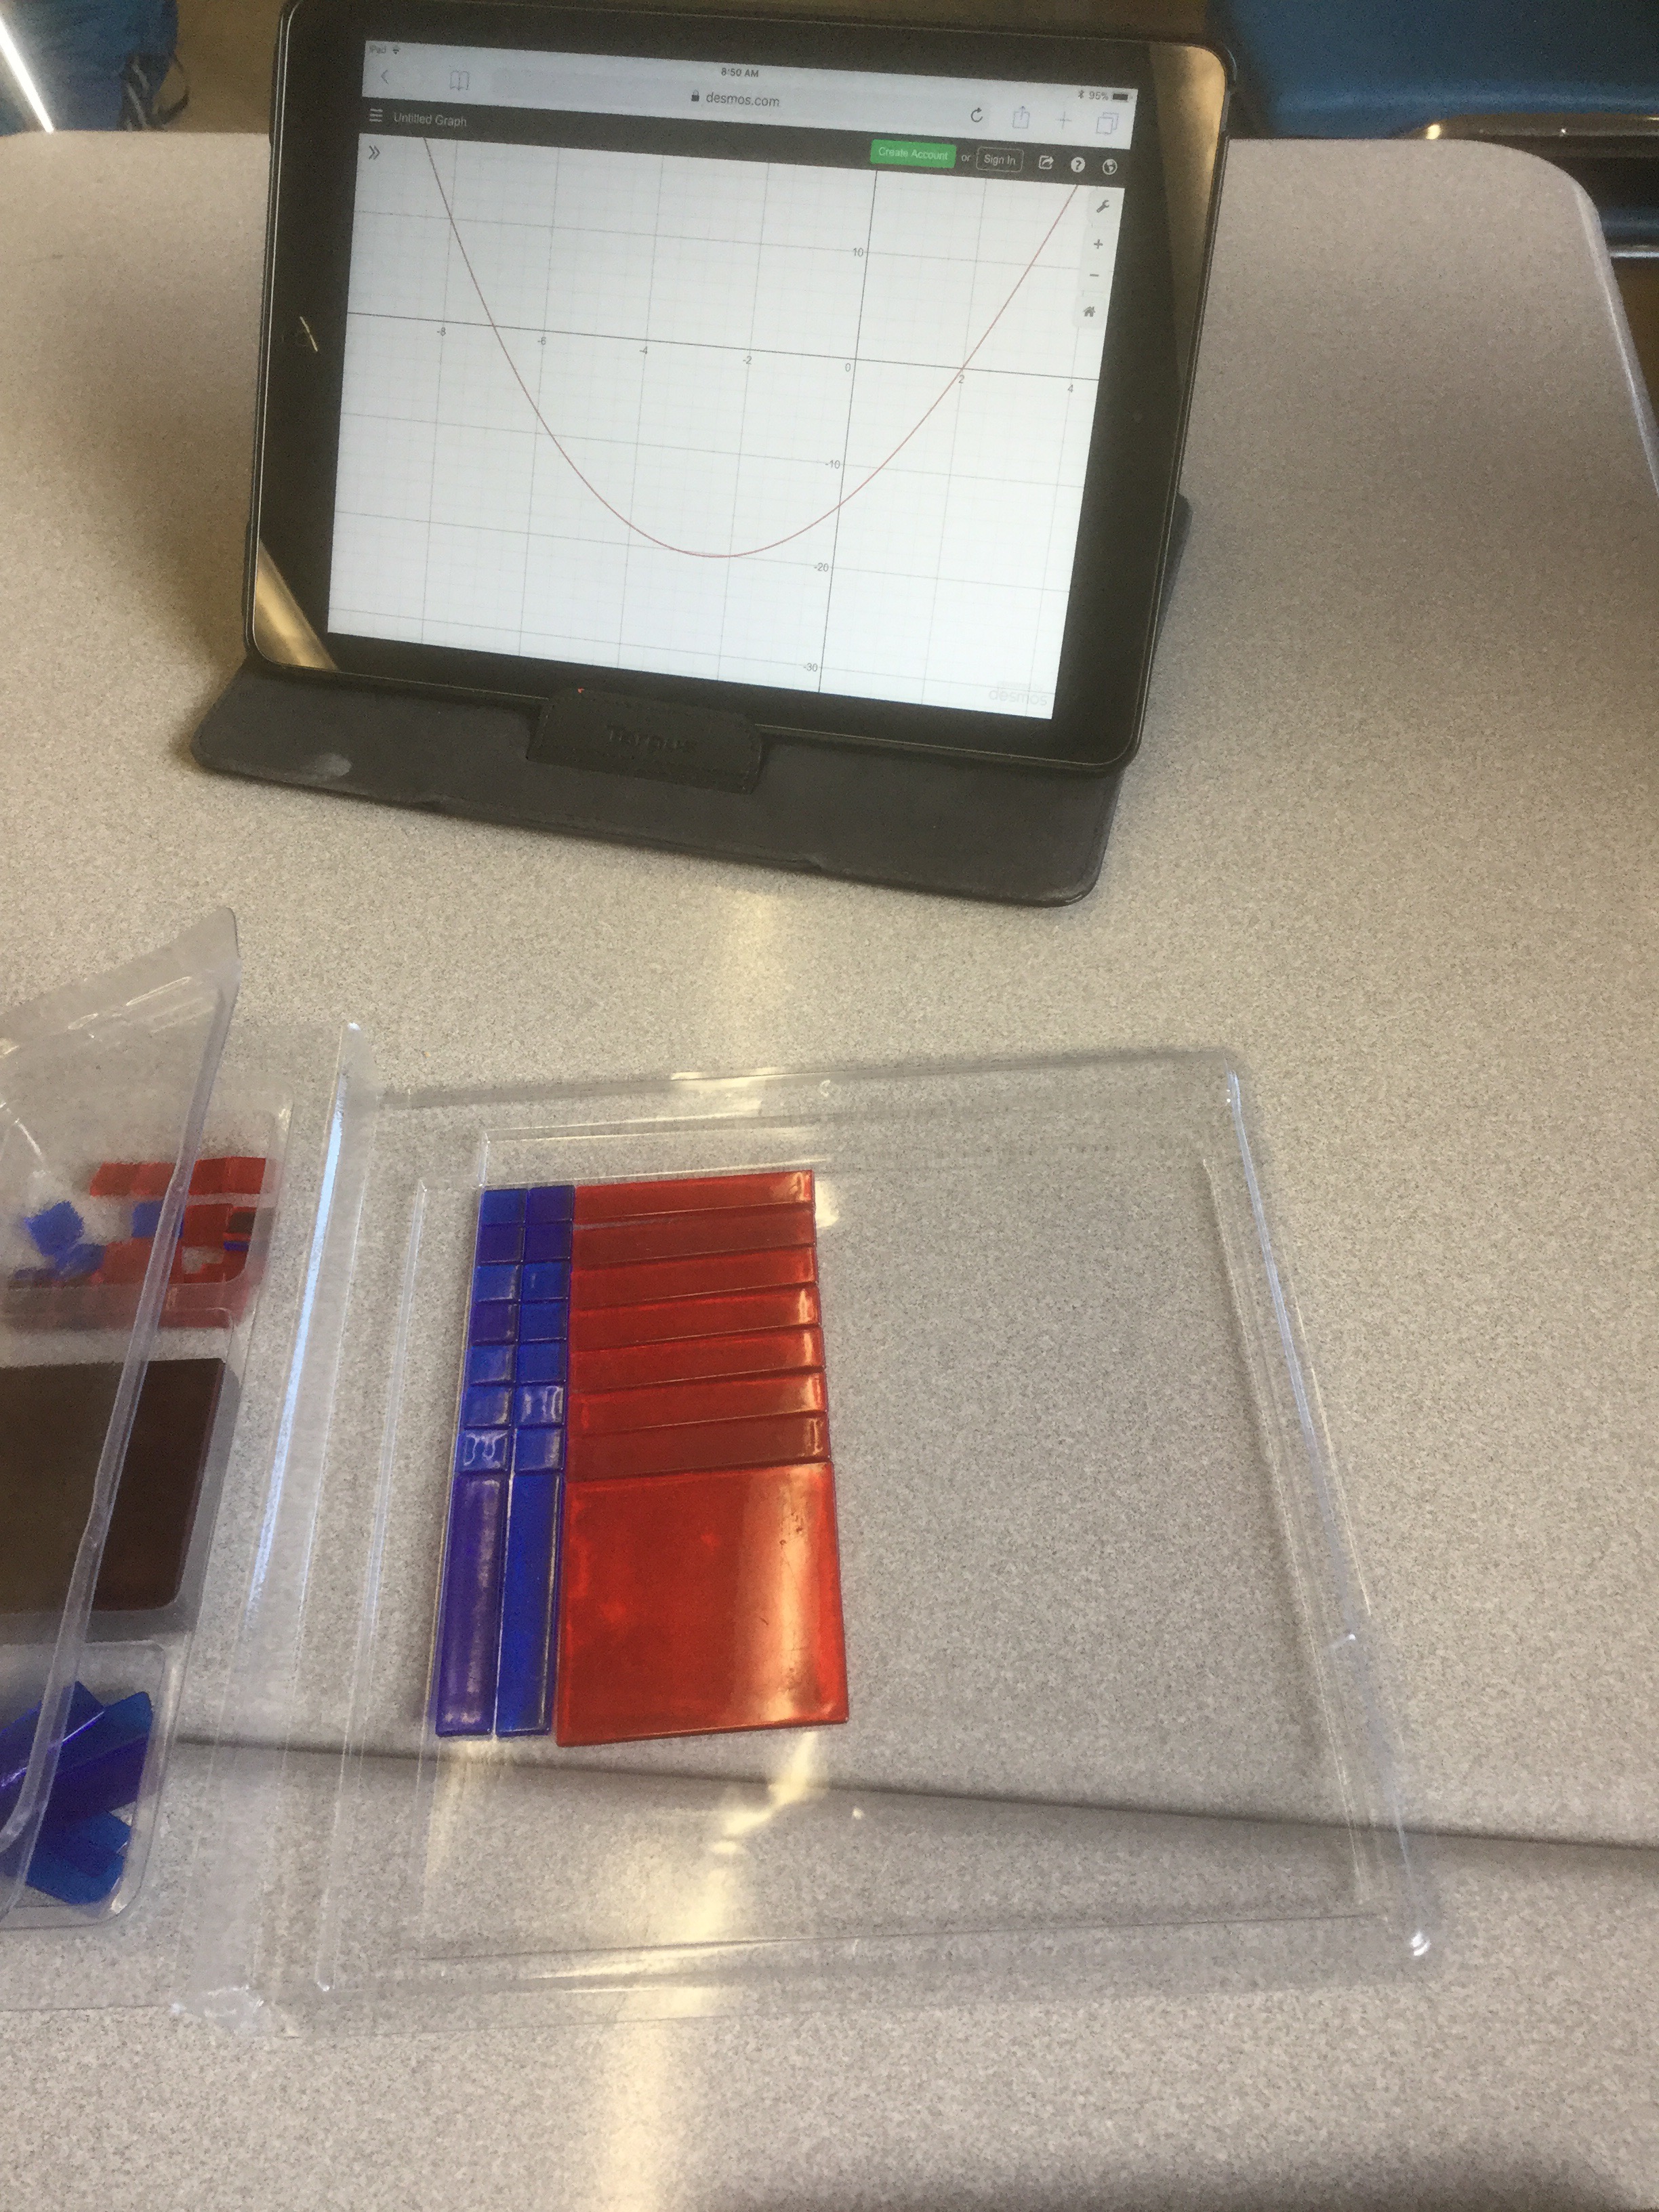
We are using algebra tiles to visualize polynomials and factor them (make them into rectangles and the dimensions are the factors), and then relating that to the graph.
Here’s the example we worked through together

We notice that the dimensions of the rectangle are related to the roots (x intercepts/zeros) of the parabola. We know that the axis of symmetry is at the midpoint of the roots (and we know how to calculate midpoints!) if we sub in the axis of symmetry for x, we can calculate the y value of the vertex. We see that the constant is the y intercept (ordonnée à l’origine).
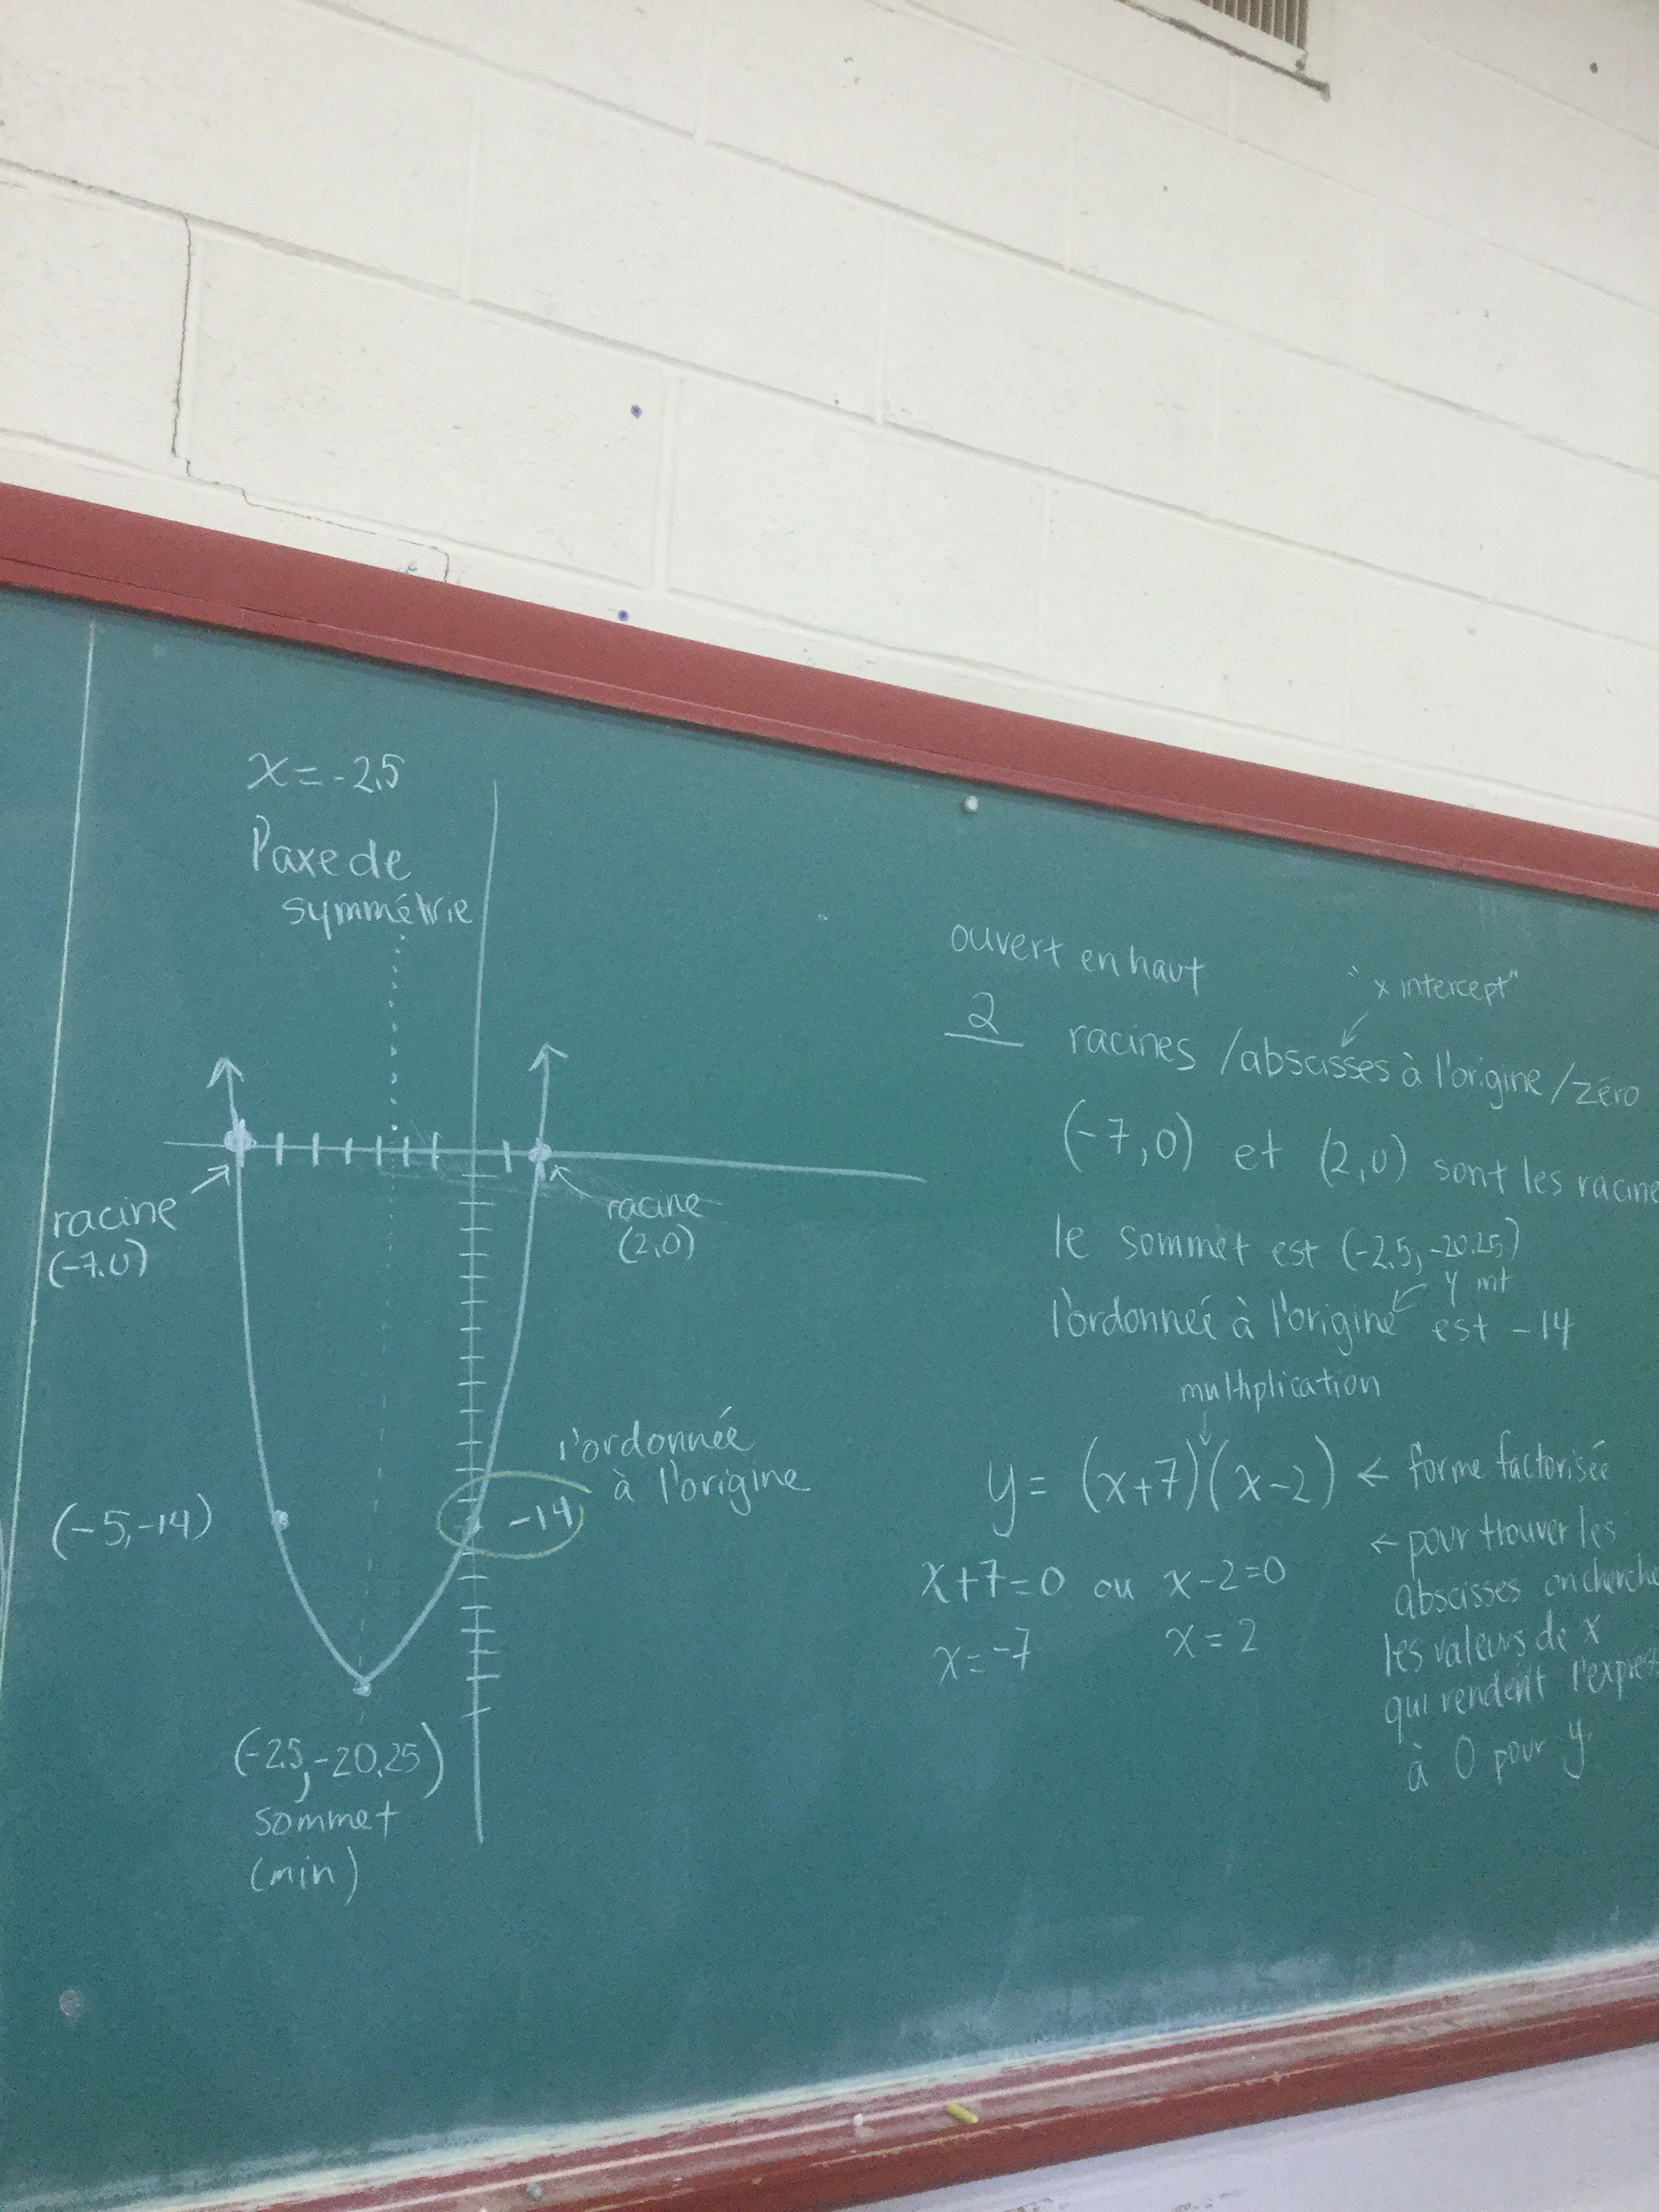
To figure out the roots, we look at factored form y=(x+7)(x-2) in order to find where the graph crosses the x axis, we need to make “y” be 0, since on the x axis the y value is always 0. For the result of a multiplication to be 0, on of the two things multiplied together MUST be 0 too. We have 2 options, either (x+7) is 0…so x=-7 or (x-2) is 0…so x=2. Those two values correspond to where the parabola passes the x axis.
