Patterning to graphing
November 22, 2018
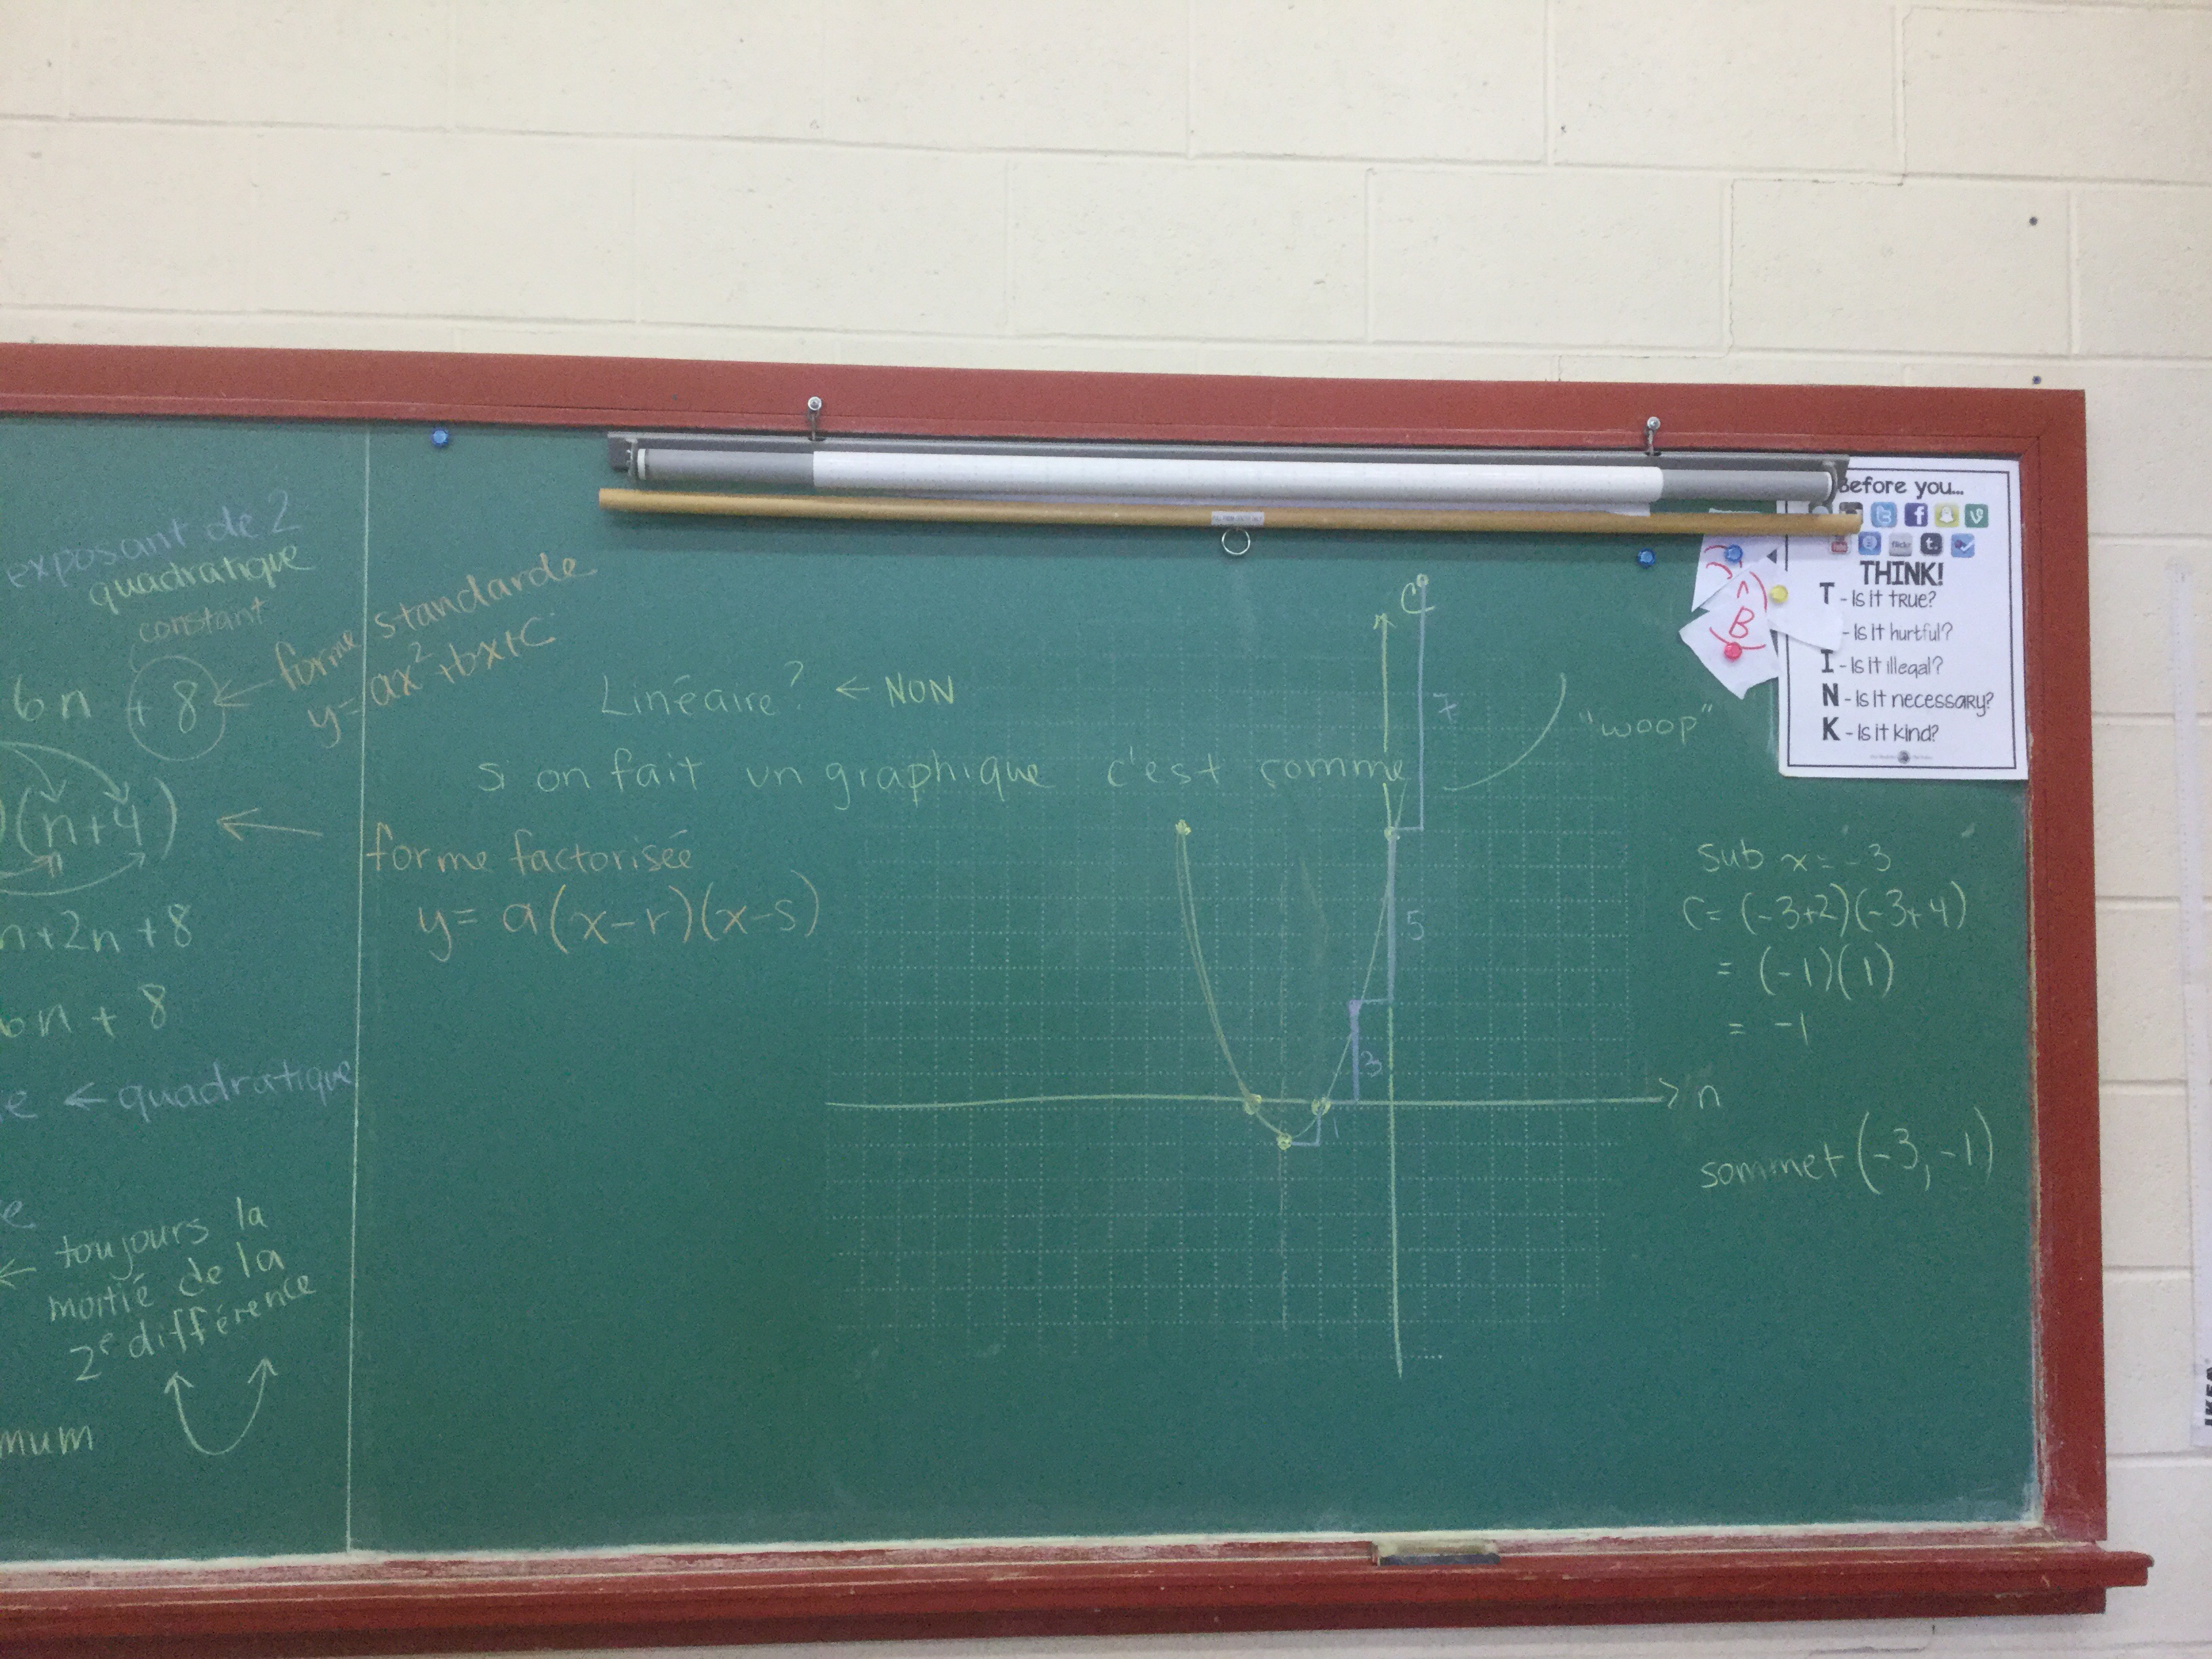
Grade 10s explored patterning and how the patterns connect to the quadratic functions we have been exploring. 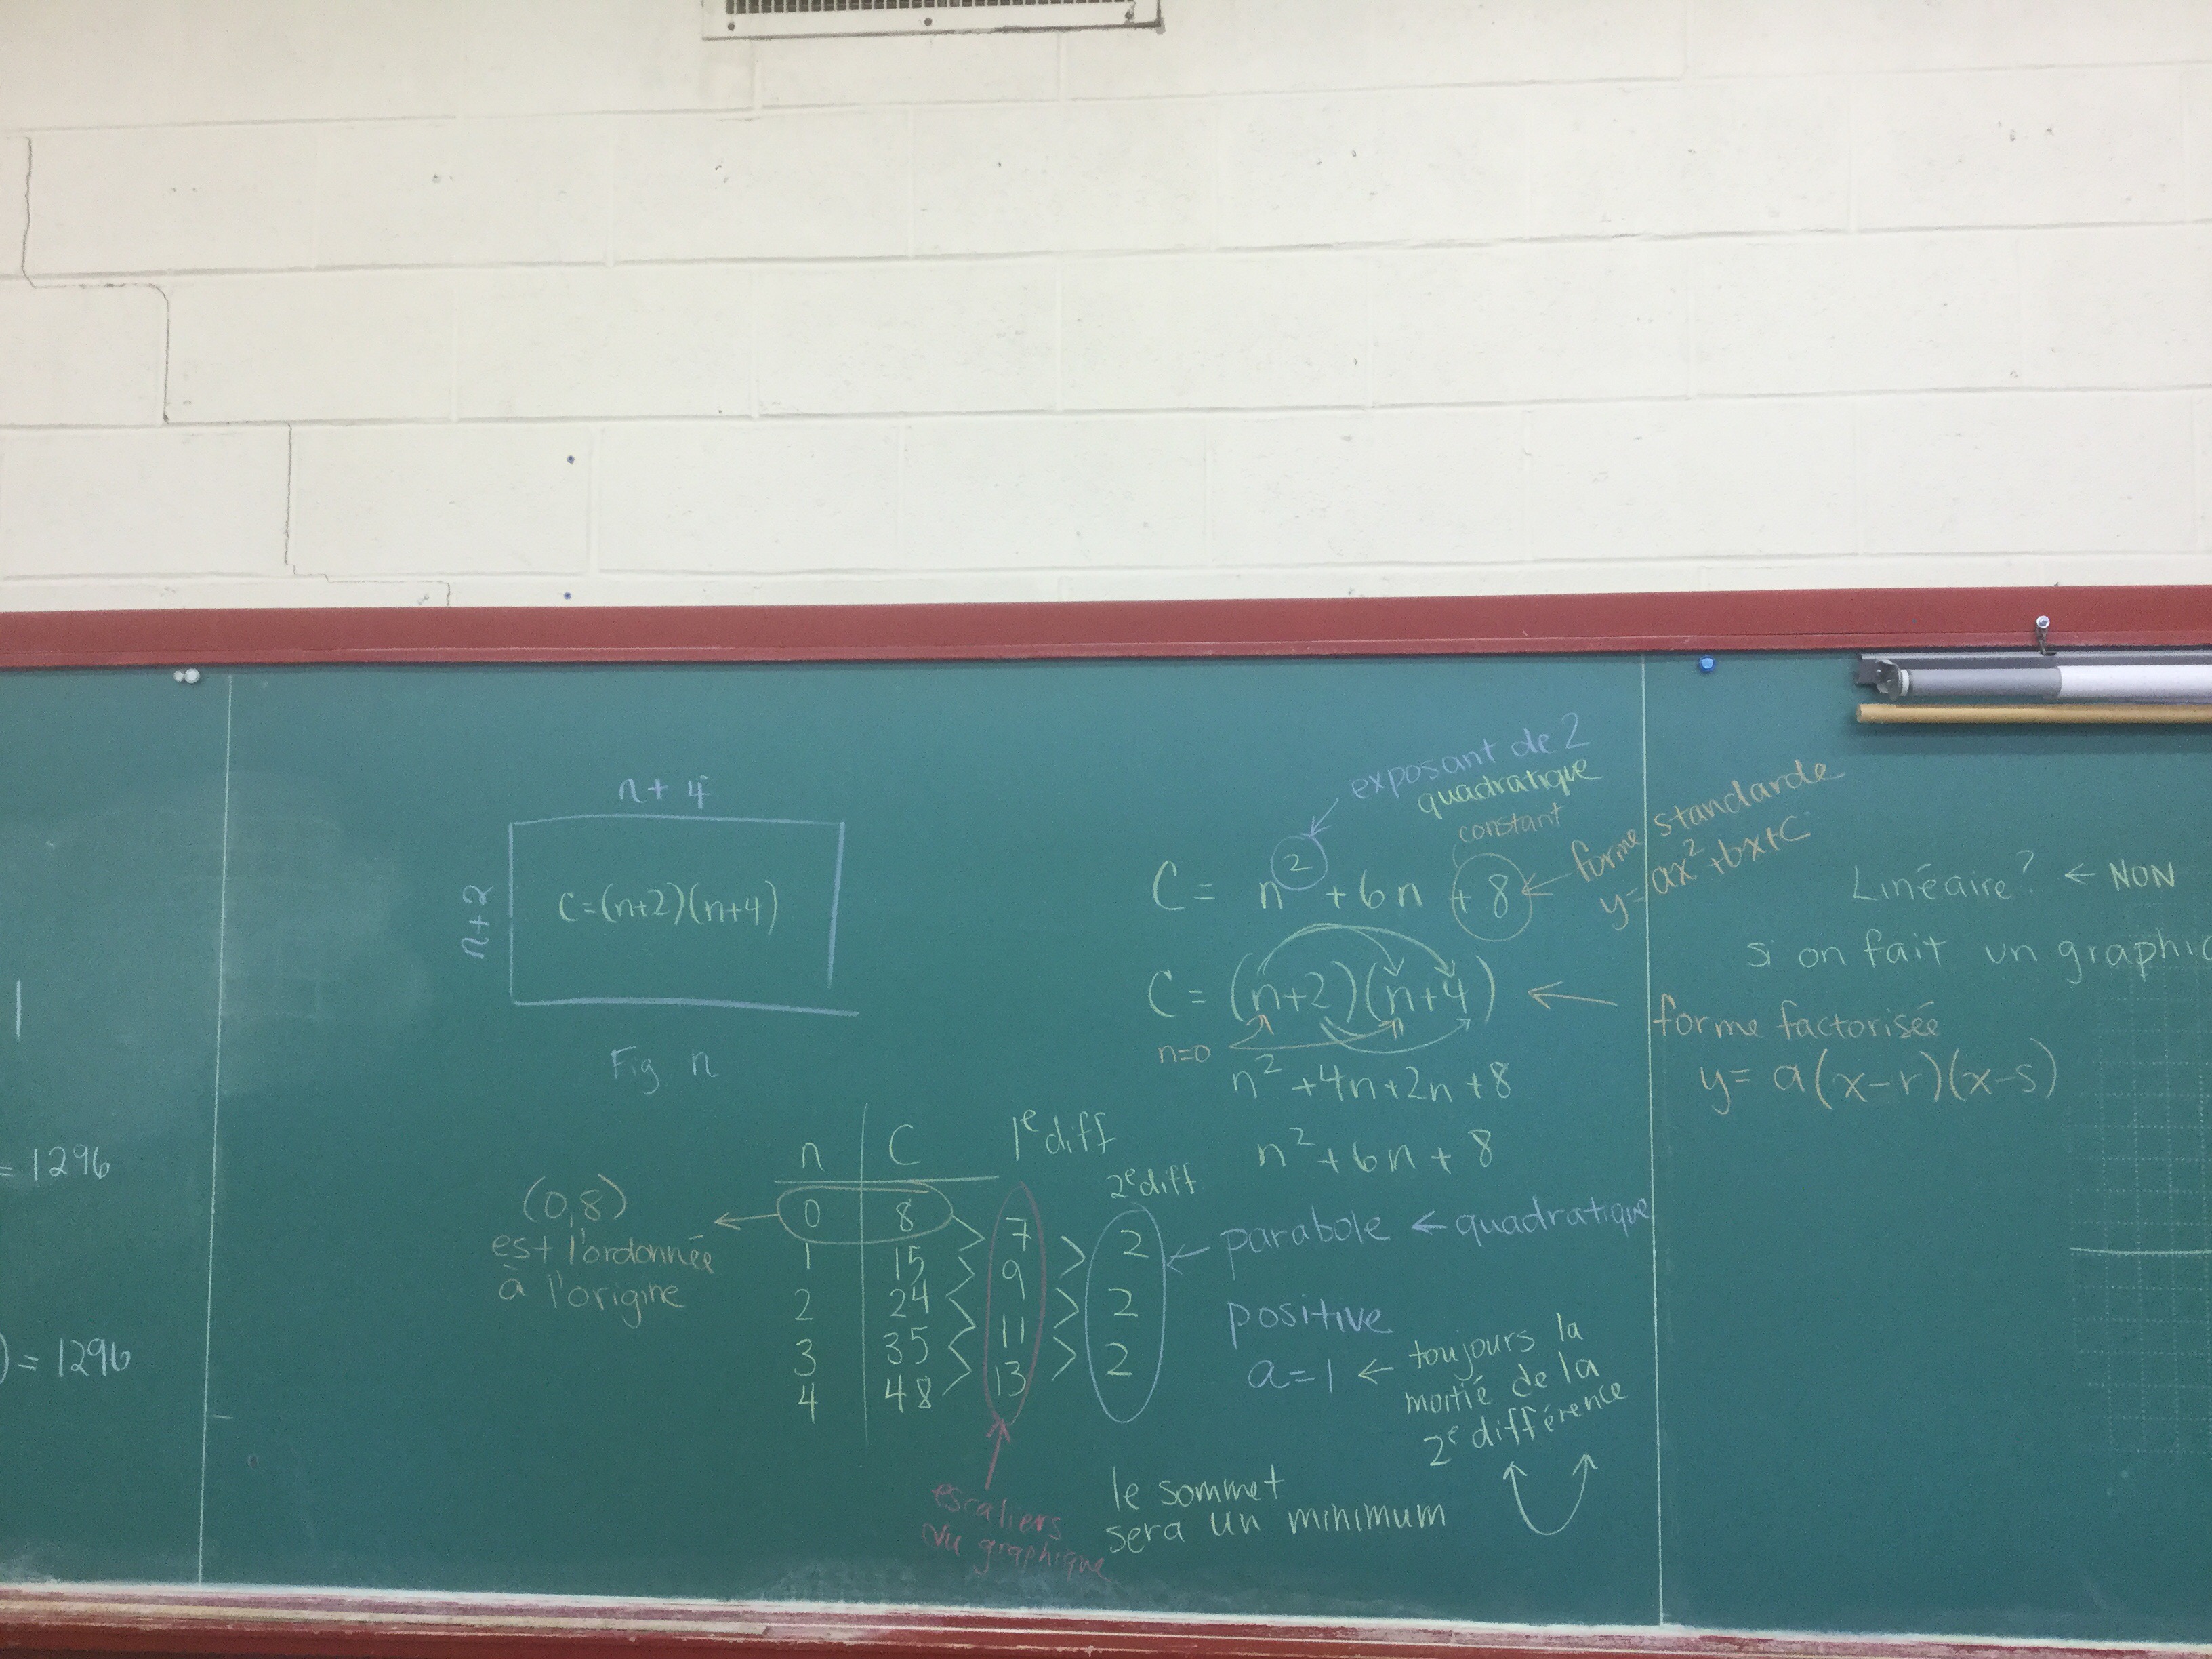
We graphed the pattern, and also represented it in an equation in 2 forms, made a table of values, and looked at the constant and 1st and 2nd differences.
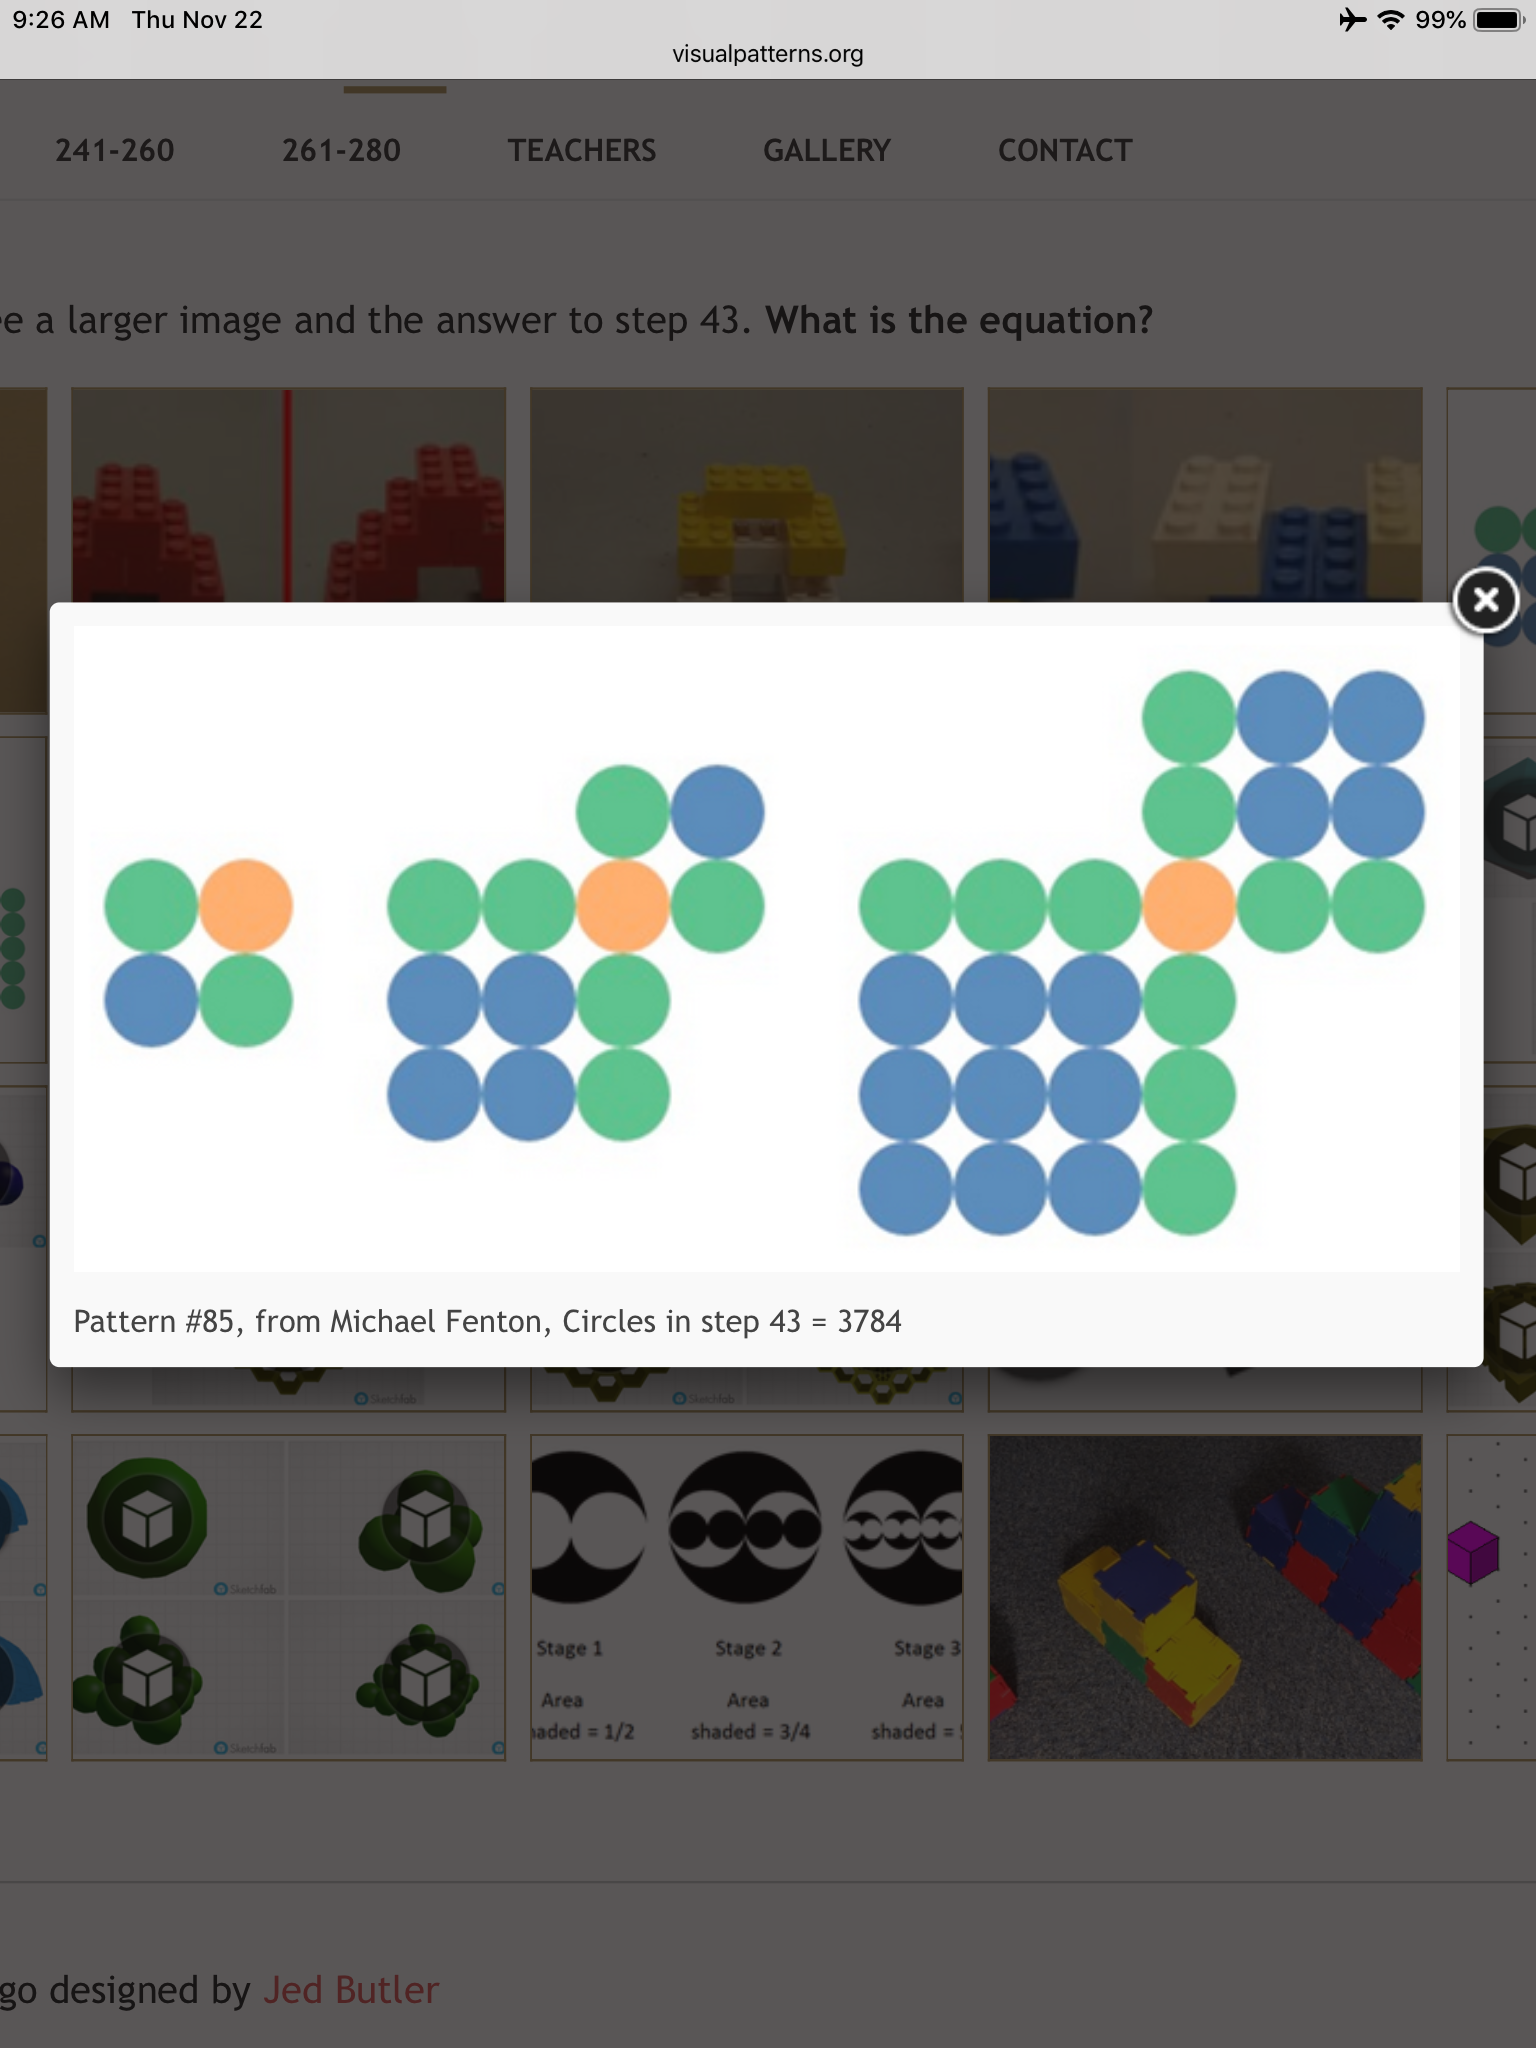
We looked at this visual pattern next and did our best to analyse it graphically.
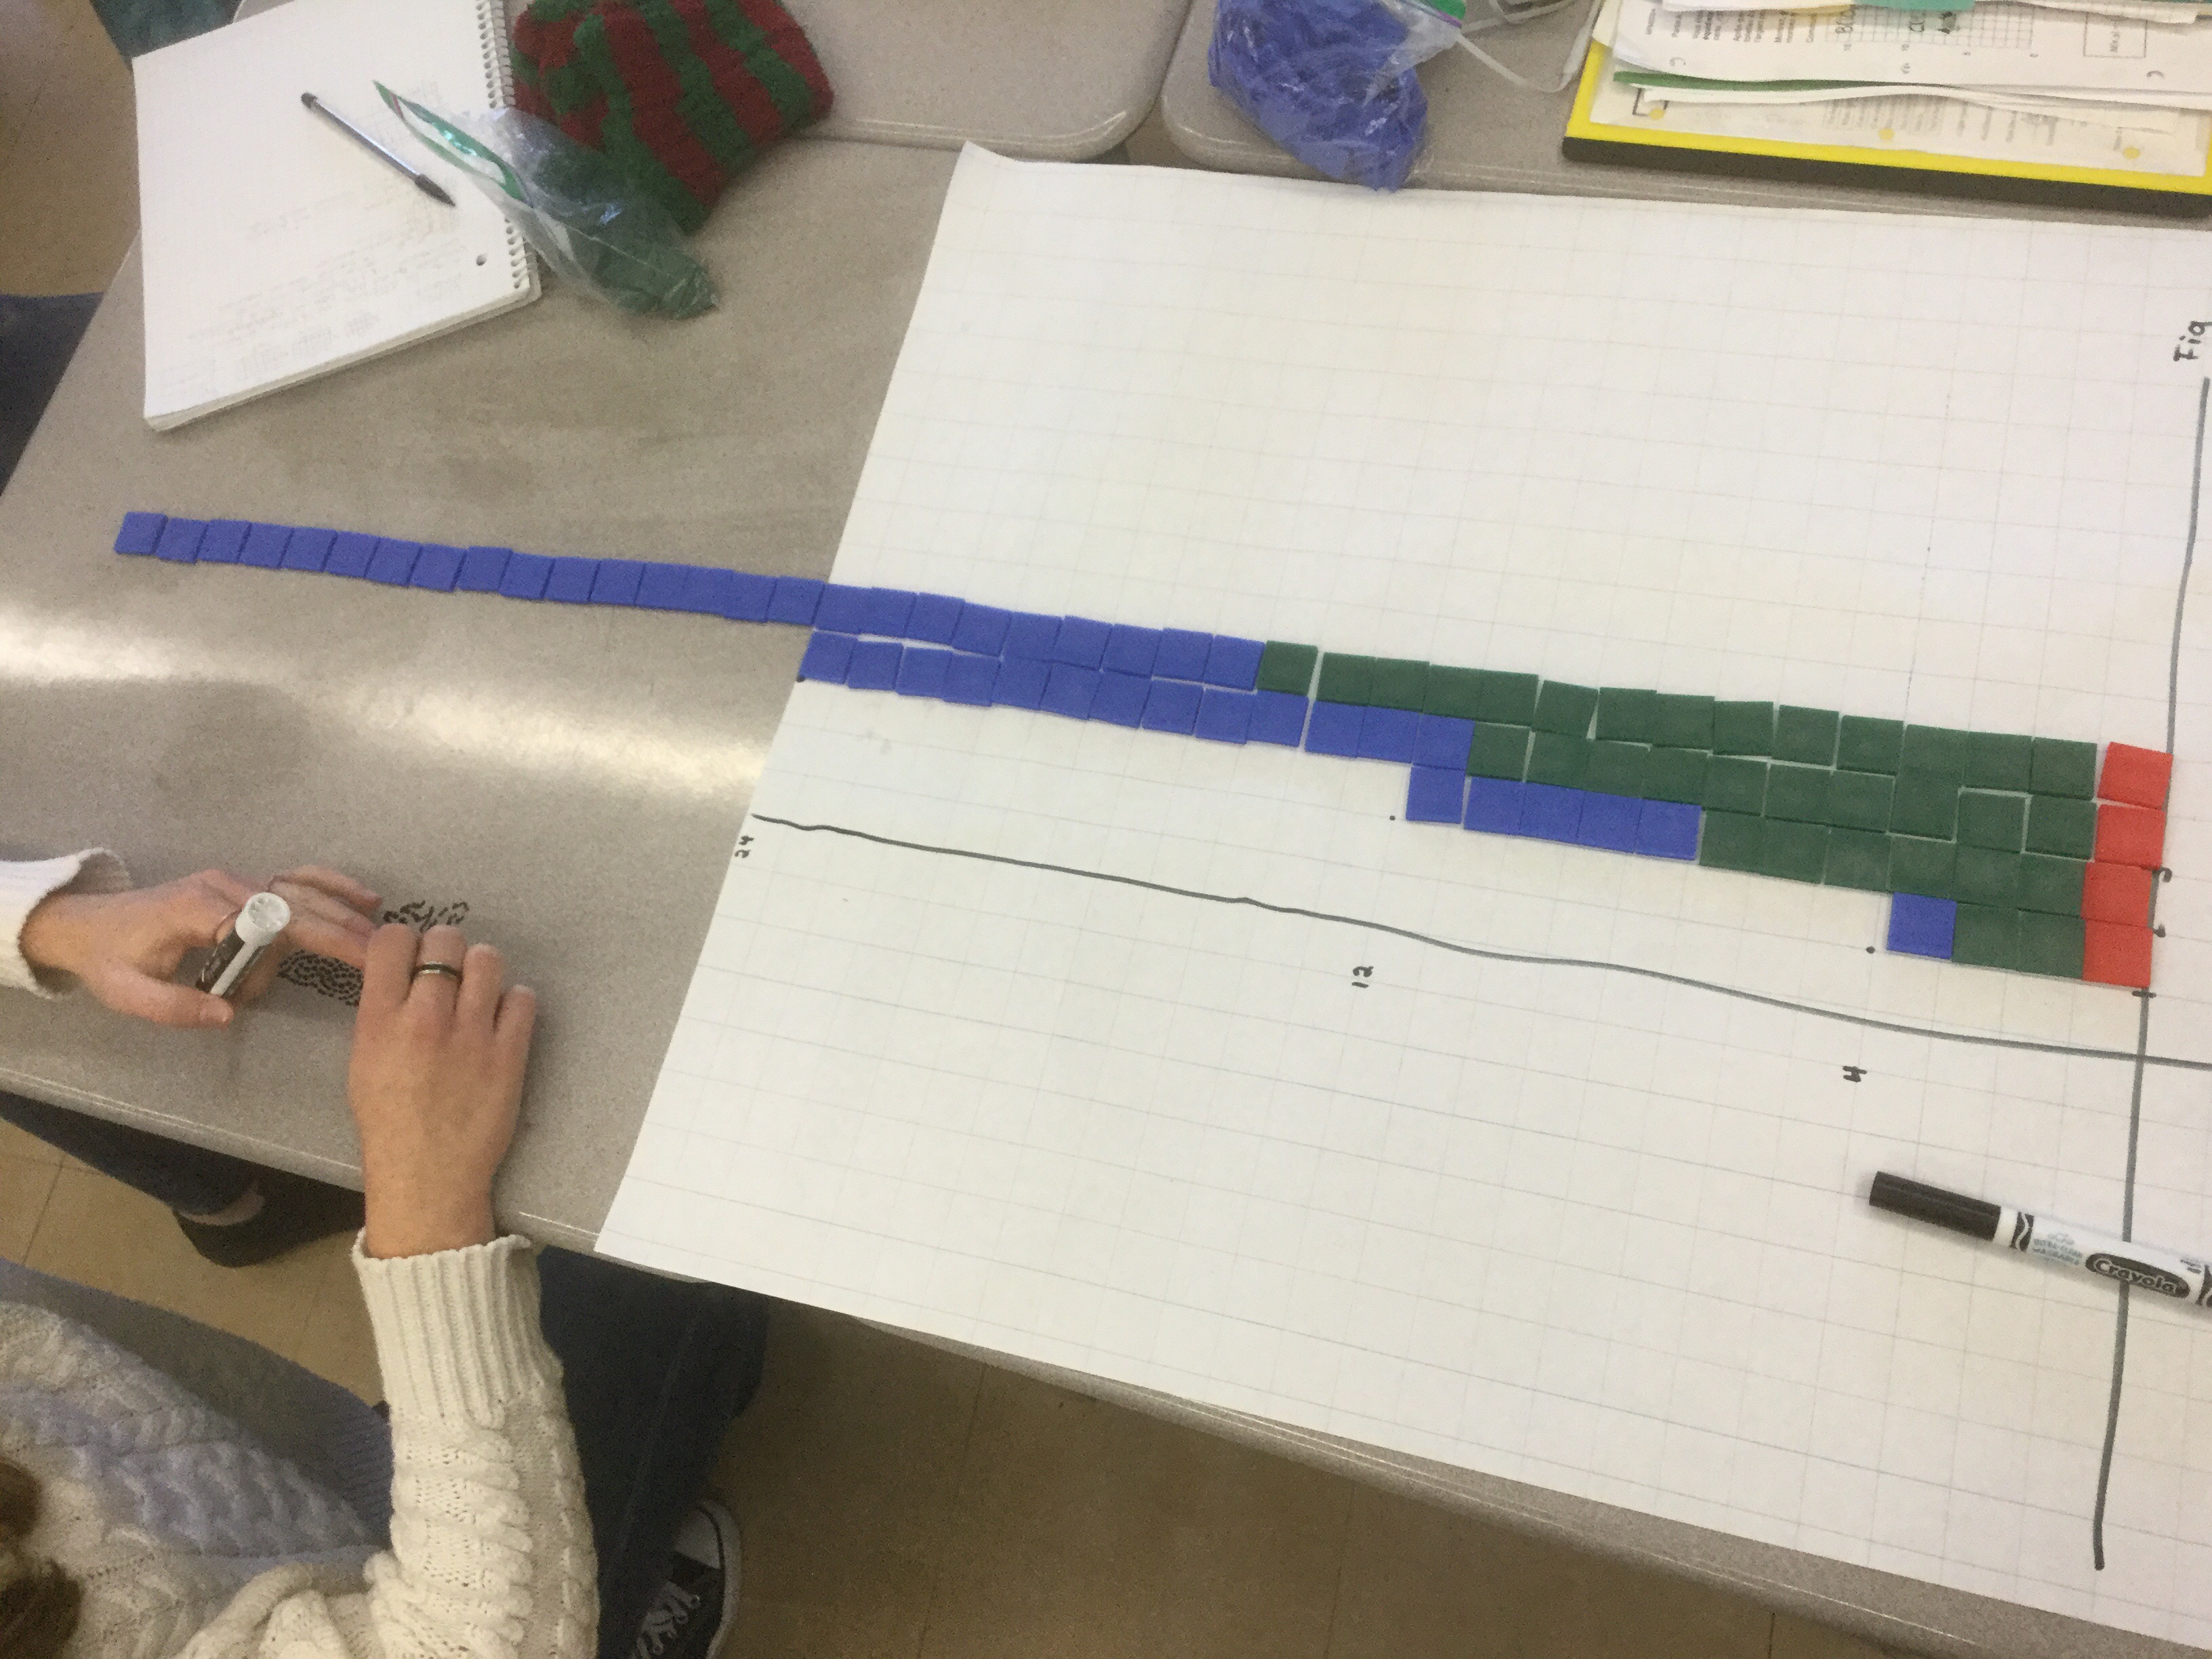
We built the figures

And reassembled each figure into a strip on our graph.
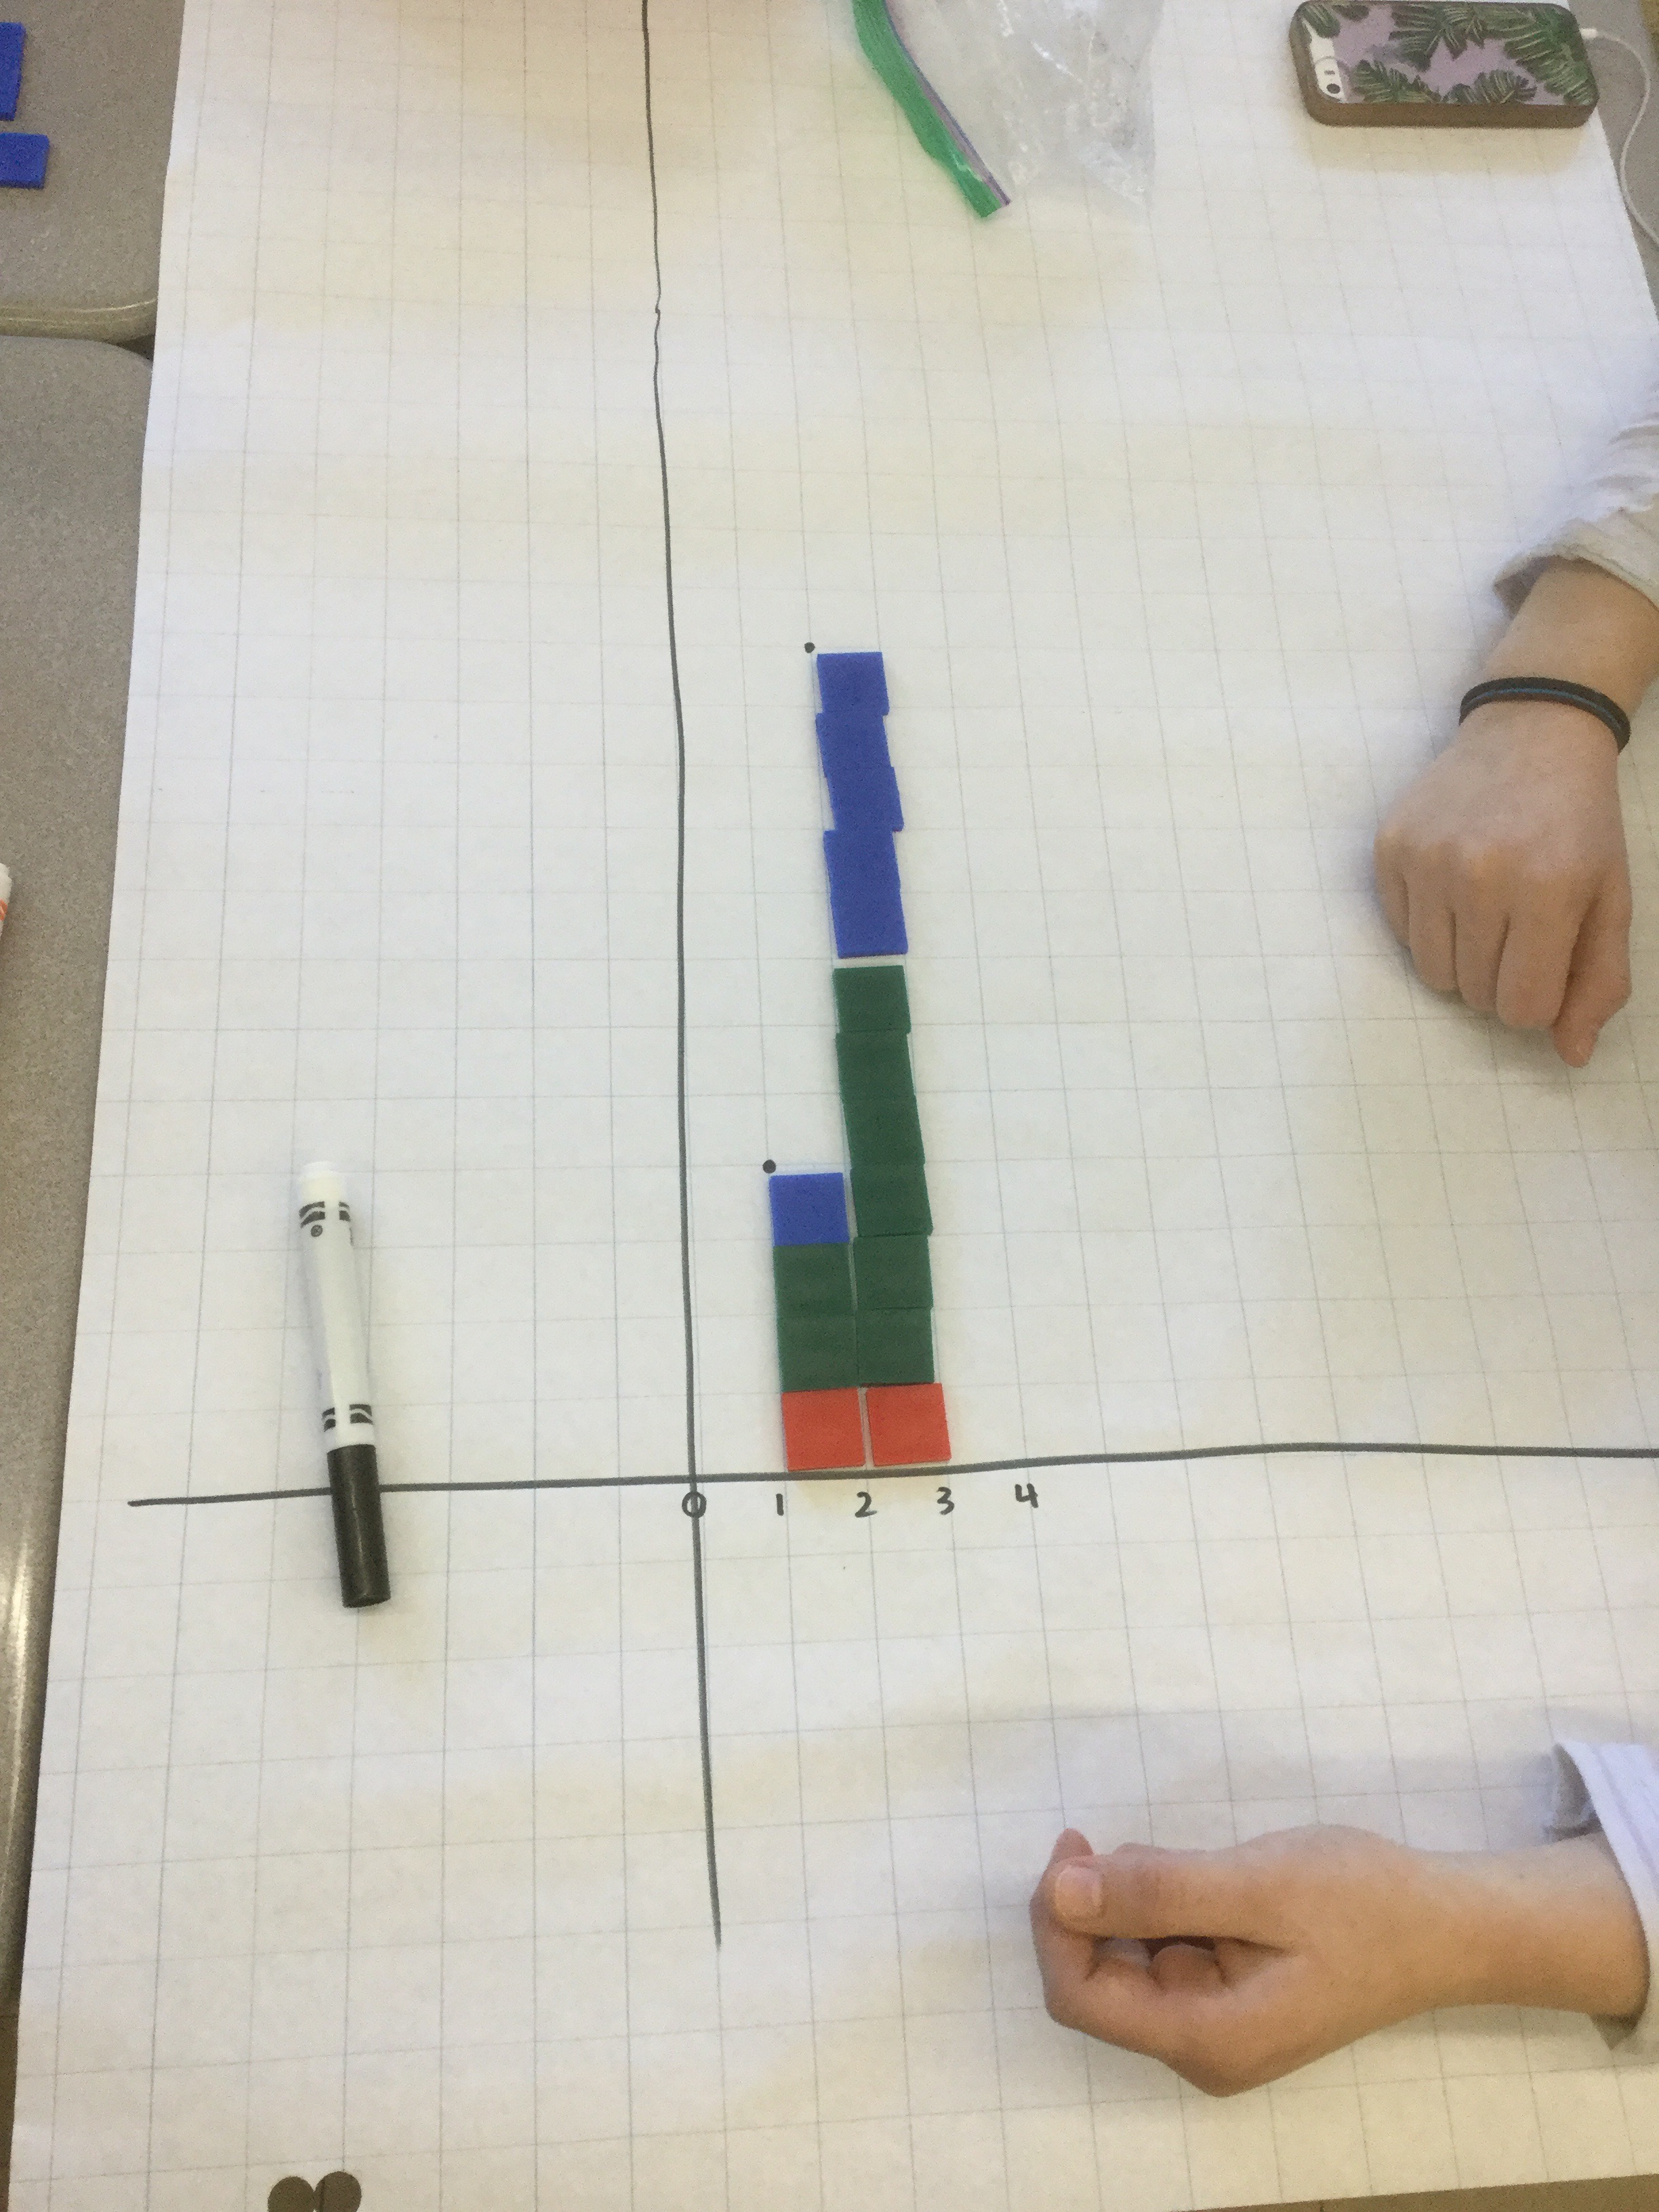
The graph was increasing rapidly, and soon was too big for our page.
We will continue to look at the equations that some of us created, and discuss if there is a constant in the relationship or not.
No comments yet
