Grade 12: modelling
We looked at a pattern from visualpatterns.org and were given the task to take something from the pattern and model it.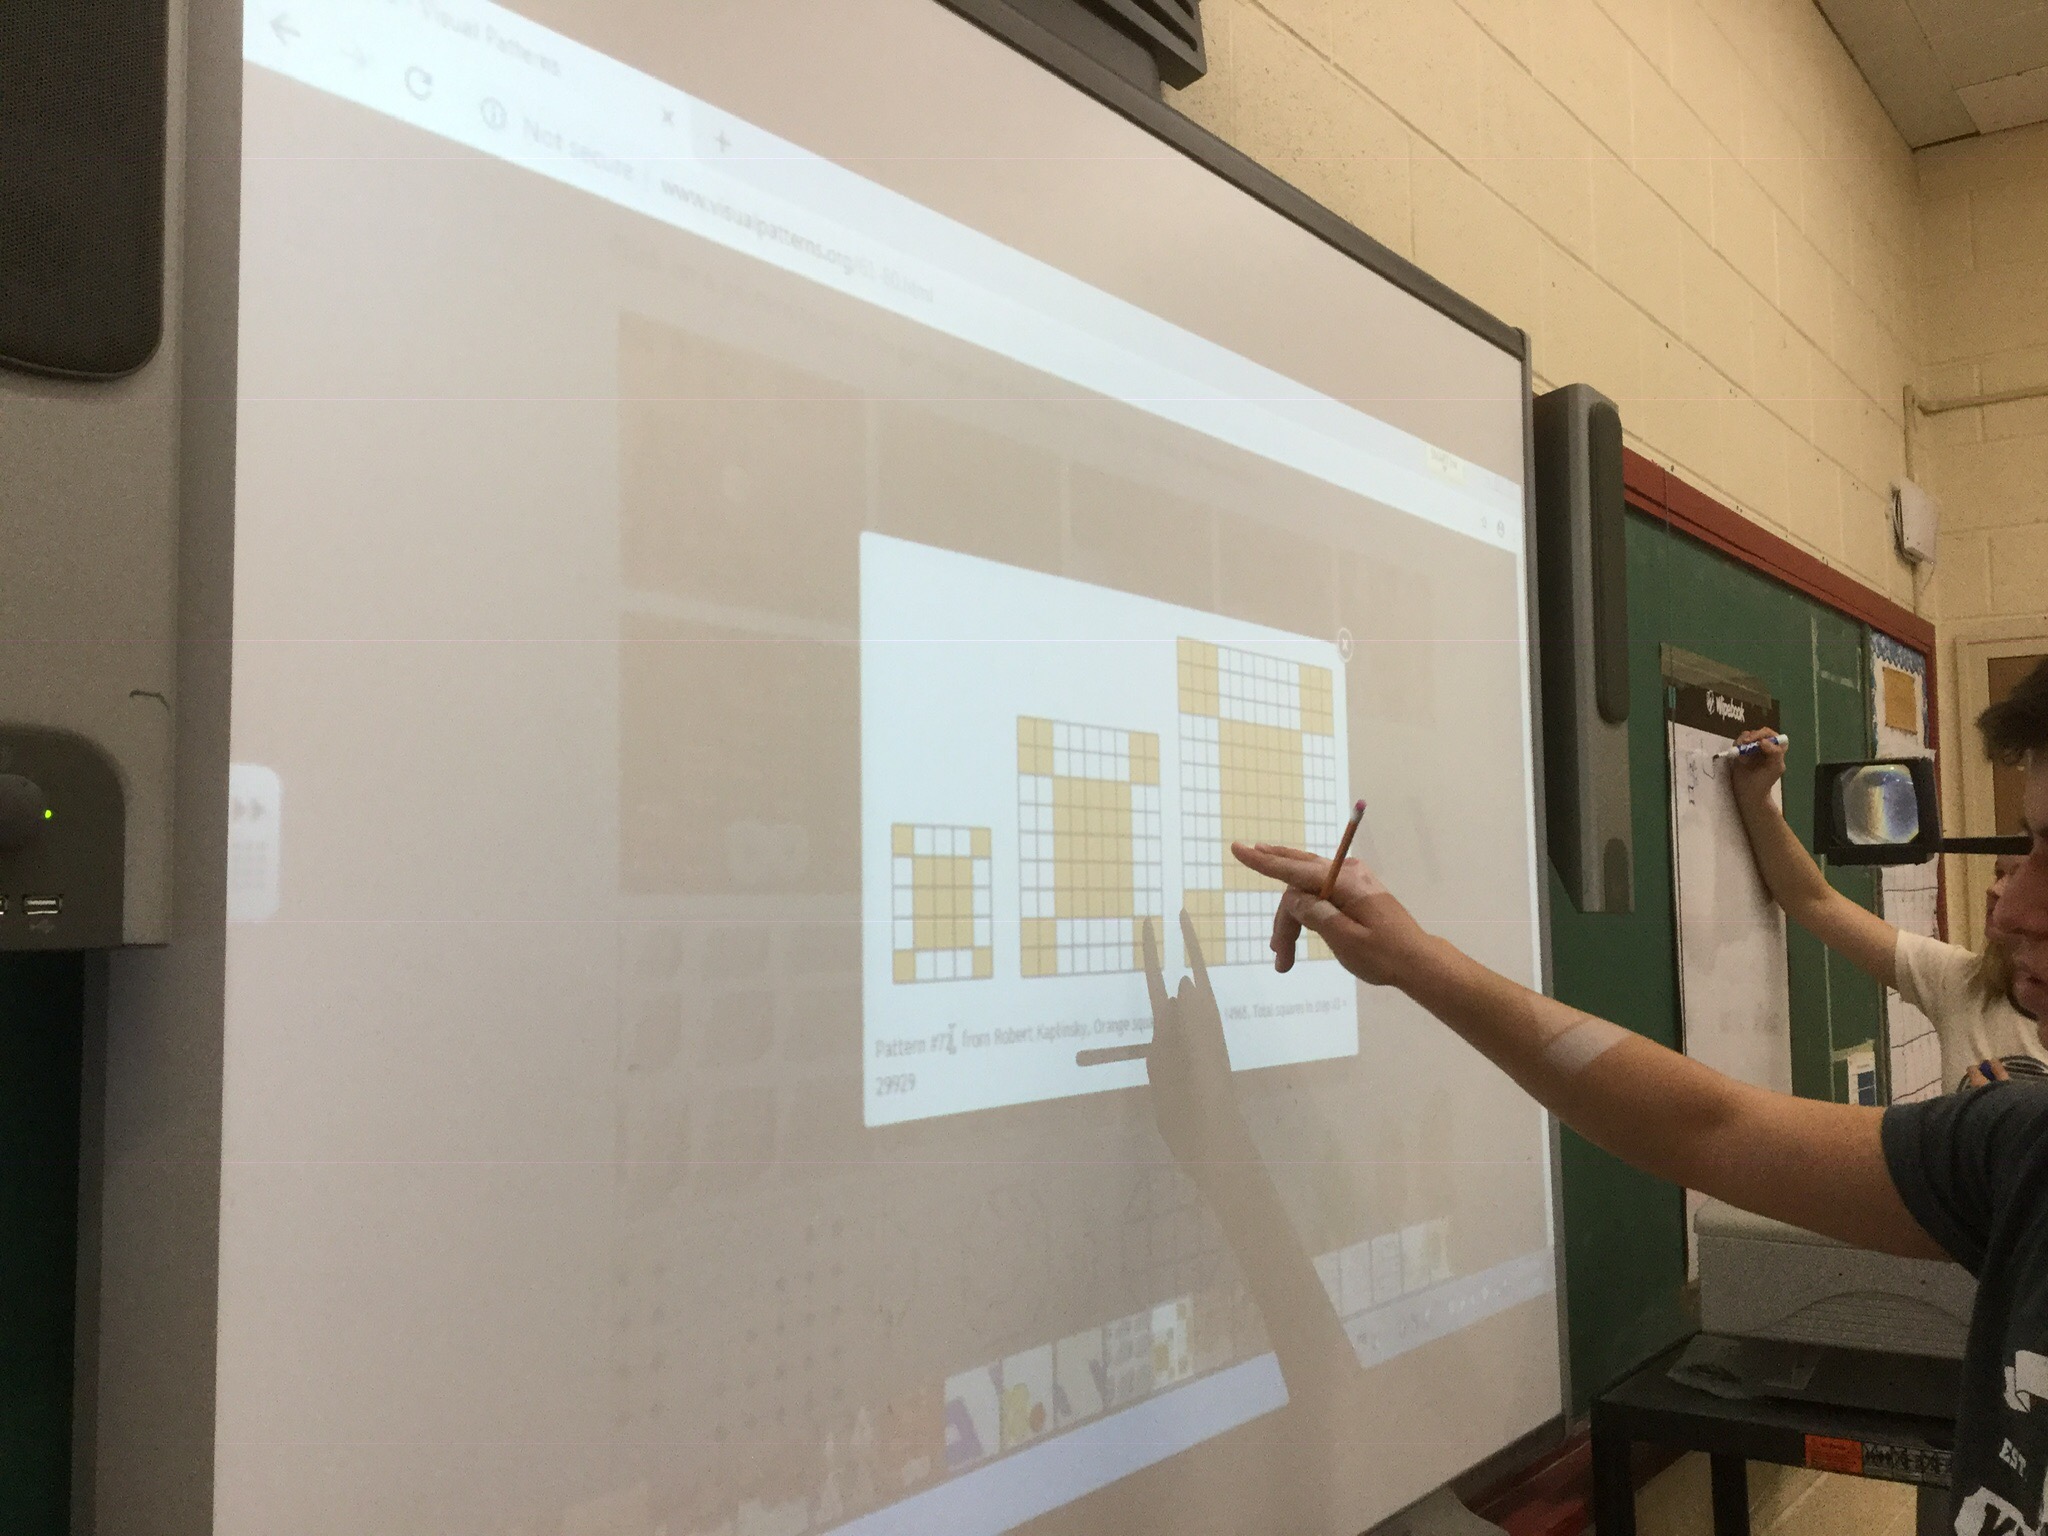
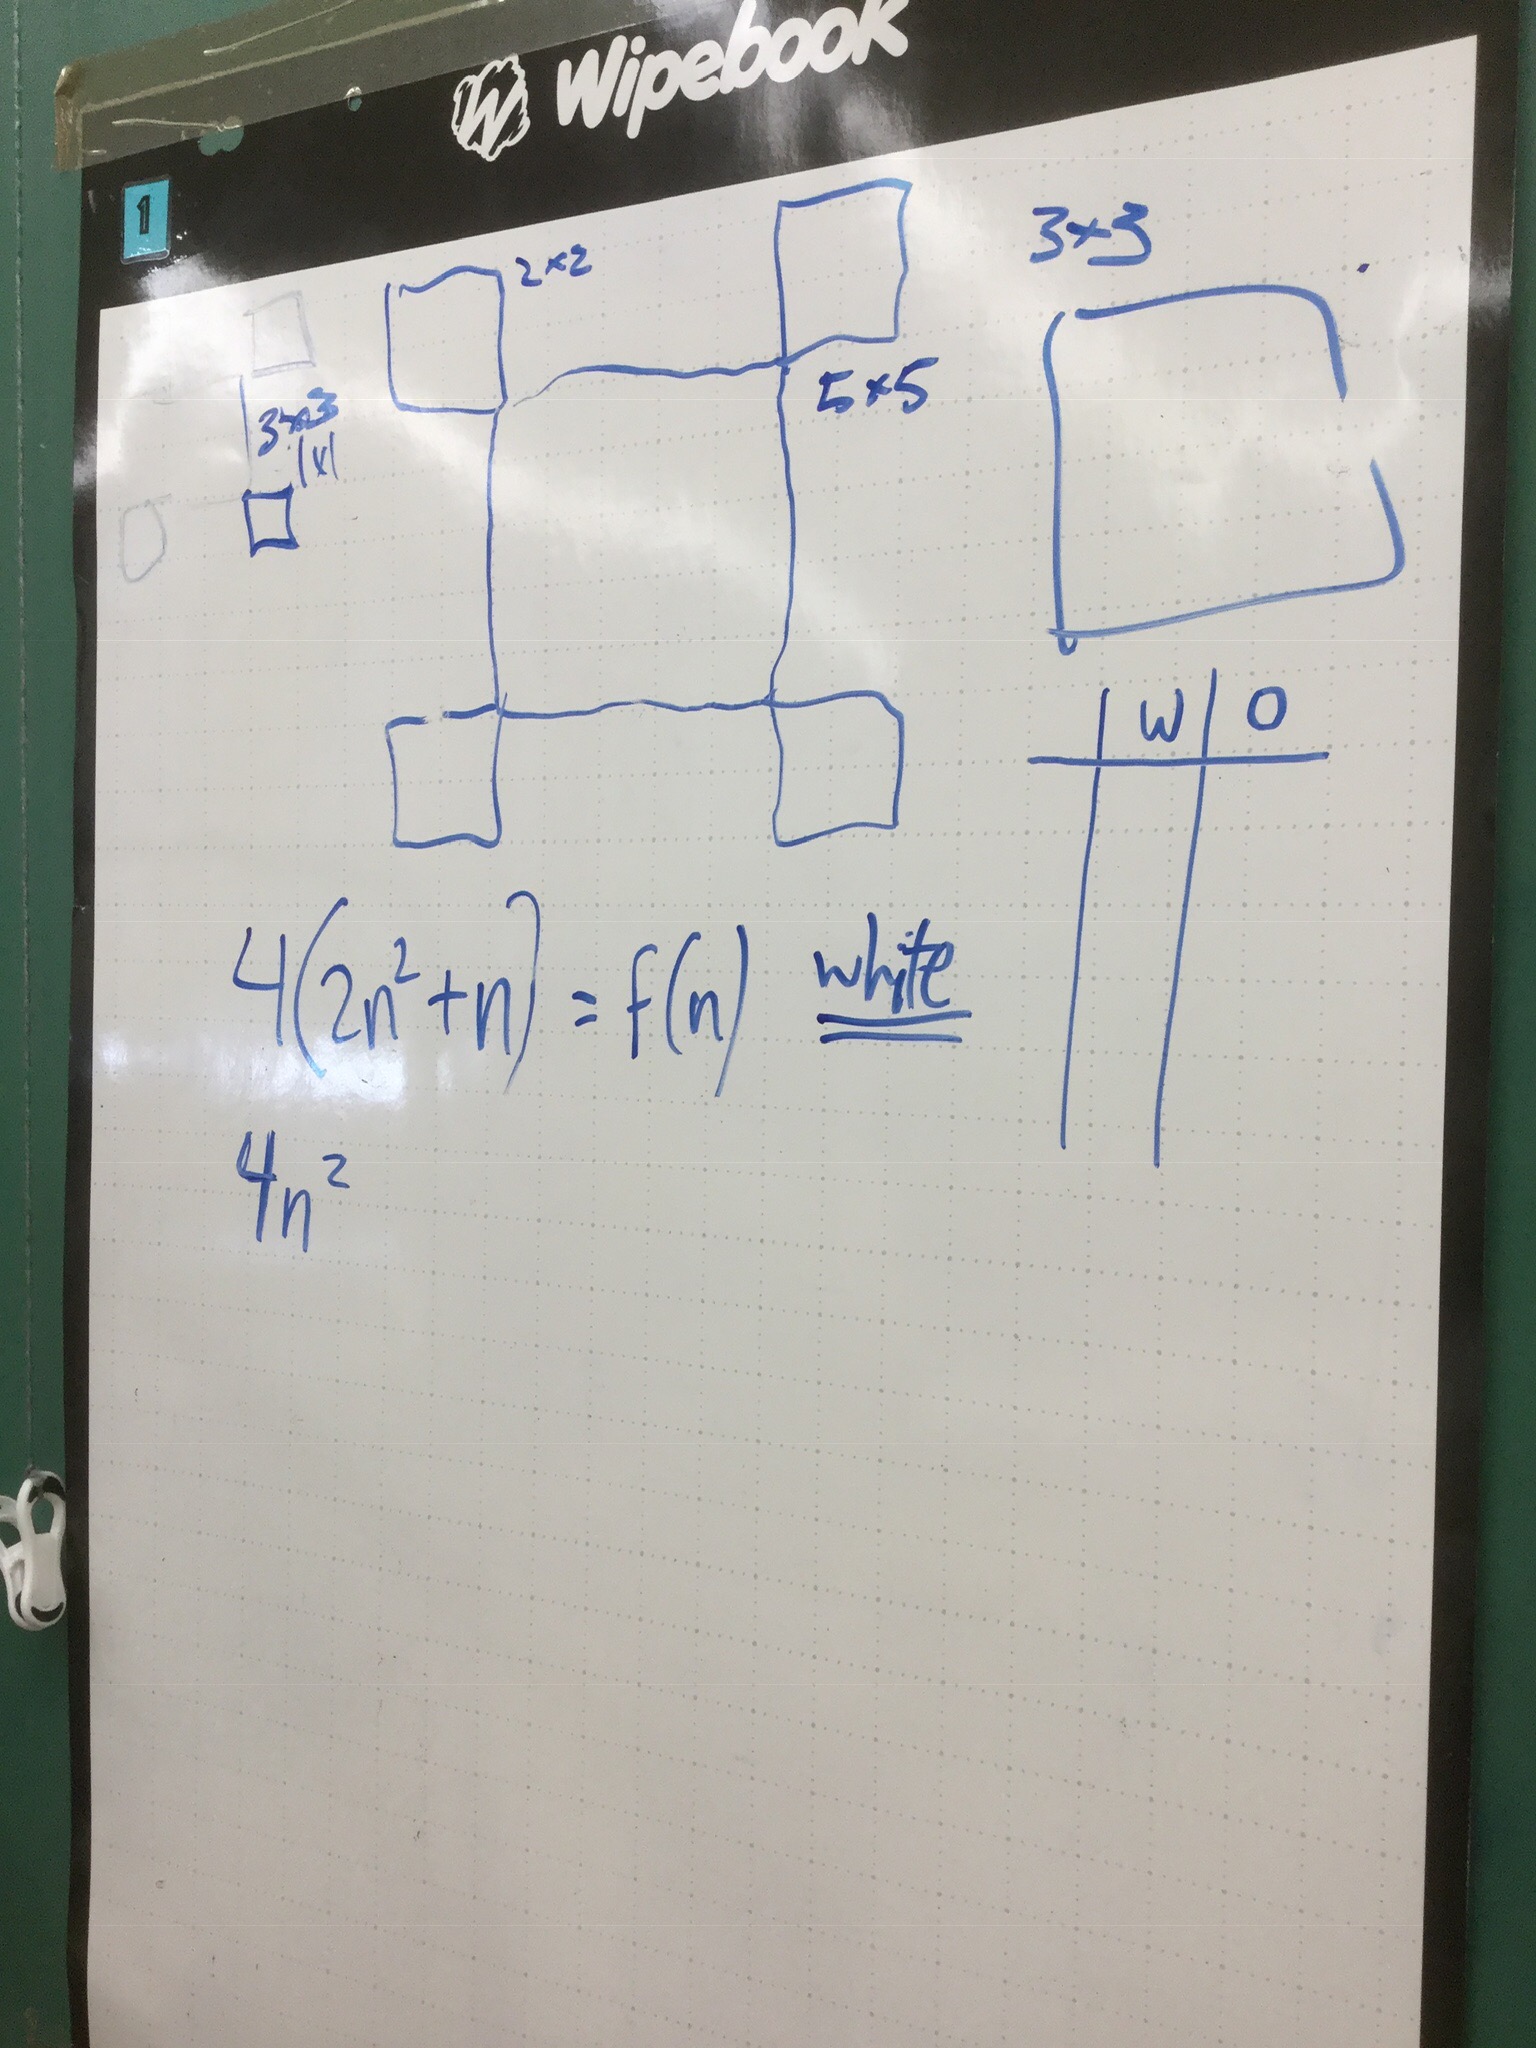
Some groups drew pictures, and used them to make equations (algebraic models)
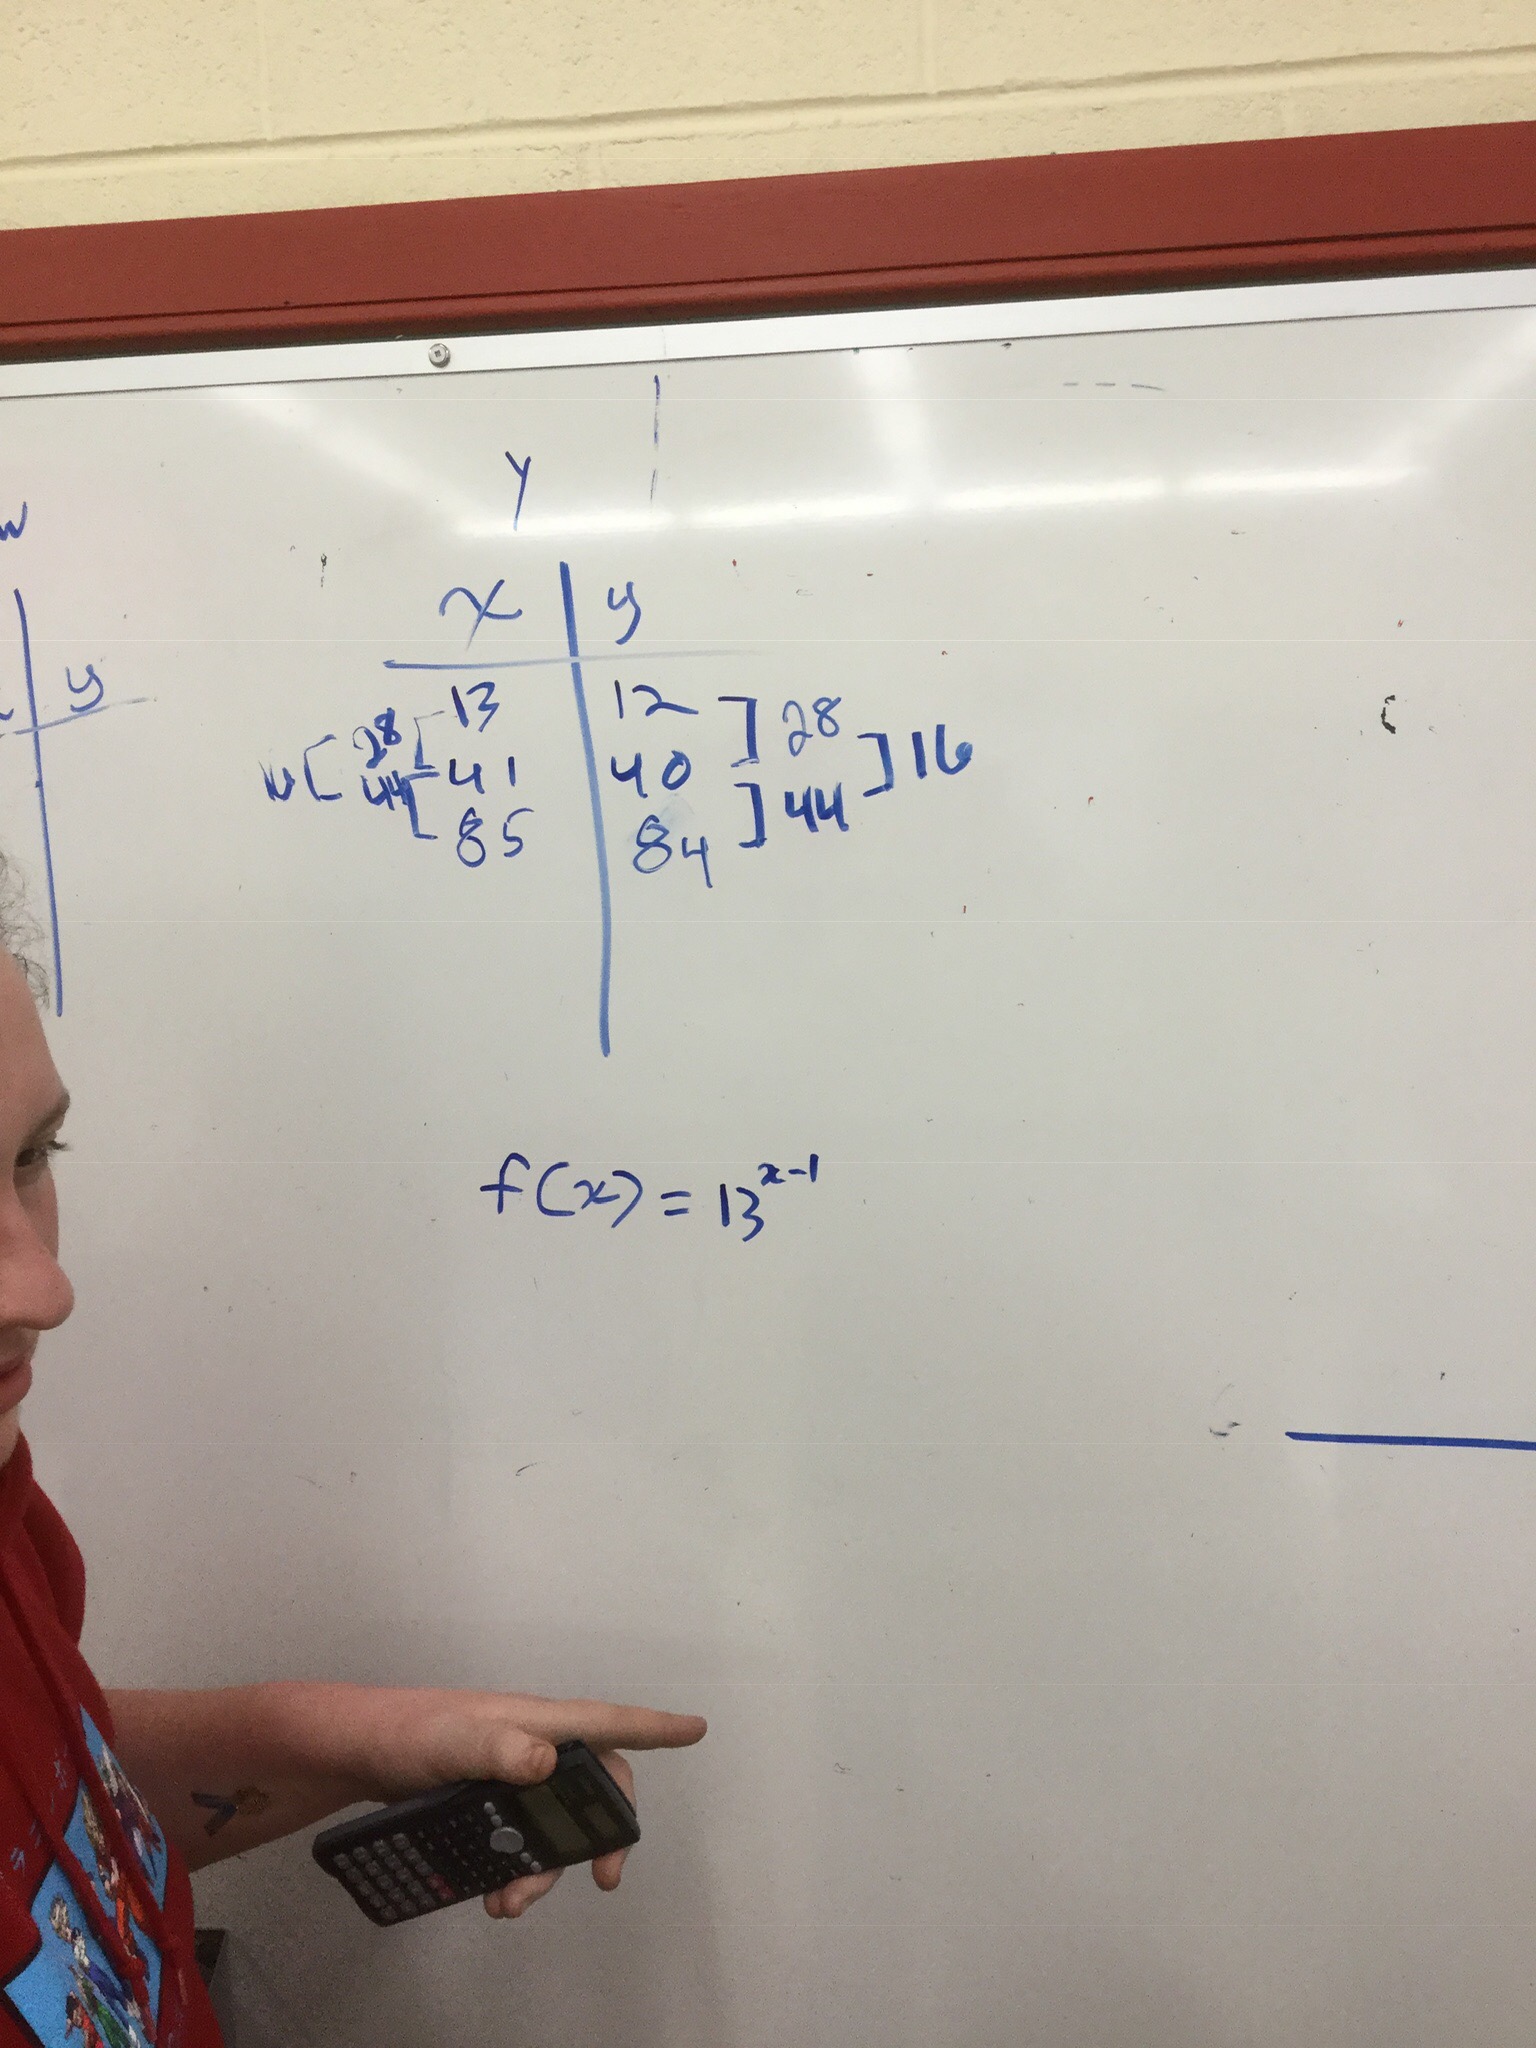
Some groups made tables and looked at the patterns in the numbers. This is a numerical model. We are noticing that the second differences are constant, so that tells us it is a quadratic that we are dealing with.
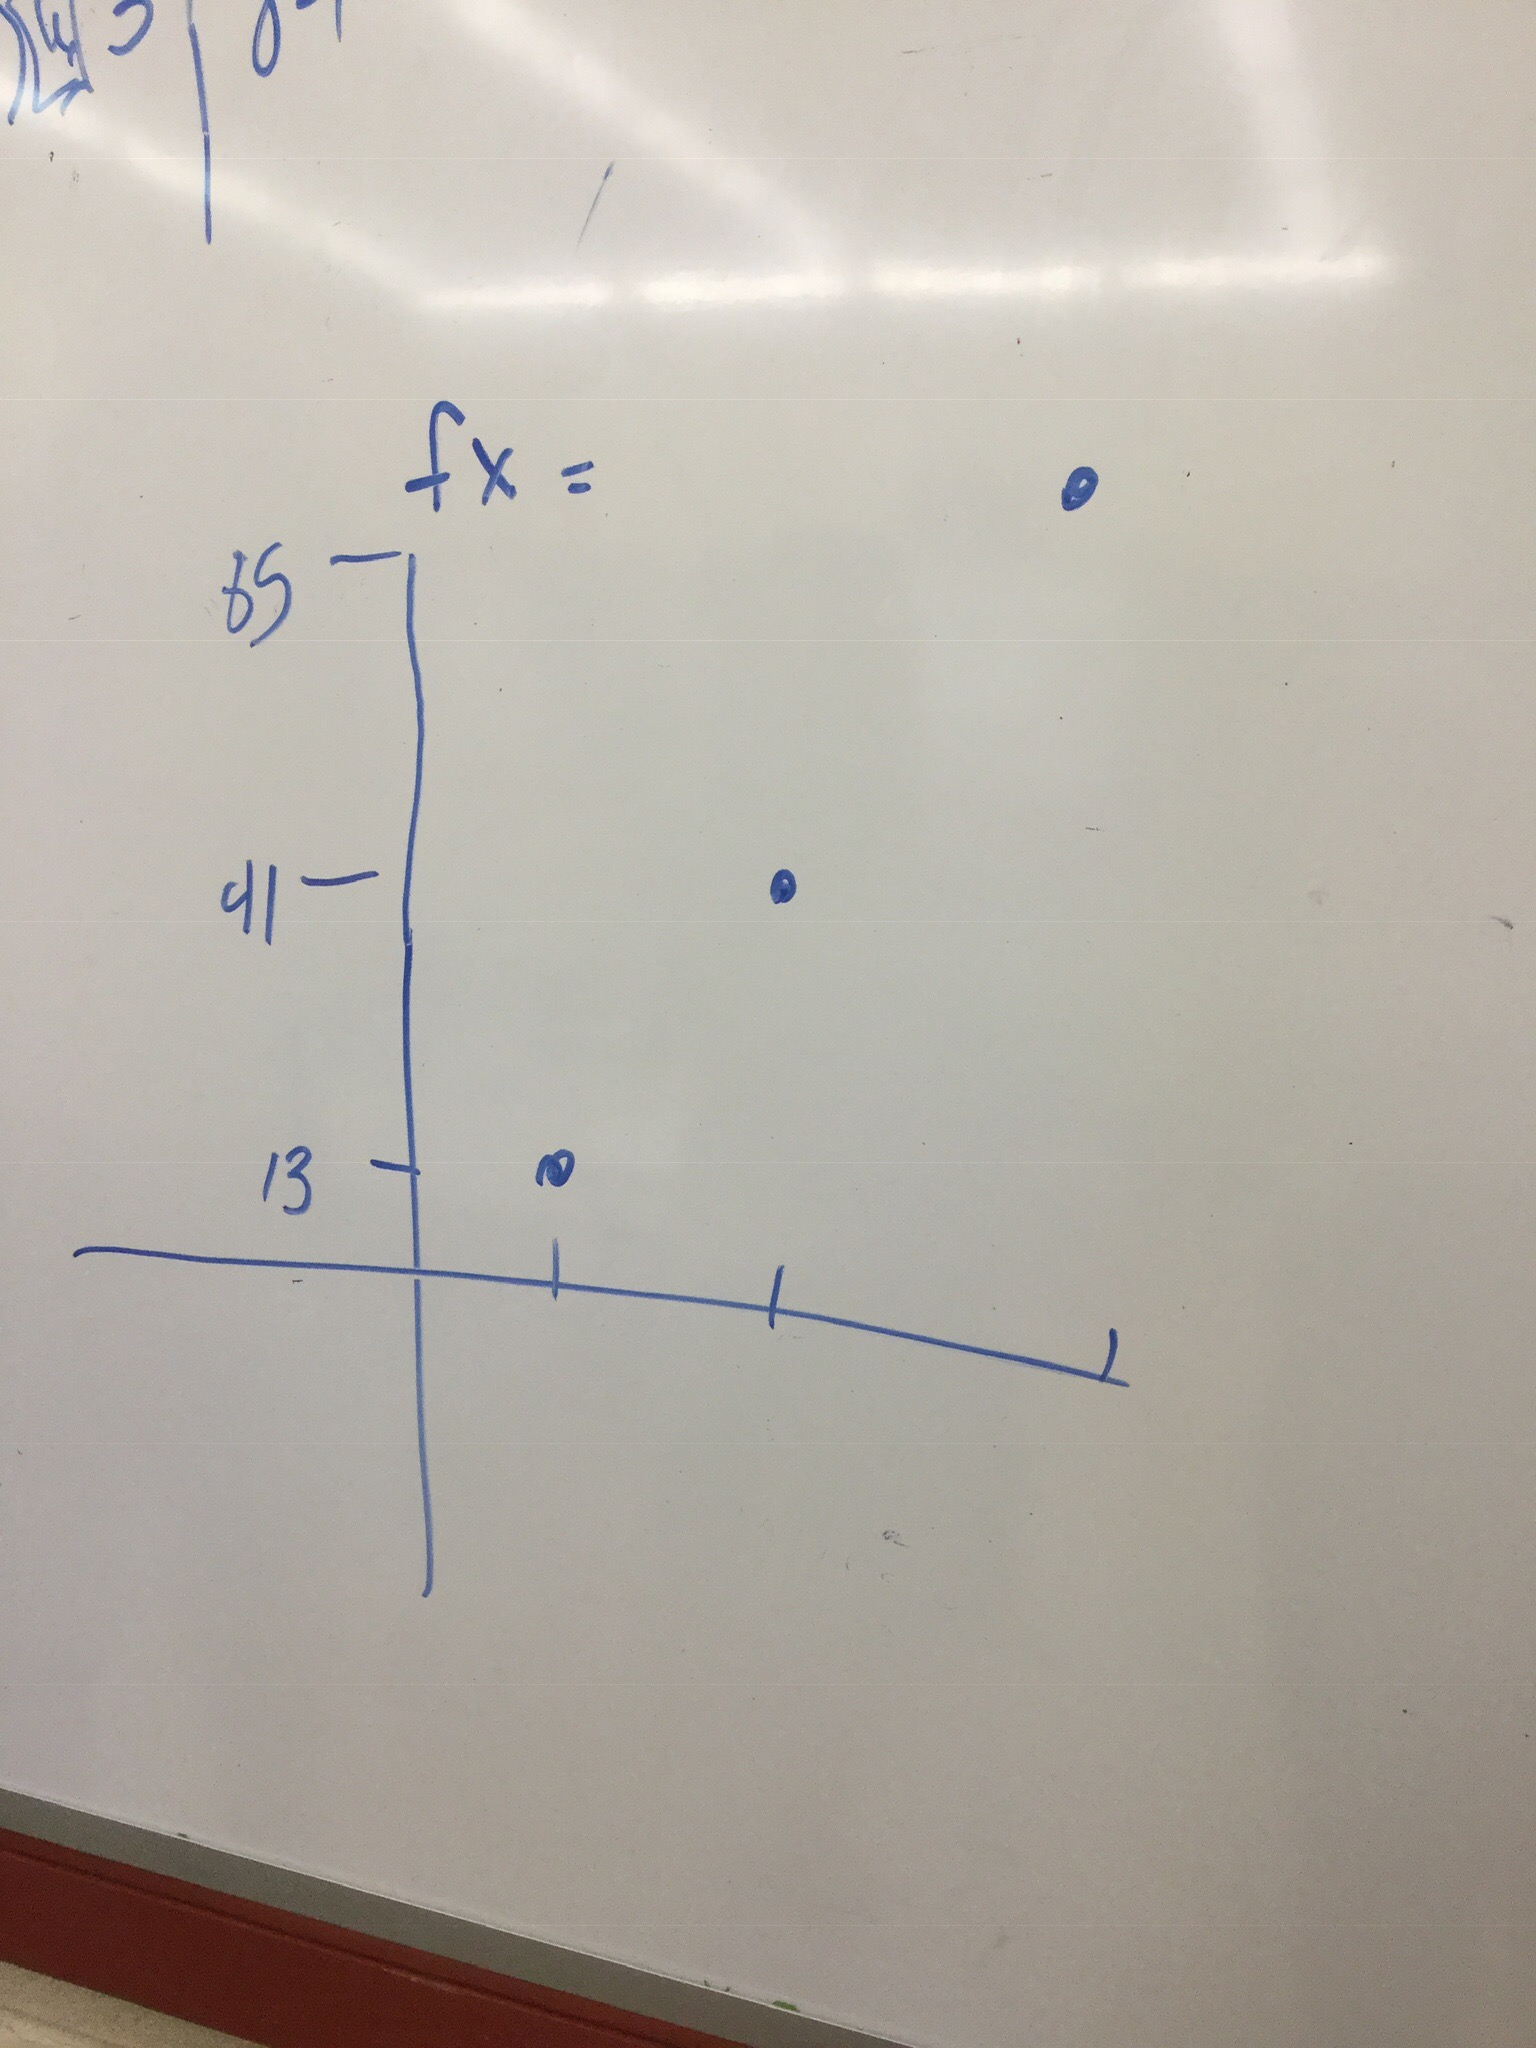
Groups started using graphical models as well.
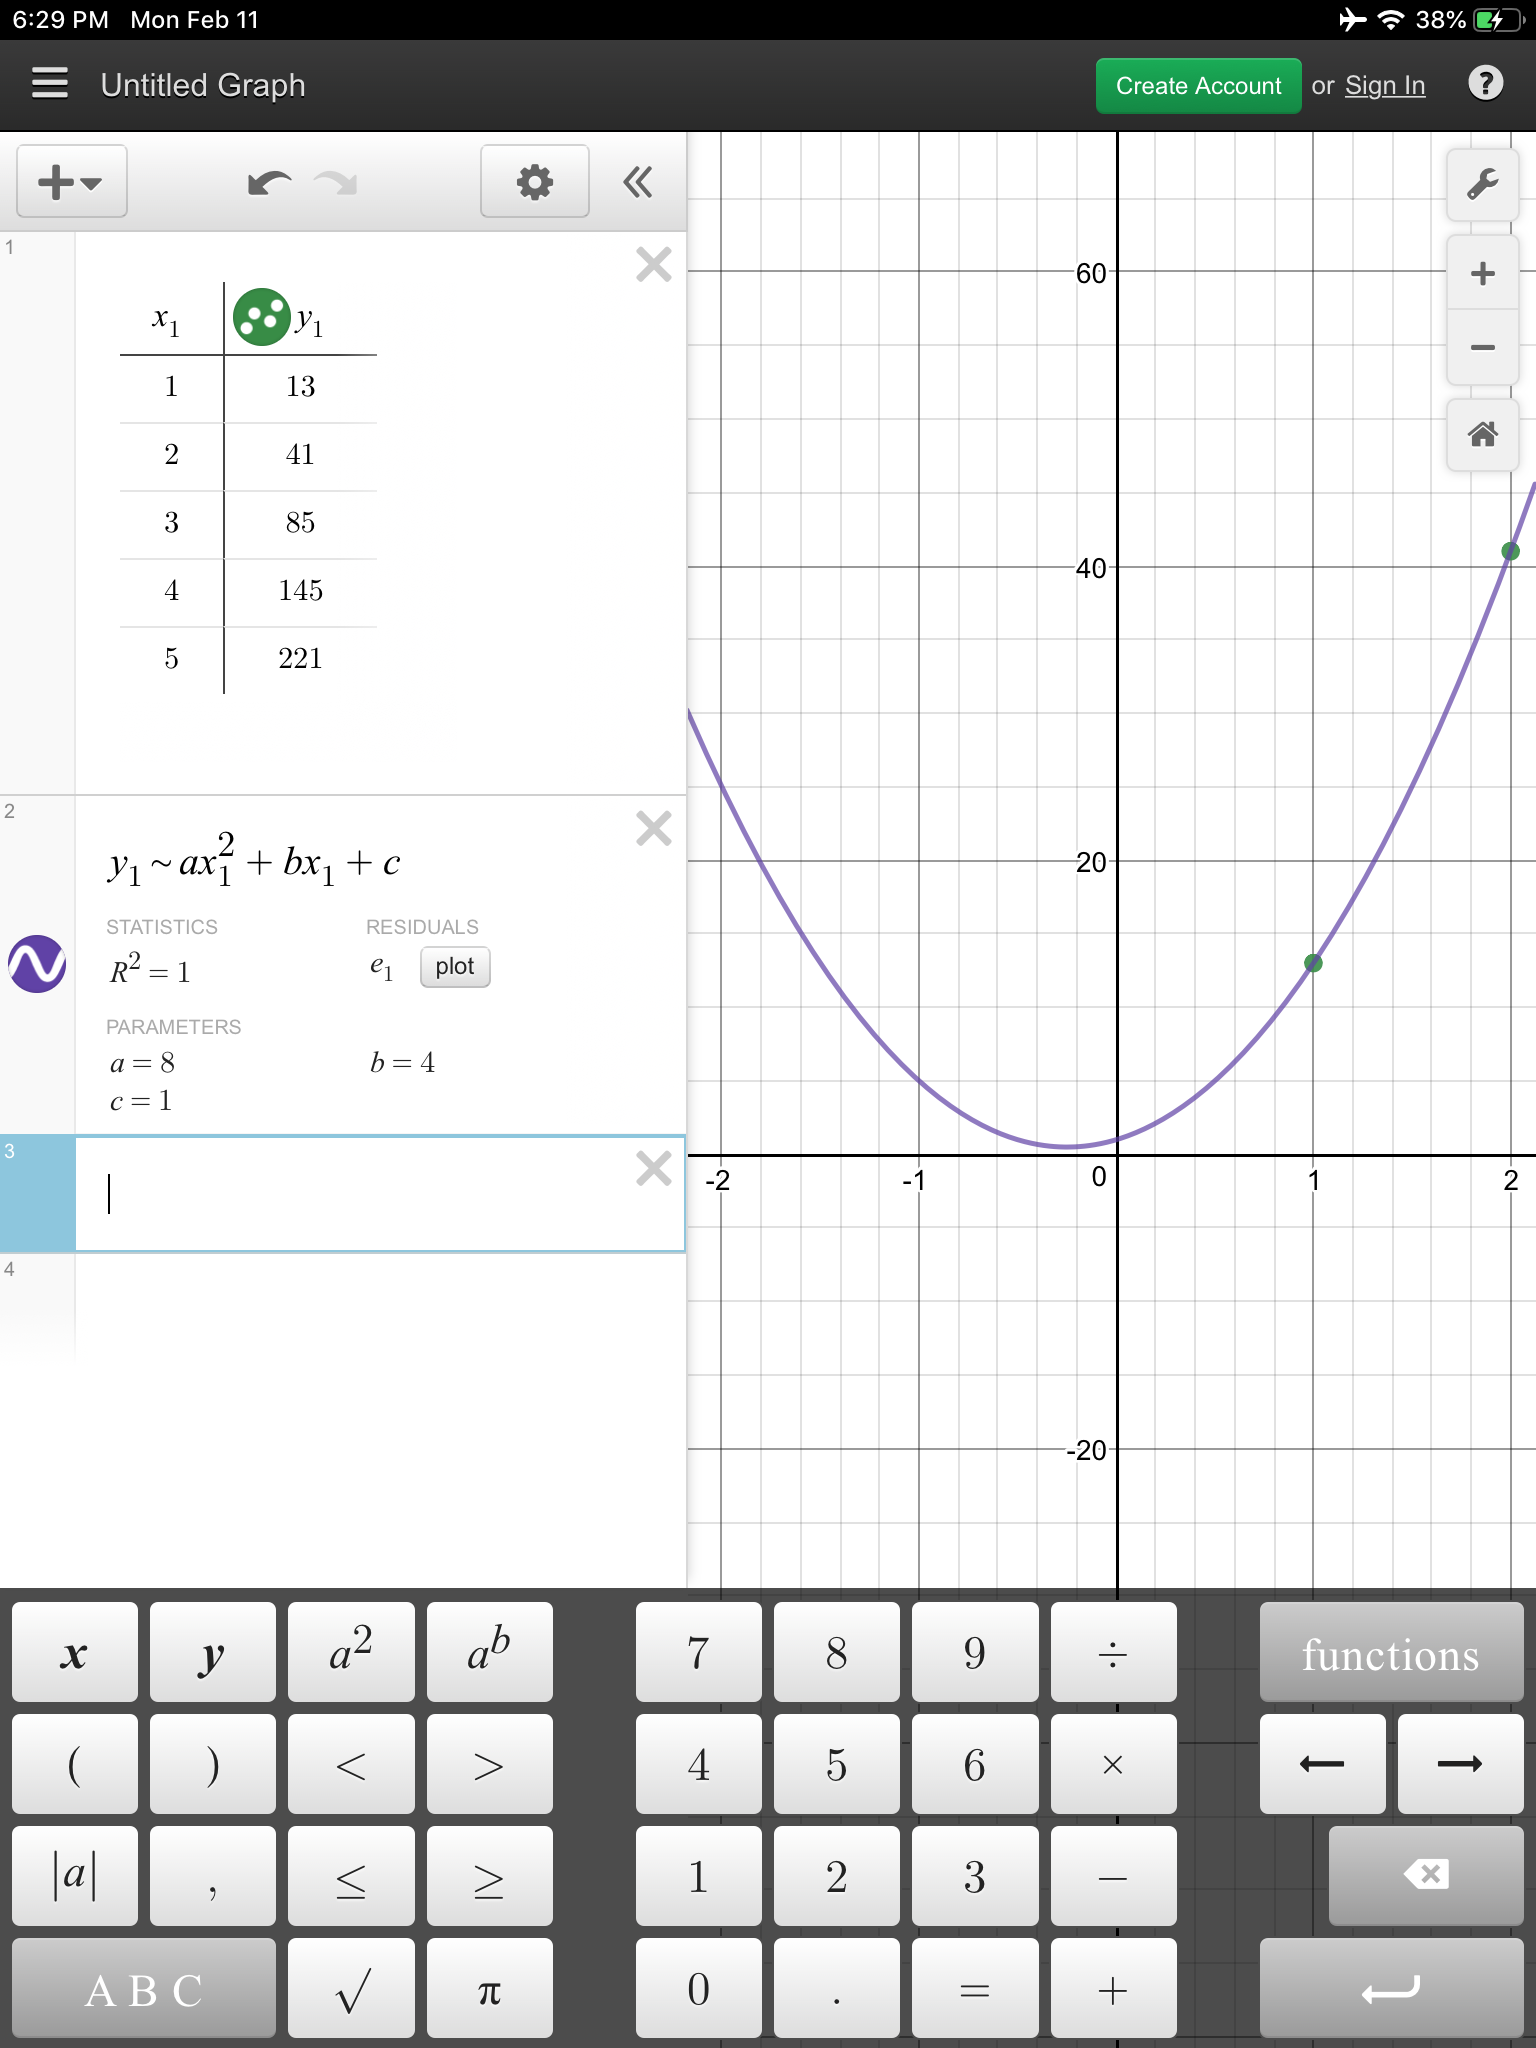
We looked at making a table on desmos and using regression to get an equation. We also explored what the vertex form would look like f(x)=8(x+0.25)^2+0.5, since the vertex is (-0.25,0.5).
We talked a bit about the definitions of functions, and how they pass a vertical line test. We looked at mapping diagrams, and talked about domain and range. We also introduced absolute value functions and how to graph them and represent them on a number line.
