Bottle blowing experiment
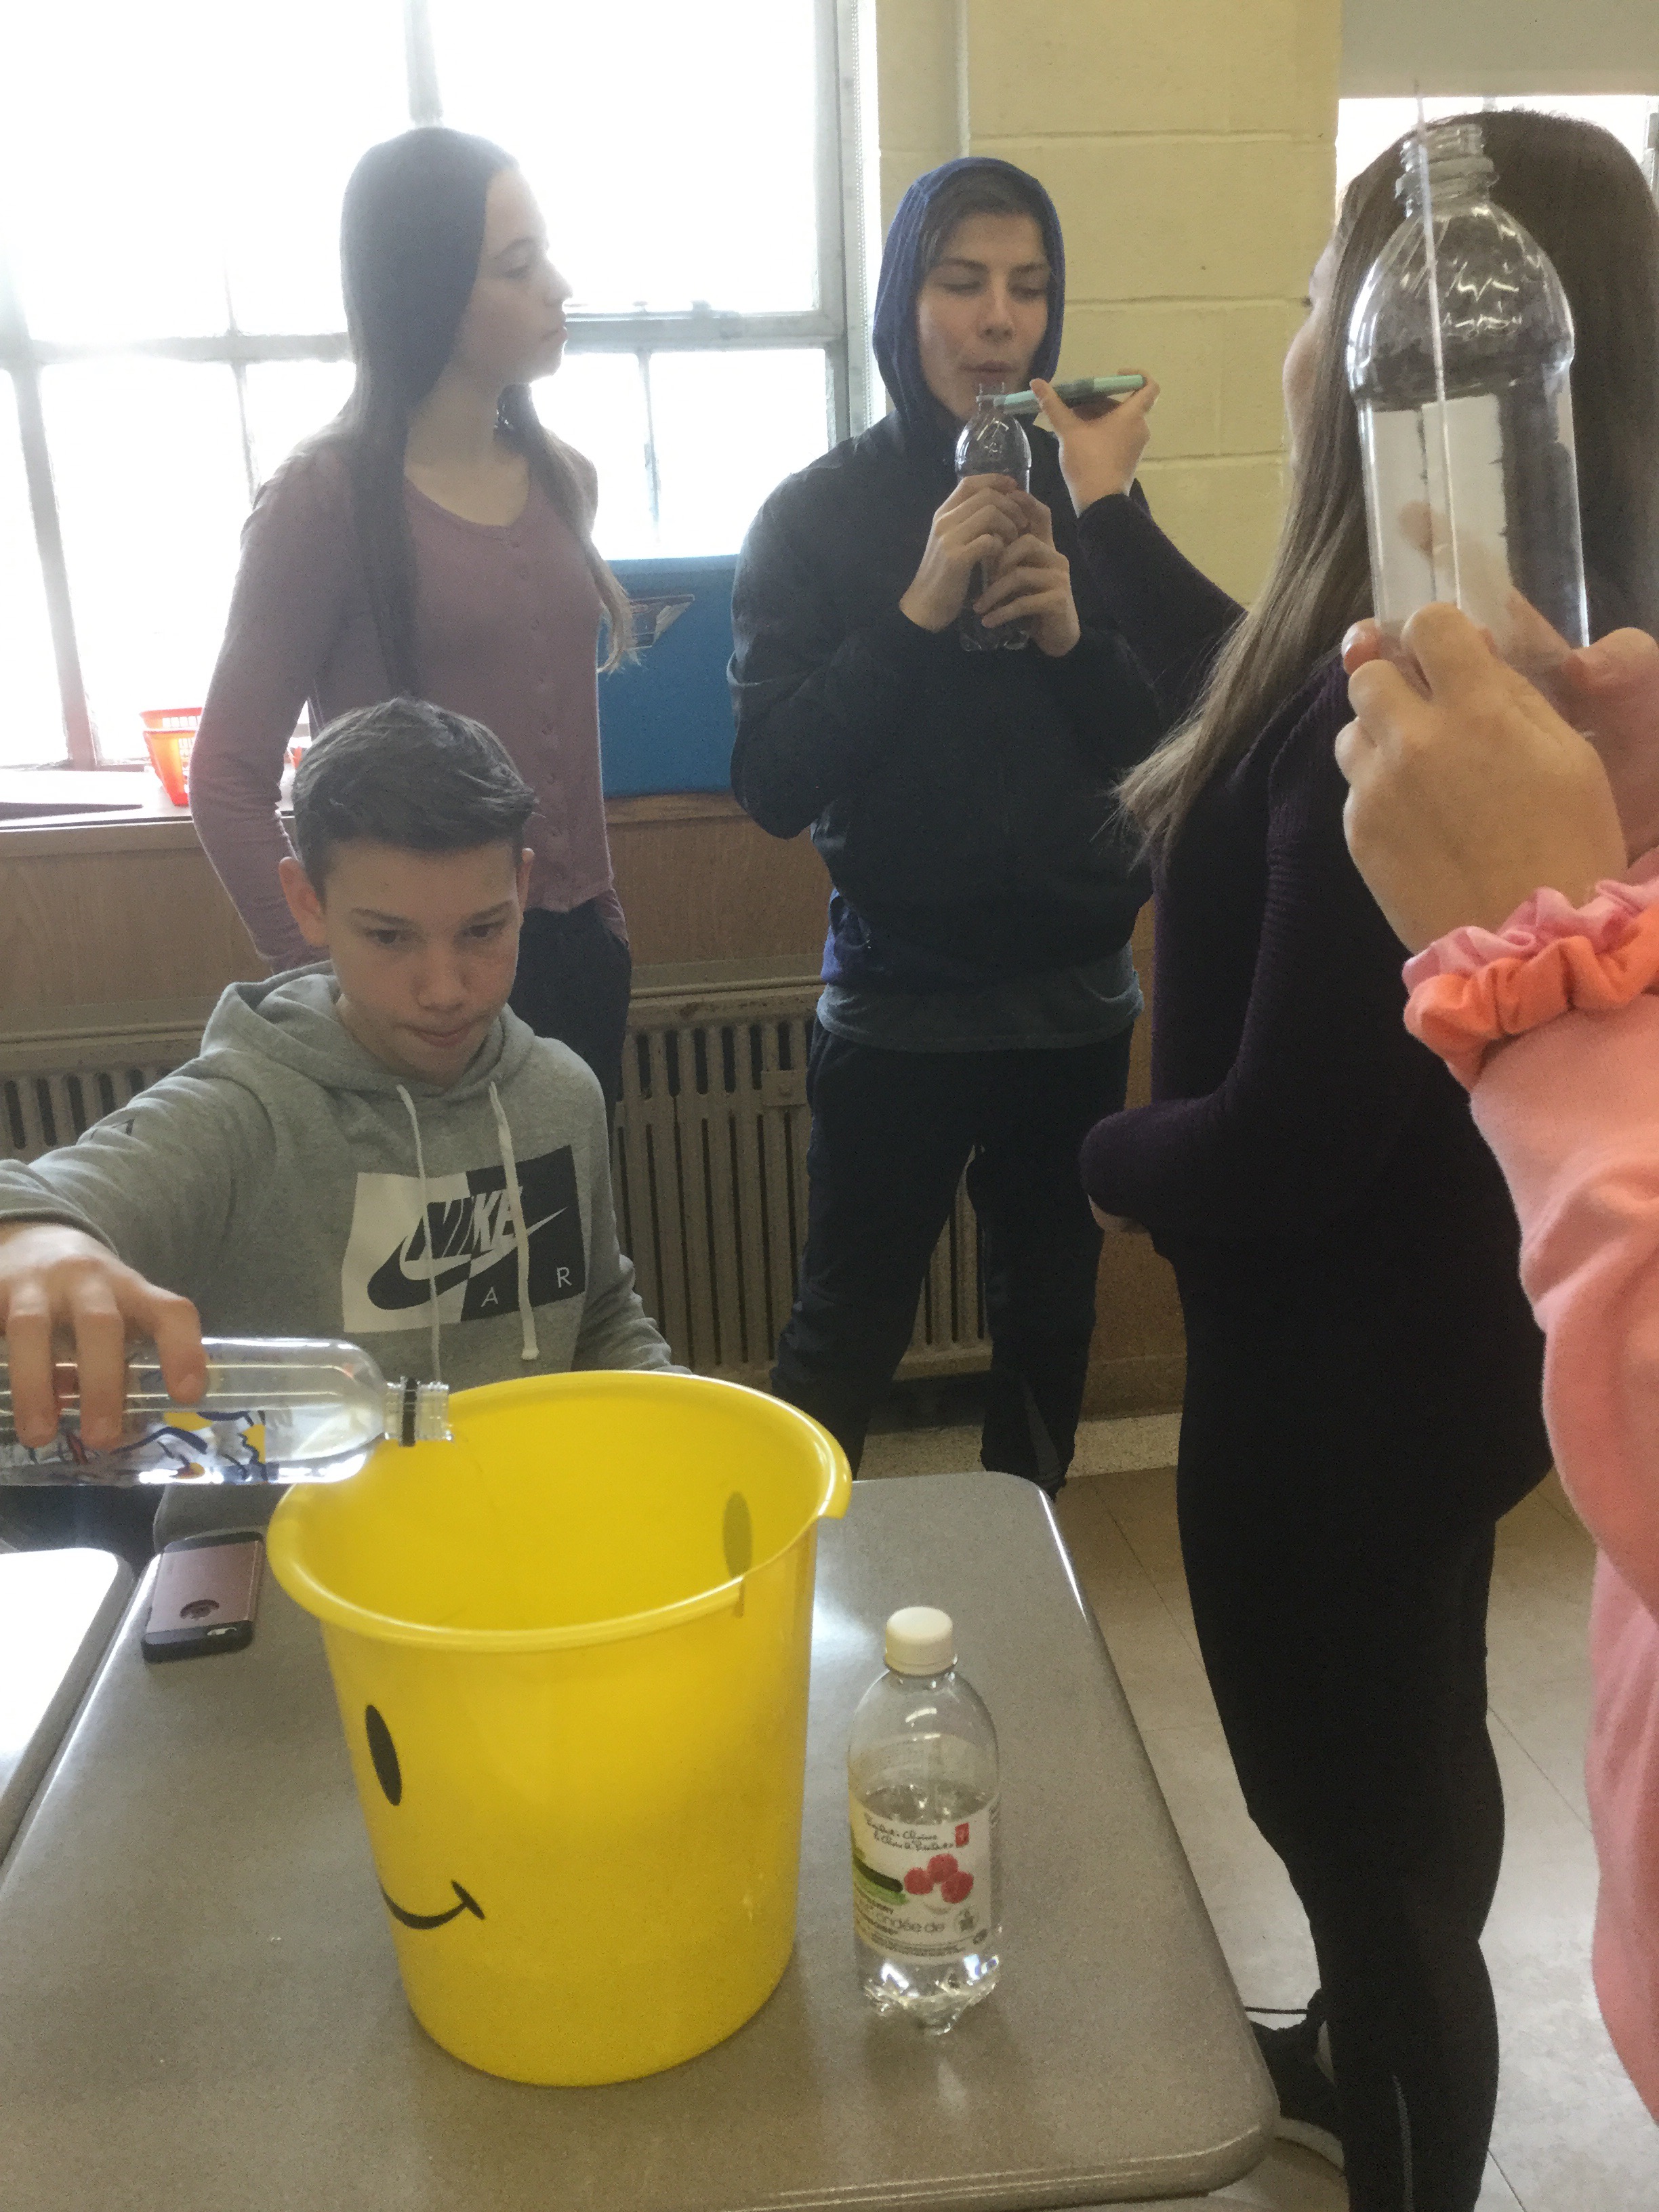
Today in grade 9 we experimented with the sound produced when blowing over the neck of a bottle with more or less water in it.
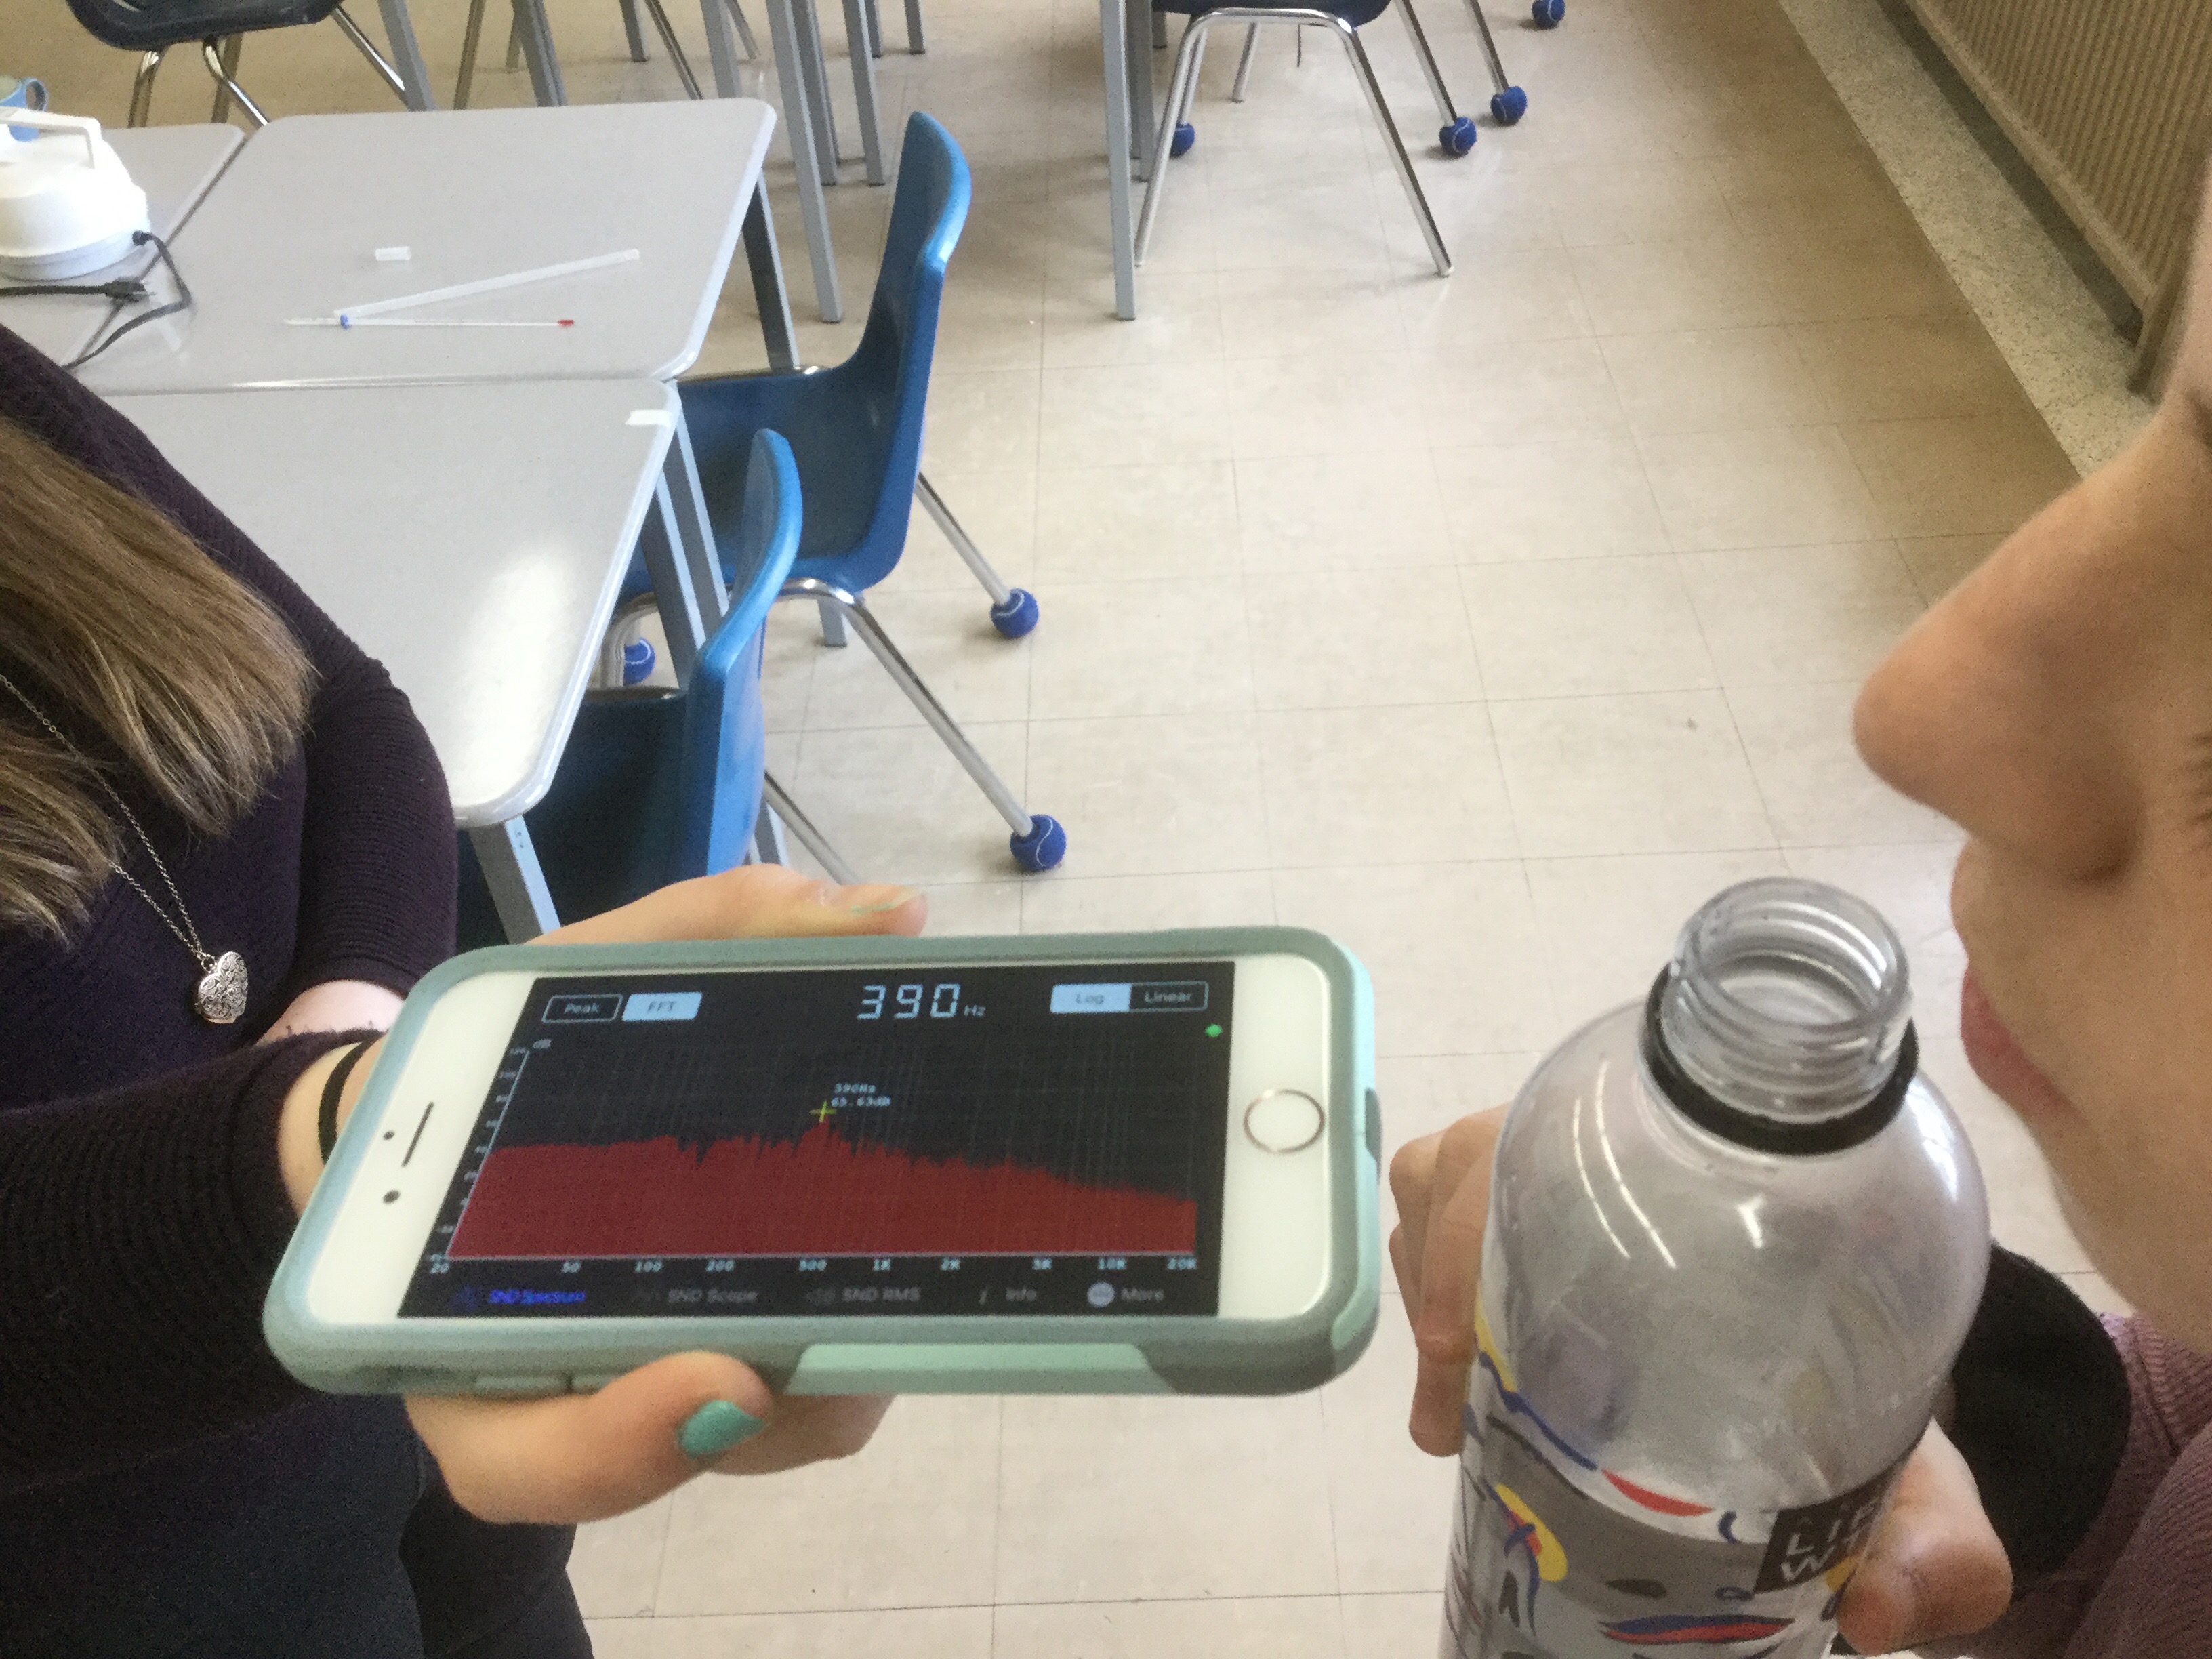
We used the app “sonic tools” to determine the frequency, and we started out with a lot of water in our bottles (which creates a small air column), and we decreased the level of water between trials, which increases the column of air in the bottle.
Once we got going, we collected a lot of data in a relatively short time.
We learned how to use google sheets to make a graph from a spreadsheet. Although it’s not ideal to use an ipad (graphs don’t format well) the computer version can make some great graphs.
This graph has the frequency on the vertical axis, it is what we measured, and it depends on the height of the air column. The frequency is the dependent variable. The height of the air column is on the horizontal axis, it is the independent variable, which we modified as part of our experiment.
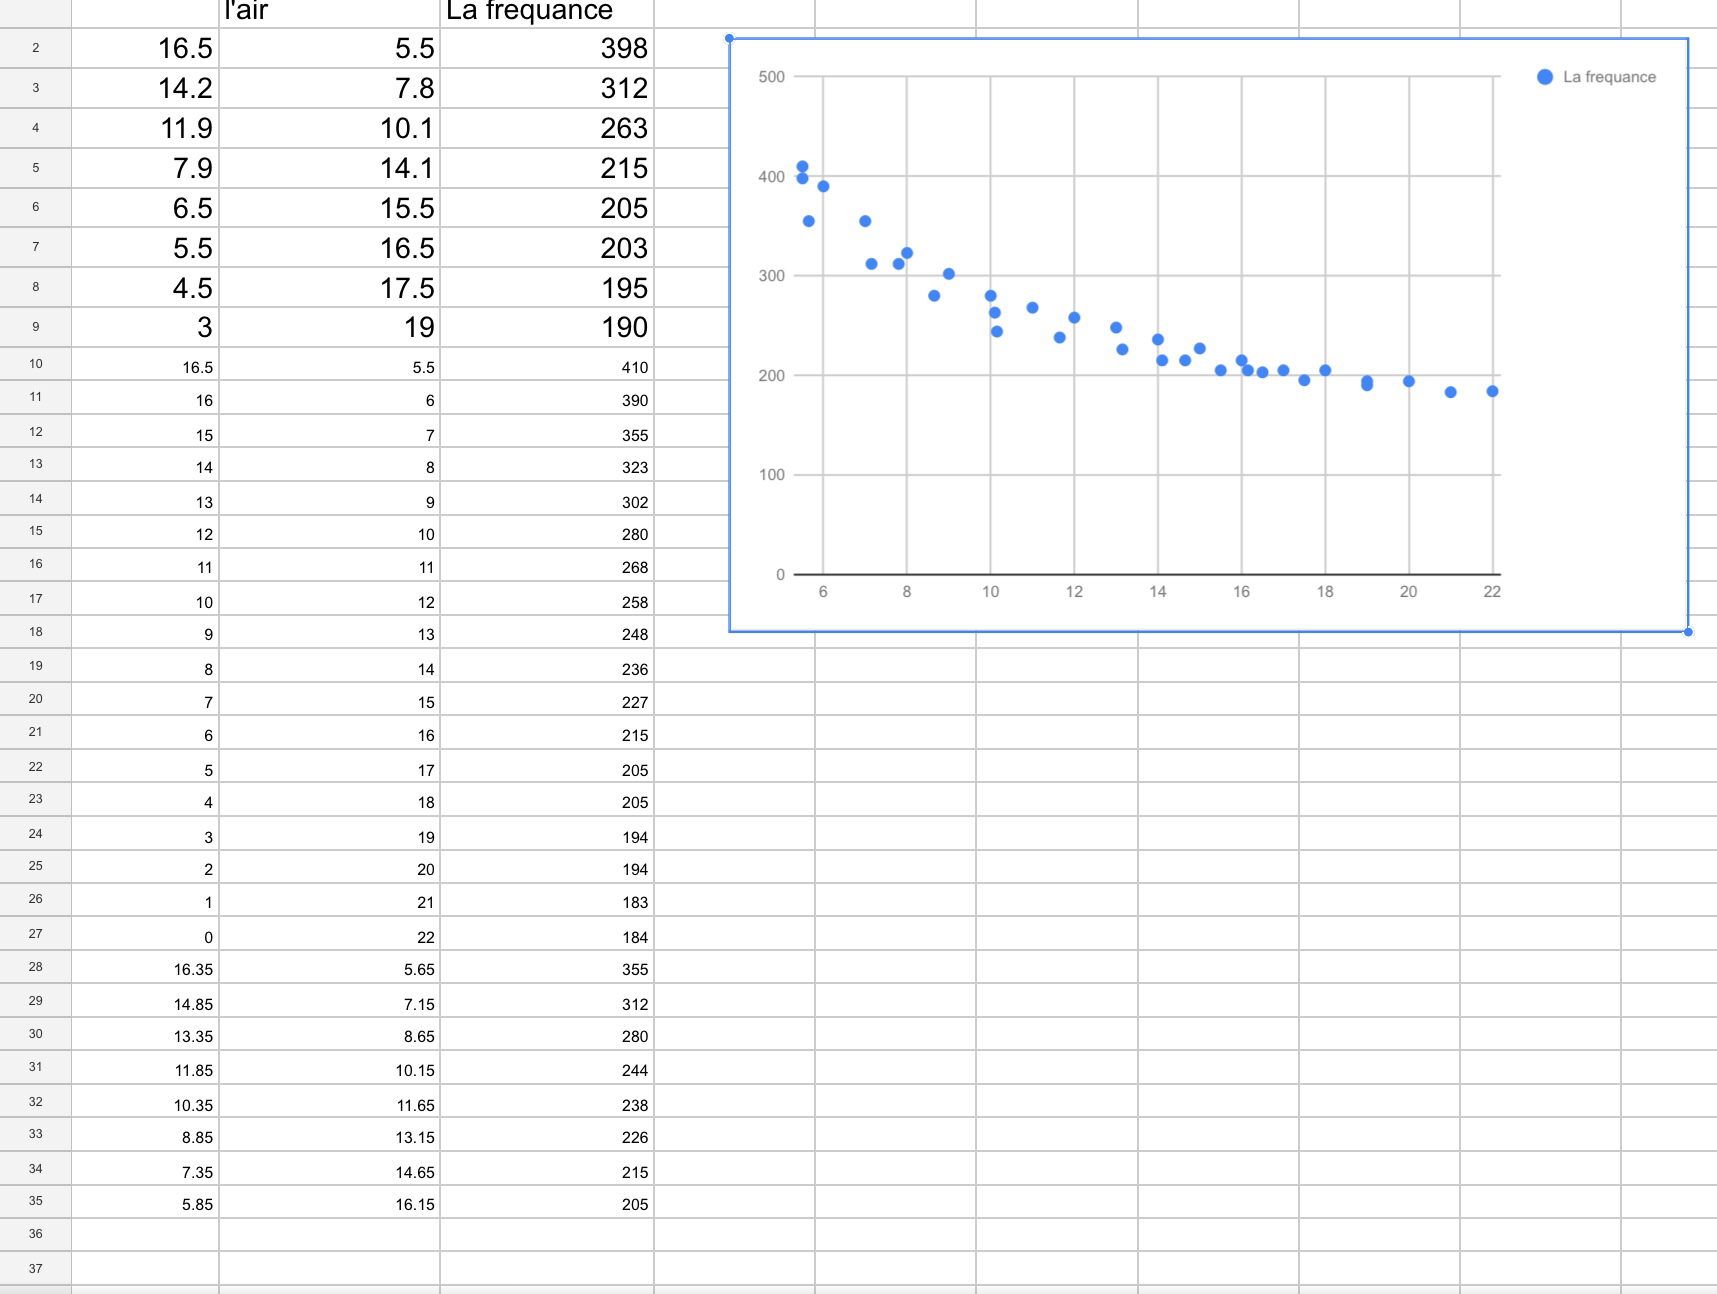
We see that the graph is non linear, and fairly strong but not perfectly correlated, it is partial, and it is negative.
