Multiple representations
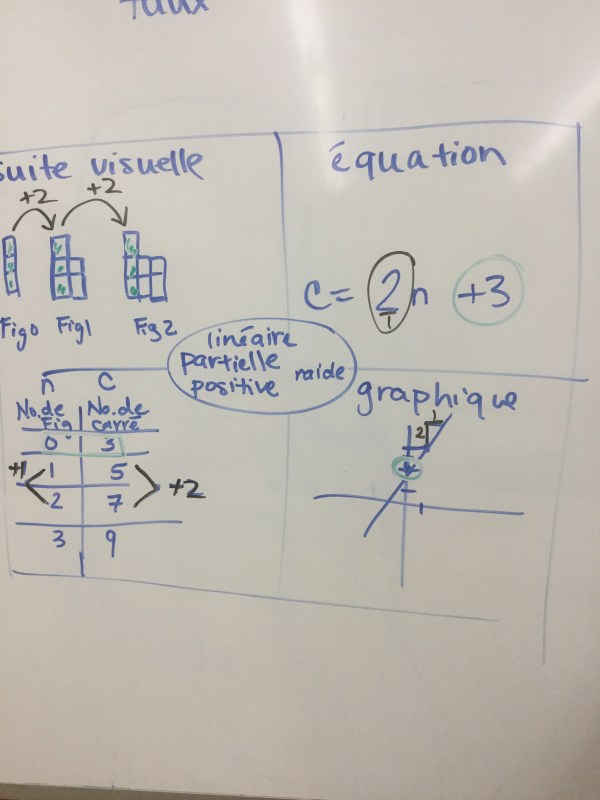
Here’s an example of all the ways we can represent a linear relation. A visual pattern, an equation, a graph, vocabulary, and a table of values. The rate is shown in black, and the constant in green.
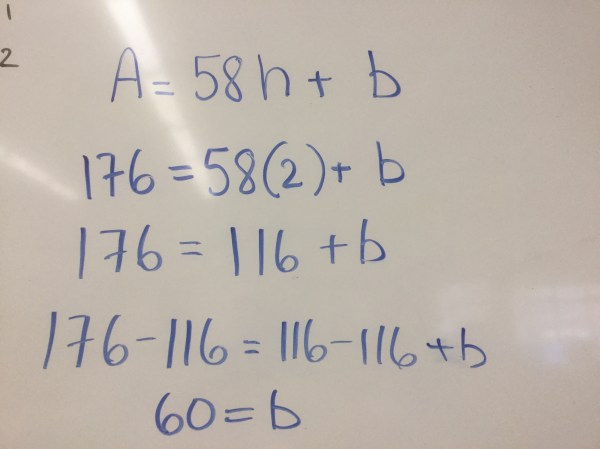
We worked on solving a problem in class too about a fridge repair. The first repair job cost 176$ and took 2 hours. The next job took 3.5 hours and cost 263$. We made a graph and found the rate (using the triangle). The price increased by 87$ for 1.5 hours of increased time. We looked for the unit rate which is 58$/h. The constant is found on the vertical axis, but we can’t know exactly what it is without some more calculations
 we can use our table of values and count backwards, for every hour we back track, the cost decreases by 58$. The constant is 60$.
We can also make an equation with the cost and time. “B” is our constant, which we are trying to calculate. We substitute values that we know. For time we used 2 hours and for cost we used 176$. We already know the hourly rate is 58$/h. We can then calculate the value of “b” which is the same as we got from our table.