Speed dating
Grade 9s are working on graphing lines, and making equations for graphs.

We’re working across the table from eachother in “speed dating” style. Both partners solve the problem together, then one side stays as expert, the other side rotates and tries a new question. The first side helps their new partner to become an expert before they themselves shuffle to the next question.
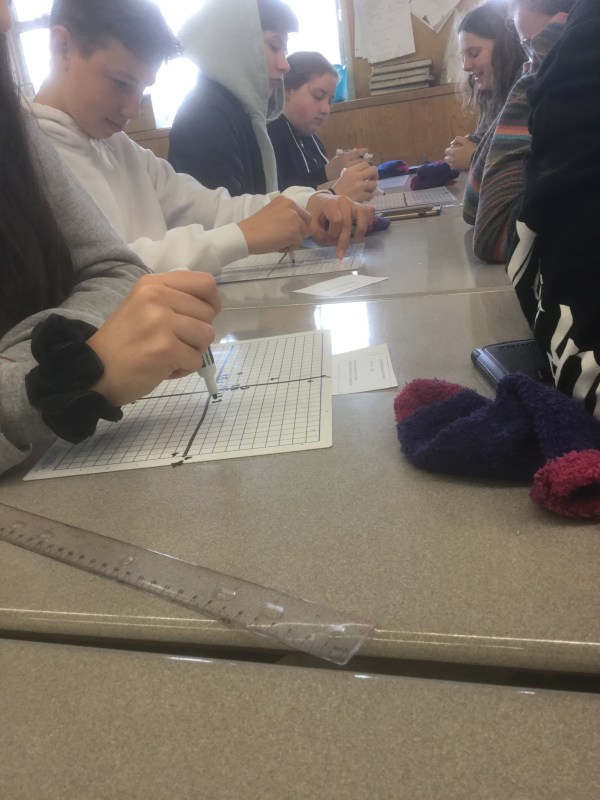
There’s a lot of reciprocal teaching happening, lots of clarifying questions being asked, and some big “aha” moments!

We looked all together at how to calculate the constant (initial value/y intercept) when we have a line that passes through 2 points.
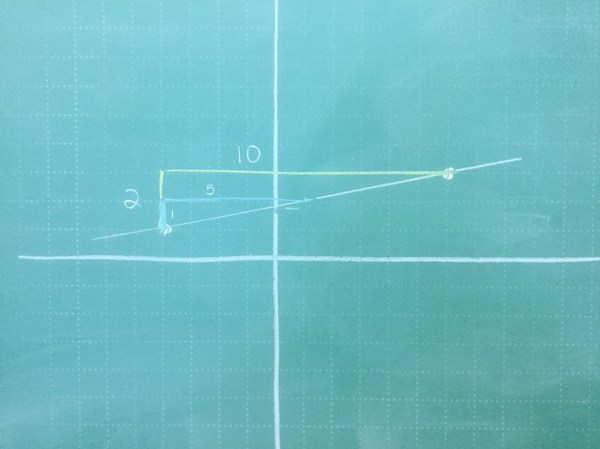 by graphing we could get close. We know the slope is 2/10 or 1/5 and we know that the y intercept is just less than 2.
We can do better than that! Some of us figured that for each 1 square we move forward, we should go up by 0.2 since that’s 1/5. Using that logic the y intercept is 1.8
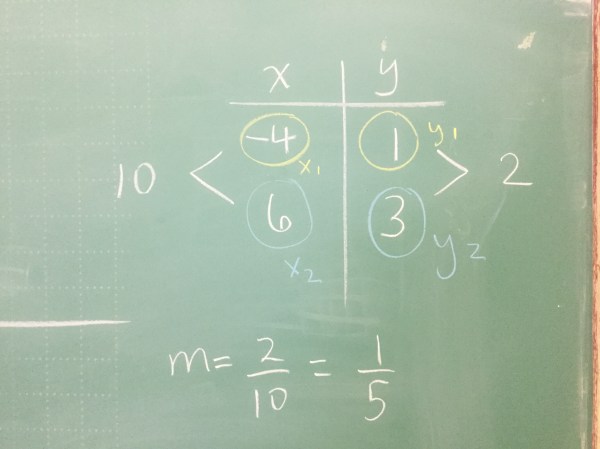
We looked at how a table can be helpful to find the slope as well. And how this connects to the equation for slope.

It’s all “rise over run” no matter how you look at it.

And the slope ends up being 1/5 again!

We can calculate the y intercept (b) by subbing in a point on the line for x and y. We then use algebra to get b.
 it doesnt matter what point we choose to use, b will be the same! 1.8 in this case.

If we are not keen on algebra, we looked at how desmos sliders can be helpful, and also how desmos can do regression for us! Here’s a different equation, of a line that goes through the points that are in the table above. Technology is pretty cool!
