Graphing our bean growth
Grade 9s are graphing bean growth today!
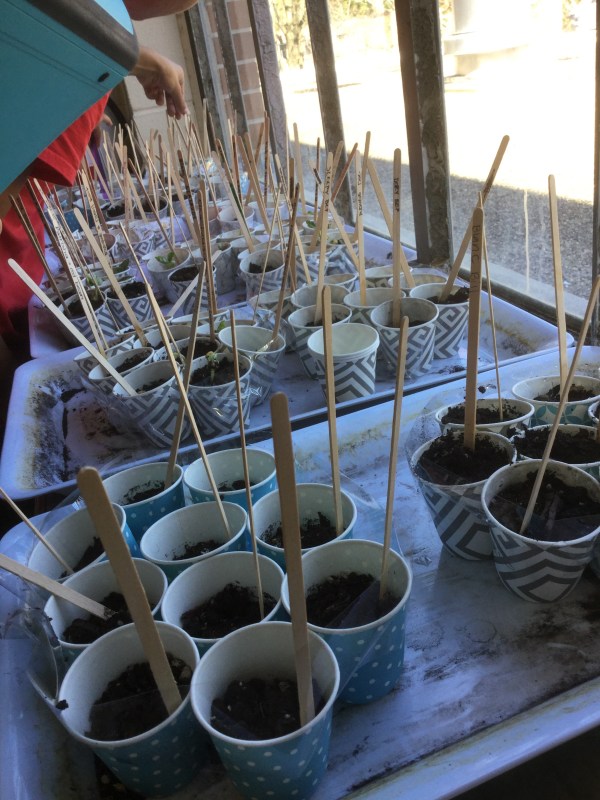

Look at that before and after comparison! We expect to see positive trends!
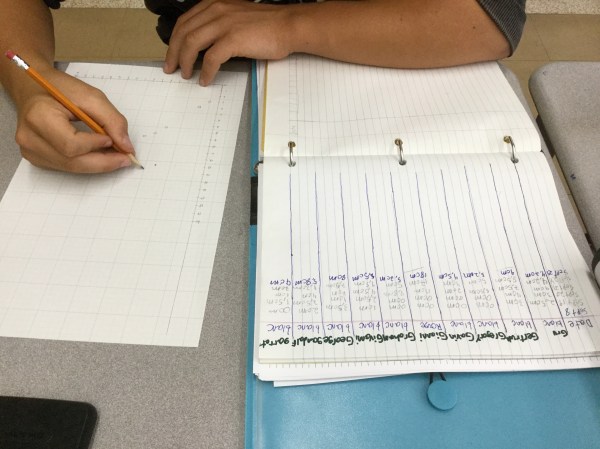
We’ve been measuring and tracking the growth of many plants. Today we chose one red bean and one black eyed pea, and we’re plotting two graphs on the same axes. We are able to compare growth rates, and predict how tall they’ll be in a week.
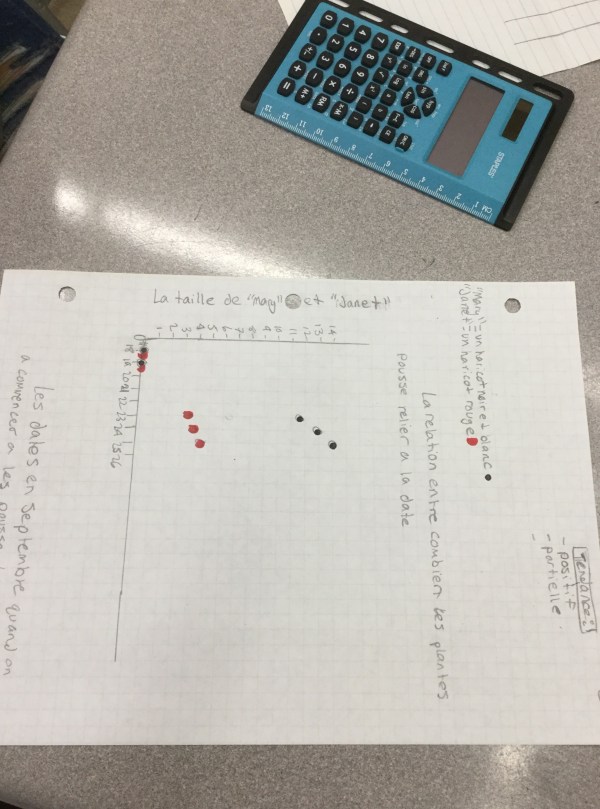

We are making clear scales on axes, plotting points, using a legend, and deciding if our data shows a linear or non linear trend. We made our predictions, and we will report back in October to share how accurate our predictions were.
We are also beginning to work on our math portfolio.

We are making notes and brainstorming using our template, and then we’ll write our submission and hand it in via google classroom.
