Group Graphing
This lesson was inspired by reading this post on Al Overwijk’s blog.
We have been working on some quadratics on this spiral of grade 10 applied math. We have used algebra tiles and expanded and factored, and talked about the area model, and then explored the graphs on desmos. In our earlier spiral we talked about linear and non linear data and tables of values and trends that we see in the tables and graphs.
This task was a lot to take on for a Friday in December, but we did our best! I was thankful to have another adult in the room to support and keep the groups on task and moving forward. With a big busy class (24 students with a lot of needs) it would be a challenge to do solo.
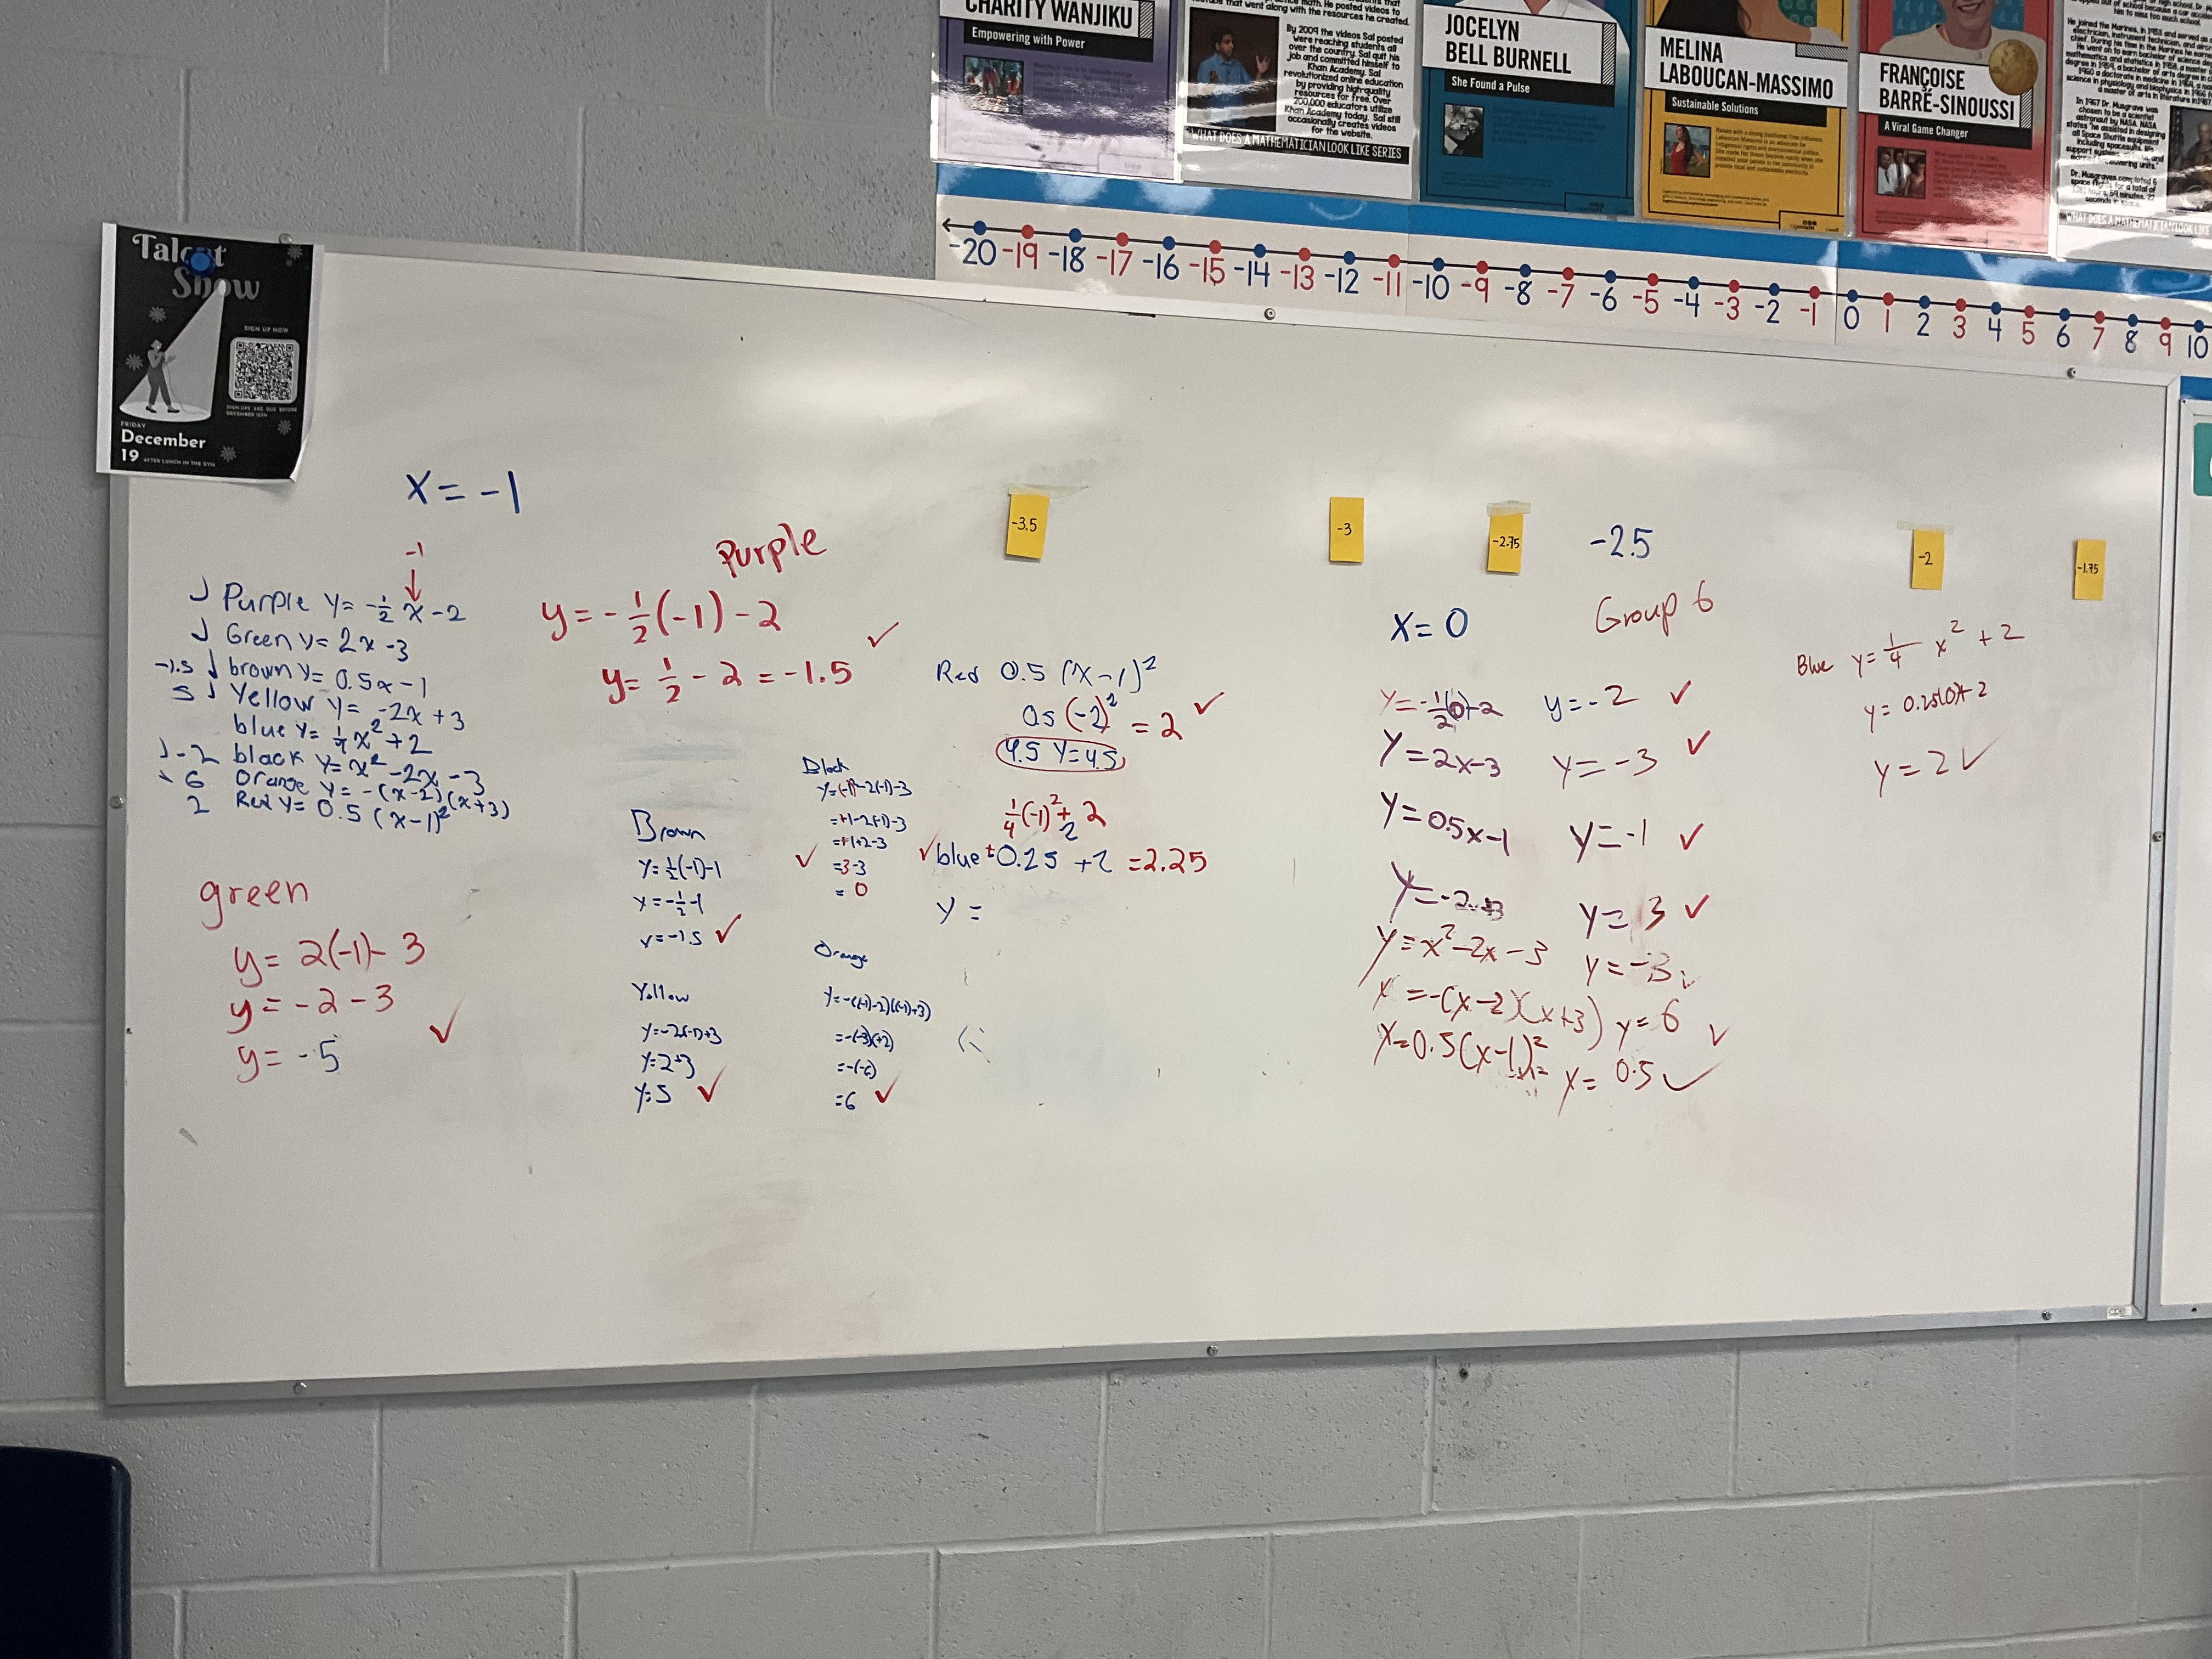
As students entered the class and got situated into their random groups, each student was given a card with a decimal number from -3 to +3 and we started out by ordering ourselves in a row, in order. Next each student got tape and we made a well spaced out number line on our board. We talked about using integers as our ruler, and that the 0.5 is in the middle of 0 and 1, and the 0.25 is between 0 and 0.5. We are good at spacing out halves, quarters and 3 quarters which is what was needed for the functions I chose to graph.
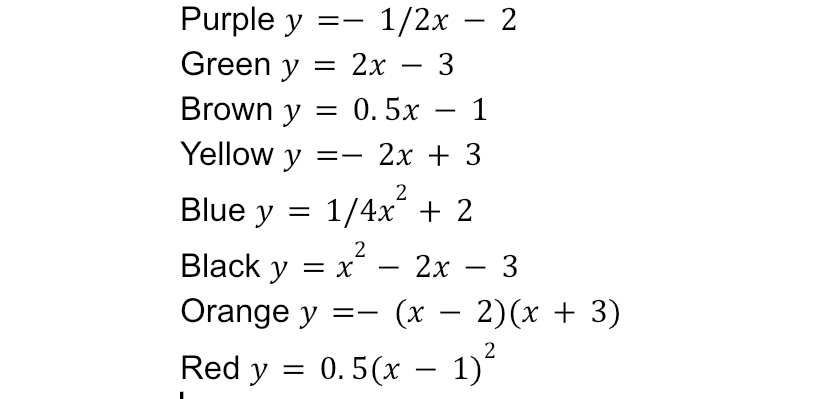
We next got split up into 7 groups. Each group got assigned an x value to plug into each of the following equations. We used x values of -3, -2, -1, 0, 1, 2, 3
It took groups several tries to substitute and simplify using order of operations. The biggest challenge for some groups was correctly copying down the equation (many minus signs went missing), and then the issue of squaring negative numbers, or adding before multiplying caused challenges as well. It was very helpful for me and my colleague to have an answer key to help make checking work go quickly.

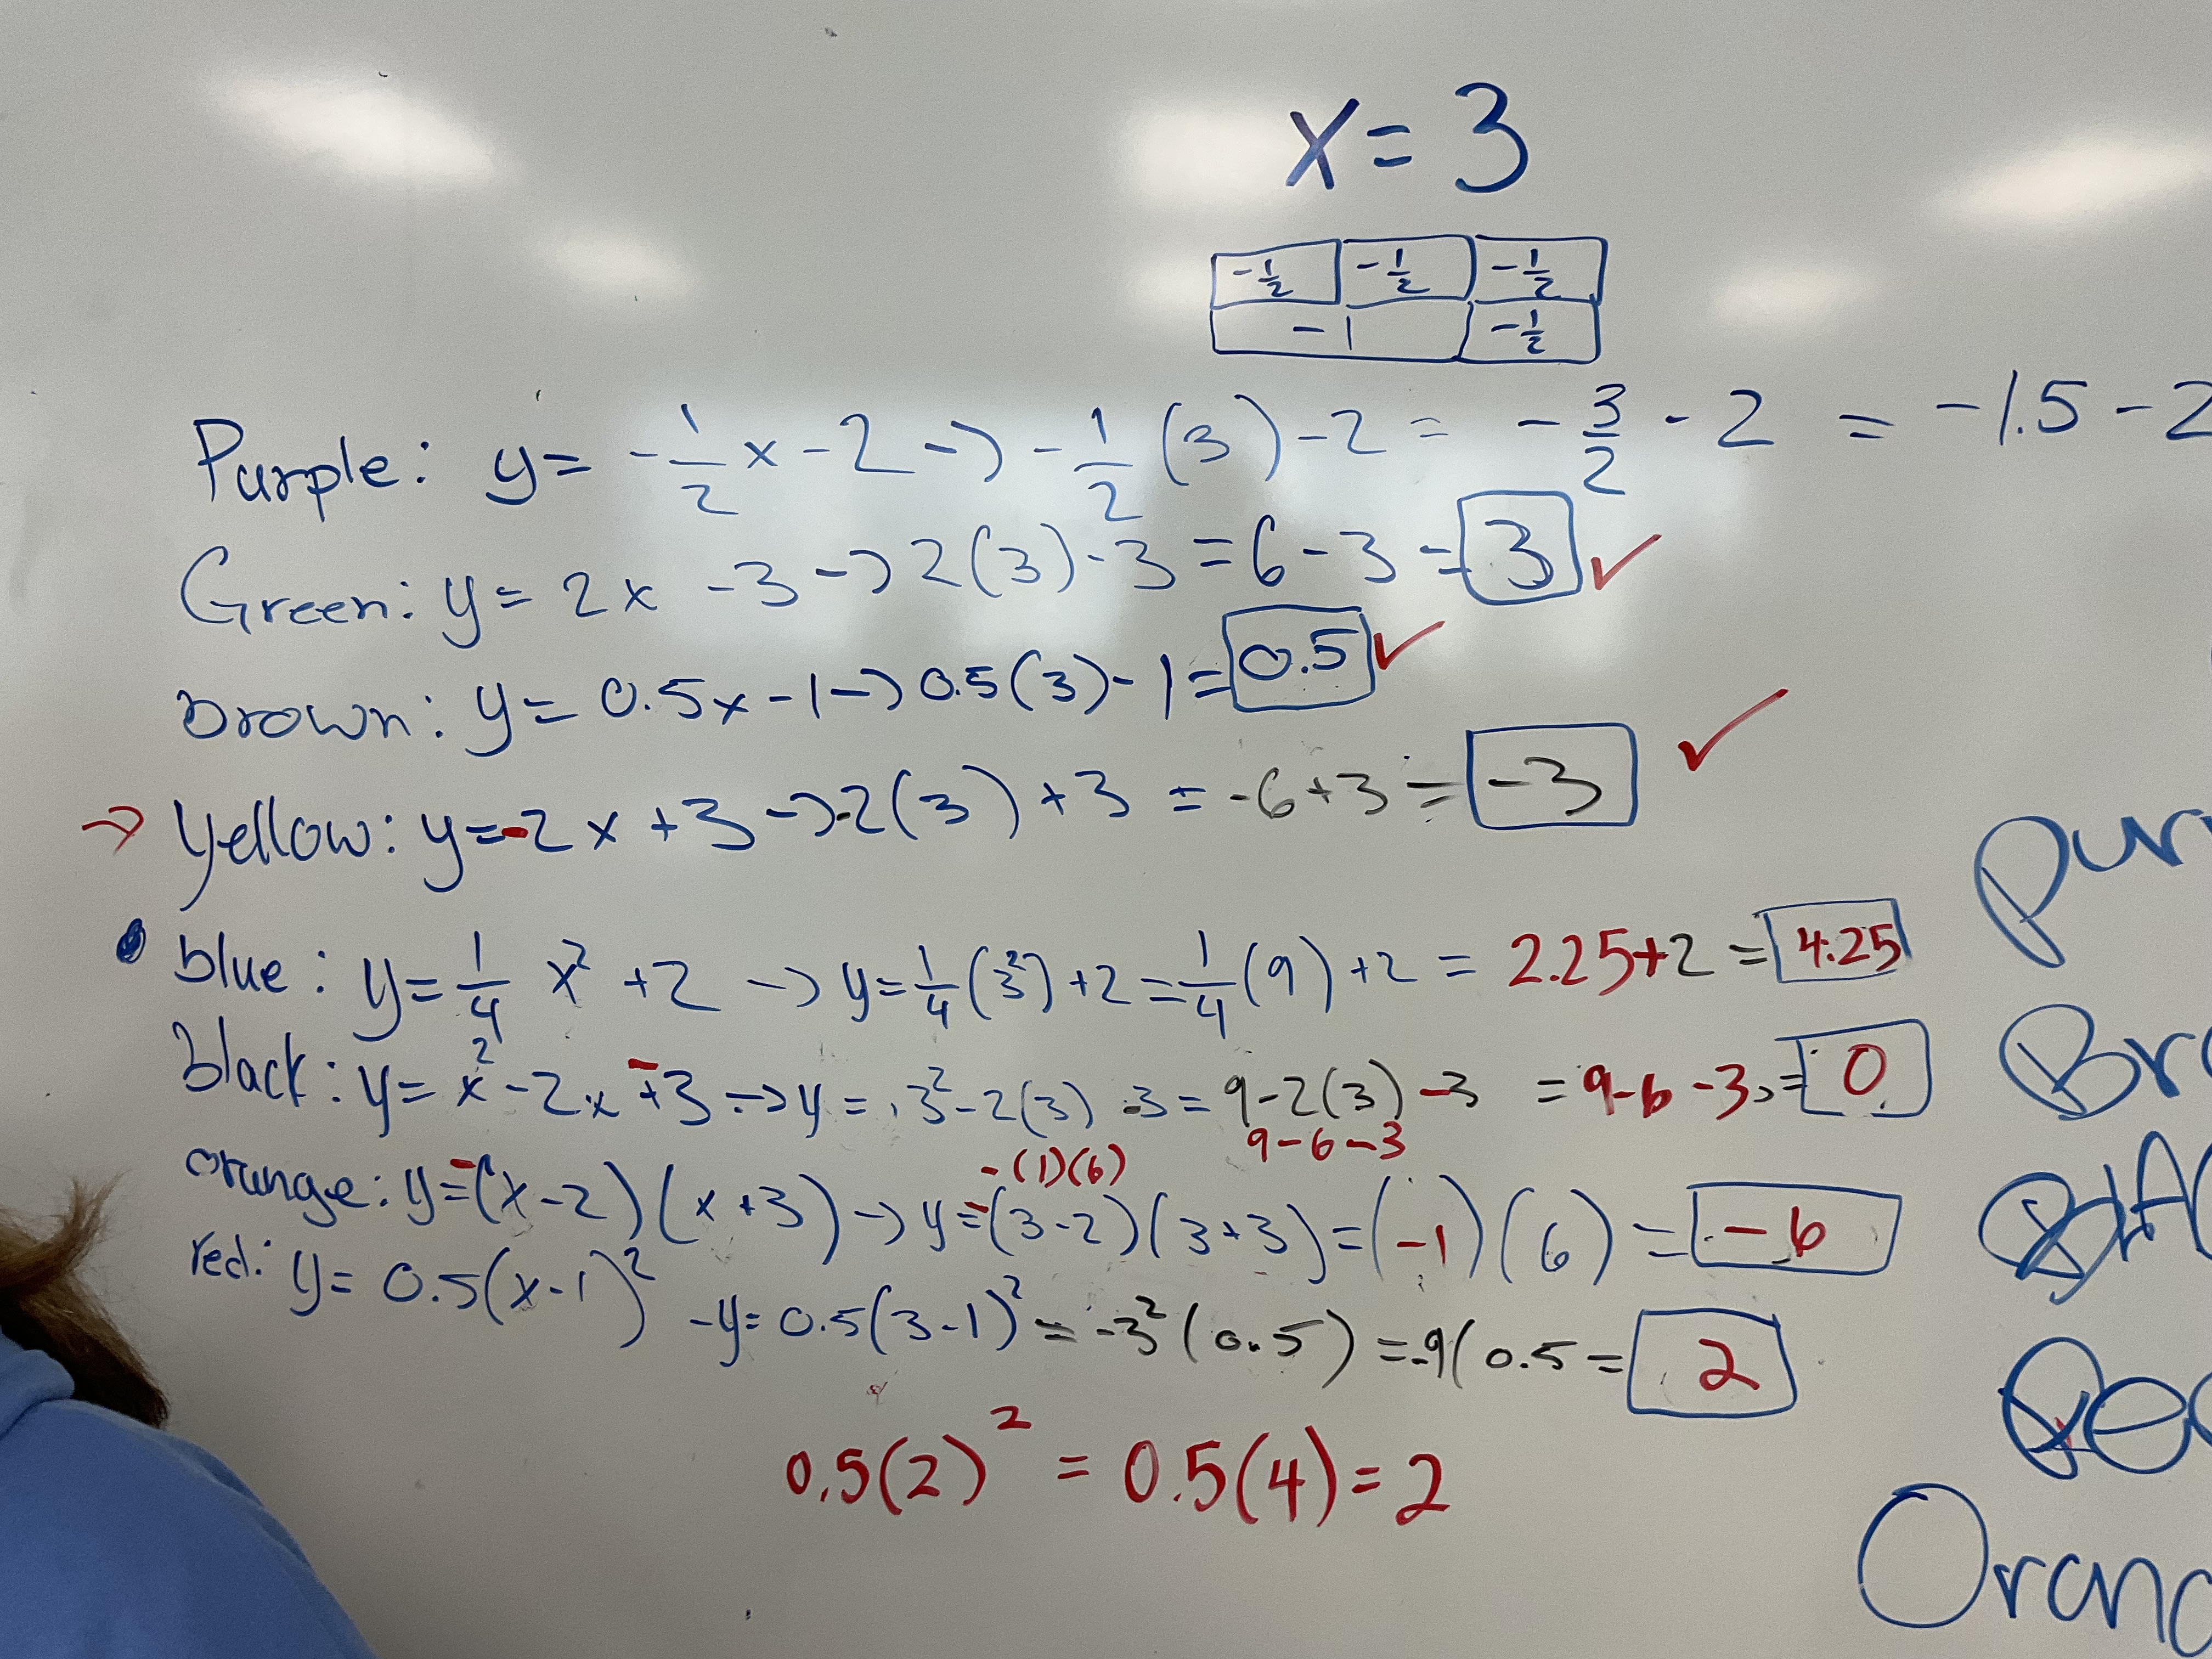

We’re working on showing steps and communicating our thinking. It was helpful for me to see the misconceptions so I know where to go from here next week when we consolidate the task.
Part 2 involved number lines. Each group got a number line with zero marked out. I cut strips from grid chart paper to make the number lines. They marked their points, then got the right colour marker and drew coloured dots on their number line.

The next step was to assemble the strips together. I taped them back onto a sheet of grid chart paper to help with spacing. I’m rethinking the scale of this, as it will be tricky to consolidate from as it is kind of small. Perhaps I’ll work from a projection of the image of the group graph to consolidate.

It looks a bit messy at first glance, but if you look carefully at one colour dot at a time, you can see the lines and curves take shape. If I were doing it again I’d have the students count each grid line as 0.5 to help us spread out the graph a bit more.
We will next explore the graphs, and use the tables of values and equations to identify key points of each equation, and features of the graph (slope, direction of opening etc).
We were mostly all engaged for most of the period, and even had some visitors in the room (grade 8s on tour, 2 v.ps and a colleague who popped by because it looked interesting). Many thanks to Al for writing his initial lesson study. I’m going to try this task with grade 9s and linear equations in various forms next!
