Cookie Towers
In grade 9 we built cookie towers to generate some single variable data to use for our statistics and box and whisker plots.
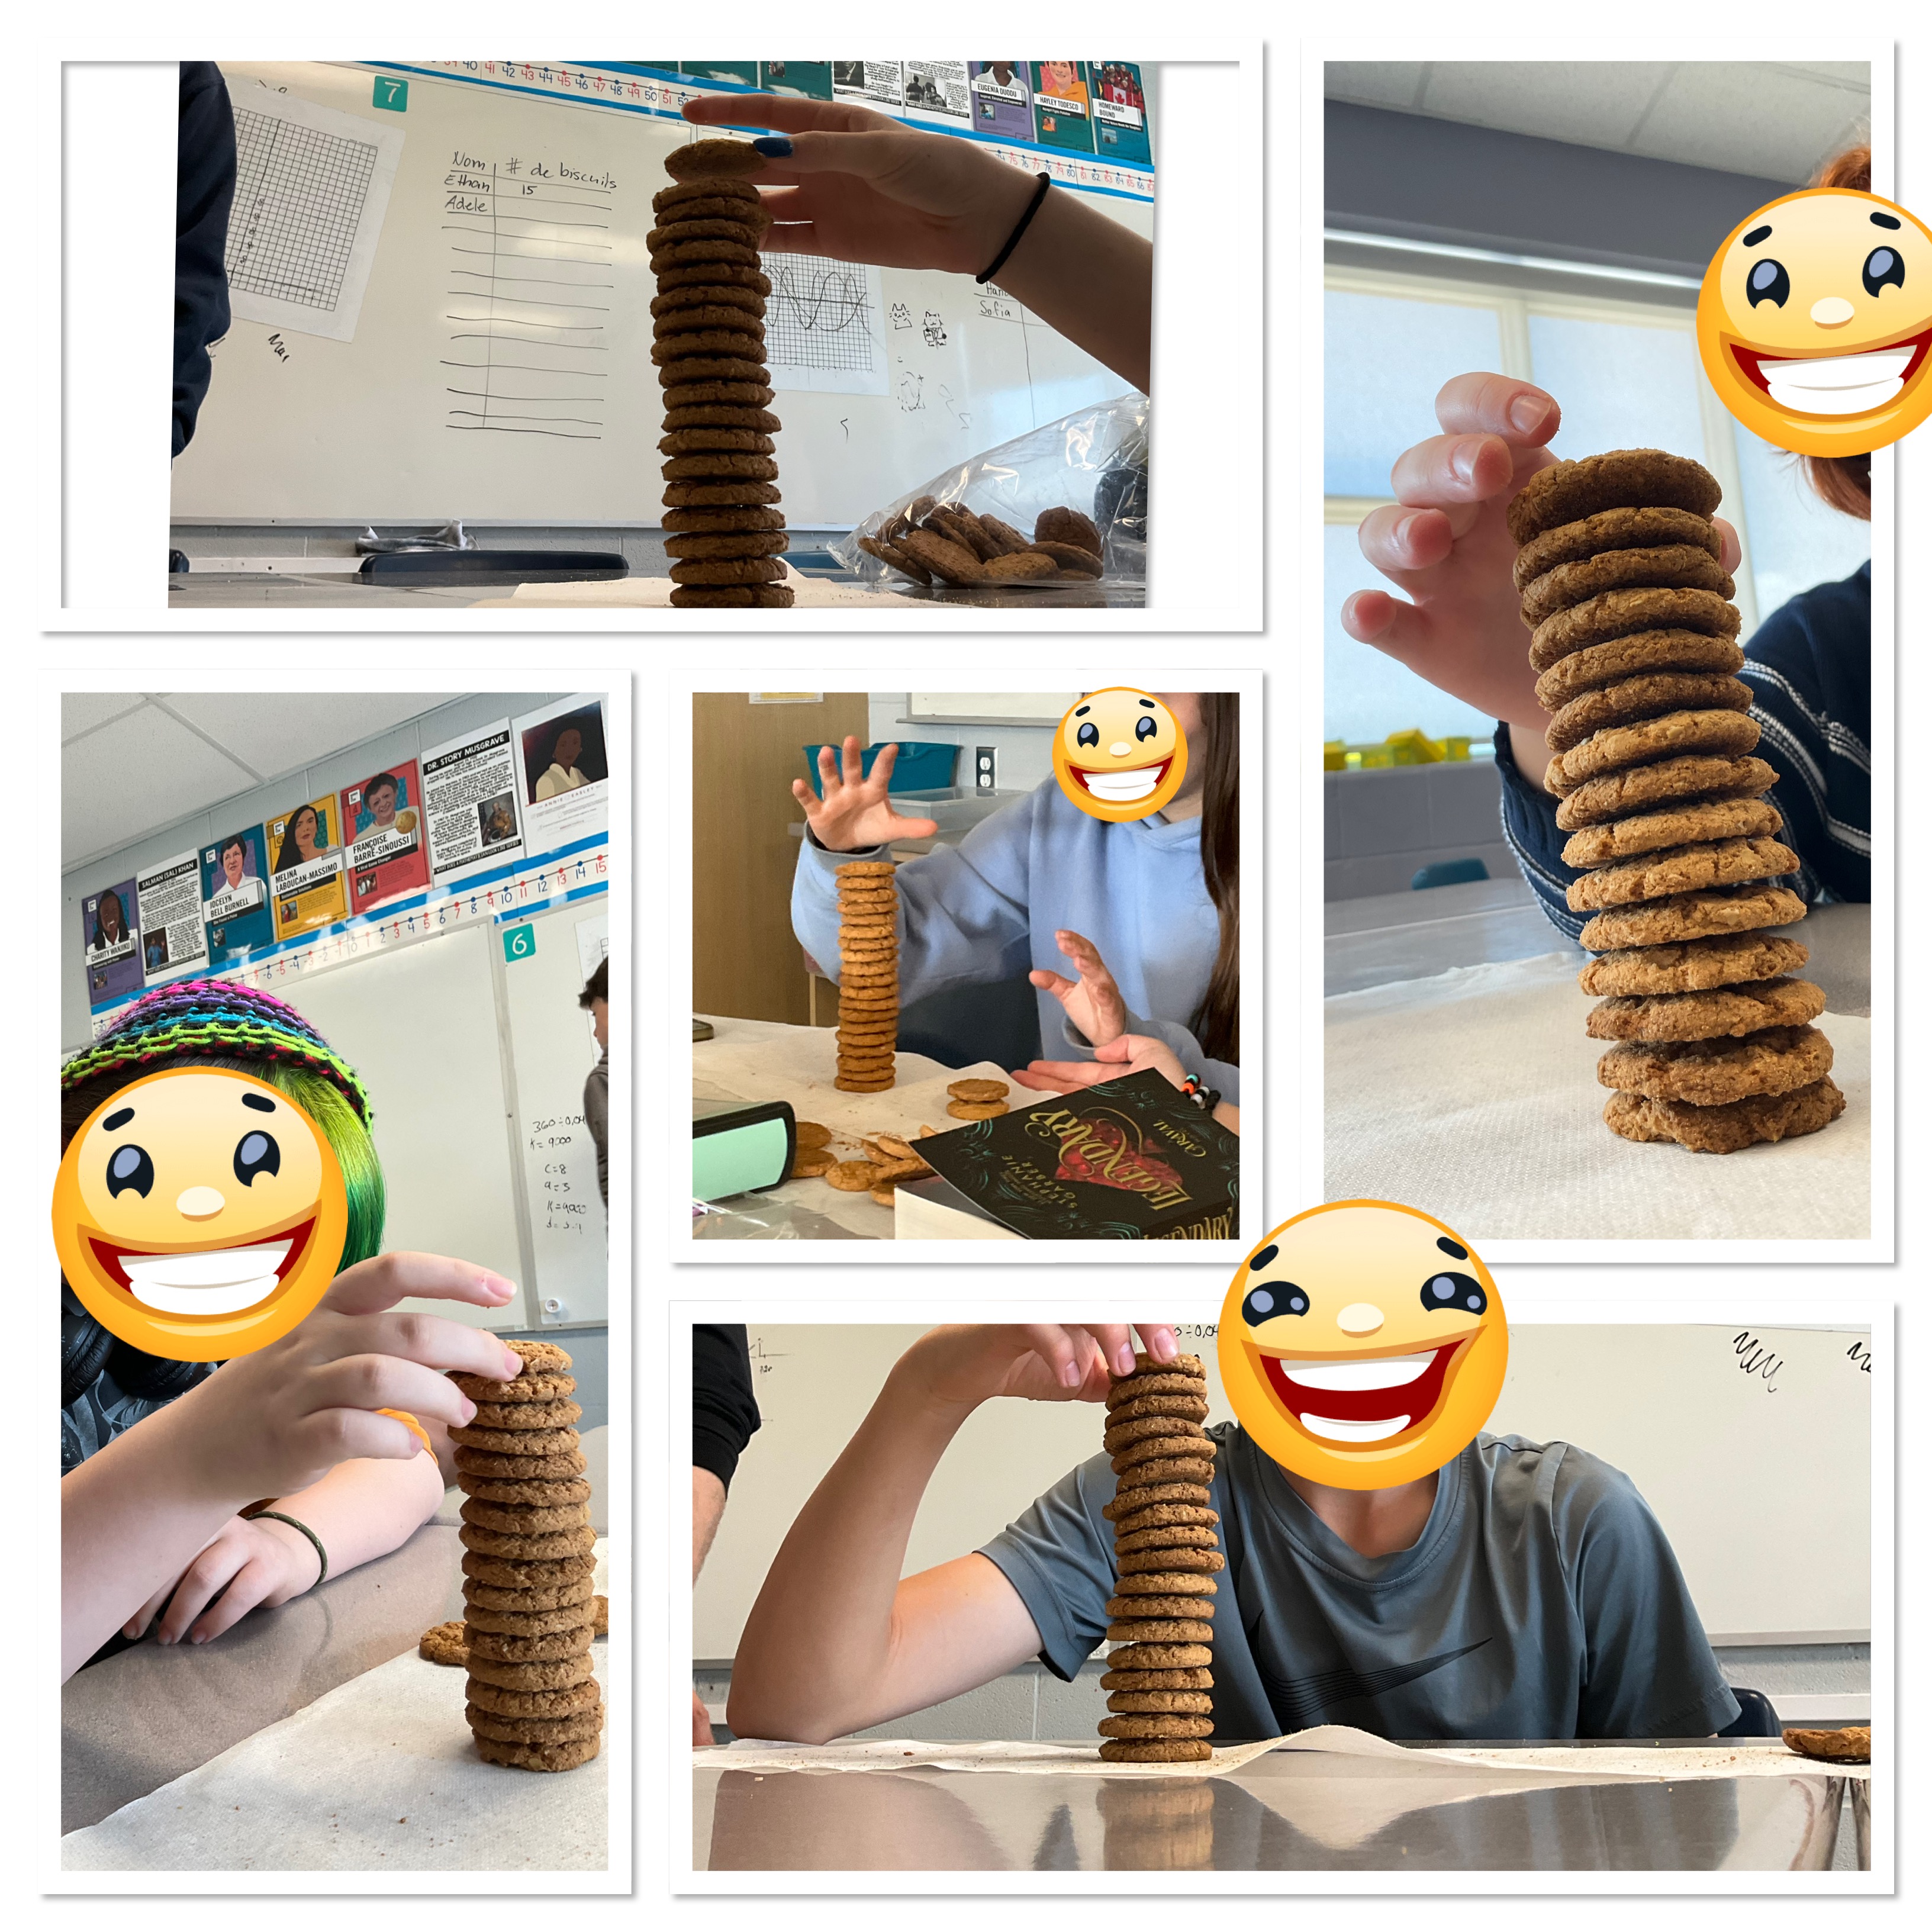
Each group made 12 towers and kept track of how many cookies were in each. From there, they calculated the mean, median, mode and range of their data.
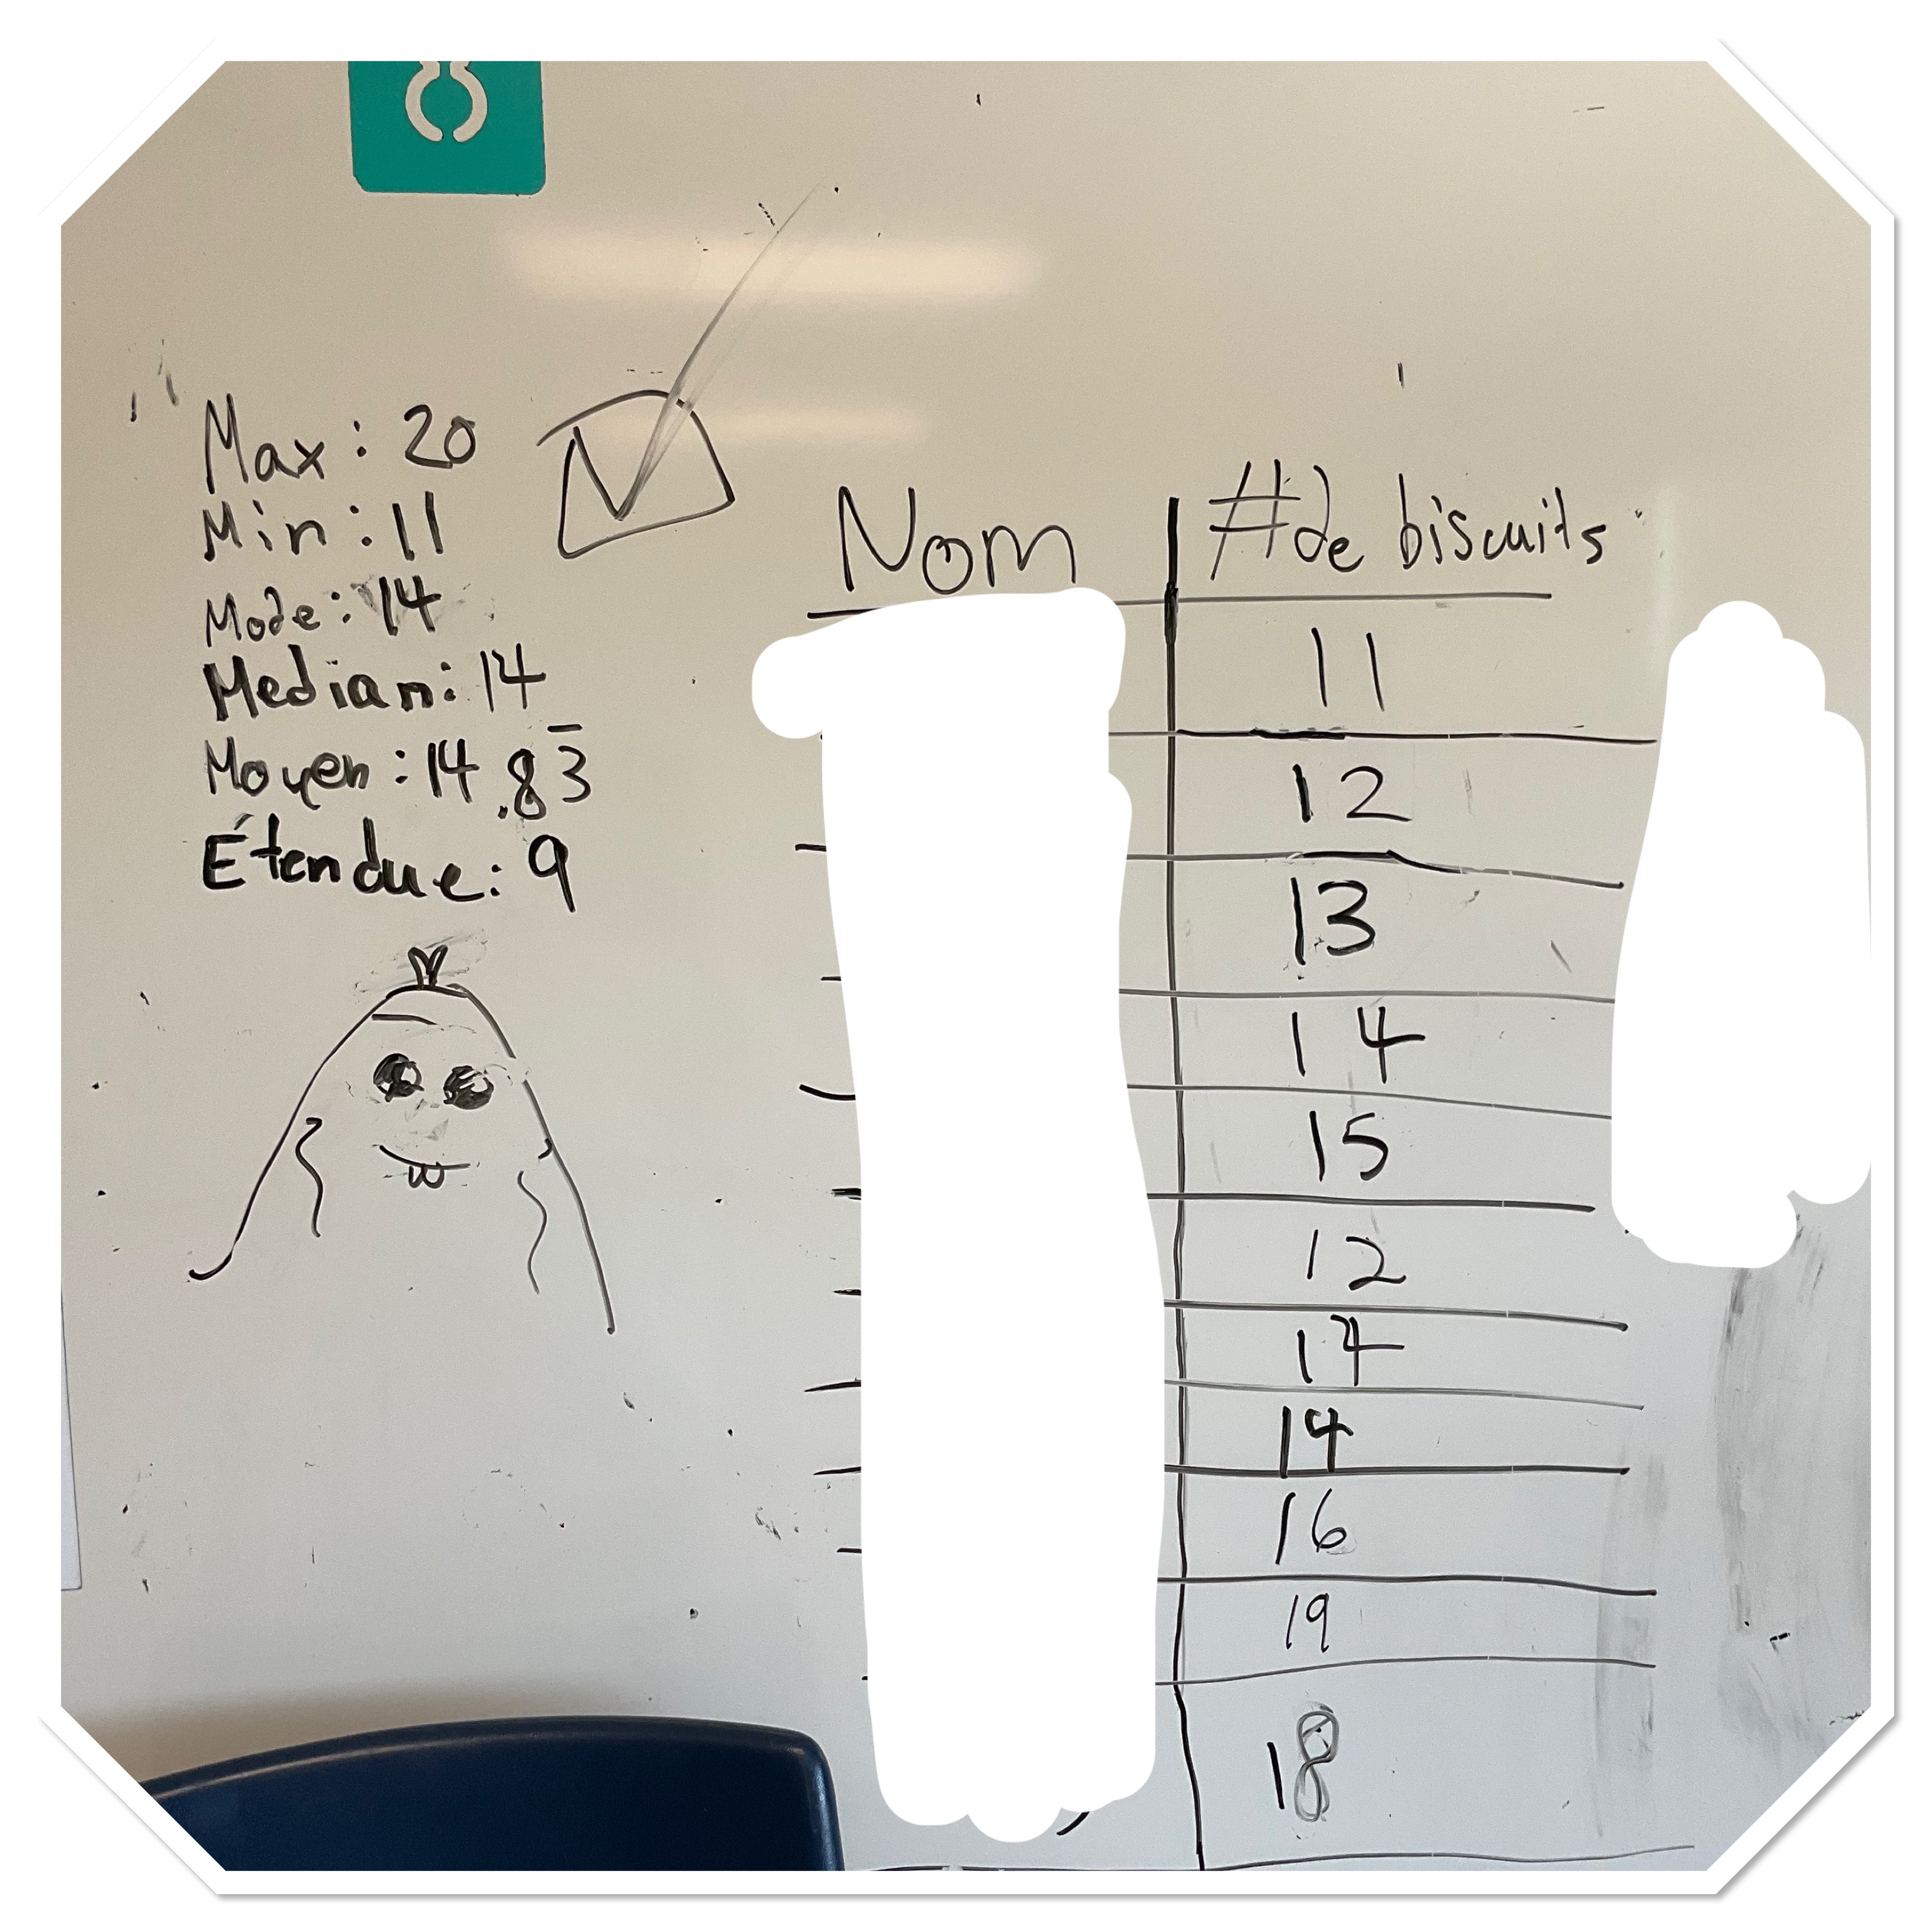
Then each group made box and whisker plots for their data. We learned about how each quartile will hold the same number of data points, and the graph will give us lots of information about how the data is spread out. Students used the idea of density to talk about which quartiles had data that was more dense and less dense.
I apparently forgot to capture pictures of their box and whisker plots! It’s been a busy time.
this activity was inspired by “math equals love” blog years ago, but I can’t seem to find the post.

