Khan Academy Introduction
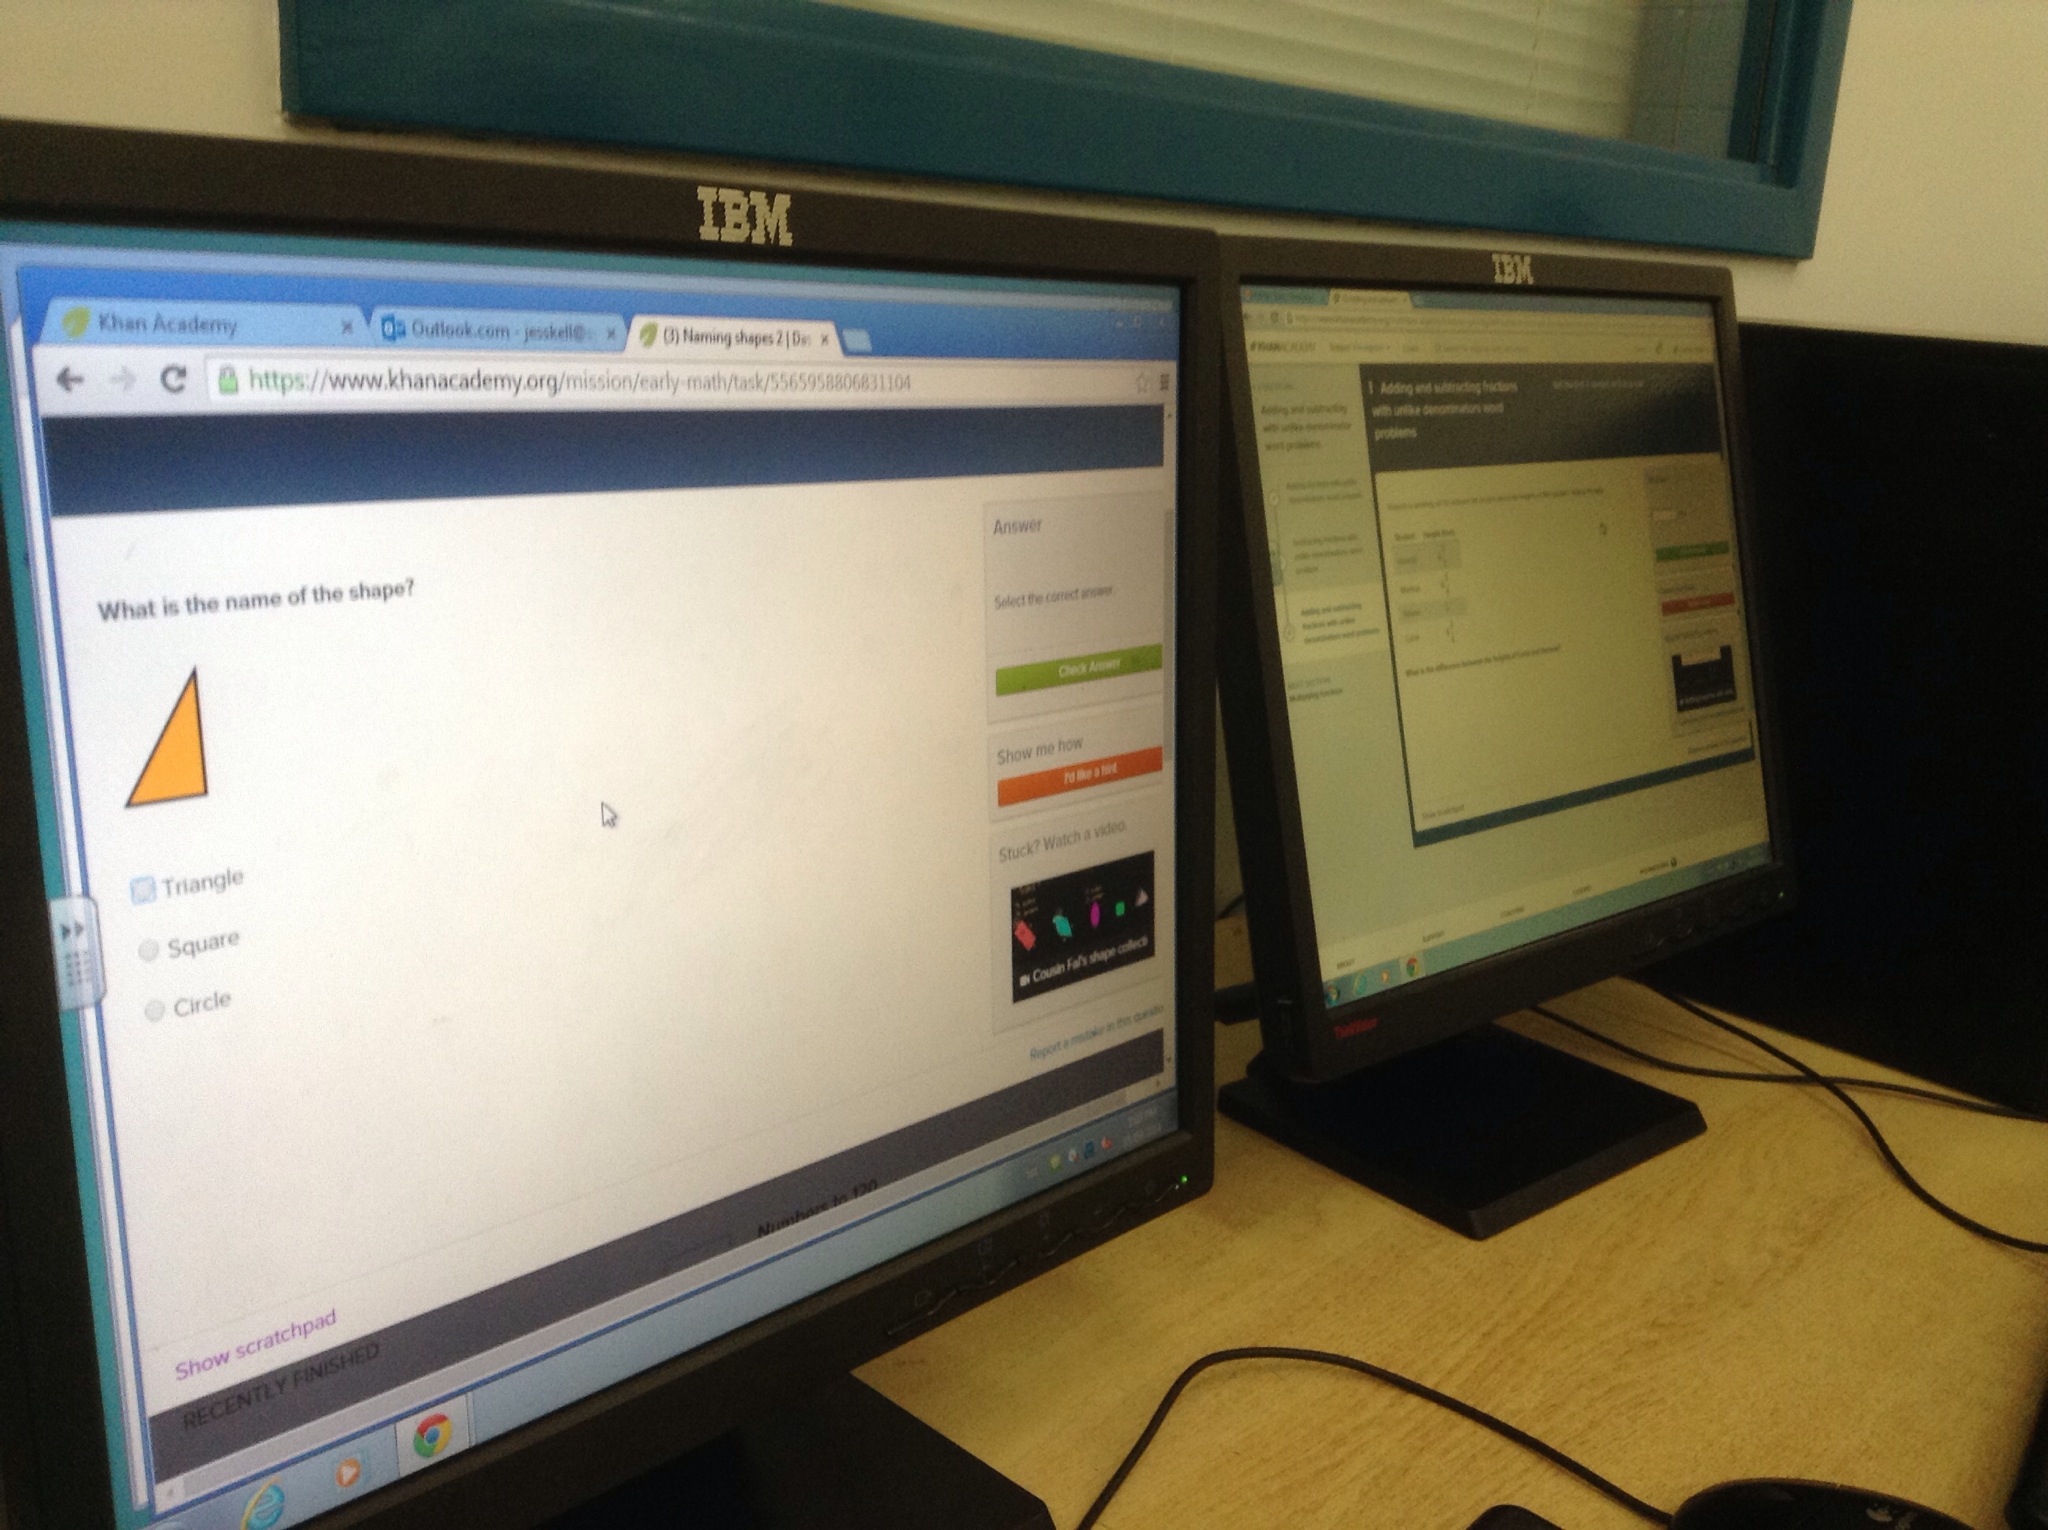
A great free online learning tool is Khan Academy. Today we all made accounts, and explored what the site has to offer. From 1+1 all the way to differential equations (university level math) there are videos to watch, and skill building questions to work through. You get points and earn badges for practicing math!
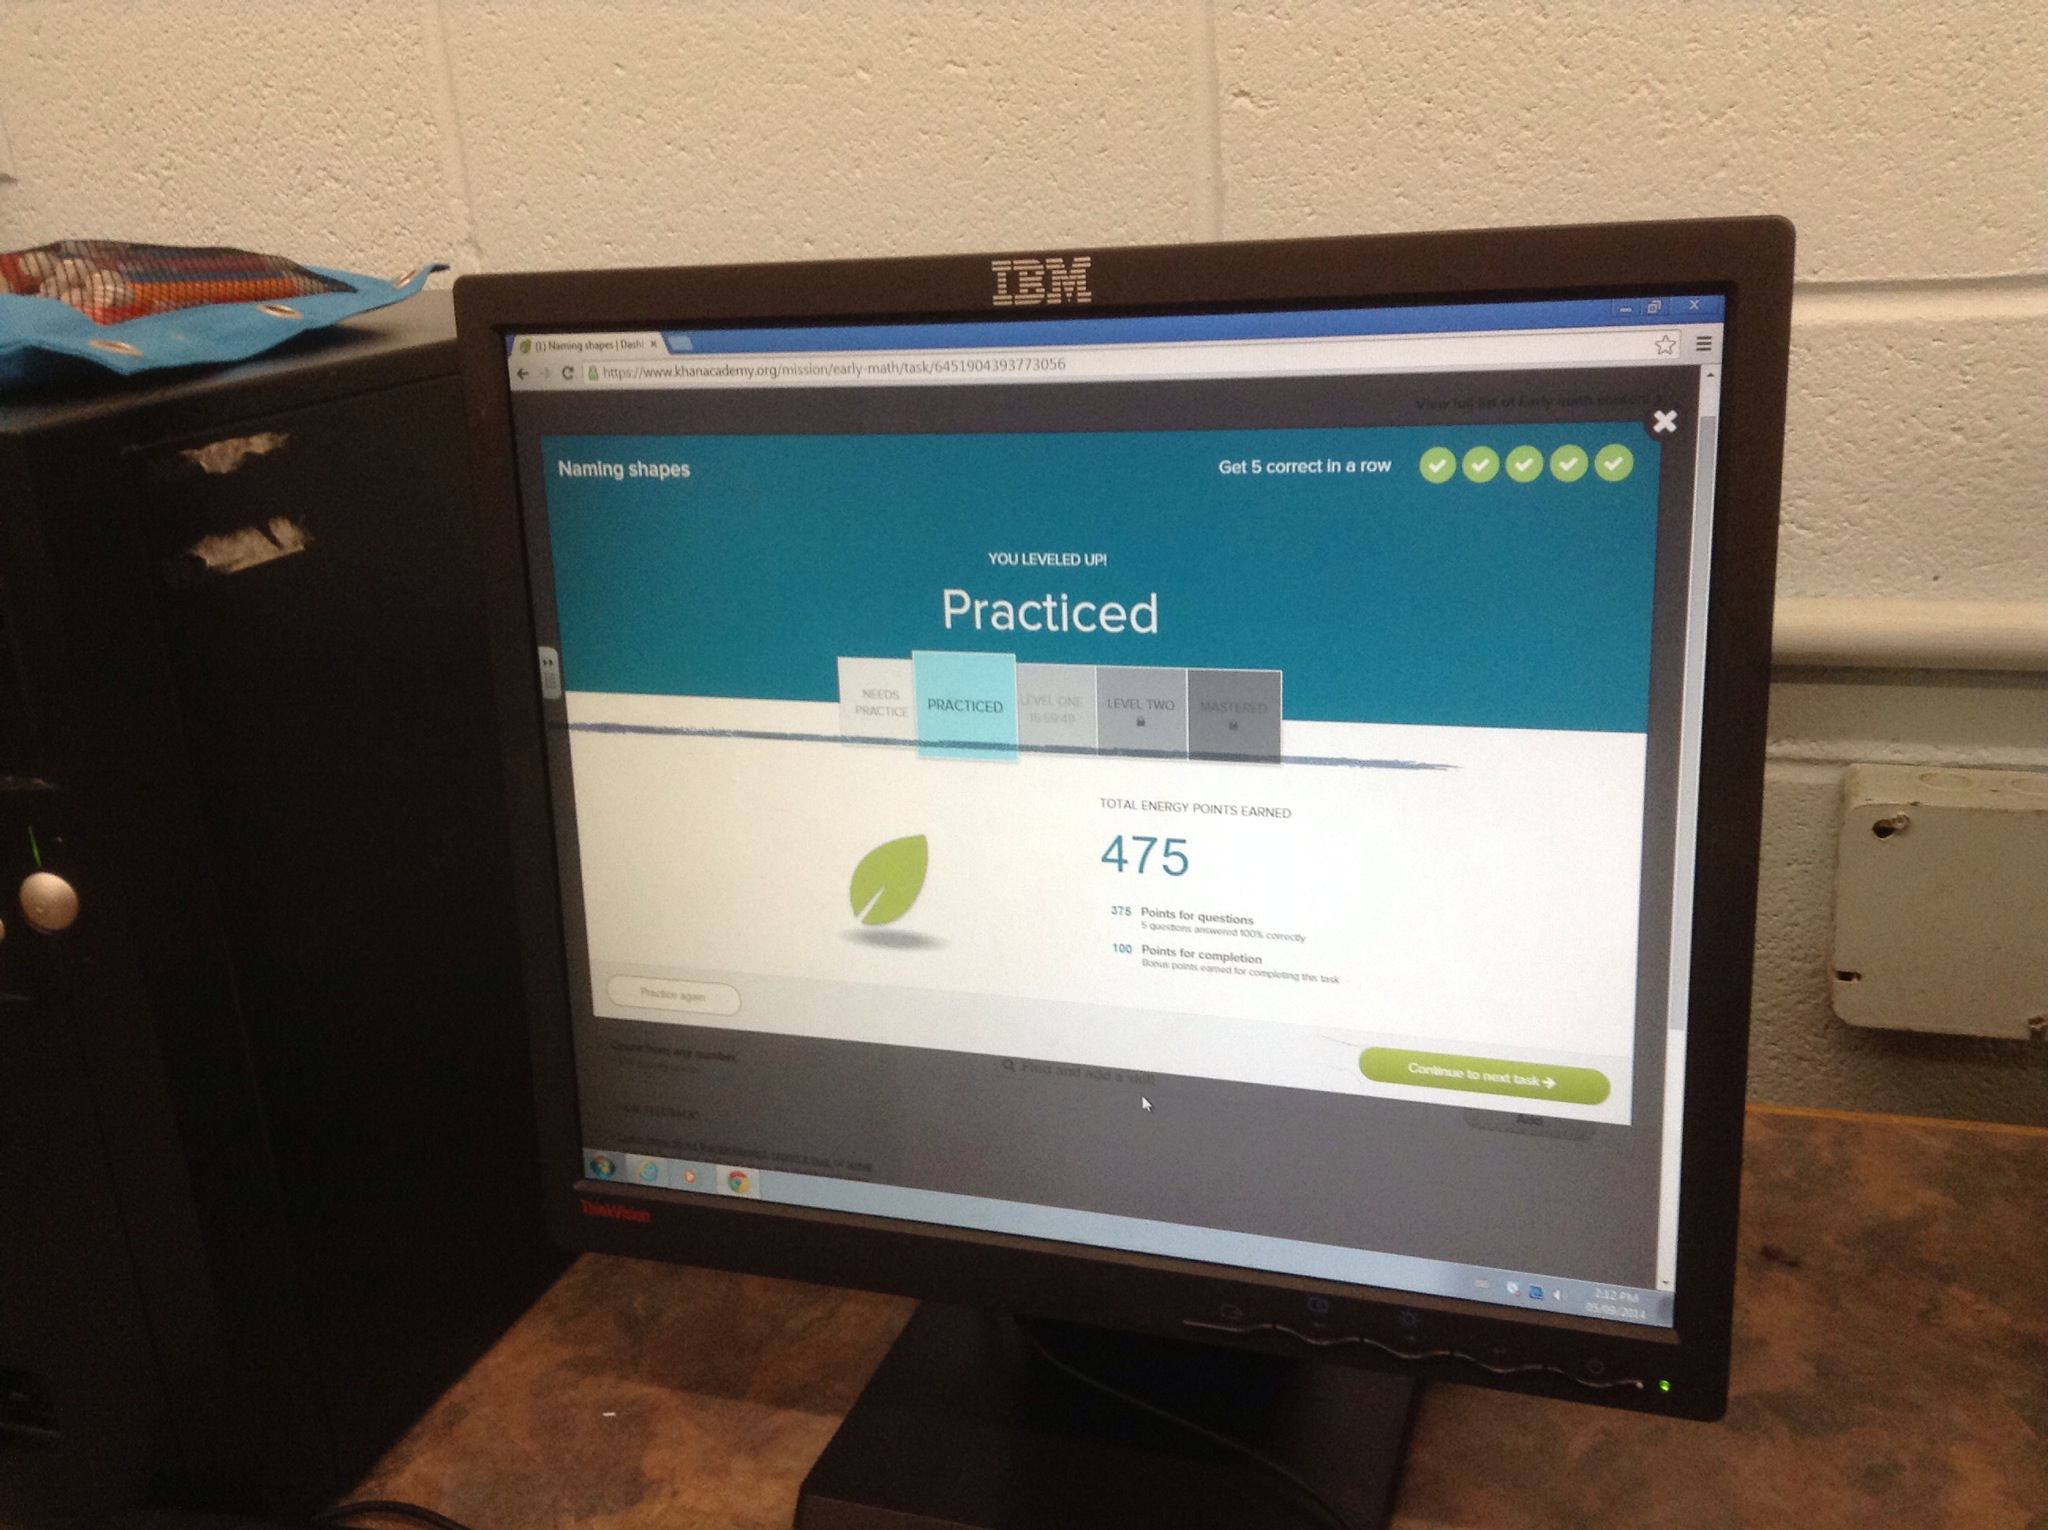
sometimes we’ll have khan activities for homework.
Graphing lines
We graphed a lot of lines today and reviewed how the graphs and equations are related.
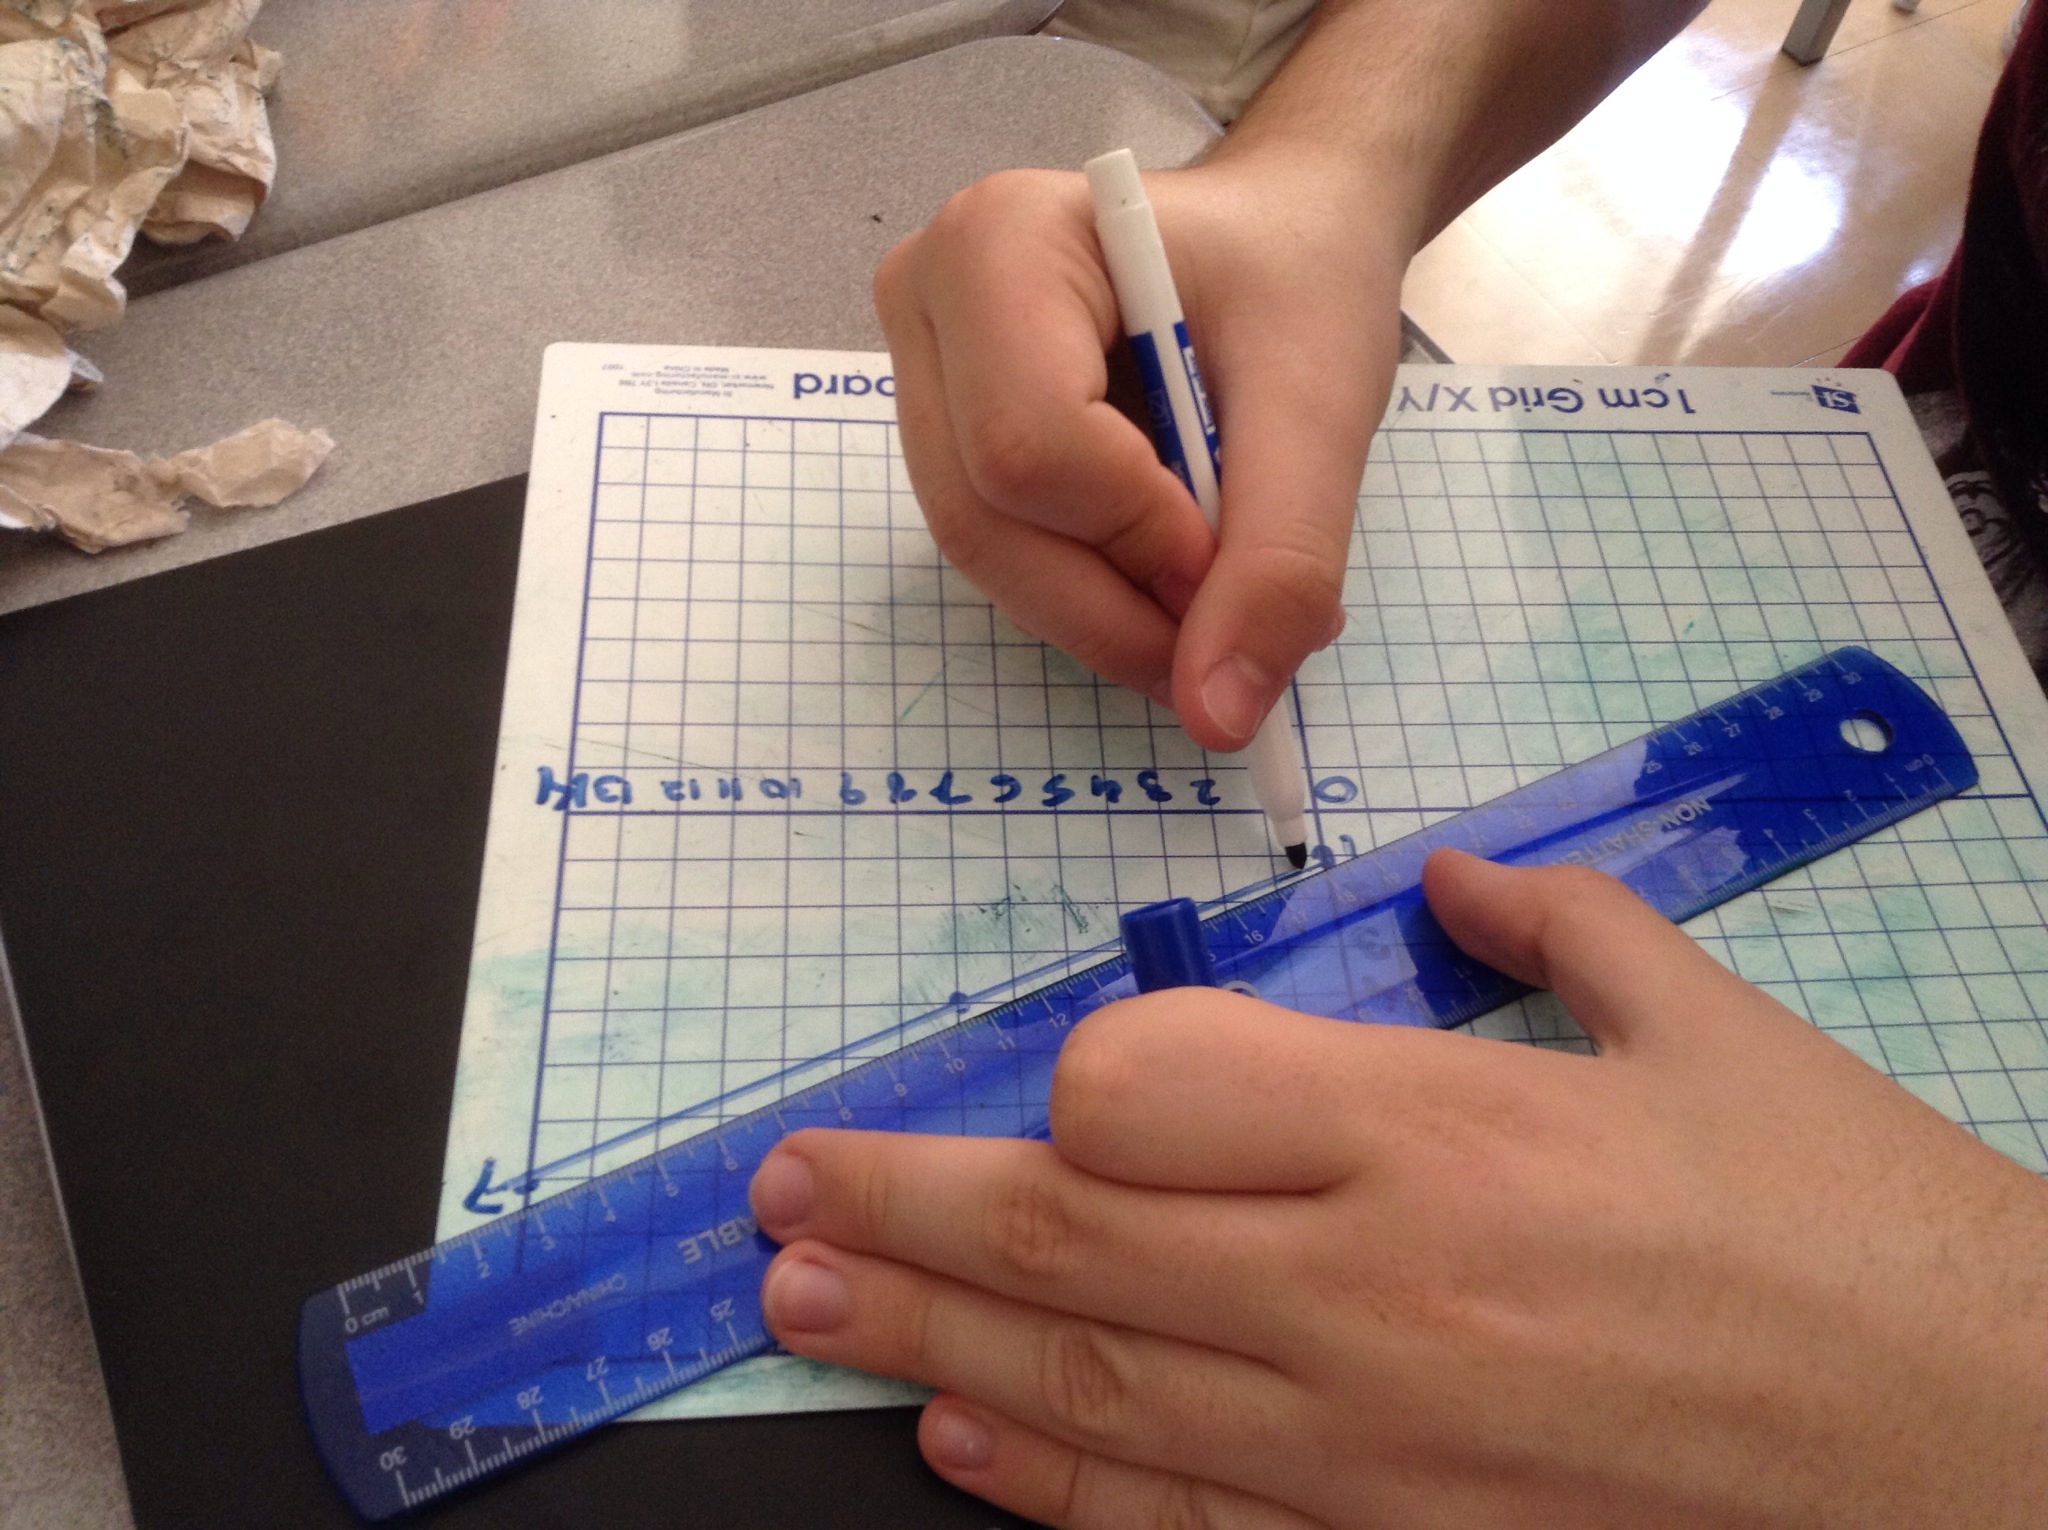
It’s fun to use the white boards, you can erase mistakes quickly and easily.
Flip da visor!
Look around Queen’s this week and you’ll see lots of cool kids with upside down visors.

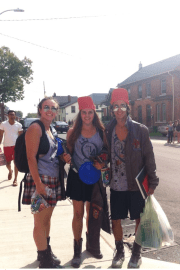
They must love dividing fractions!

Today we learned that to divide fractions you can flip the divisor (the 2nd fraction) and then multiply…not too hard at all.
Grade 9 Gardens
This is the start of our bean experiment. Each group is trying to sprout kidney beans and black eyed peas.

We put 5 of each type of bean, in moist paper towel.

Our gardens are enclosed in plastic bags on our window sill.

We hypothesized about the numbers of beans that would sprout and expressed our guess as a percent. We’ll keep watching the beans grow, and chart their height to see the trend.
Starting off Grade 10
Our first activity in grade 10 fostered teamwork and a little bit of math. The question was to determine how many plastic cups would be in a stack 6 feet tall.

There were a few different approaches to solving the problem mathematically, and many groups confirmed their calculations by building tall towers.

We wrote up solutions and then used post-its to comment on strengths and areas to improve upon.
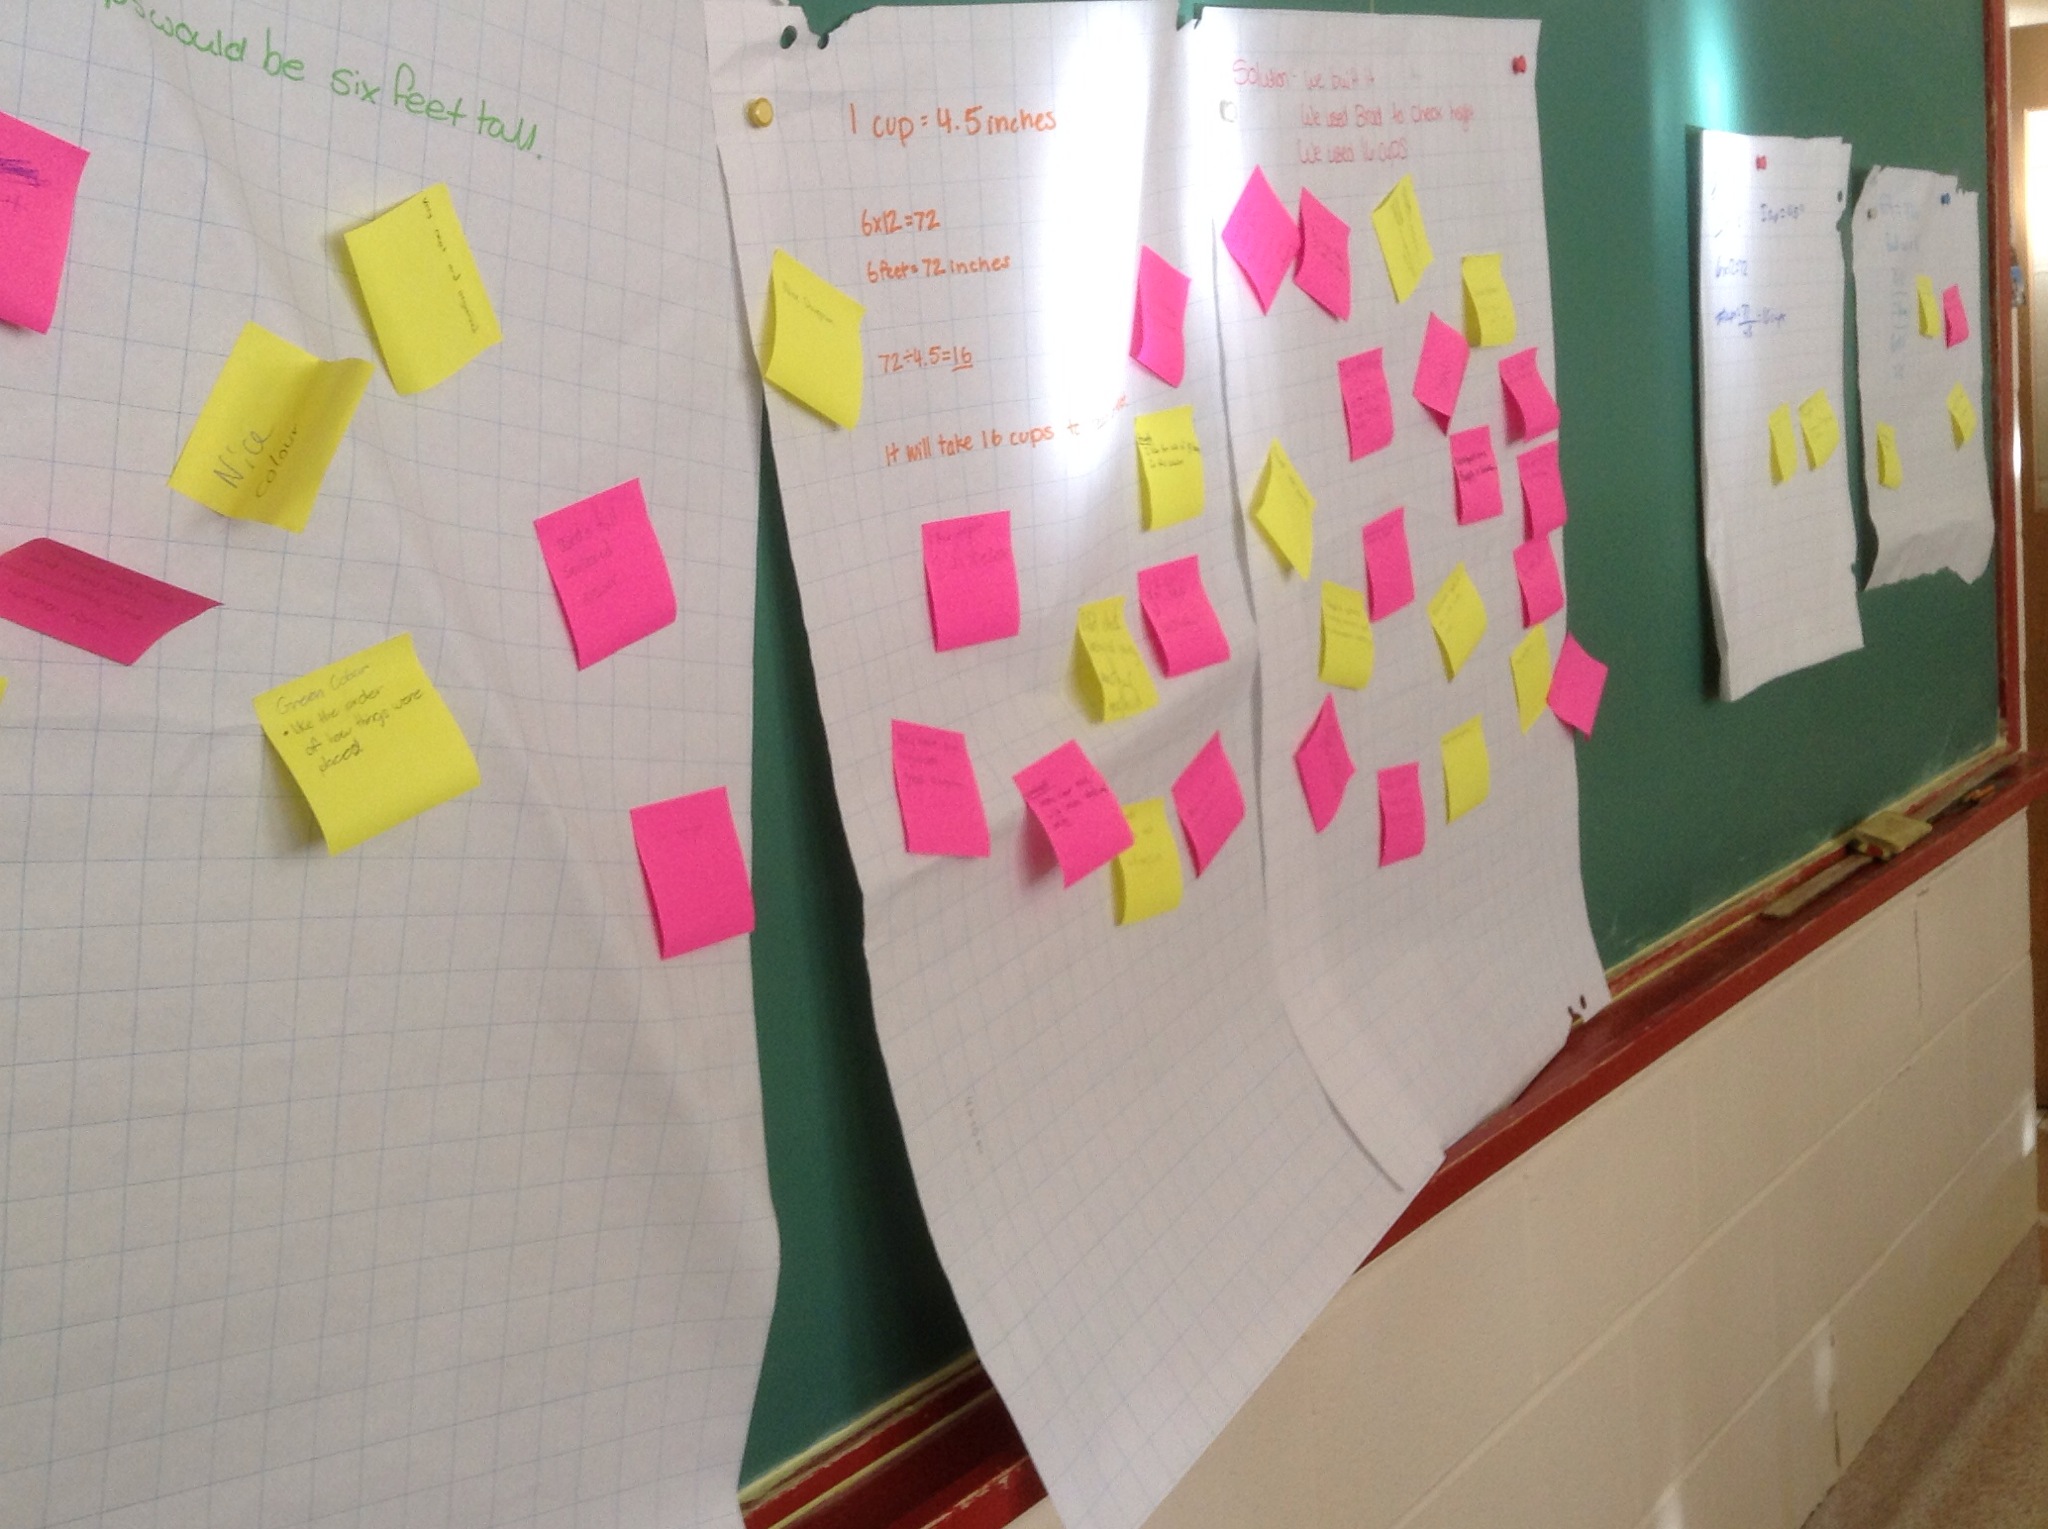
Good solutions should have words, numbers, equations, graphs, and a clear explanation of variables and assumptions. A clear diagram can be very useful for showing measurements.
