Solving with Relational Rods
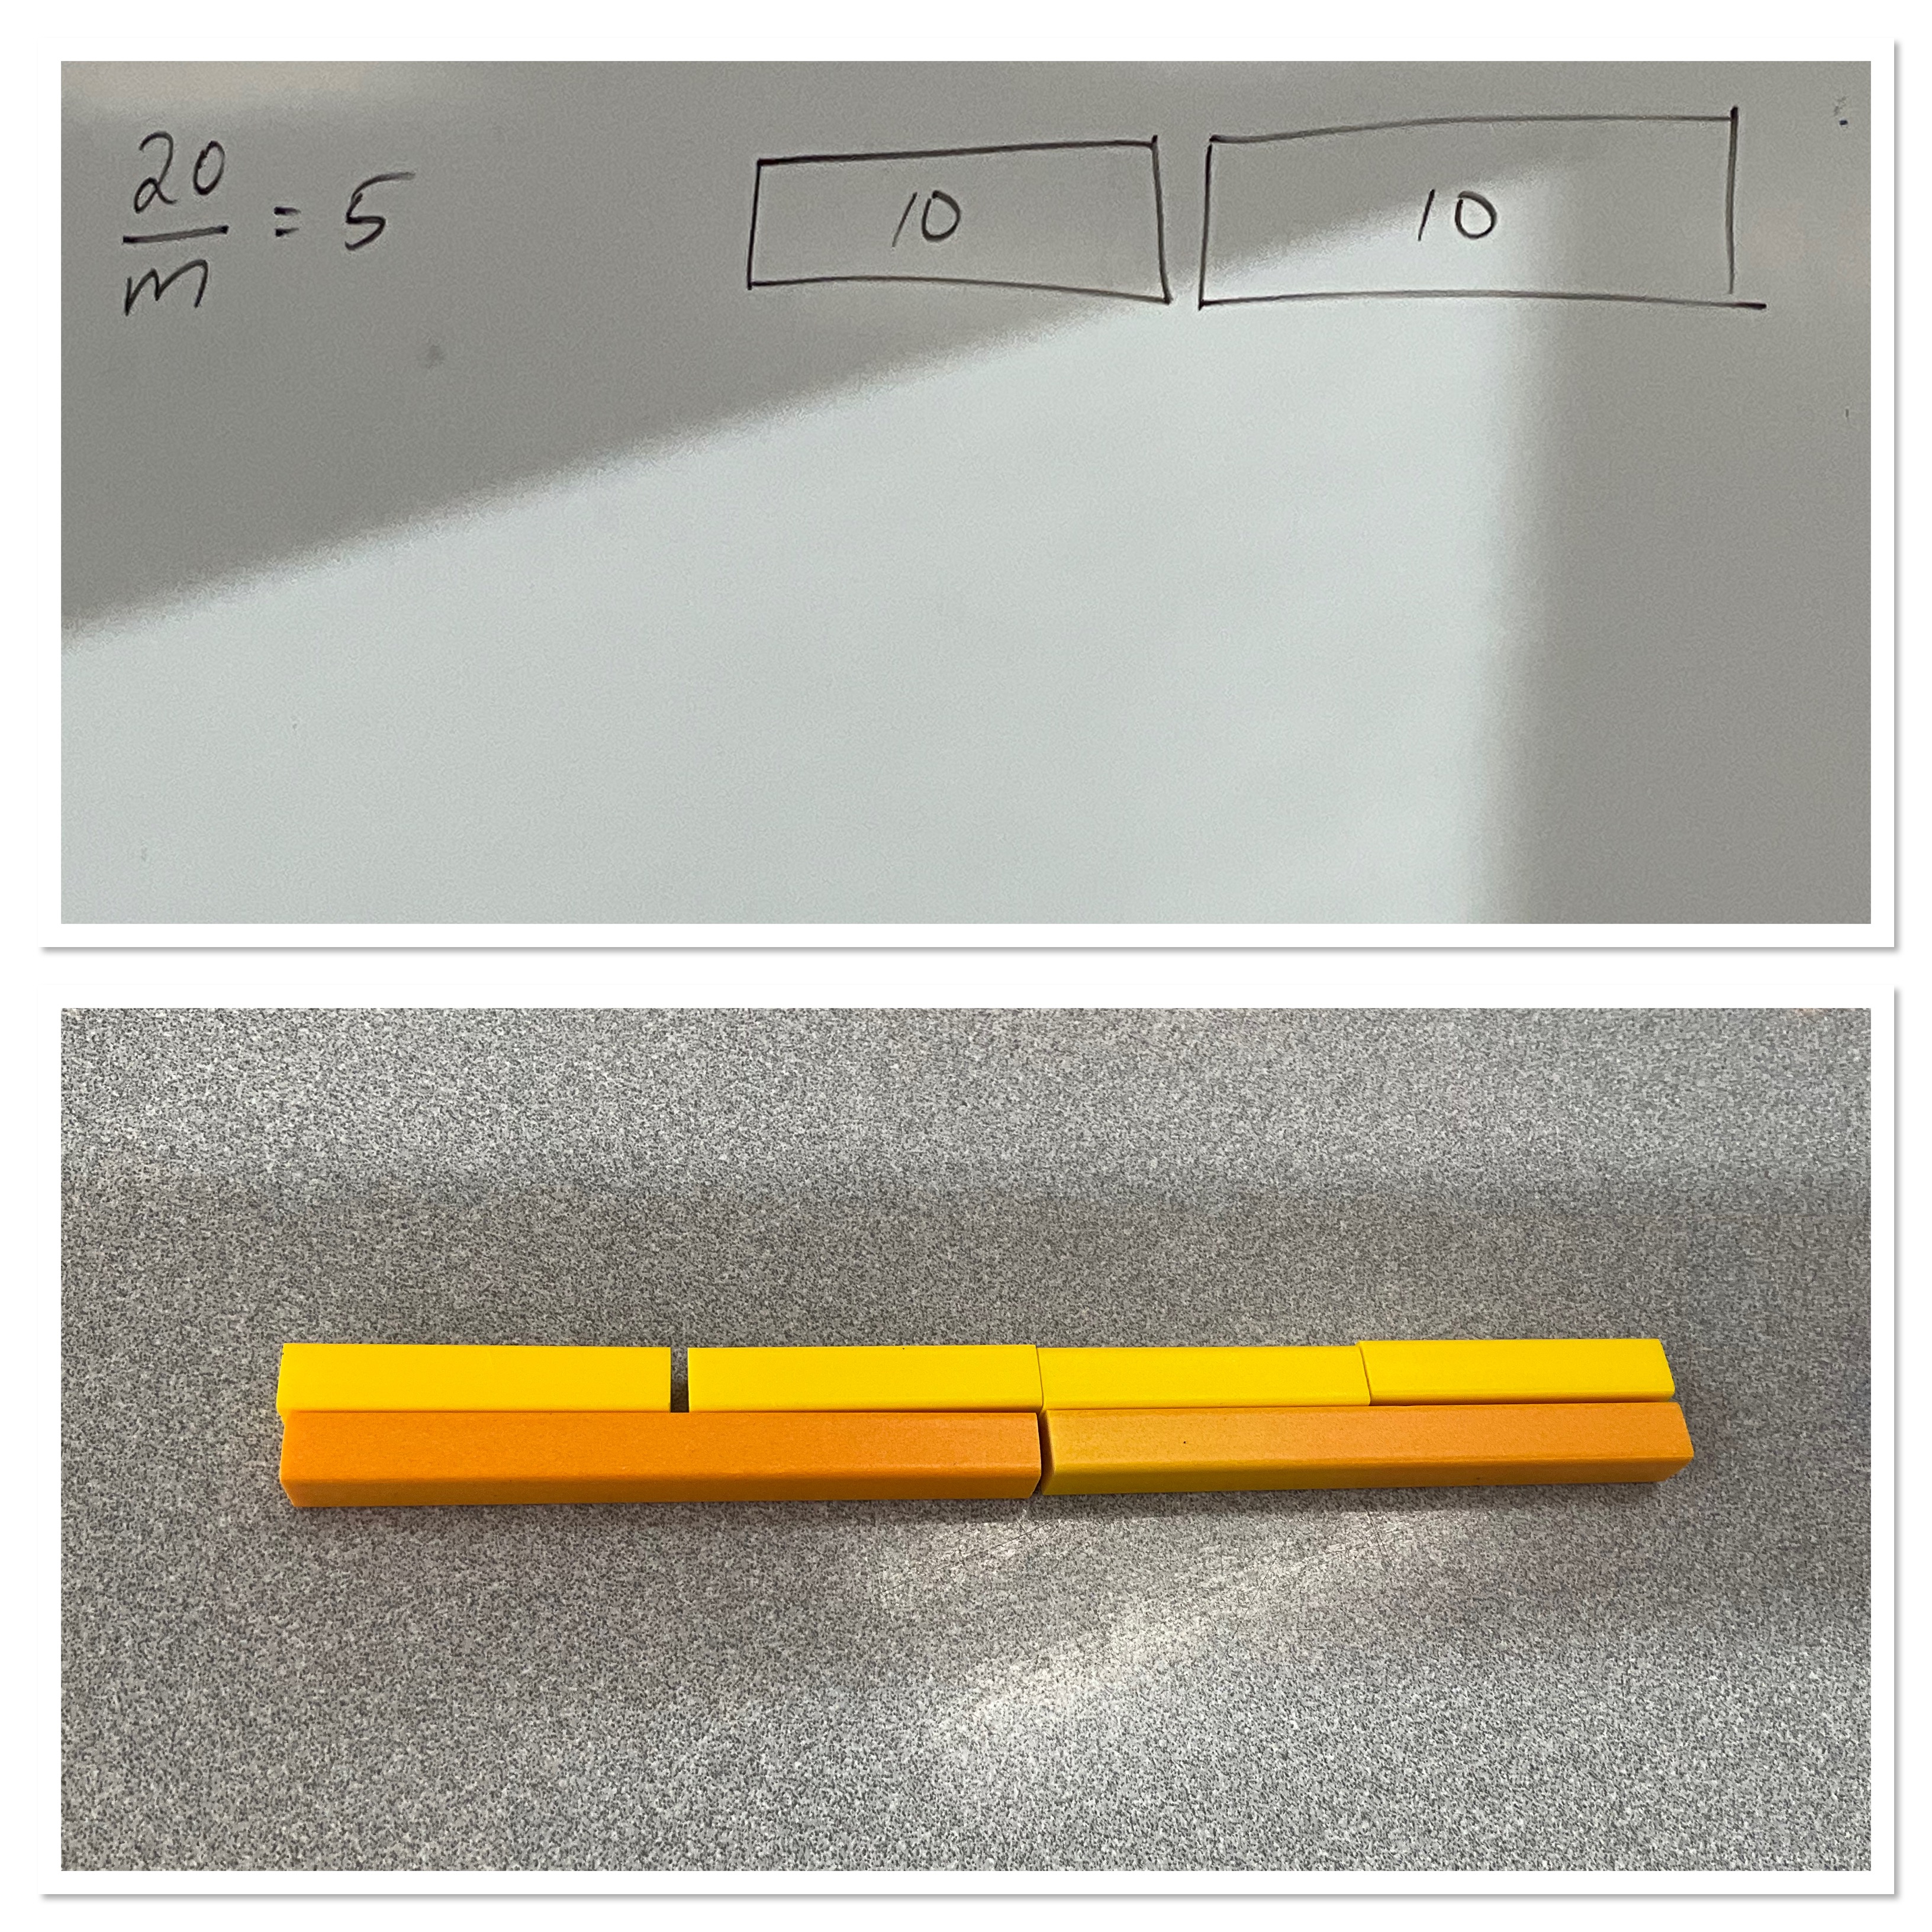
Today I was invited to see a lesson about solving equations using relational rods. This approach is new to me, and it was fun to learn alongside the students. Here we represent 20, and we know that when we split it into “m” pieces, the values of the pieces is 5. So we use 2 of the ten-rods to build 20, and we see that we need to split it up into groups of 5 (the light yellow is the 5 rod). There will be 4 groups, so m is 4.
Here’s another question: 4 groups of something equals 8. We know that the 8 rod is brown. We can use trial and error to find out what rods equal 8 when we use 4 of the same. The red rod works, and has a value of 2.

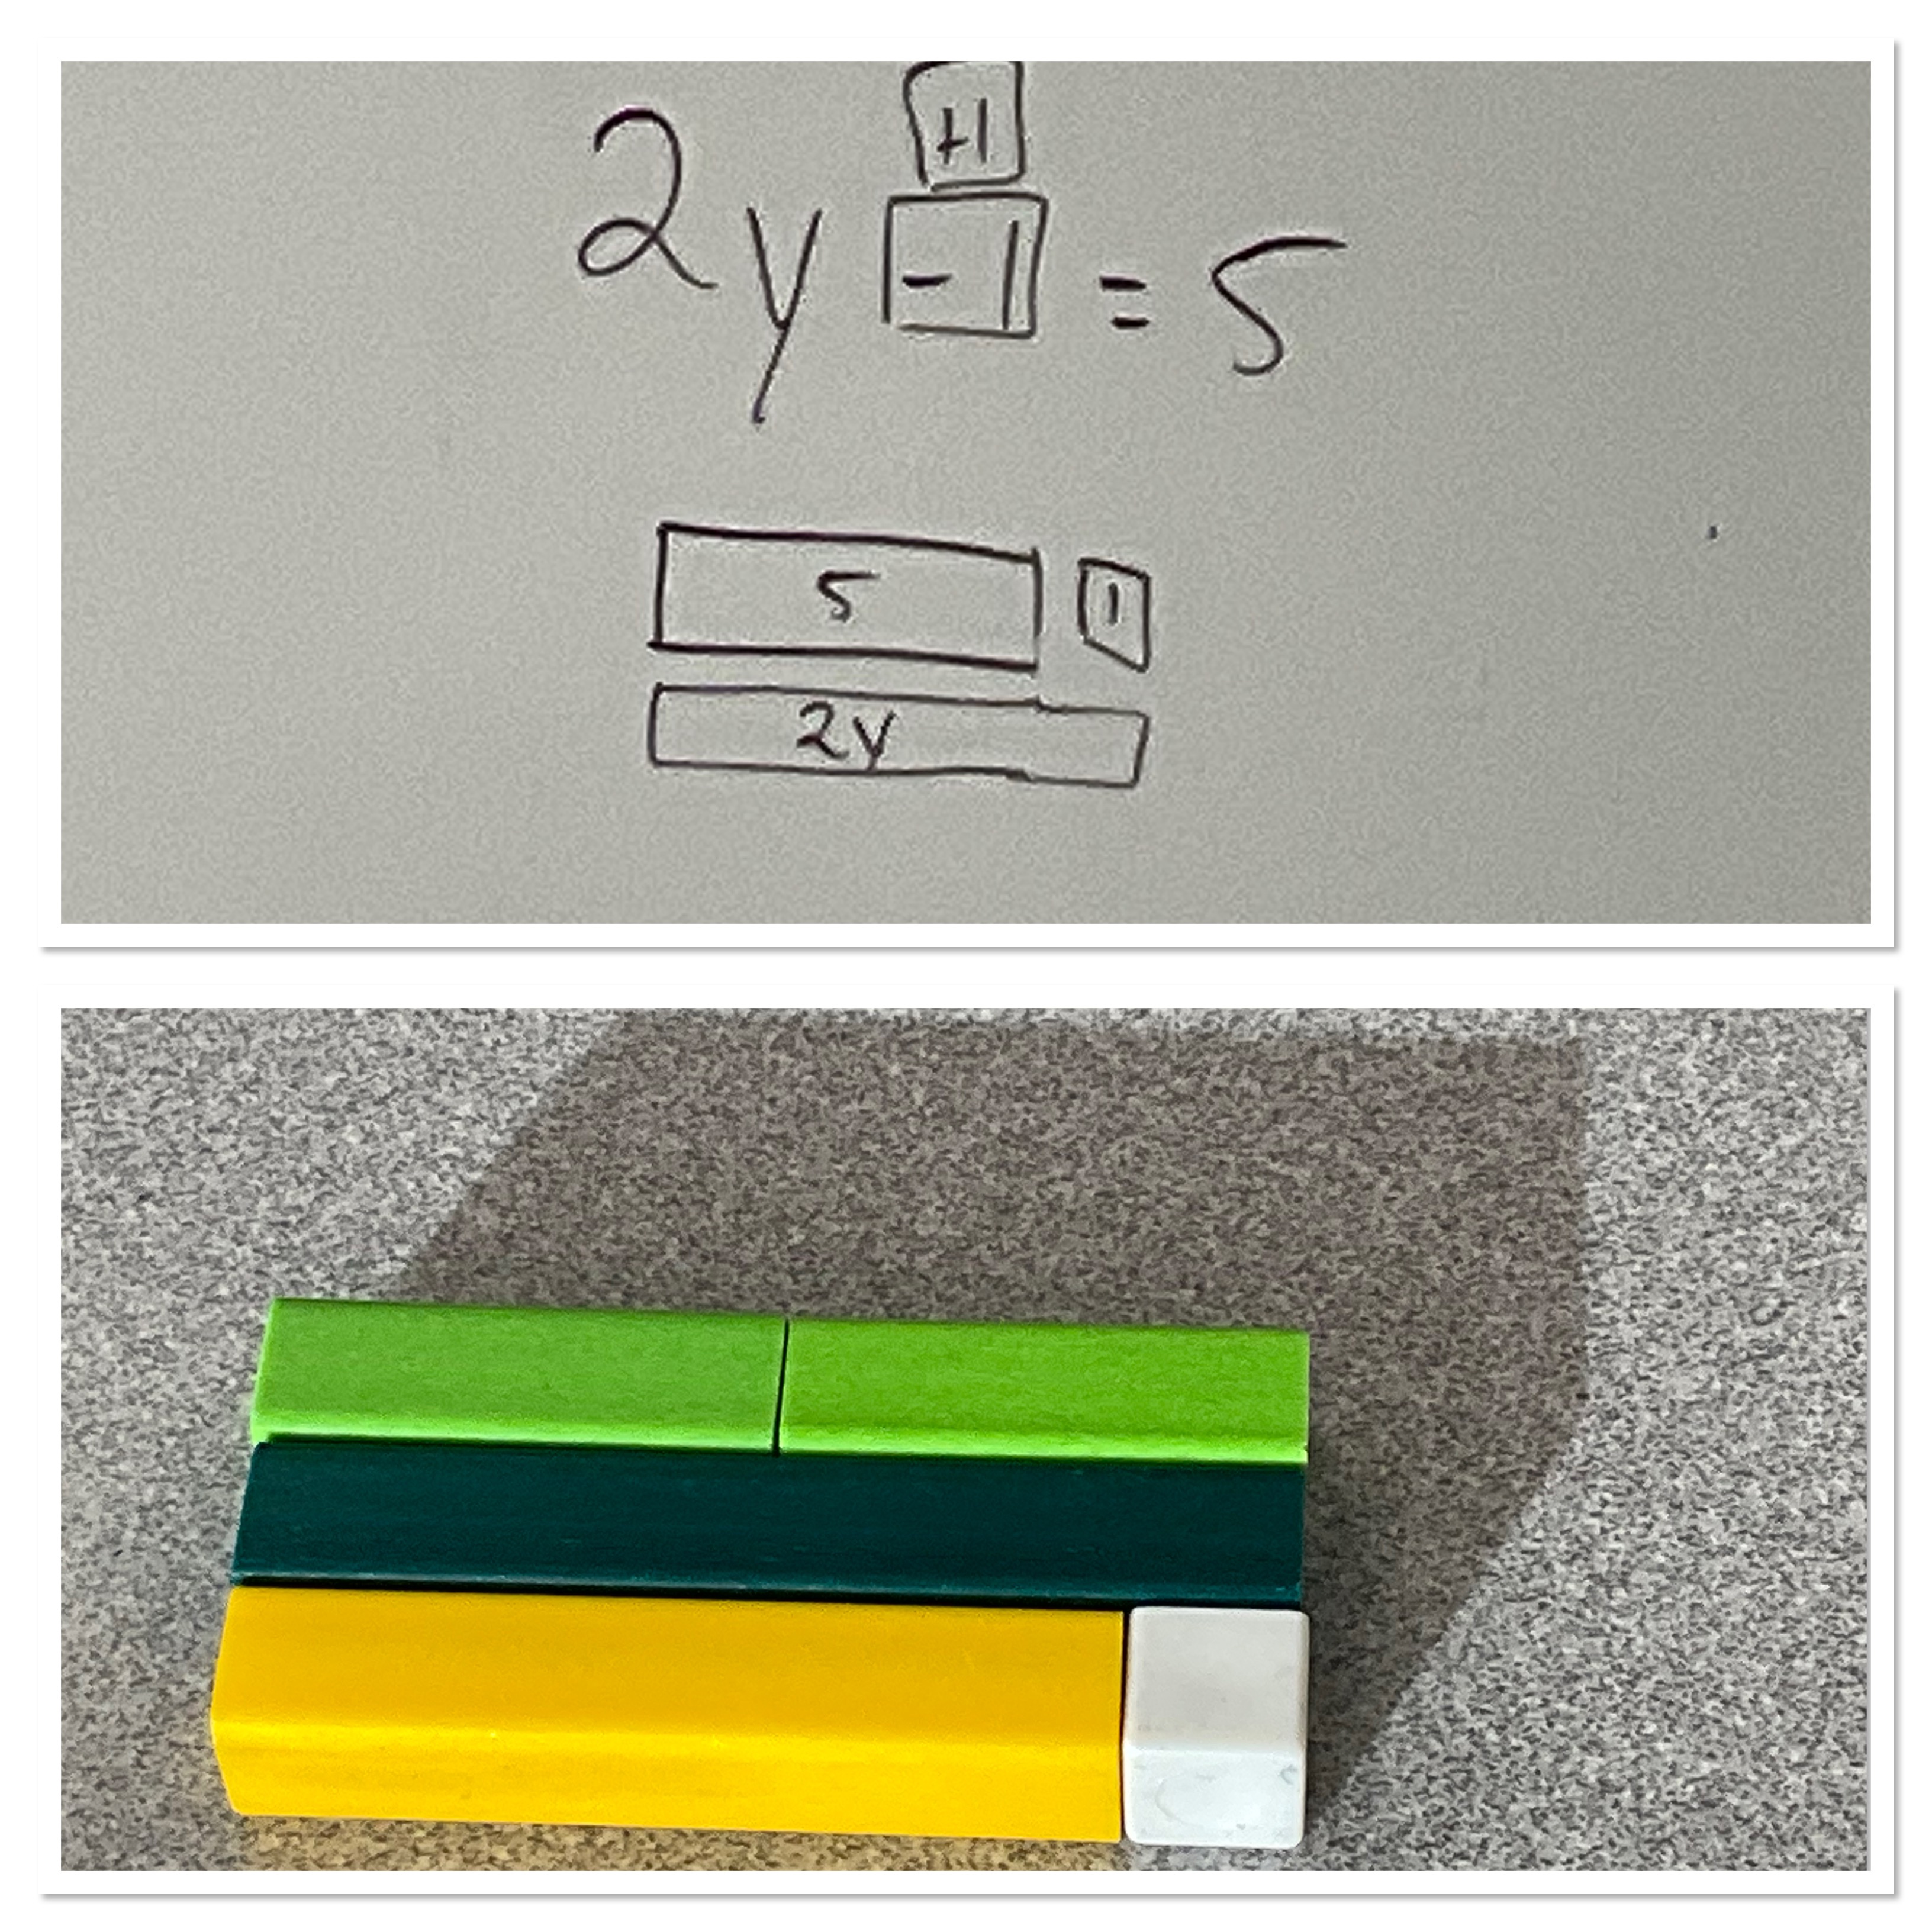
Here’s a more complicated one. 2 groups of something, minus 1, is equal to 5. That means 2 groups of something is one bigger than 5. 2 groups of something is equal to 6. The 5 rod (yellow) plus 1 (white) is equal to 6 (dark green). If we need to find a rod that can fit 2 into the space of the dark green, it’s the light green one, which is 3.
Here’s another: 2 groups of something, plus 6 equals 14. We build 14 from a 10 rod and 4 one rods (lots of other options we could have done). We know that 6 is a dark green. I need to now fill on the empty gap with 2 equal blocks. We can use the purple which is 4. Z=4

Here’s one last one, that was interesting….there were 2 ways to solve. The first way involved building 27. We used 2 ten rods and a seven rod. Then we used a 9 rod (blue) and had to fill on the gap with 2 equal sized pieces. Those pieces happen to also be 9s. We know a=9.
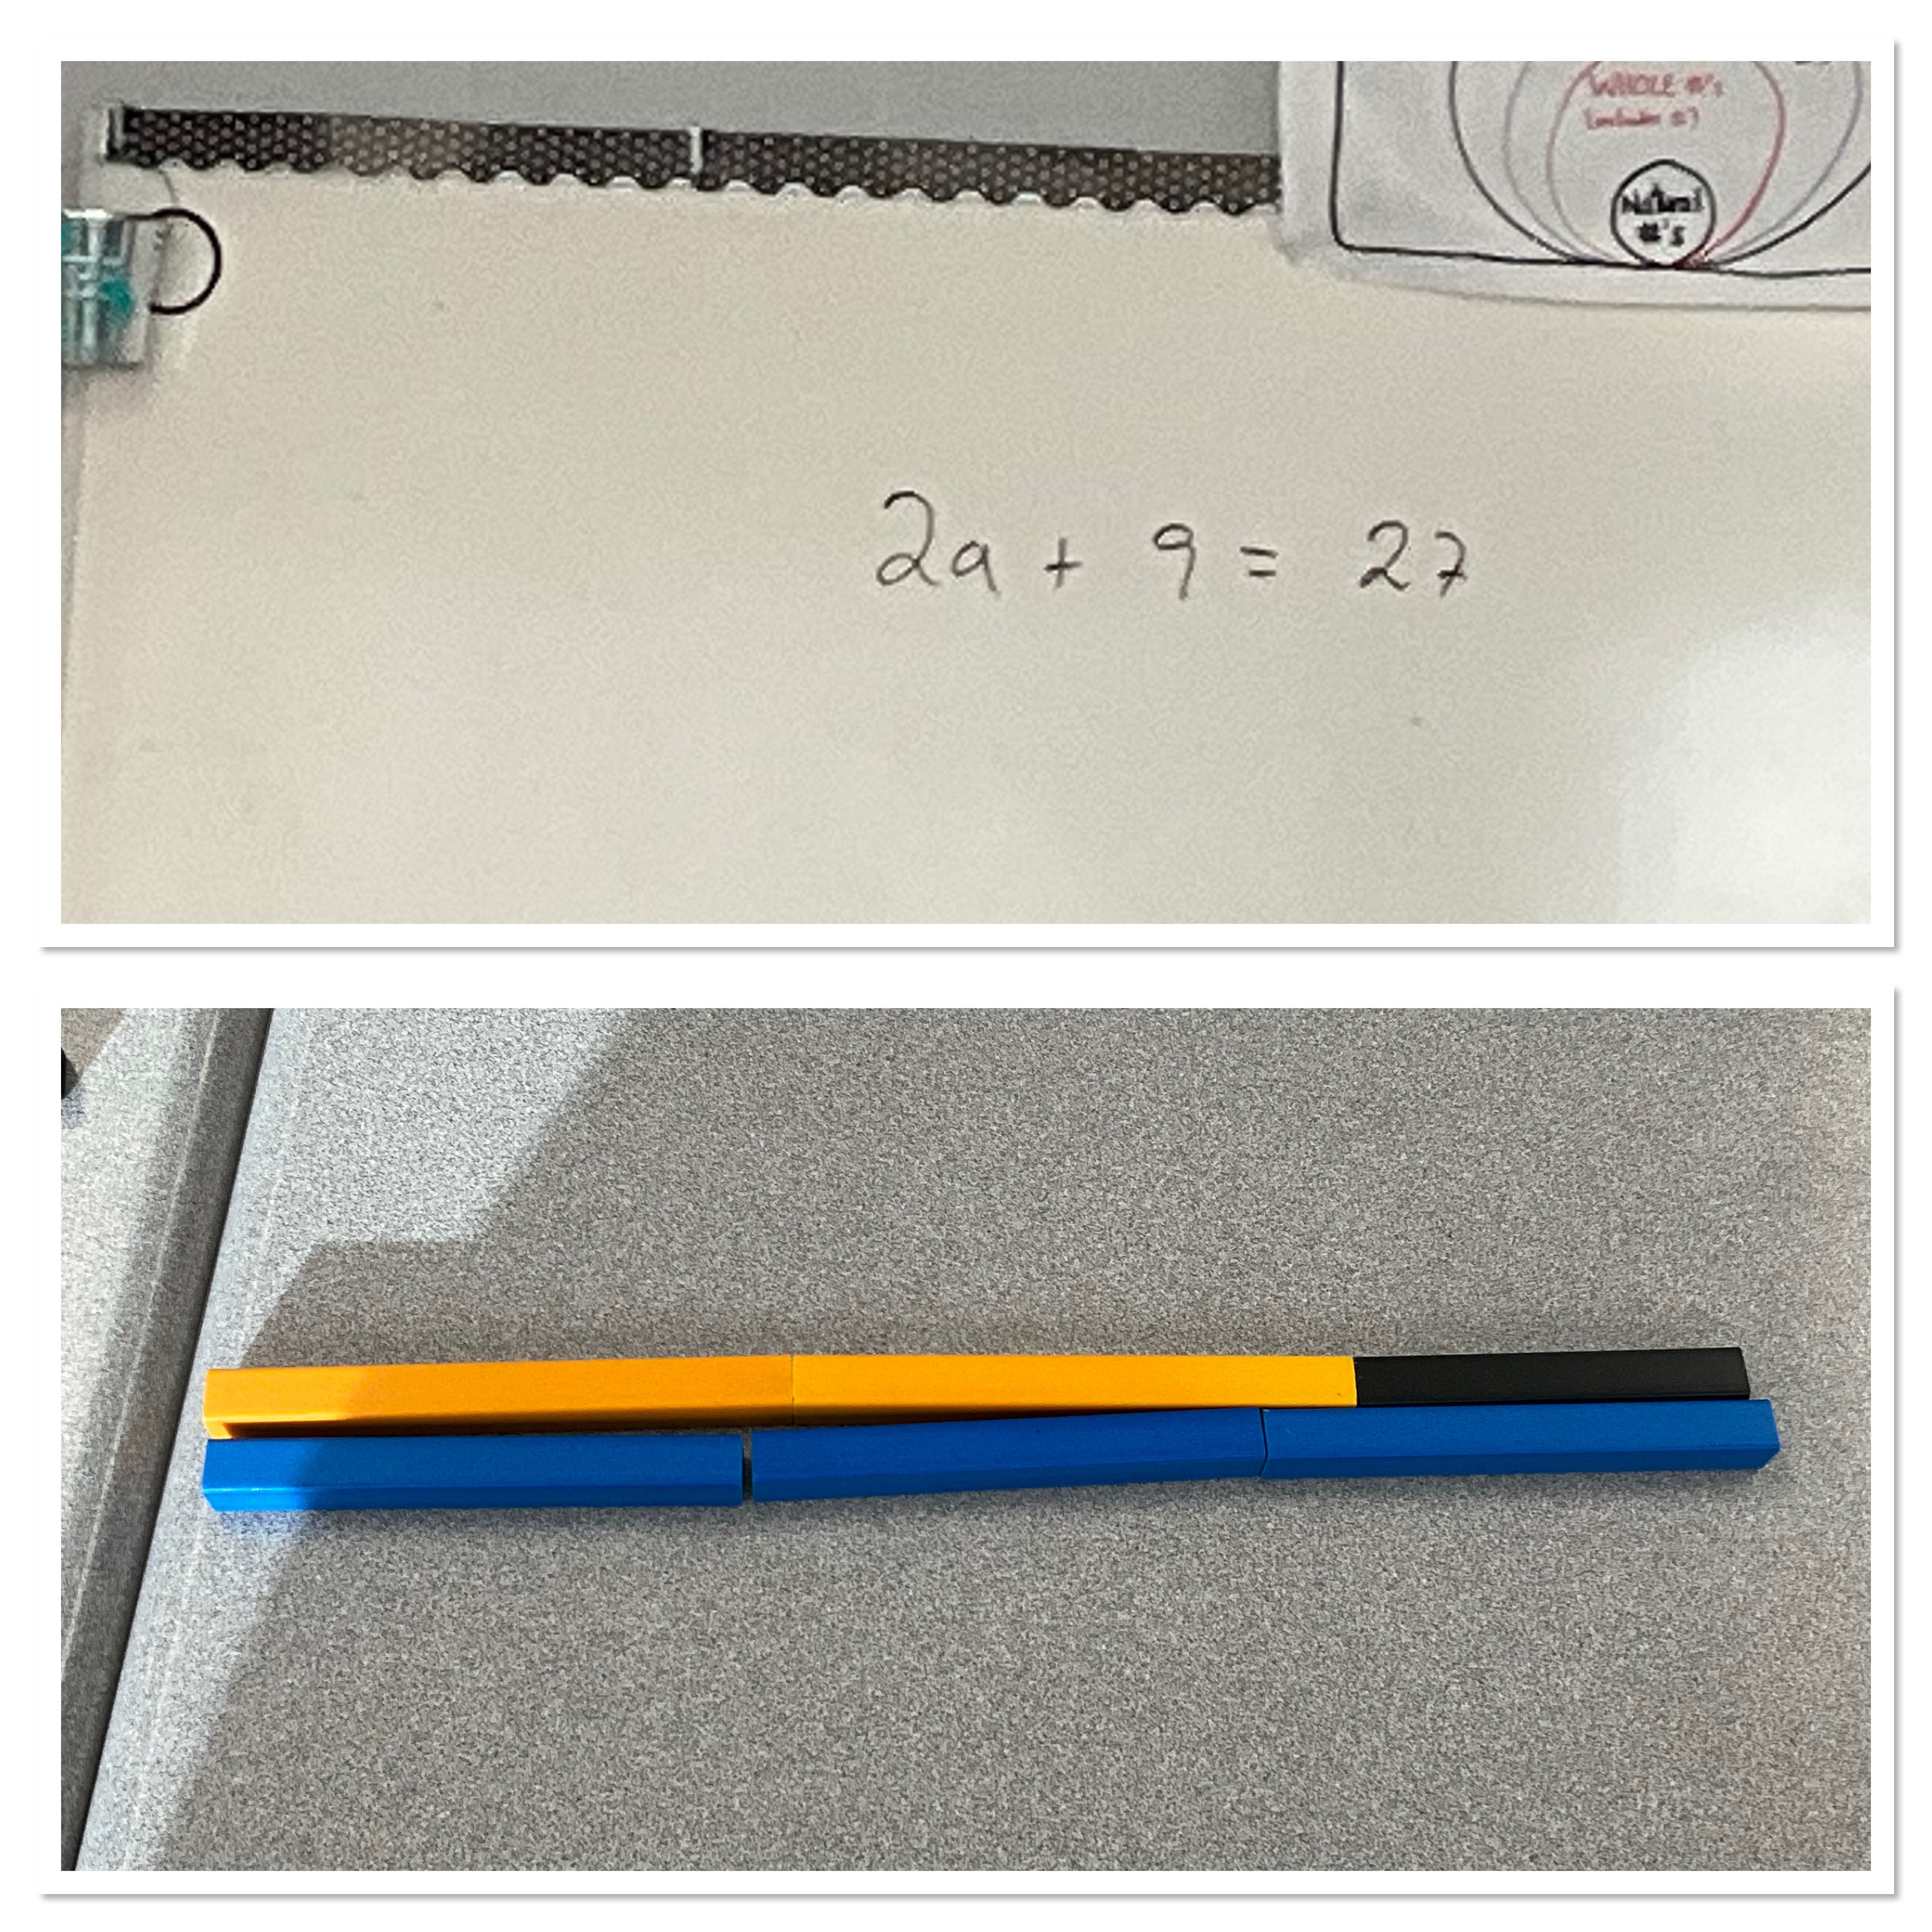
If we had built the 27 in a different way, we can see another property. We can build 27 as 3 nine rods (blue). Then we can build the 2a+9, so we put a 9 on top. We can see that on the top and bottom we have 9s, so those 9s are not needed…and can be eliminated. Now we just need to find 2 pieces that are equal to 18 total, which we can easily see are 9 and 9.

We followed this up with a bit of practice using algebra tiles to solve equations as well. It was a great learning experience for me.
Would you Rather?
Today in my MFM2P class we did some work on being a good group member. We talked about what we do when working with a partner. We share the marker and both contribute. We use clean language that is encouraging, respectful and positive. We ask good questions and learn from each other. We write our thinking so other groups can learn from us, and we listen with our ears AND our brain.
We did some review of graphing lines, to close some gaps made visible on yesterday’s test. We worked on graphing y=2x+4, y=2x+6, y=2x, and y=-2x+3. Then we looked for intersection points.
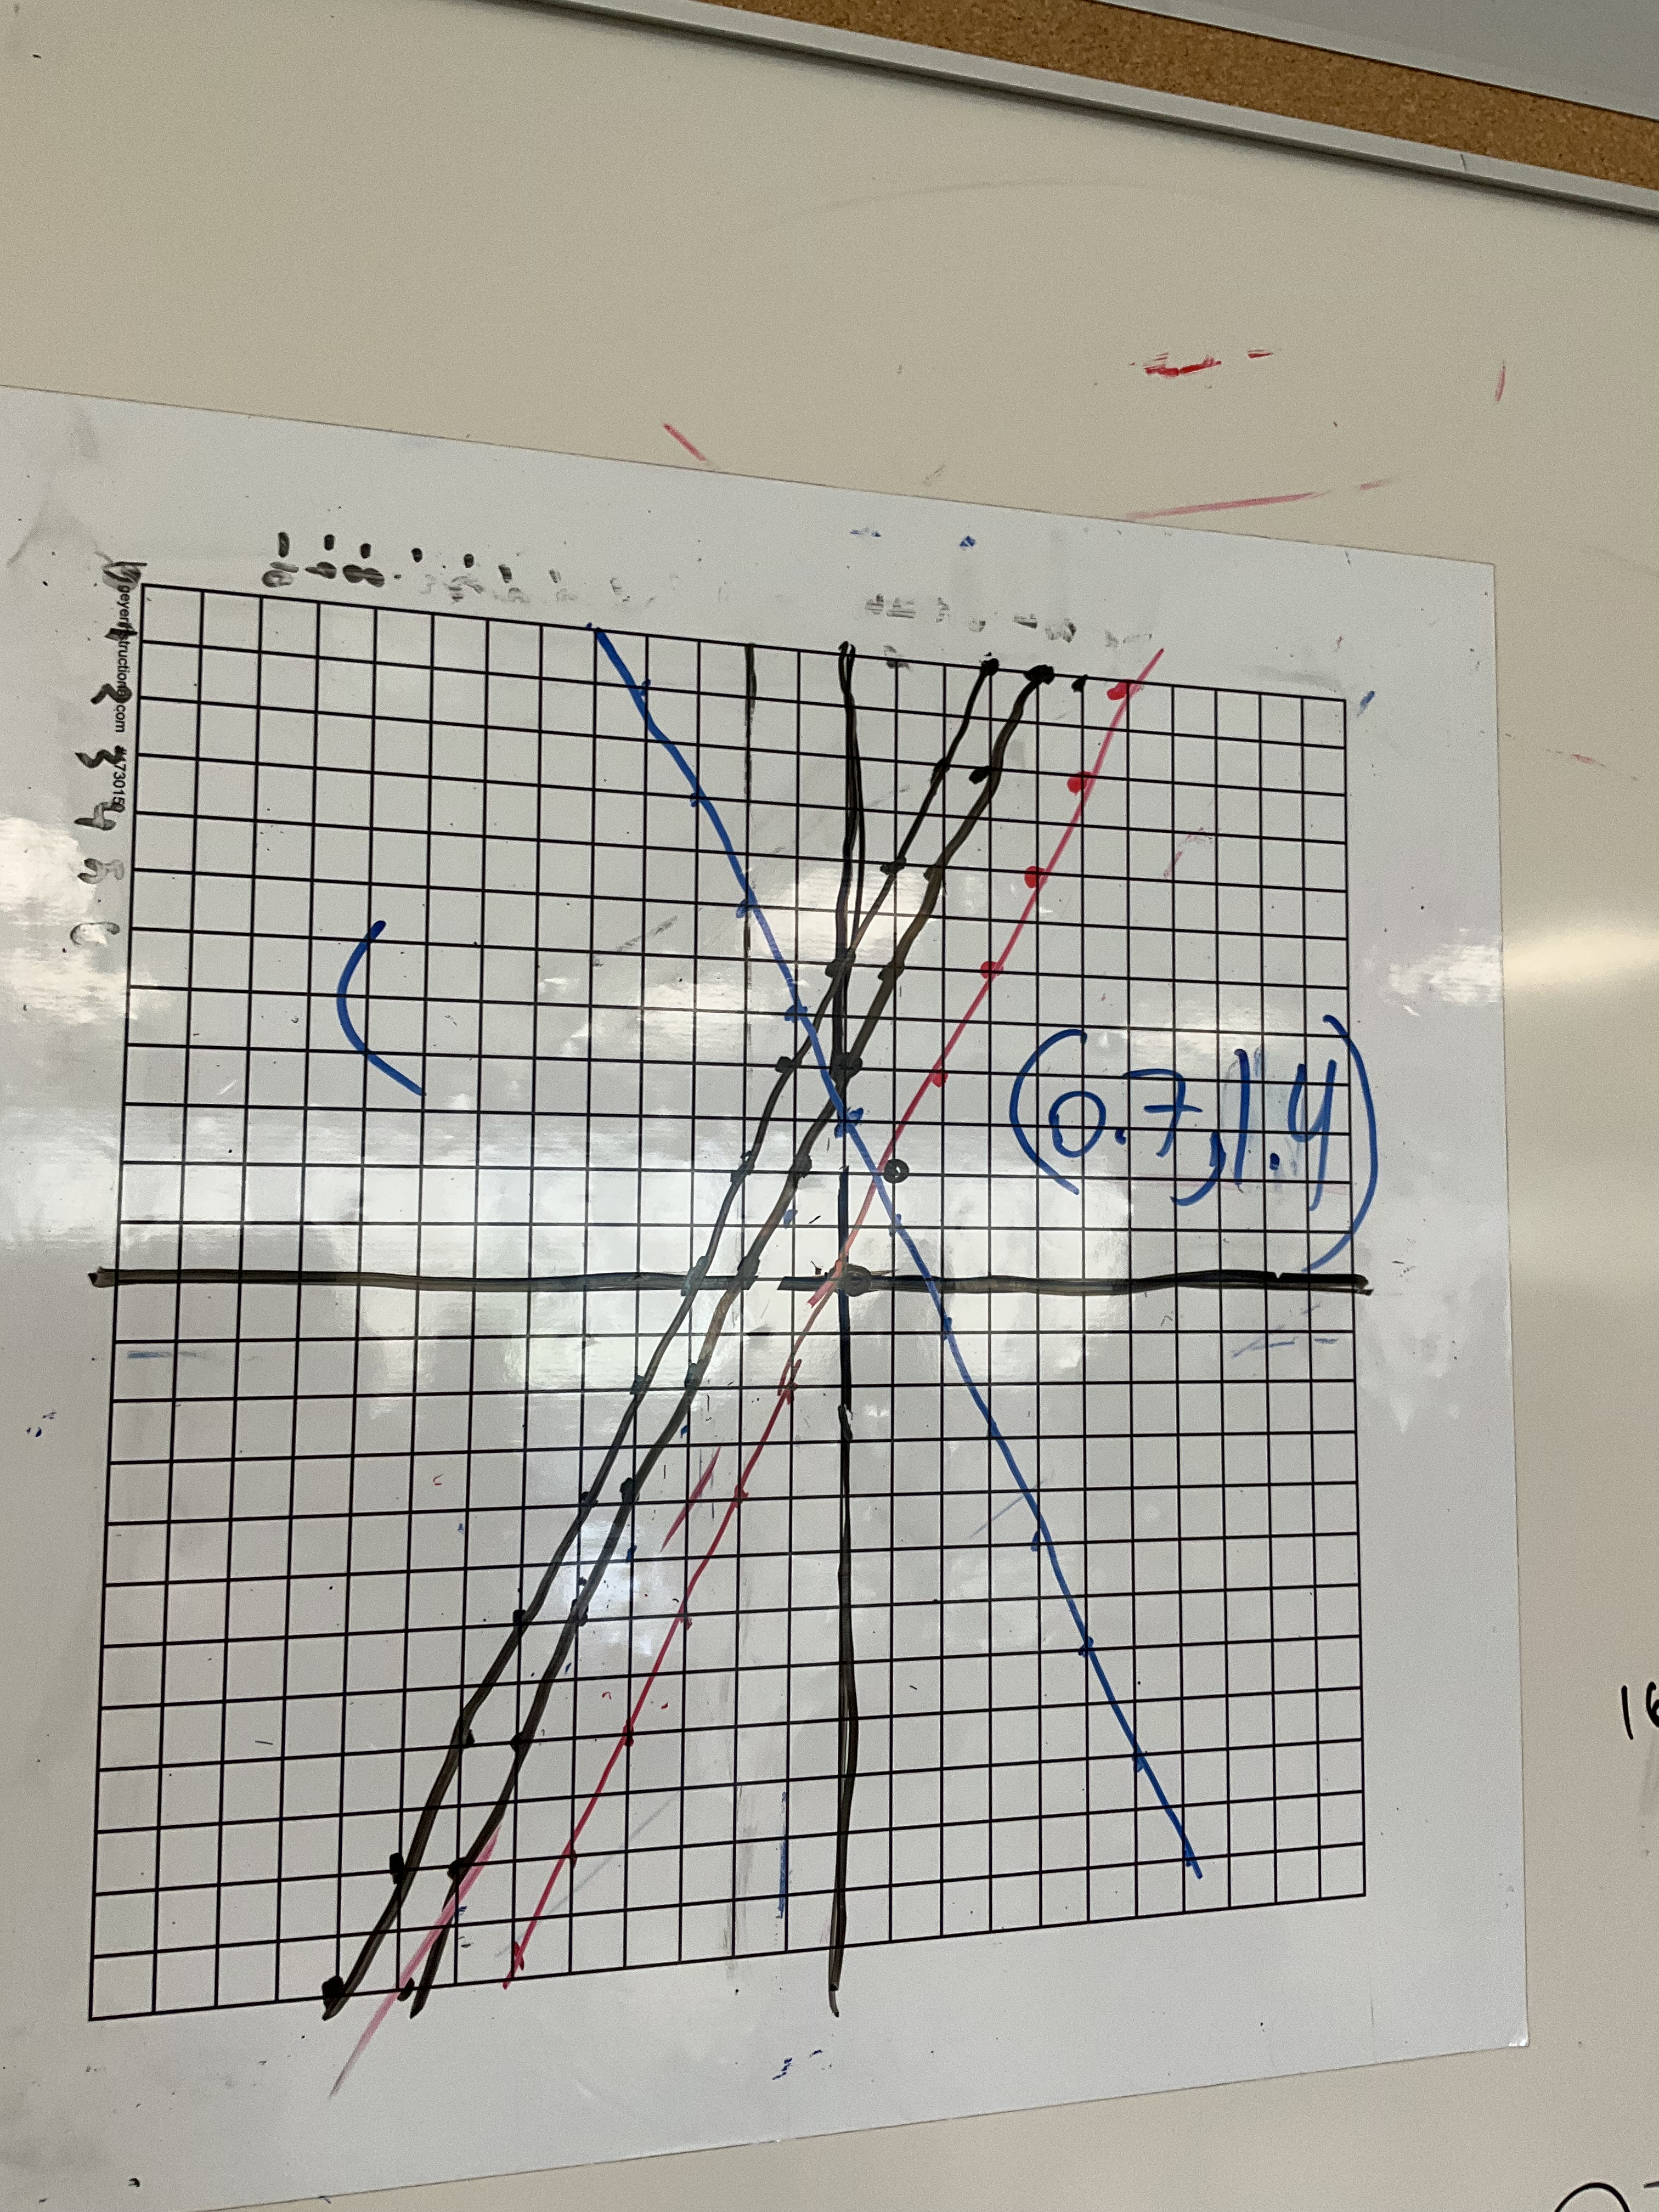
We noticed what makes lines parallel, and what positive and negative slopes look like, and what the constant in the equation means.
The next challenge we had was a would you rather challenge.
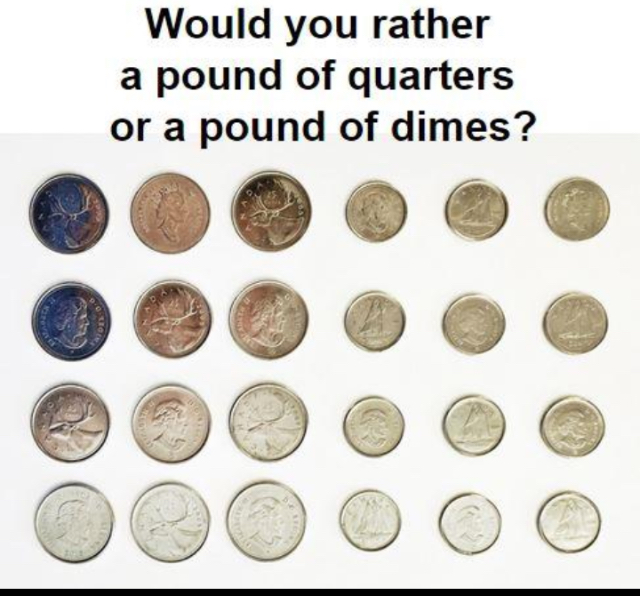
I had never tried this question before. It was a good chance to talk about what a pound is, what quarters and dimes are, and what information we’d need to solve the problem.
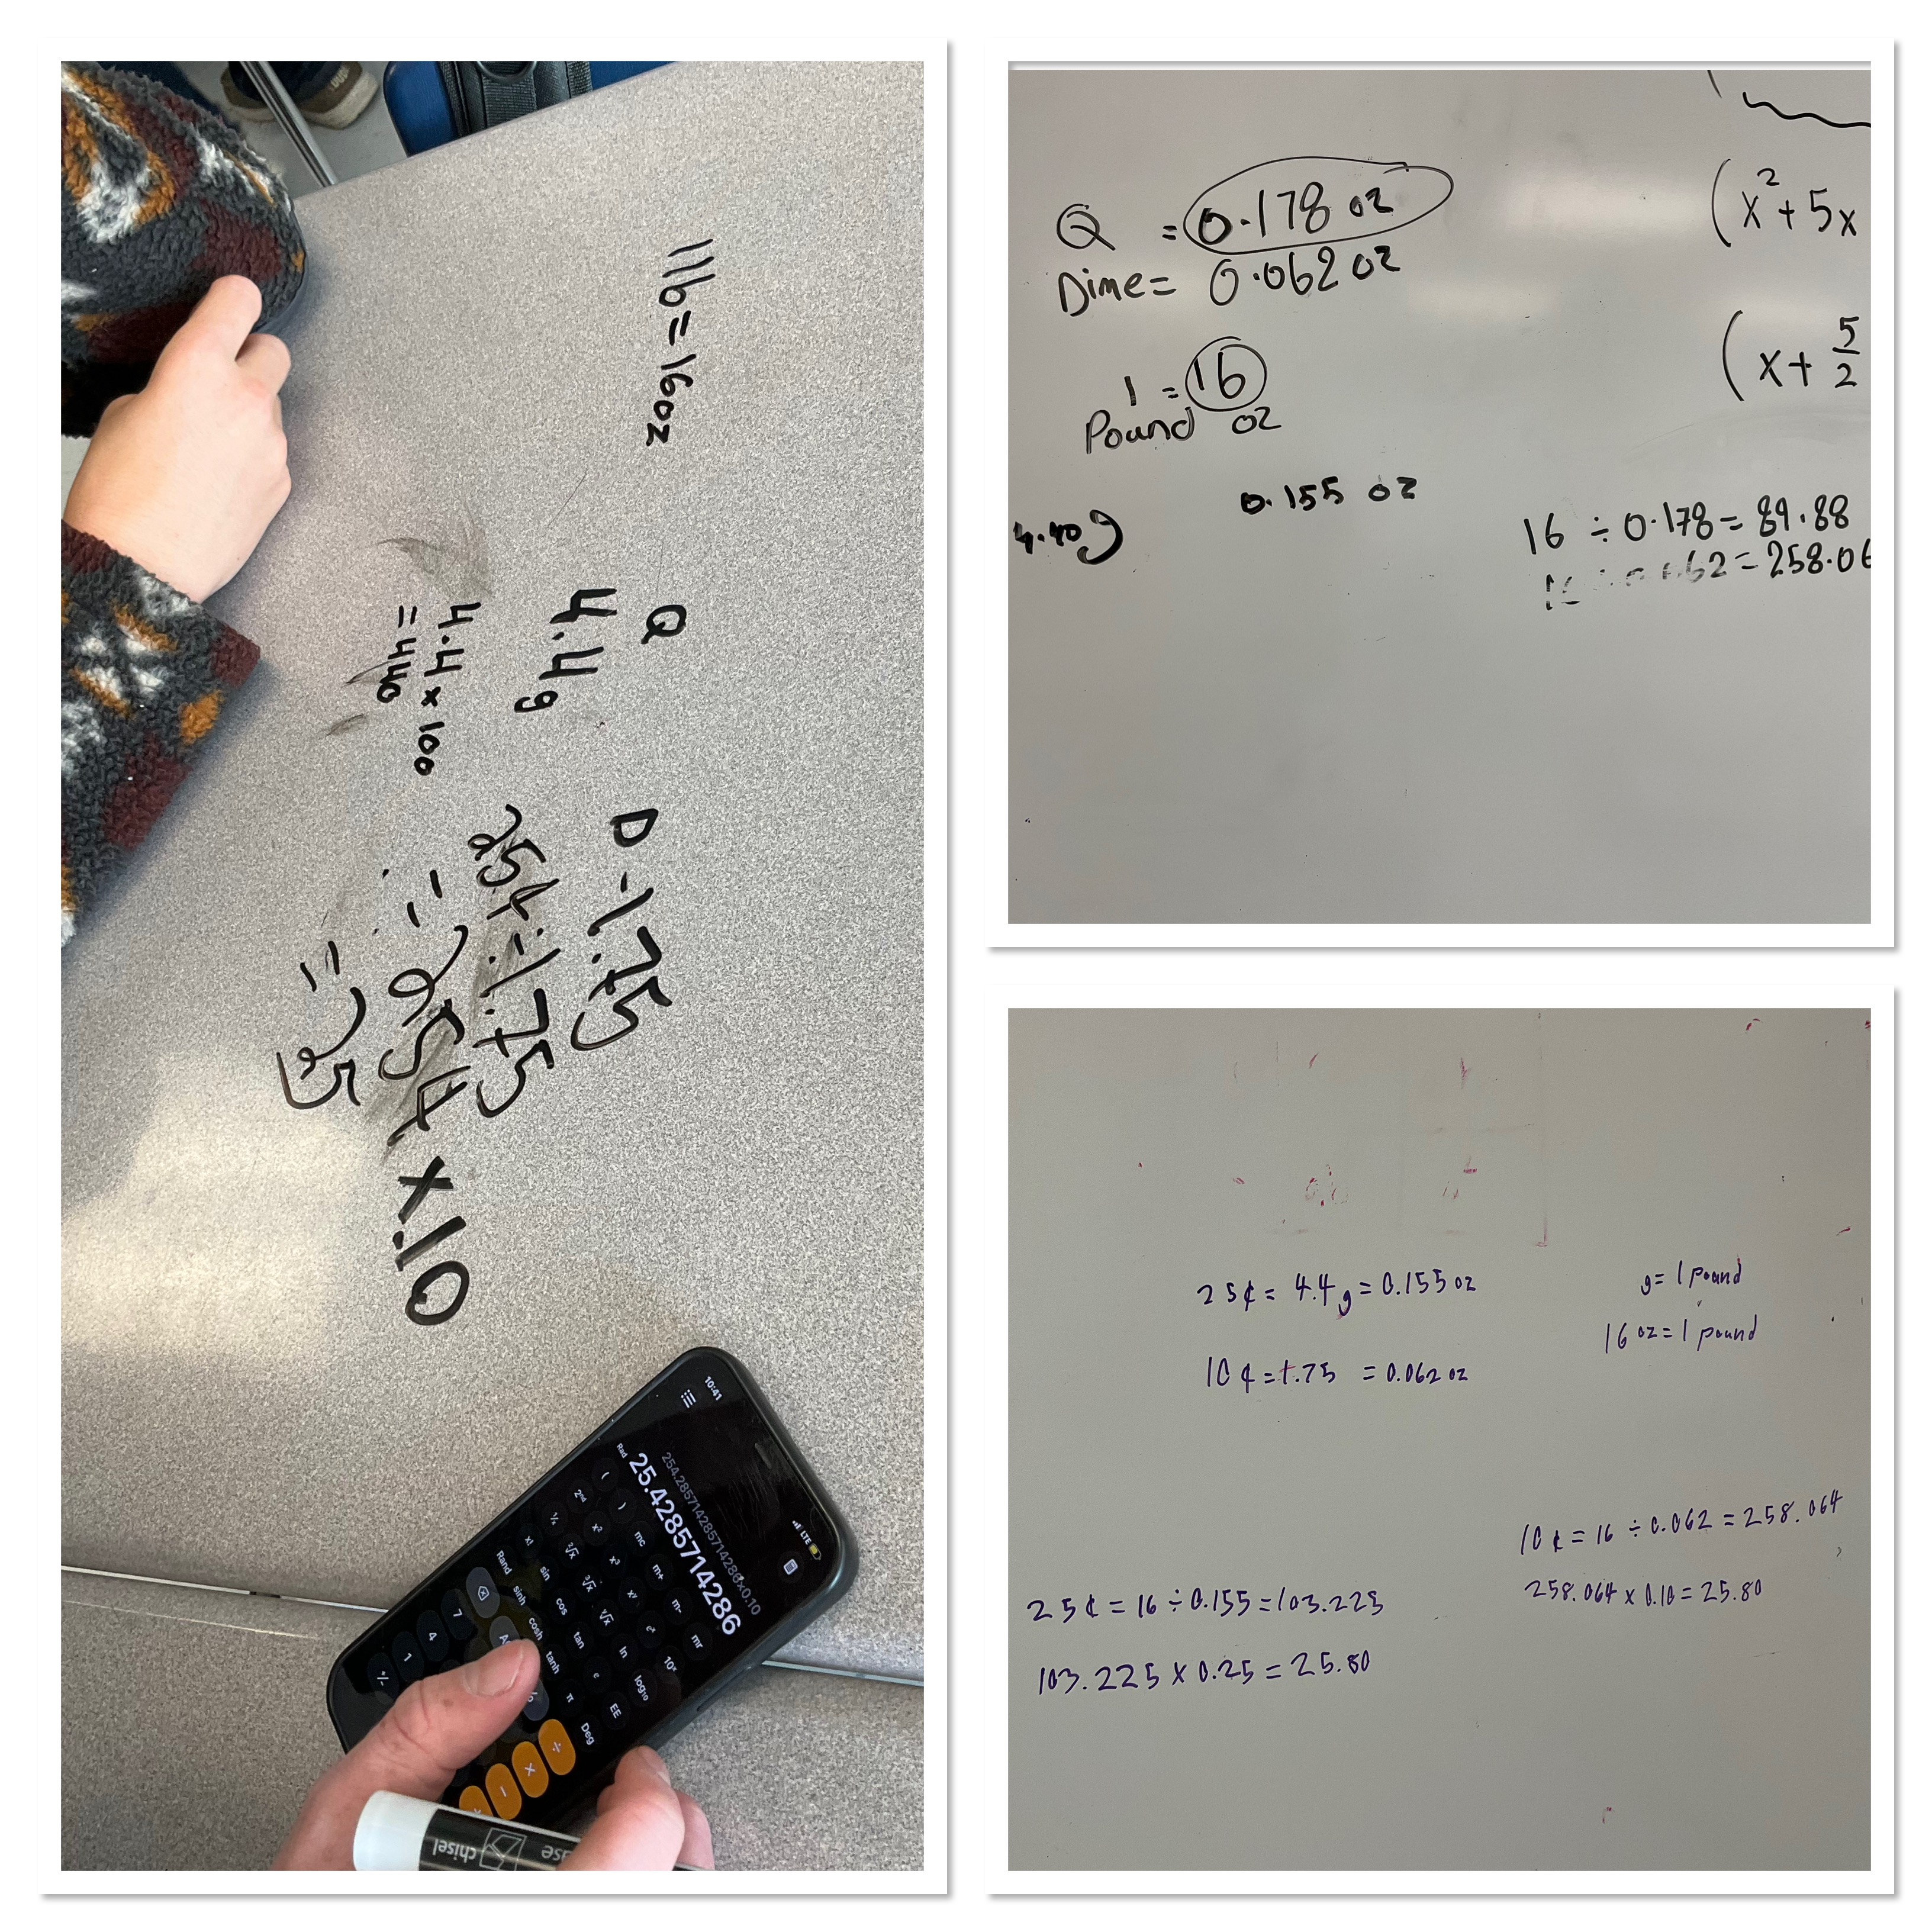
Students dove into the problem solving once we looked up the weight of a quarter and a dime is in ounces, and what a pound is in ounces. This task uses unit conversion and proportional reasoning. It’s fun to see how groups worked together to tackle the problem.
Spoiler: the value is about $25 in either case, which is pretty cool! We decided having that in quarters would be easier to manage.
There are lots of sites with would you rather questions prepared already, a quick google search can help you find your next mathematical challenge.
It was a good day with lots of teamwork, positive language, and participation. I hope we continue with this energy moving forward.
Solving with Algebra Tiles
My grade 9 class this week has been working on solving equations. We used algebra tiles to help us visualize what we are doing, and to help us choose our next steps. Here are some examples of the process.
We represented each side of the equation, and drew a line where the equal sign is. We know that both sides are equal. Our goal is to get the variable tile alone on one side. We can do that a few different ways. Here we decided to create zero pairs for the +2 which is on the same side as the x. This will annihilate the +2, and we will have the x alone.
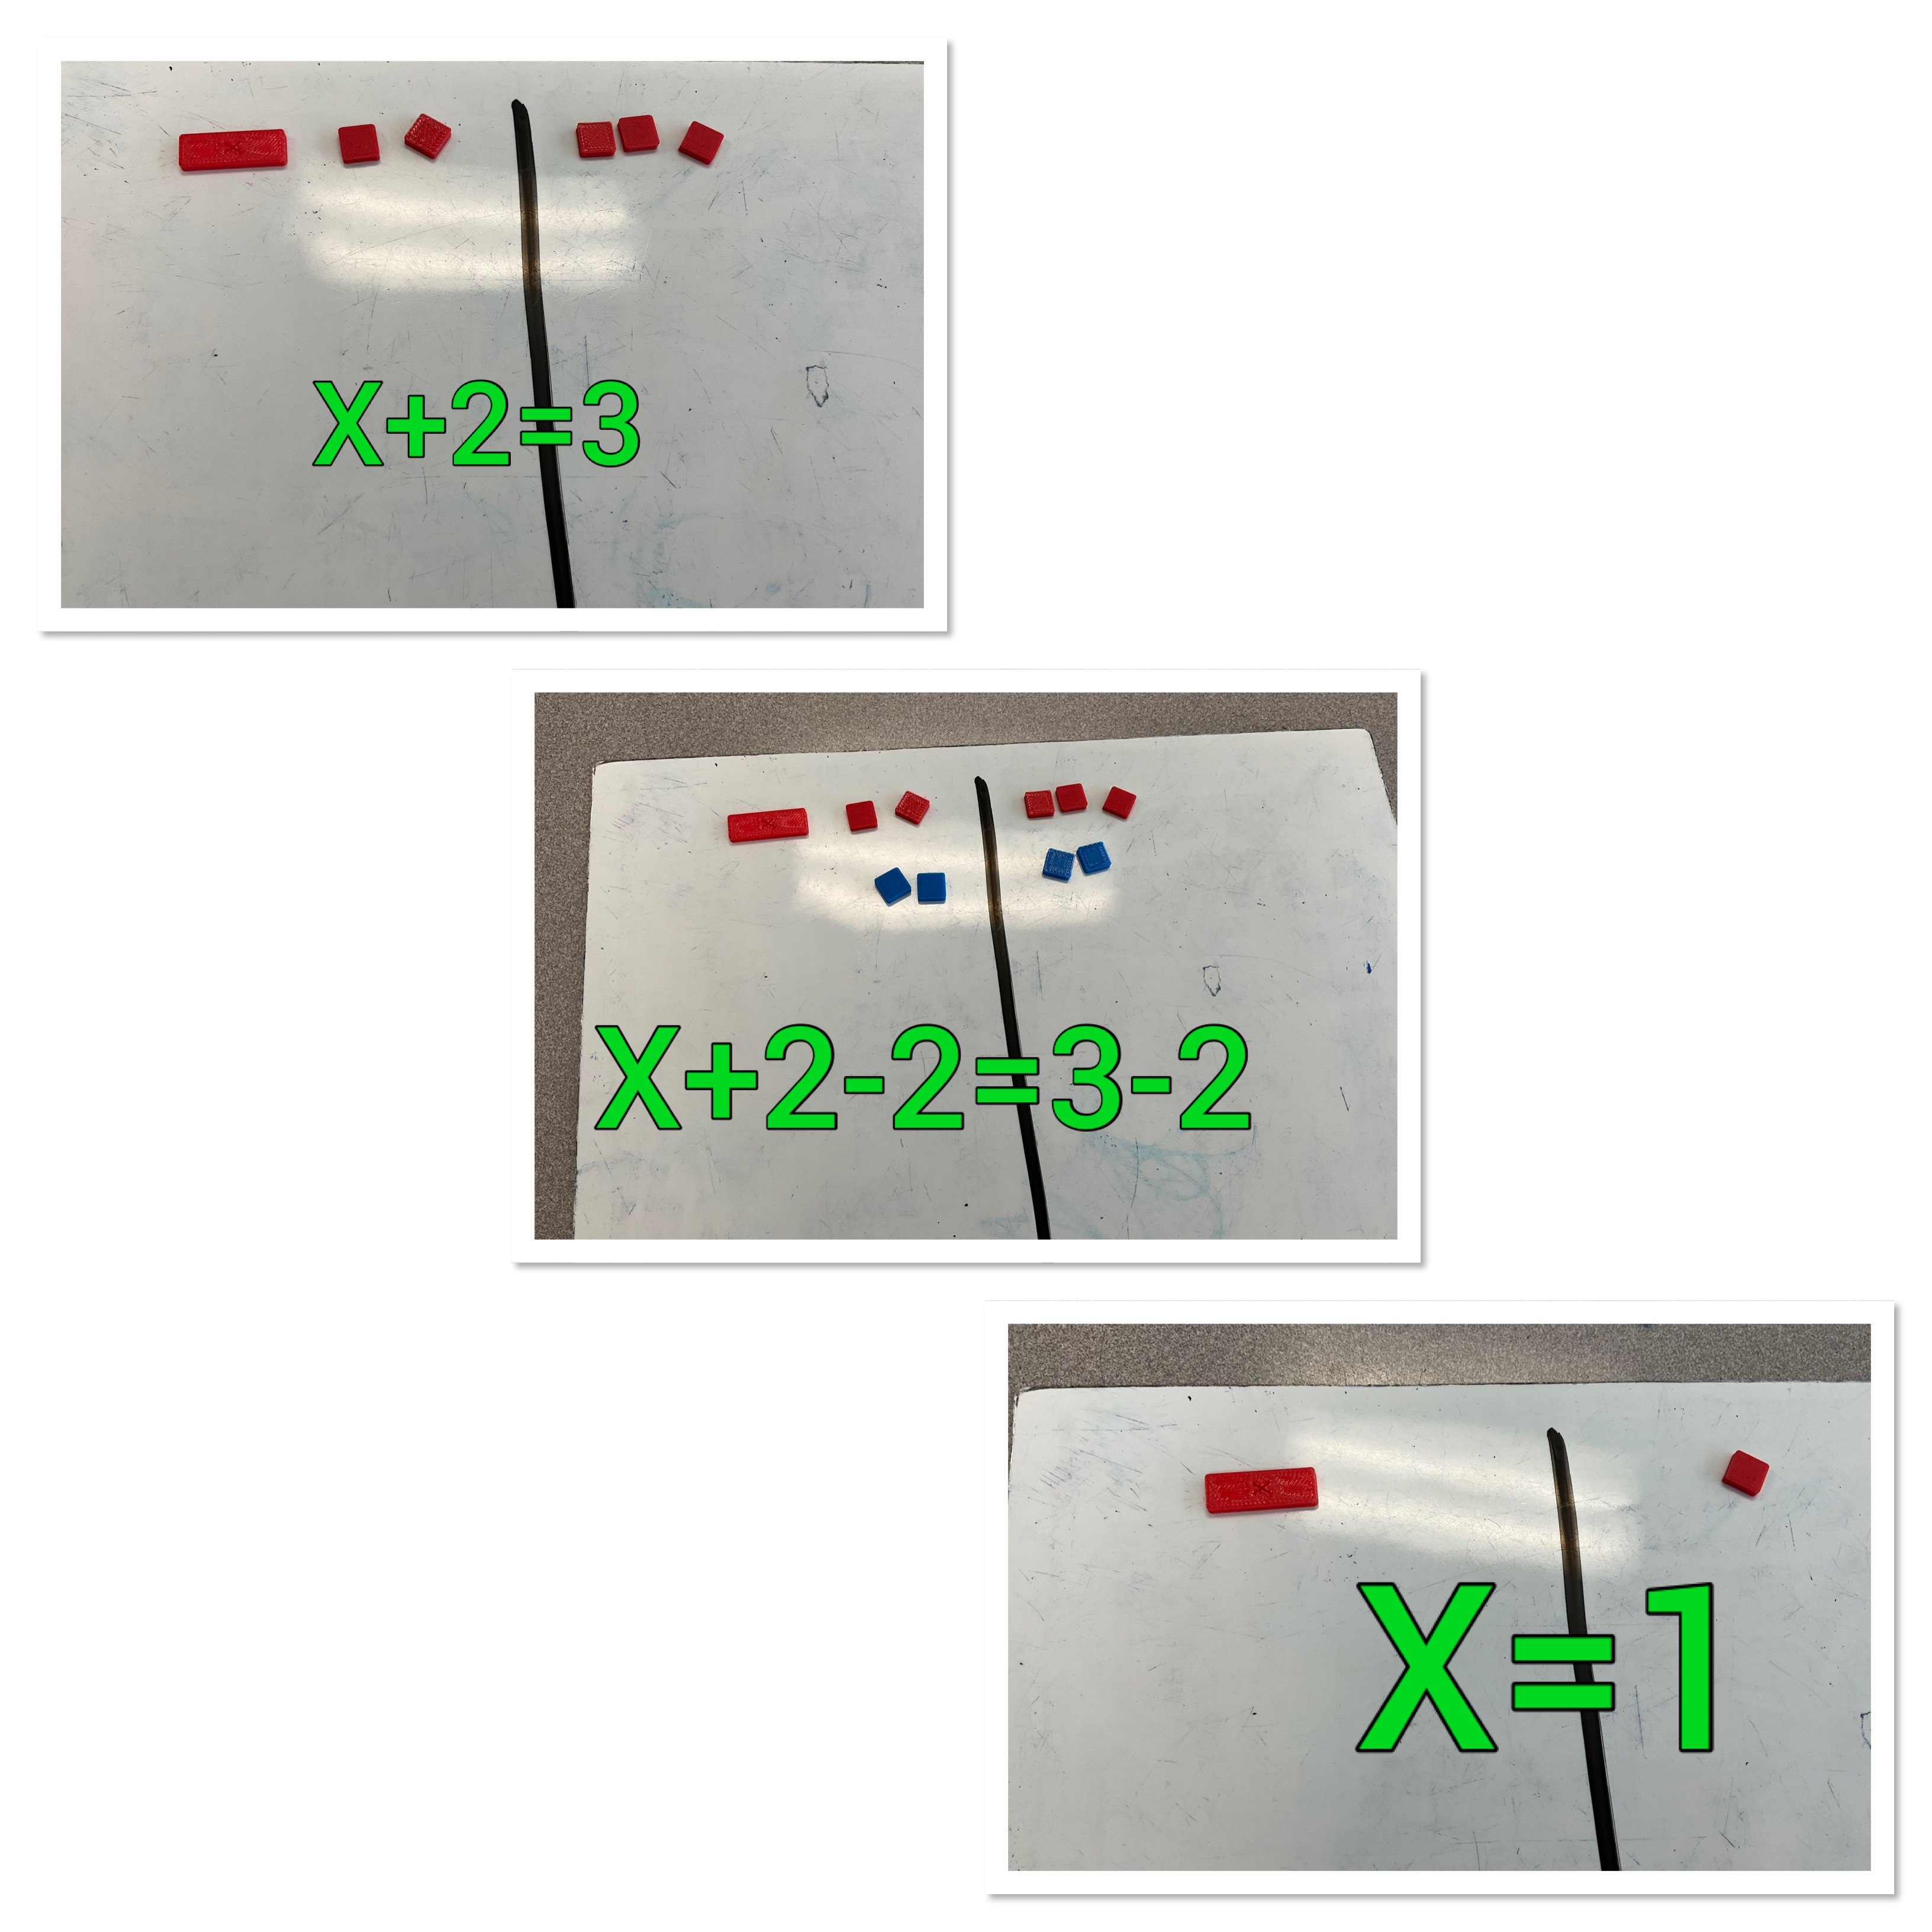
We have to do the same on both sides to keep the equation equal.
Here’s another example. We have variables on both sides here, which we are not thrilled about. To annihilate the -x on the right side, we place a +x to create a zero pair. We must place +x on the left as well to keep things equal. Next we place +3 on both sides which will create a zero pair with the -3 which is on the same side as the x term.

We end up with 3x=8. The next step is to split the 3x into 3 groups. We want each x to have its own group. We split the 8 up into 3 groups too. This is tricky since it doesn’t divide equally. We will have 2, and then we need to cut each of the little blocks remaining into thirds. Each group will get 1/3 of each remaining block. Wr end up with 2 and 2/3 as our answer for x.
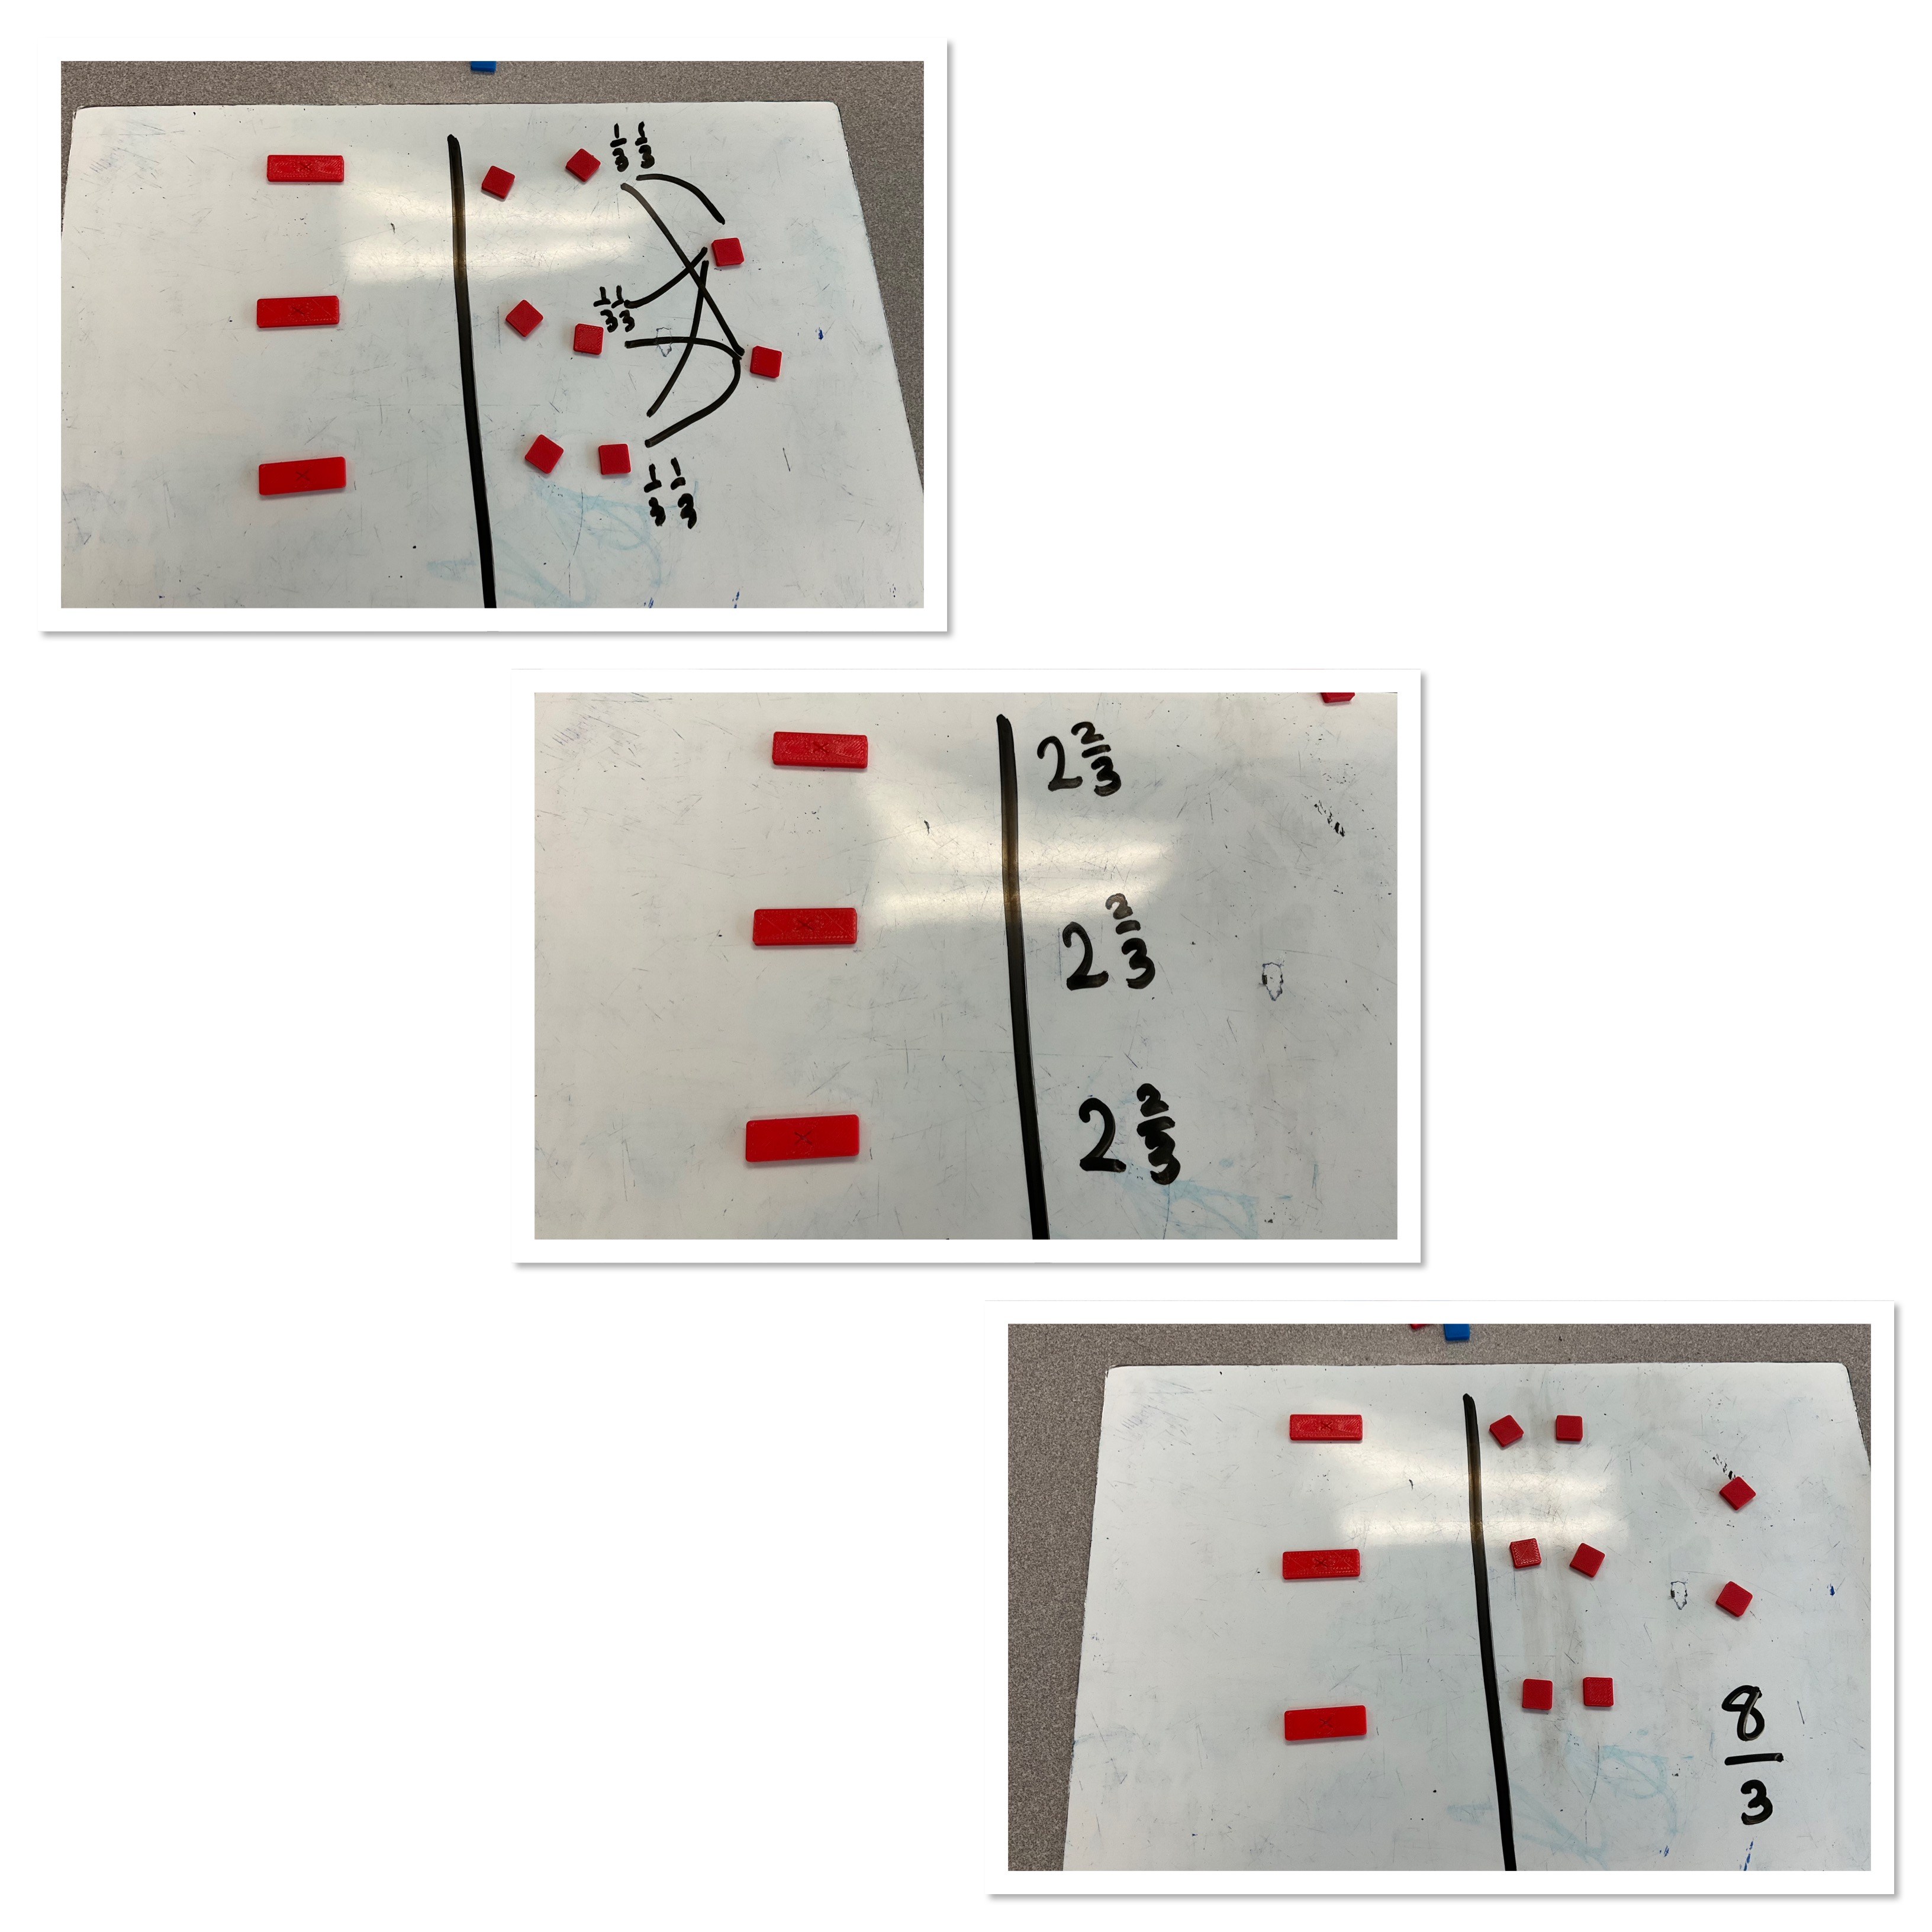
Another way to visualize this is to say that we have 8 blocks that we want to divide into 3 groups, and we represent x as the fraction 8/3, which is equivalent to 2 and 2/3.
We have worked on representing and solving lots of equations. Some students will use the tiles for quite a while. Others can make the connection to an algebraic representation, but the understanding remains that we use zero pairs and opposite operations to isolate x. Using the tiles helps us remember what our like terms are, and we physically see both sides all the time, and we know we must keep them equal by doing the same thing on both sides each time.
Angles in a Triangle
Today we looked at angle sums in grade 9. I don’t have a before picture, but I cut out some triangles, labelled their angles A,B,C, then ripped them up to put the angles all together to form a straight line.
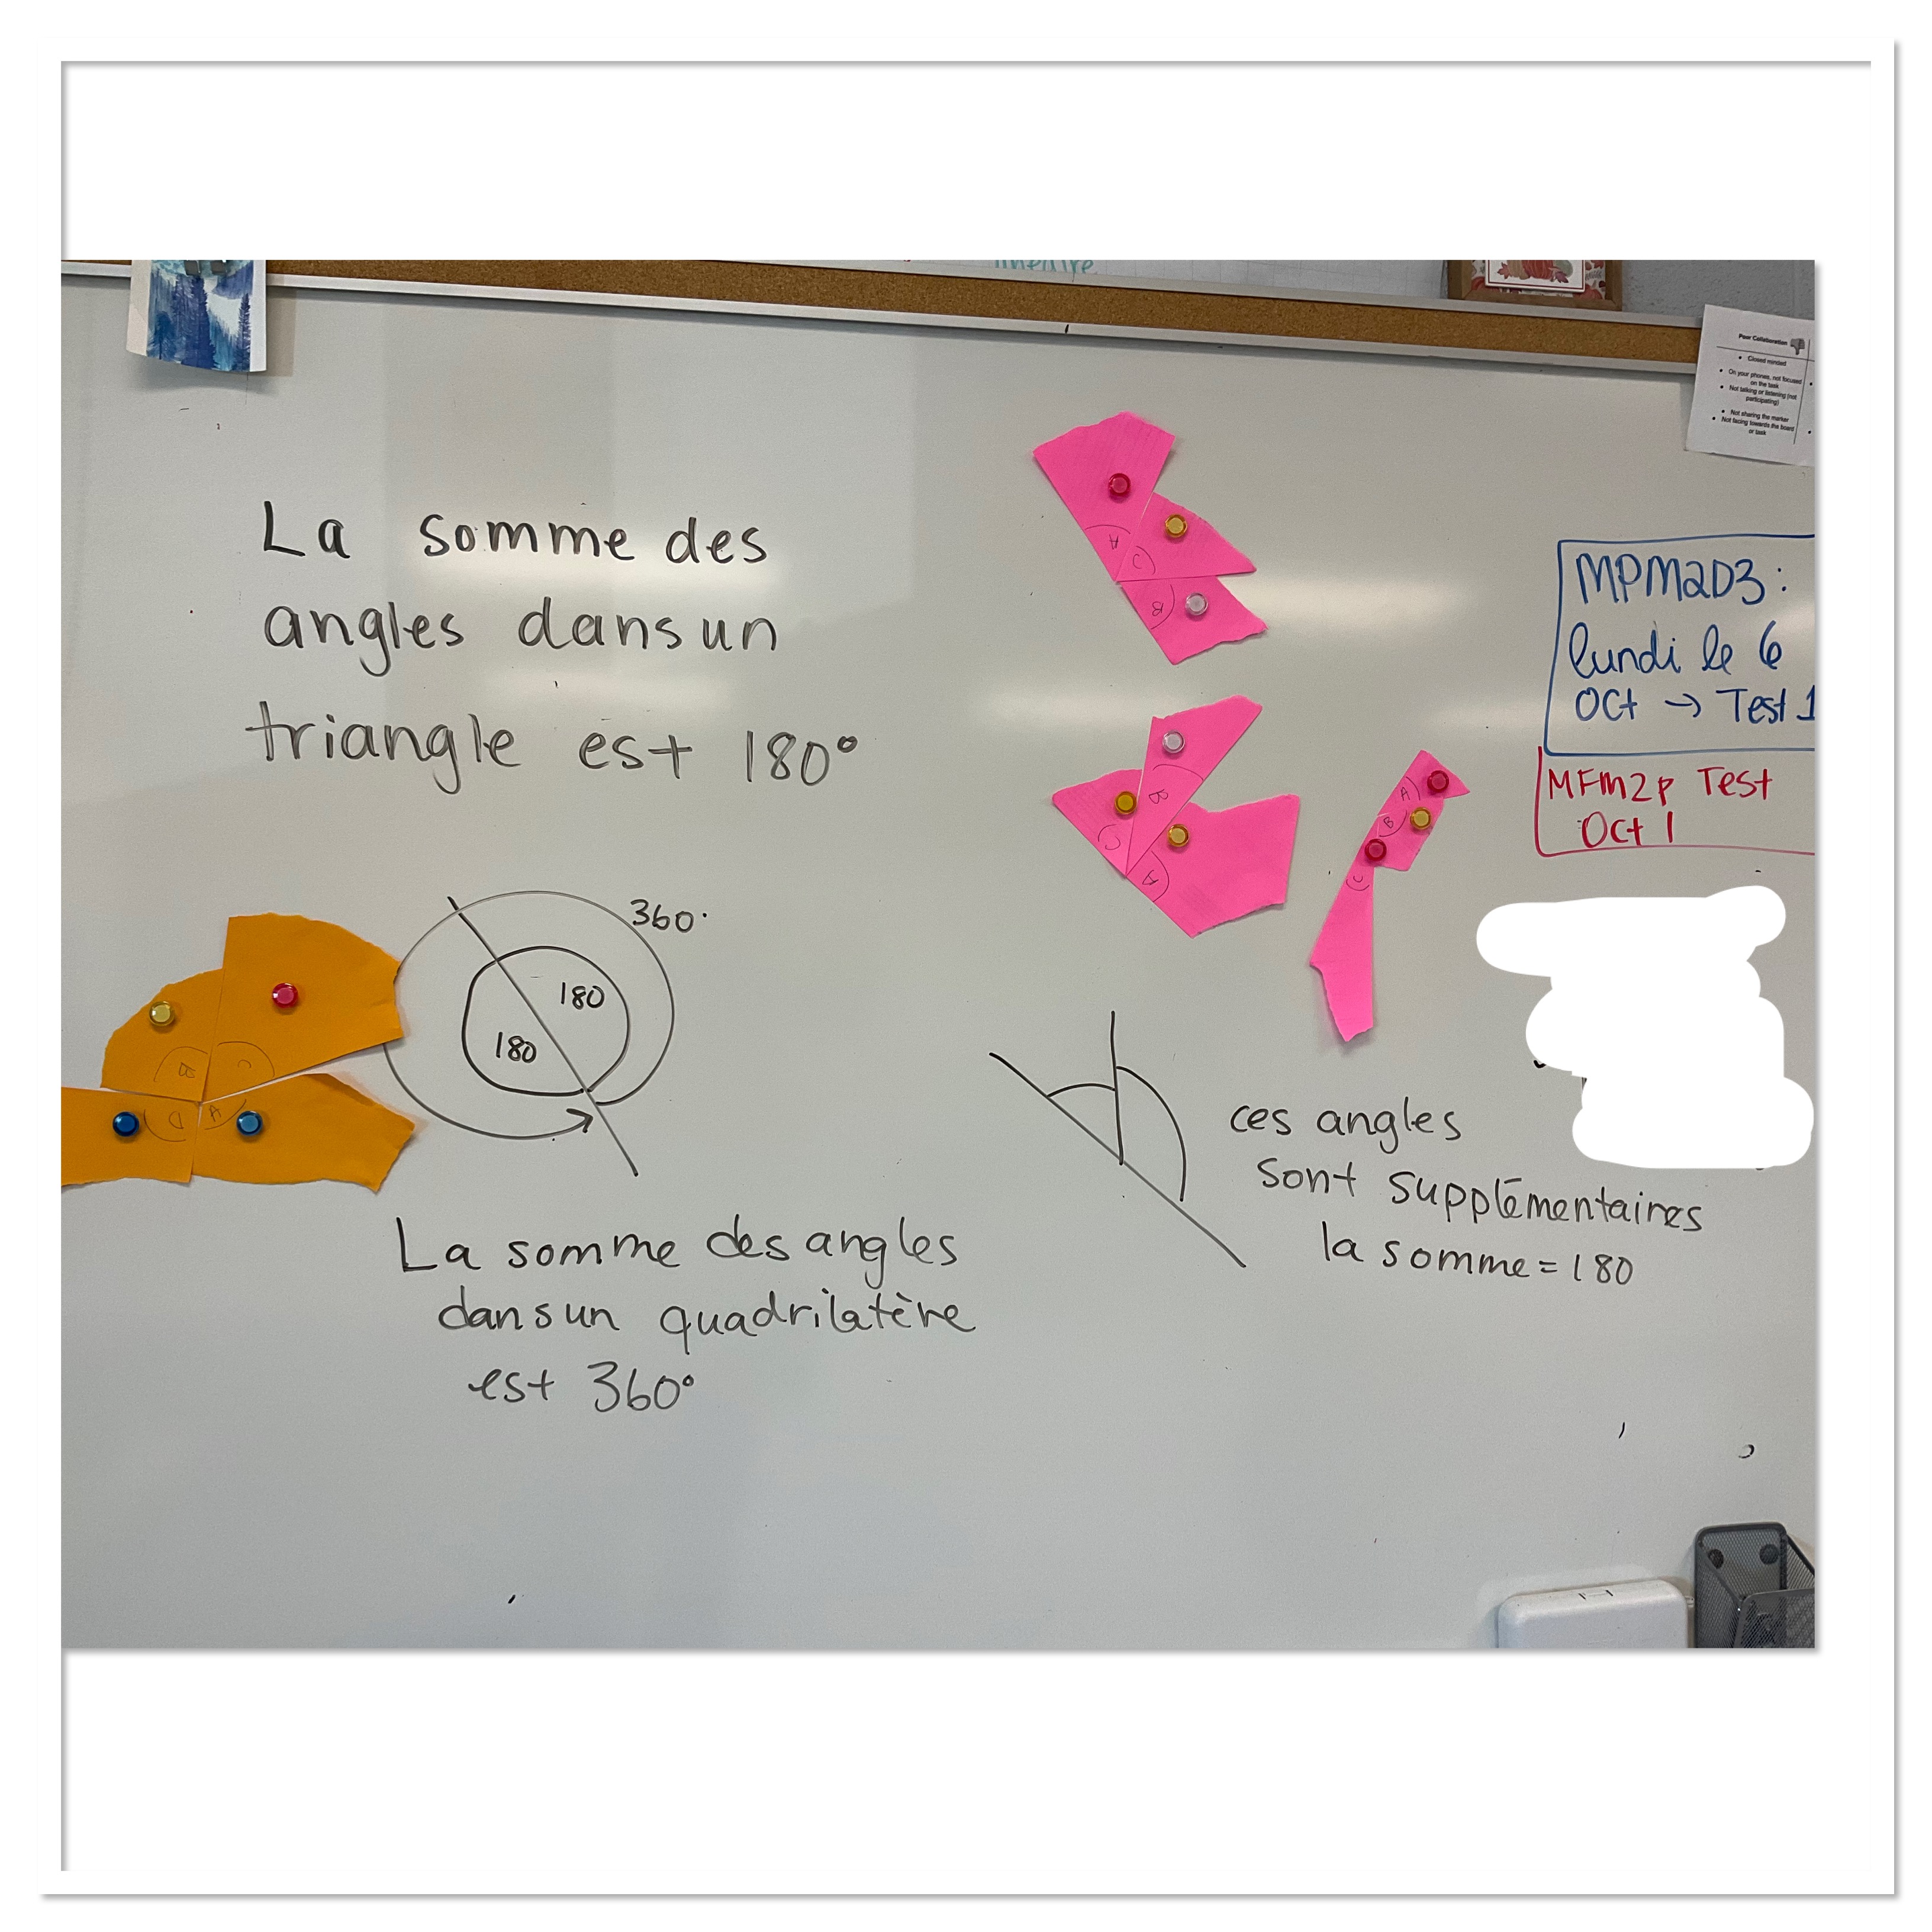
We did the same thing for a quadrilateral, labelling the angles, ripping it up and placing the angles together to form a full circle, 360 degrees.
Next we looked at exterior angles, and how they always add up to 360 degrees. You can do this with paper too, but I hadn’t been careful enough when I cut out the shapes earlier. This video also gets the point across, and when played in a loop is quite calming and meditative.
We then started to solve equations to find missing angles. This is our introduction to solving, which is a change to my previous sequence. I think it’s a nice introduction since the values we are finding are all positive, and we can practice writing equations all in context of solving for a missing angle.
Test Day
Today was test 1 for my grade 10 applied class. We tried doing “test talk” for the first 5 minutes. This is a technique I saw Howie Hua talk about in this video.
we put pencils on the floor, and with test in hand have 5 minutes to look through it and talk with others in the class. This strategy helps to lower anxiety levels, encourages people to read through the entire test before writing, and also values the collaboration that we do each day. Nothing is written during this time. After the 5 minutes is up, it was back to regular test protocol, quiet individual work.
I also handed out some smooth stones which is something I’ve done for years. It’s a good fidget, and also something calming to hold onto.

Some students used tiles during the test to help with patterning. Others just wrote and drew pictures.
for a first test I think it went pretty well!
Shrinking Ropes
Today we did a task involving knot tying. We had several lengths of rope in different thicknesses. We tied overhand knots in the ripes and measured after each knot was tied.
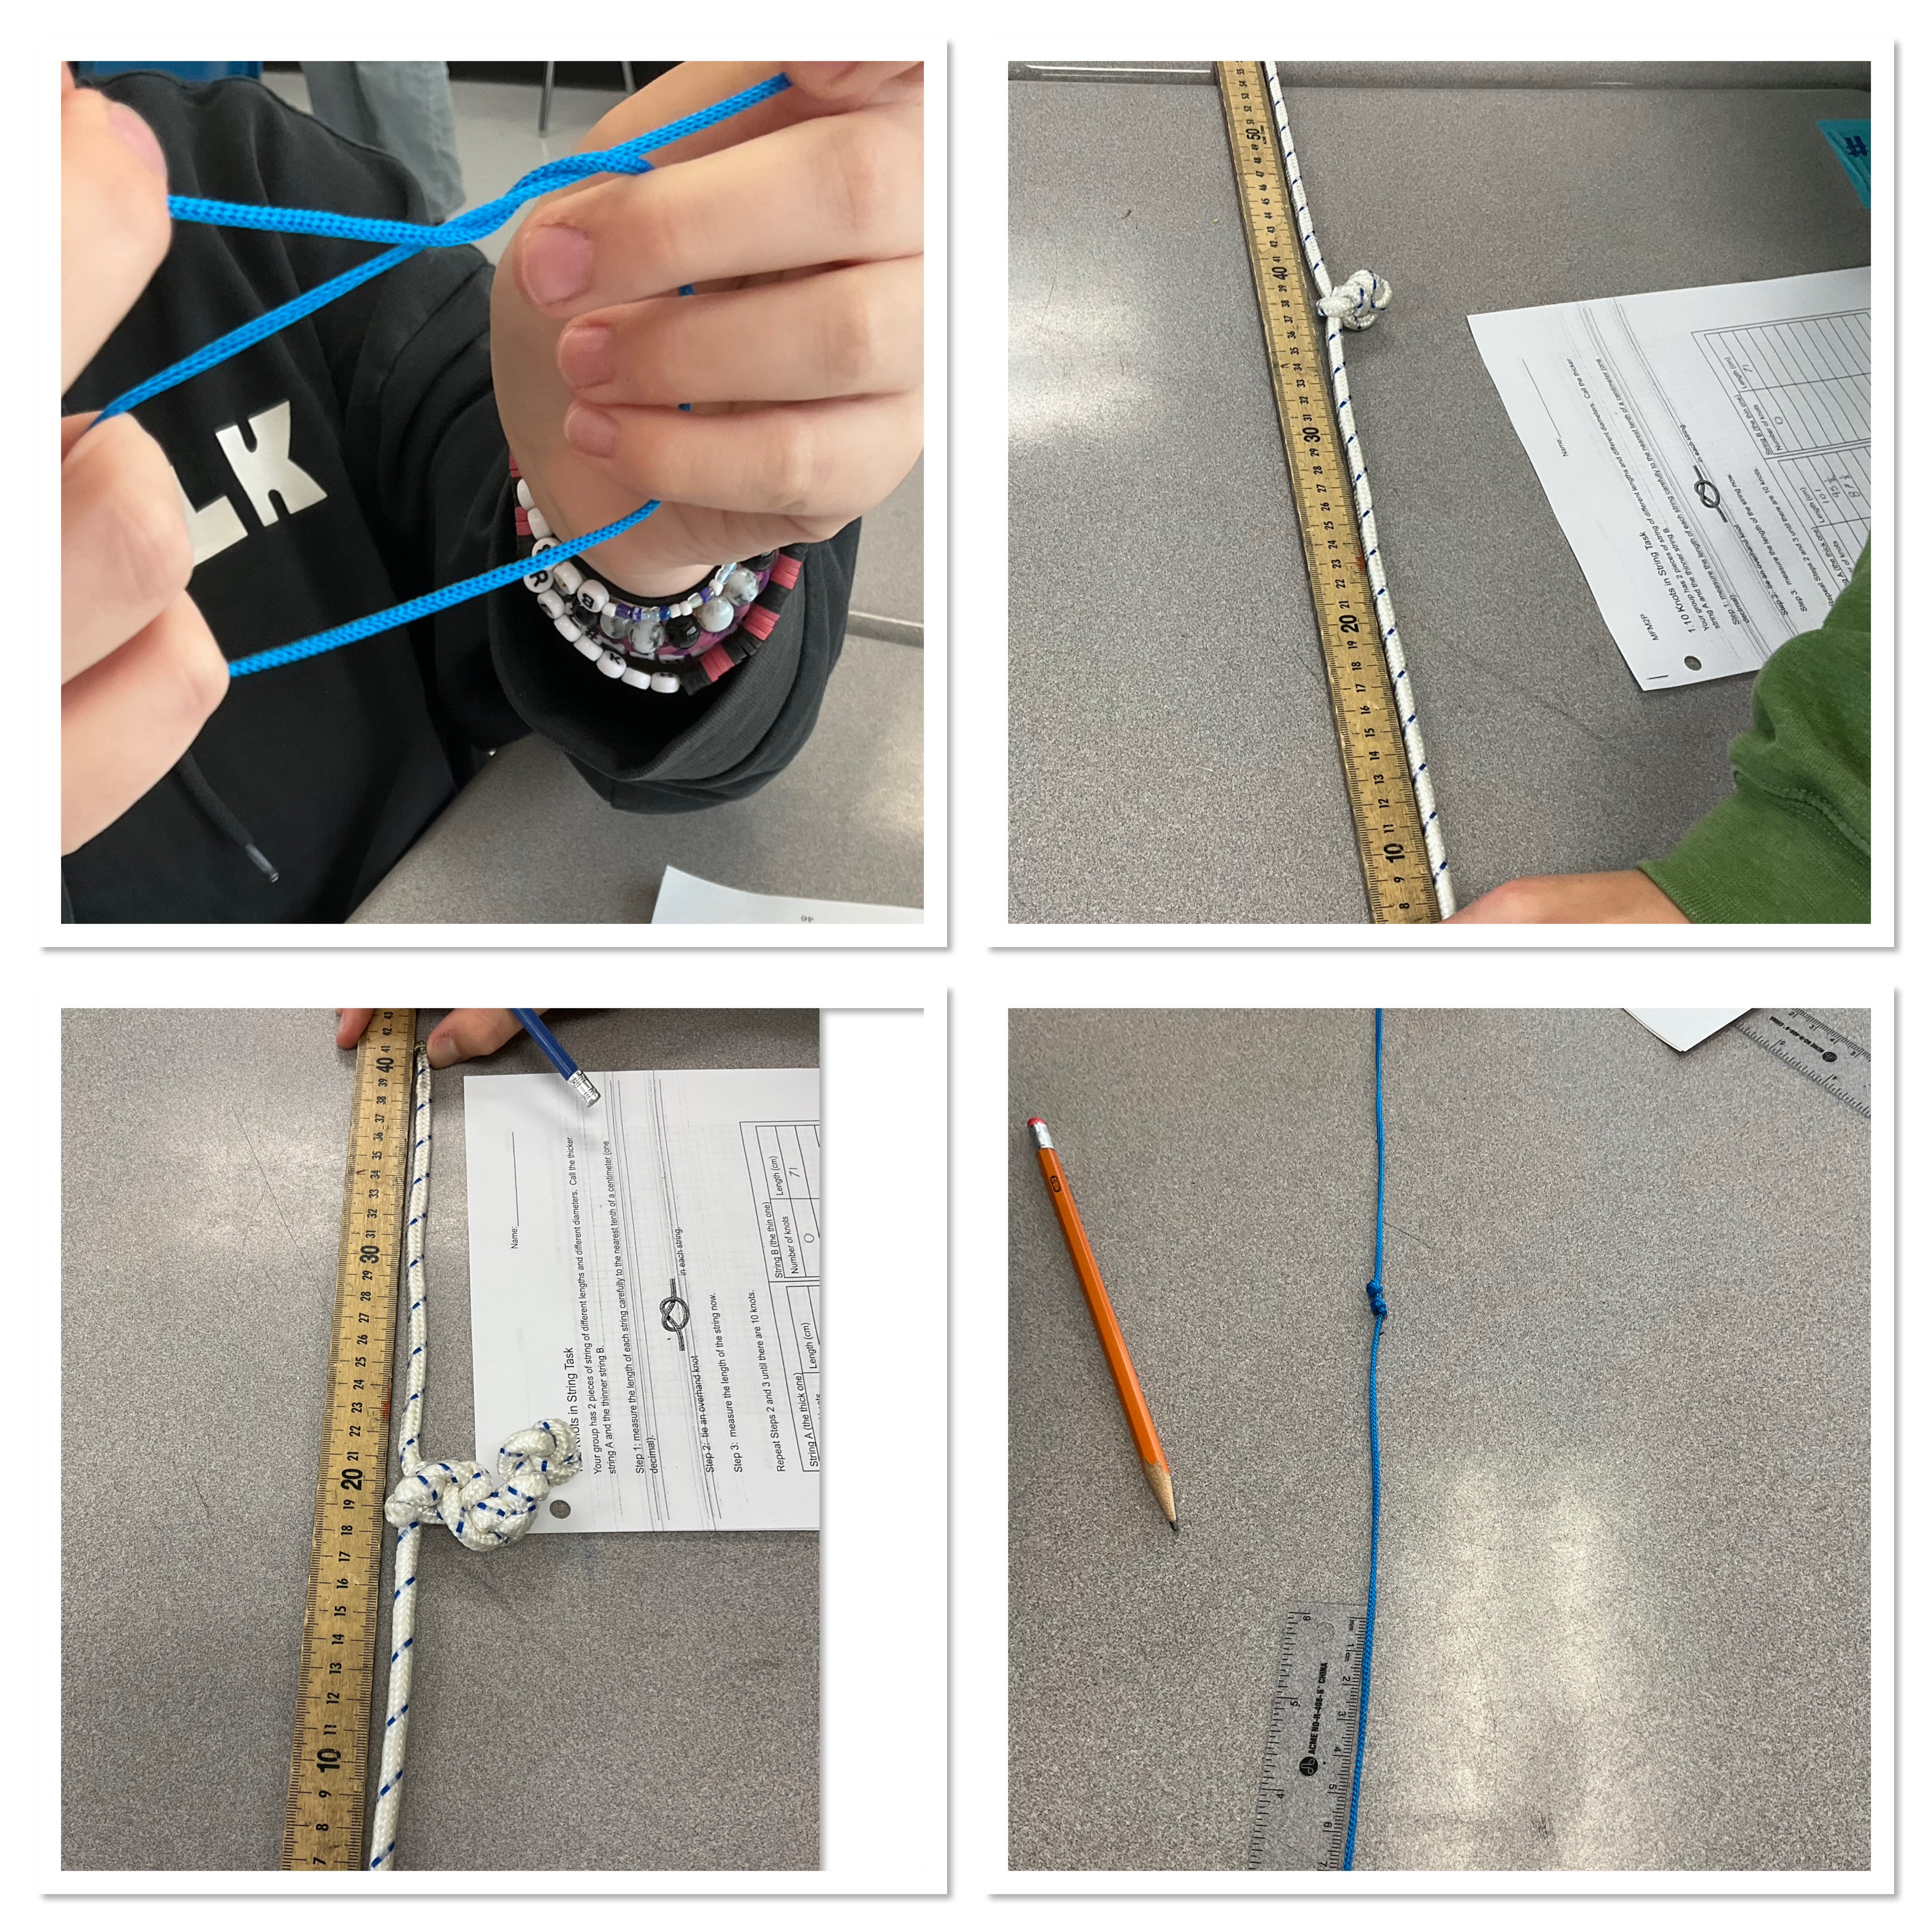
We kept track of our data in a table, then graphed it on paper.

While not perfectly linear, it’s a really strong fit.
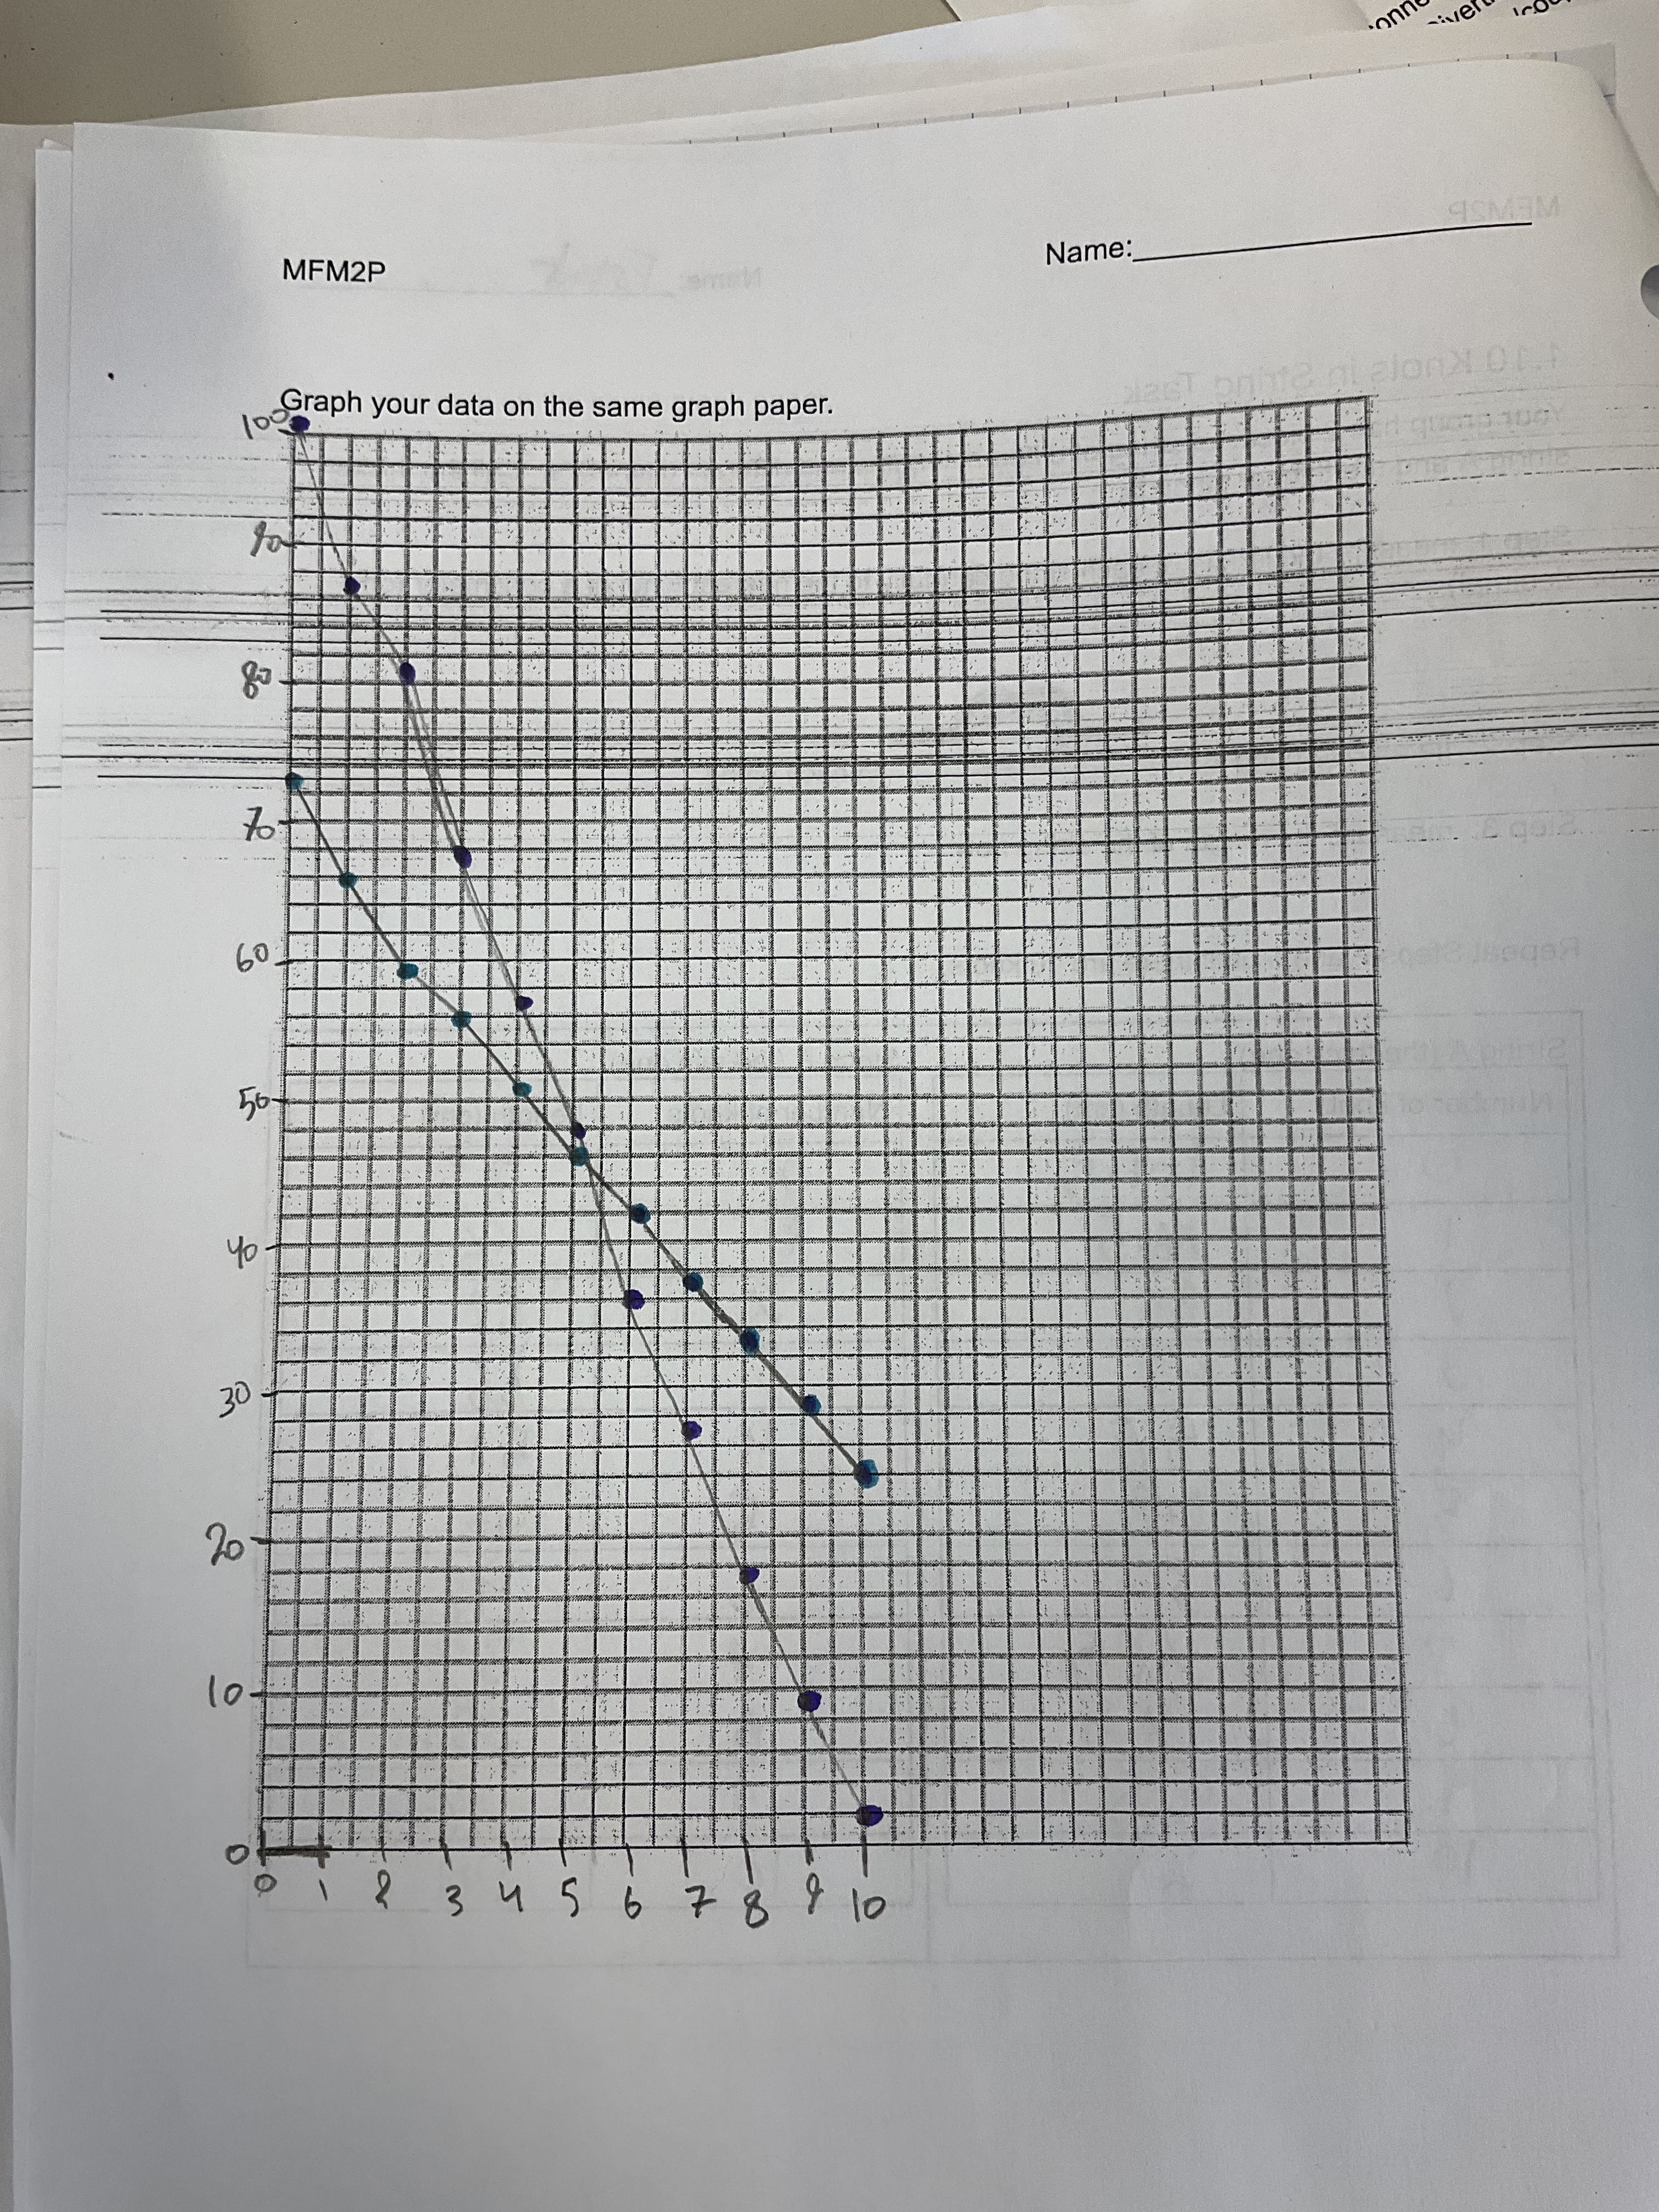
We answered some questions about the relationships, and related what we saw to our recent studies of linear and quadratic patterning and relationships.

I was impressed at how self directed my students were today. We were on task for almost the entire period.
Multiplication Fluency
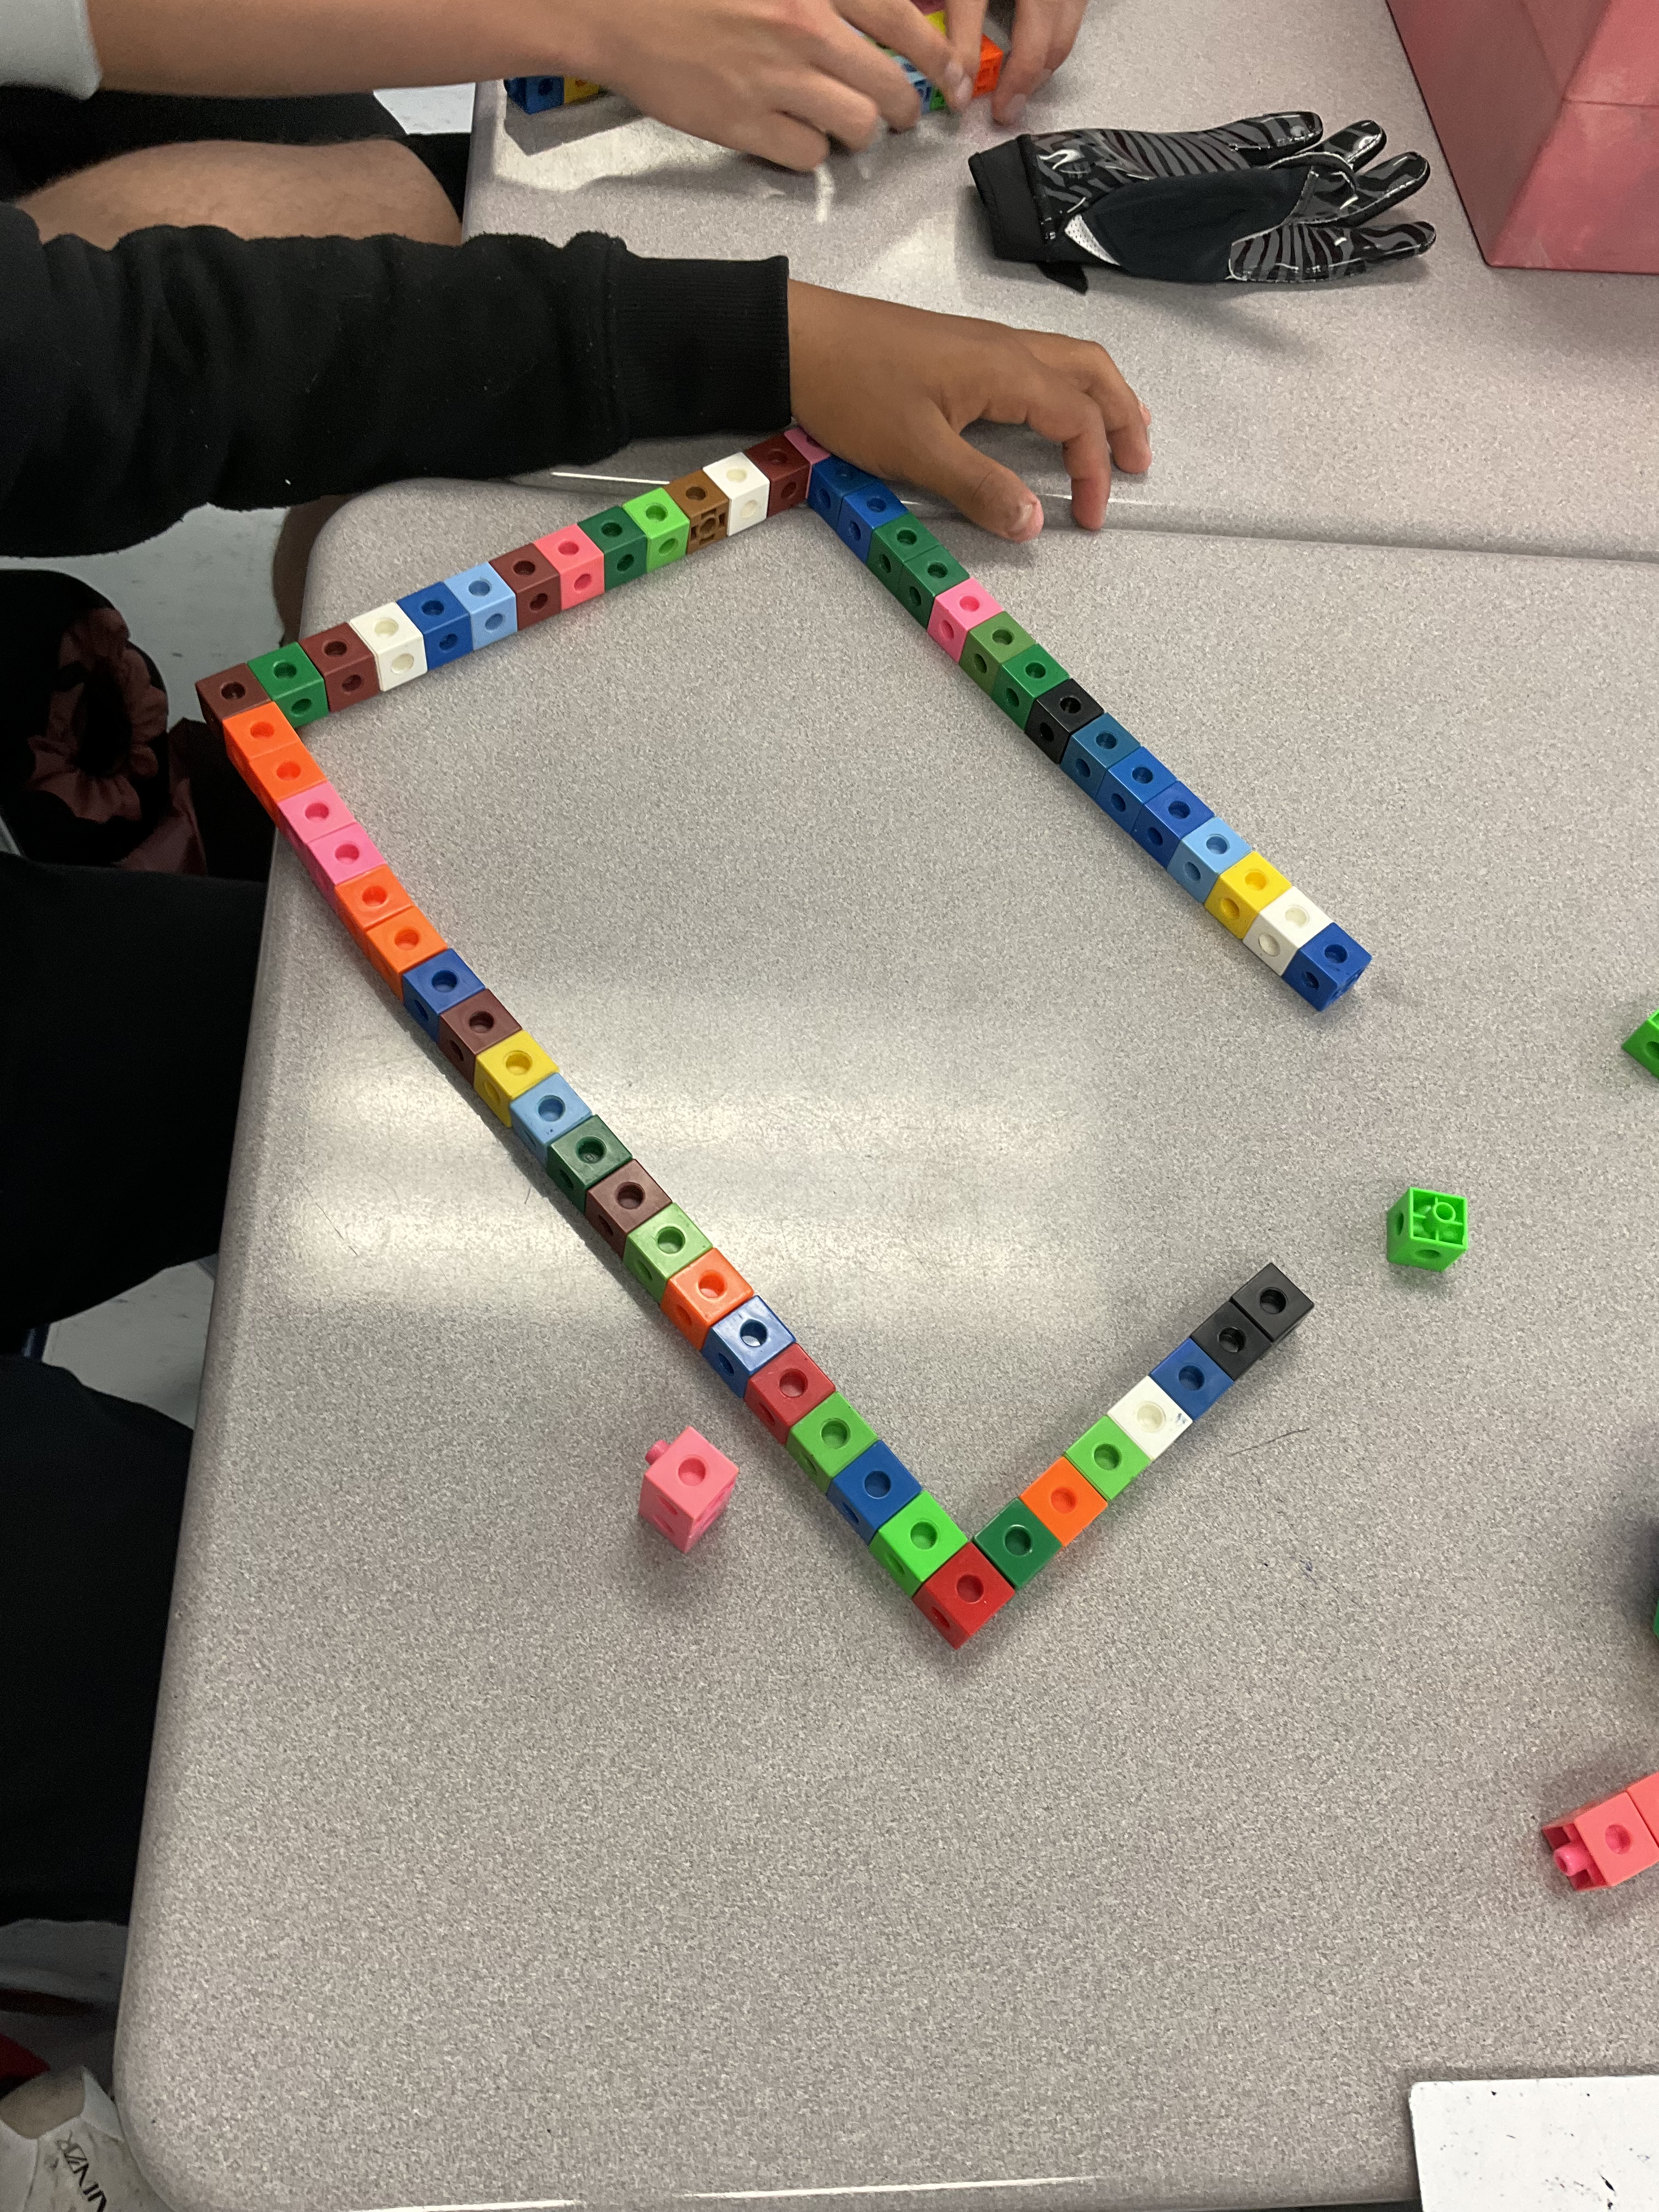
We worked on a multiplication fluency task a little bit today. We used 24 snap cubes to build as many rectangles as we could. They needed to be solid rectangles.

It took a while to figure out how many different options there were, and why we couldn’t build one with a dimension of 5. We came to a conclusion that the length and width of the rectangle multiply to 24, and that wont work for 5.
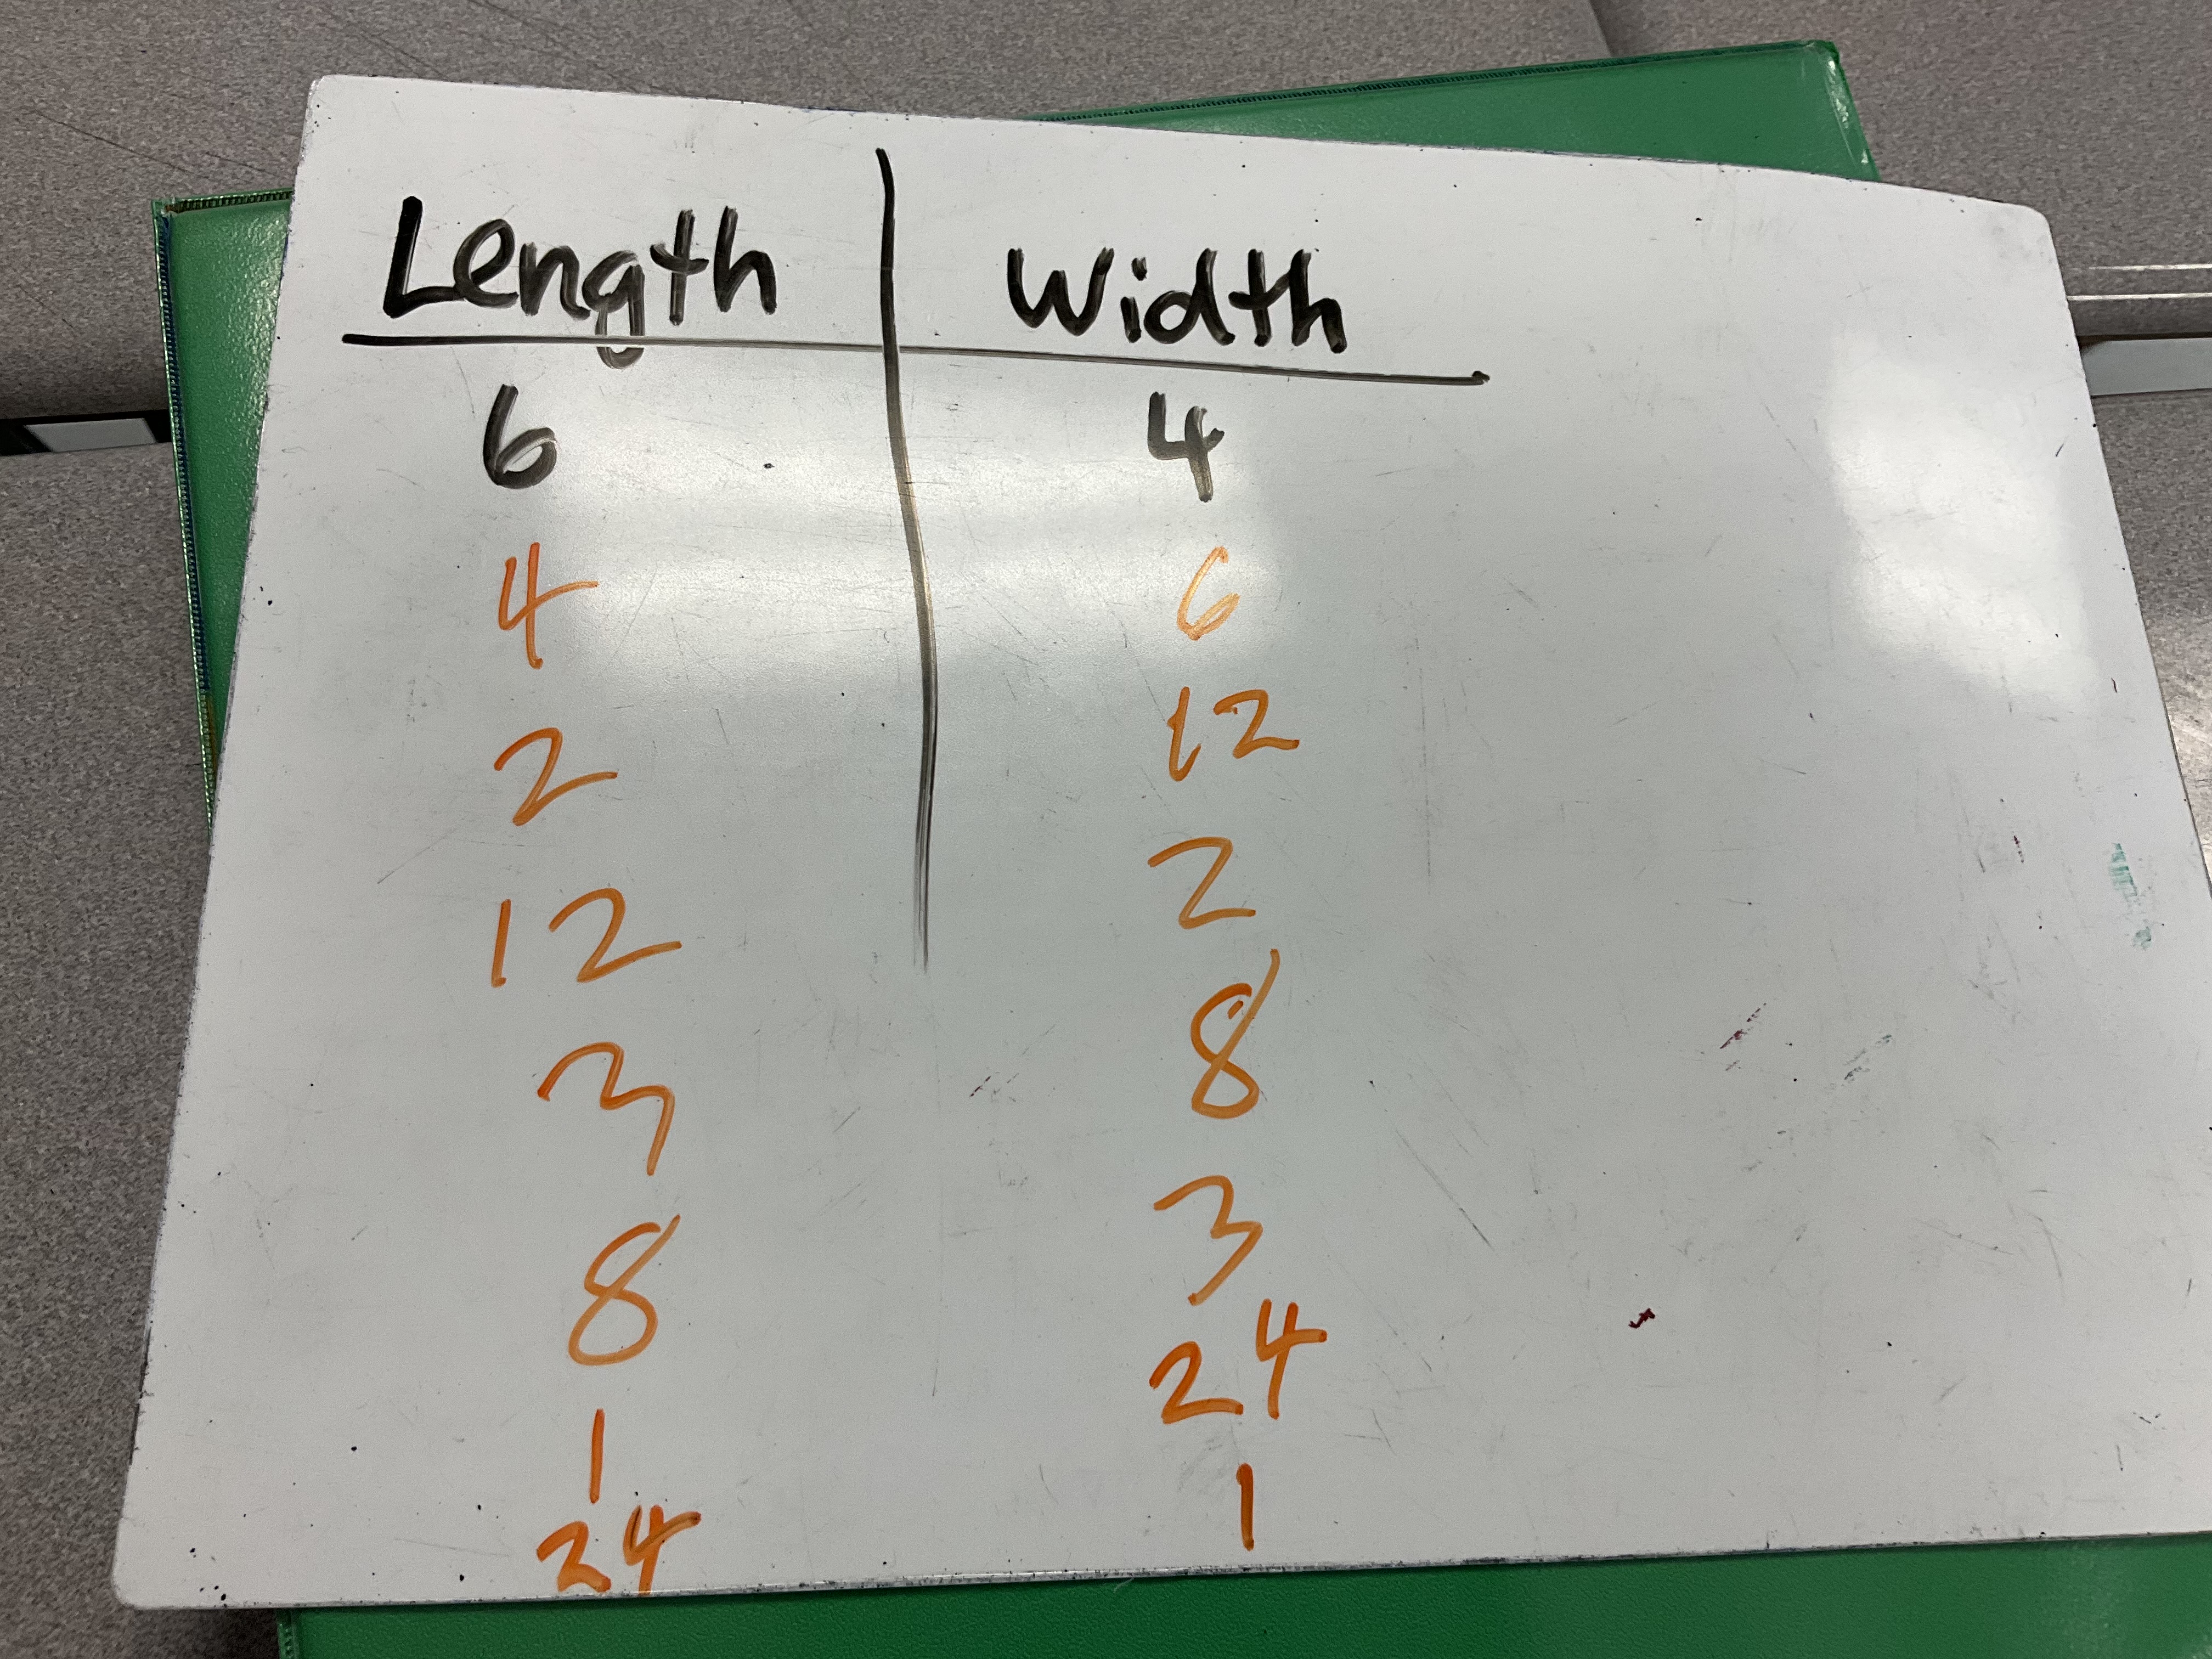
Some groups were interested in making 3D prisms, and we made the connection that the dimensions would be (2)(2)(6) or (2)(3)(4) and in both cases if you multiply those 3 values you get 24, which represents the volume of the prism.
Another group went rogue and started building a giant rectangle, and then figured out how many blocks they’d need to build it. That took some serious multiplication skills.
We’re getting better at using manipulatives without them ending up all over the floor. We have a well established “no throwing” rule, and we are working on helping care for our materials and our space.
Patterns to Graphs
We’ve been working on building patterns in MFM2P, showing linear growth. We are comfortable with the idea that figure 0 is our constant, and that there will be a consistant change between all the subsequent figures.
Today I gave groups a pattern rule to build. We made the patterns showing figure 0, 1, 2, 3, 4. Once that was done, we lined up all the blocks in figure 0 along the y axis of our graph. We’re using 1 inch tiles and 1 inch graph paper so that the squares line up perfectly with the grid. We make figure 0 into a stack, and then put a dot on the top left corner of the stack. We do the same thing for figure 1, making a stack right next to figure 0 and then adding a dot at the top left.
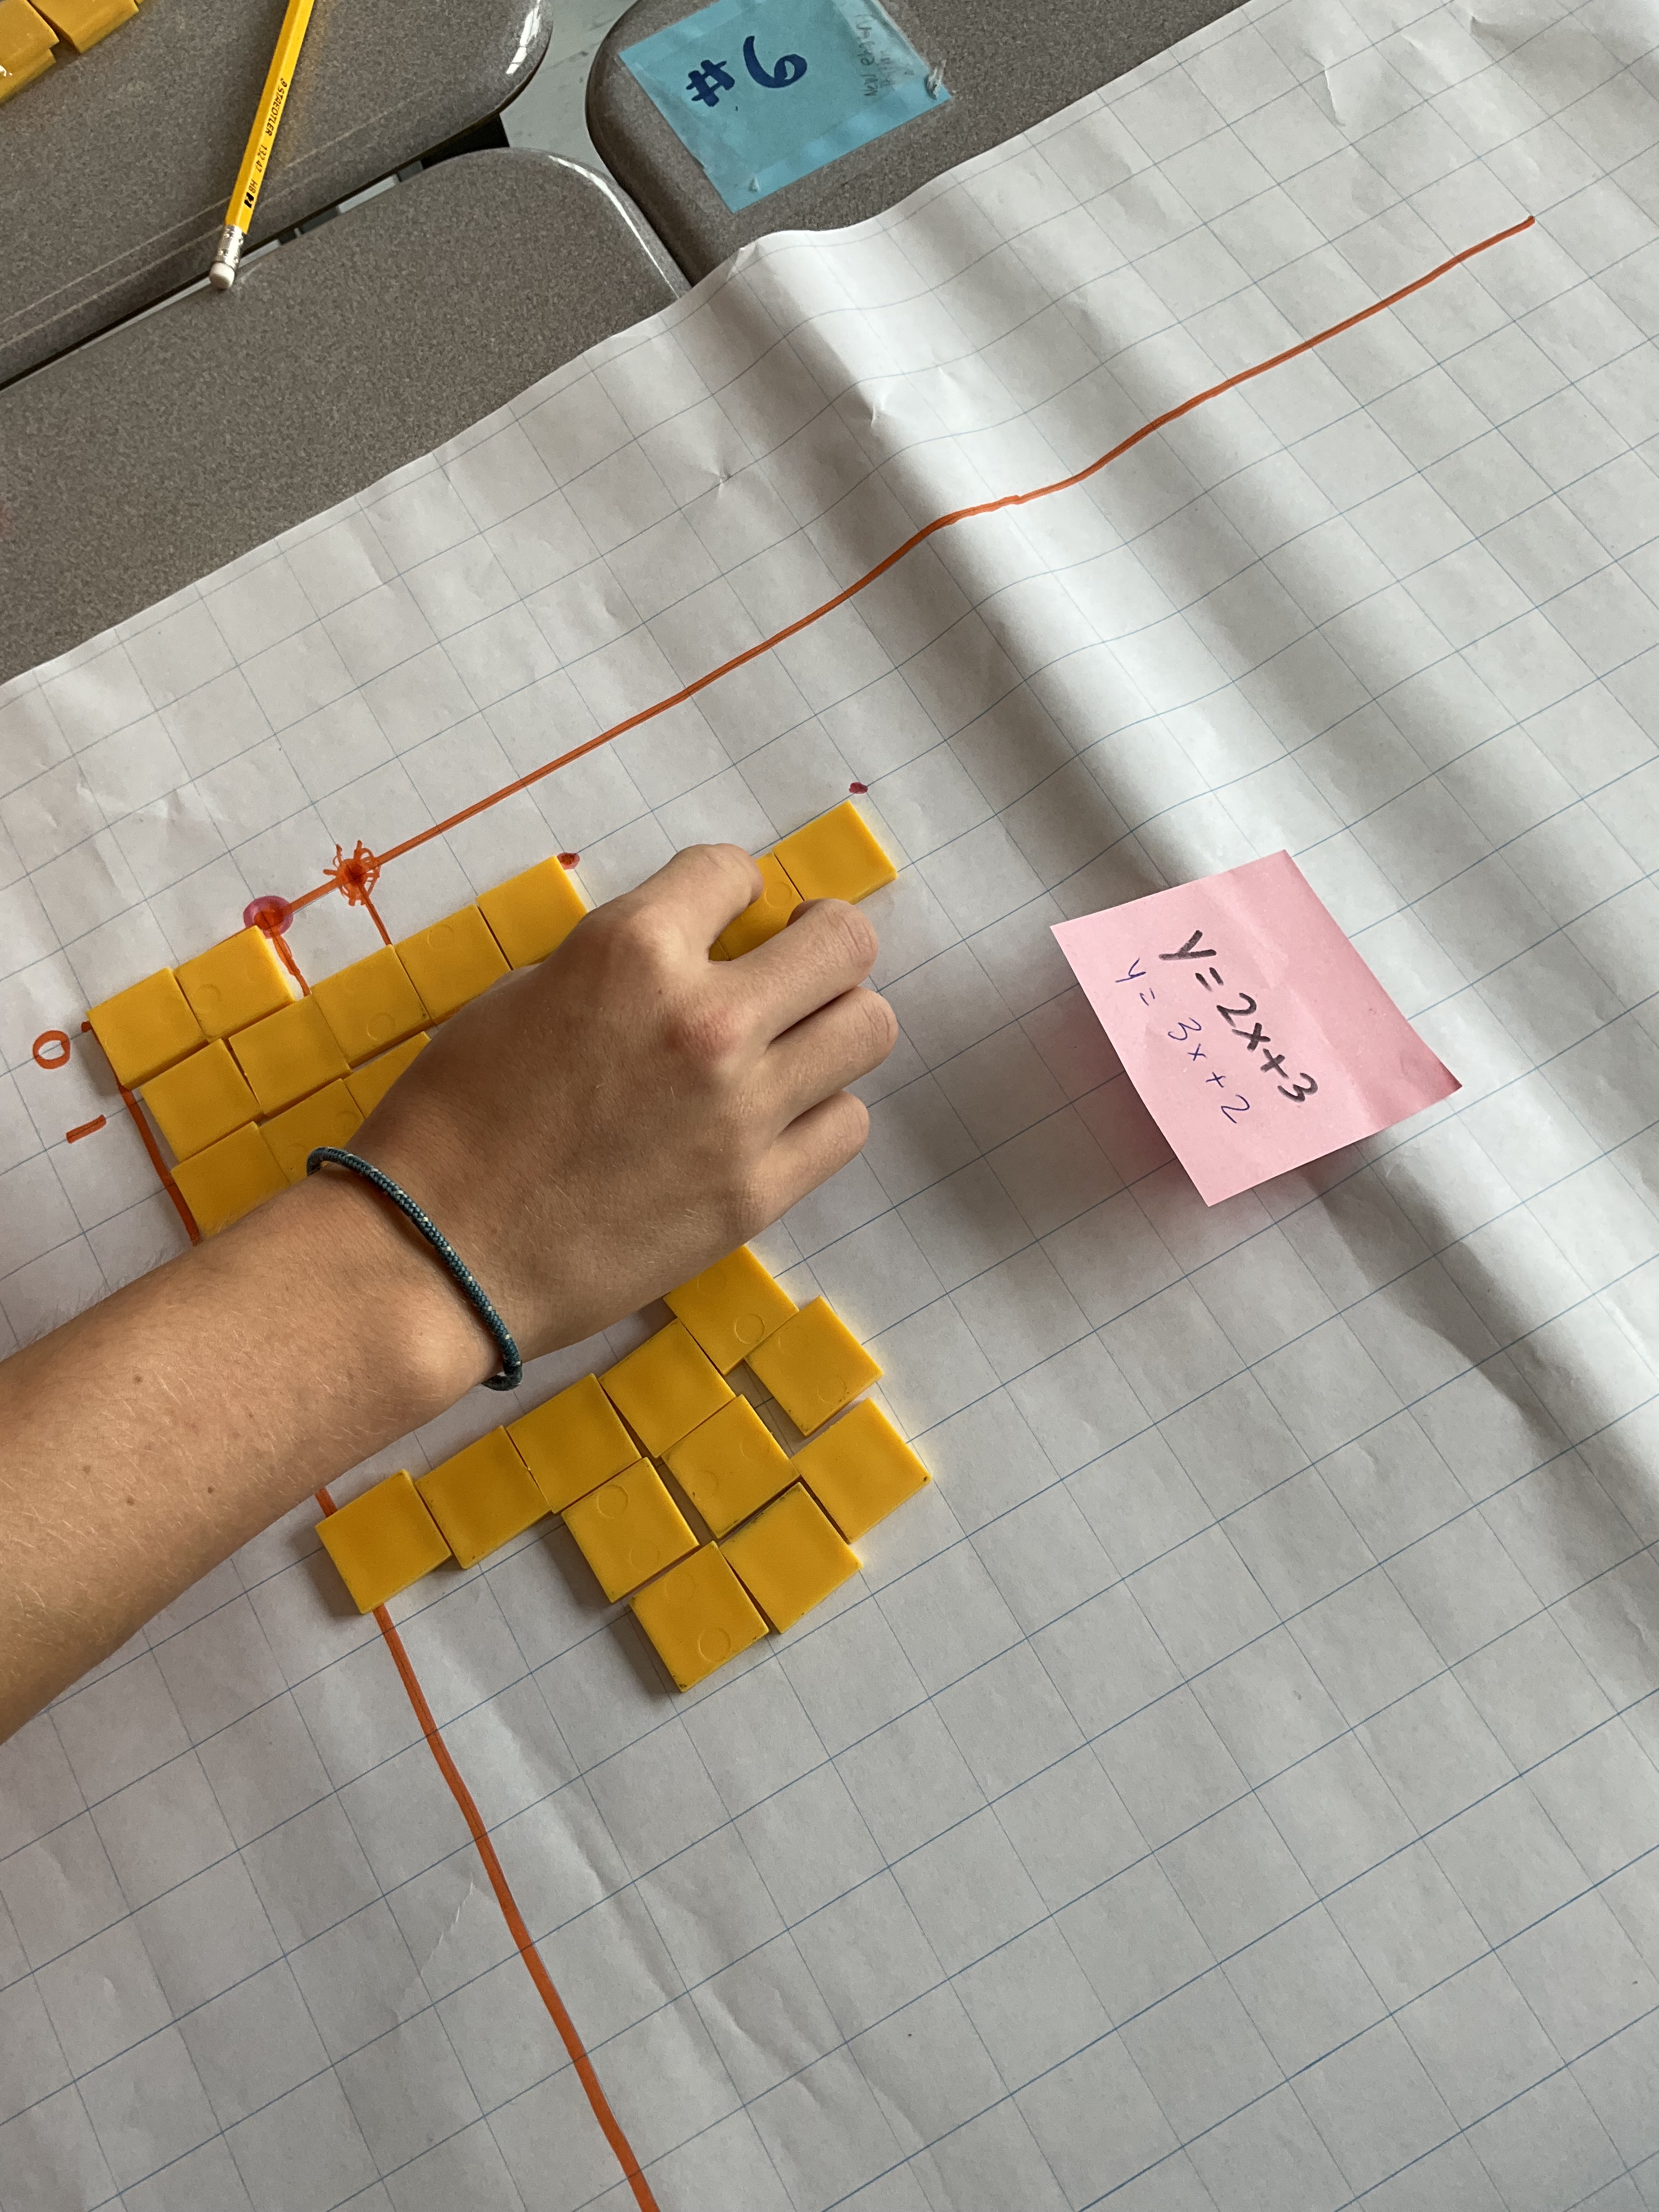
We changed colours of markers and then did the same thing for a new pattern rule, with a goal of superimposing the graphs to compare the lines. This instruction was a bit complicated for some groups to follow, but we all got 2 graphs drawn in the period, and learned a bit about the rate and the constant while we worked.
The next day we used our graphs to do consolidation. I helped with the superimposition of the graphs, sliding one graph onto the next. We then compared slopes, talked about steepness.
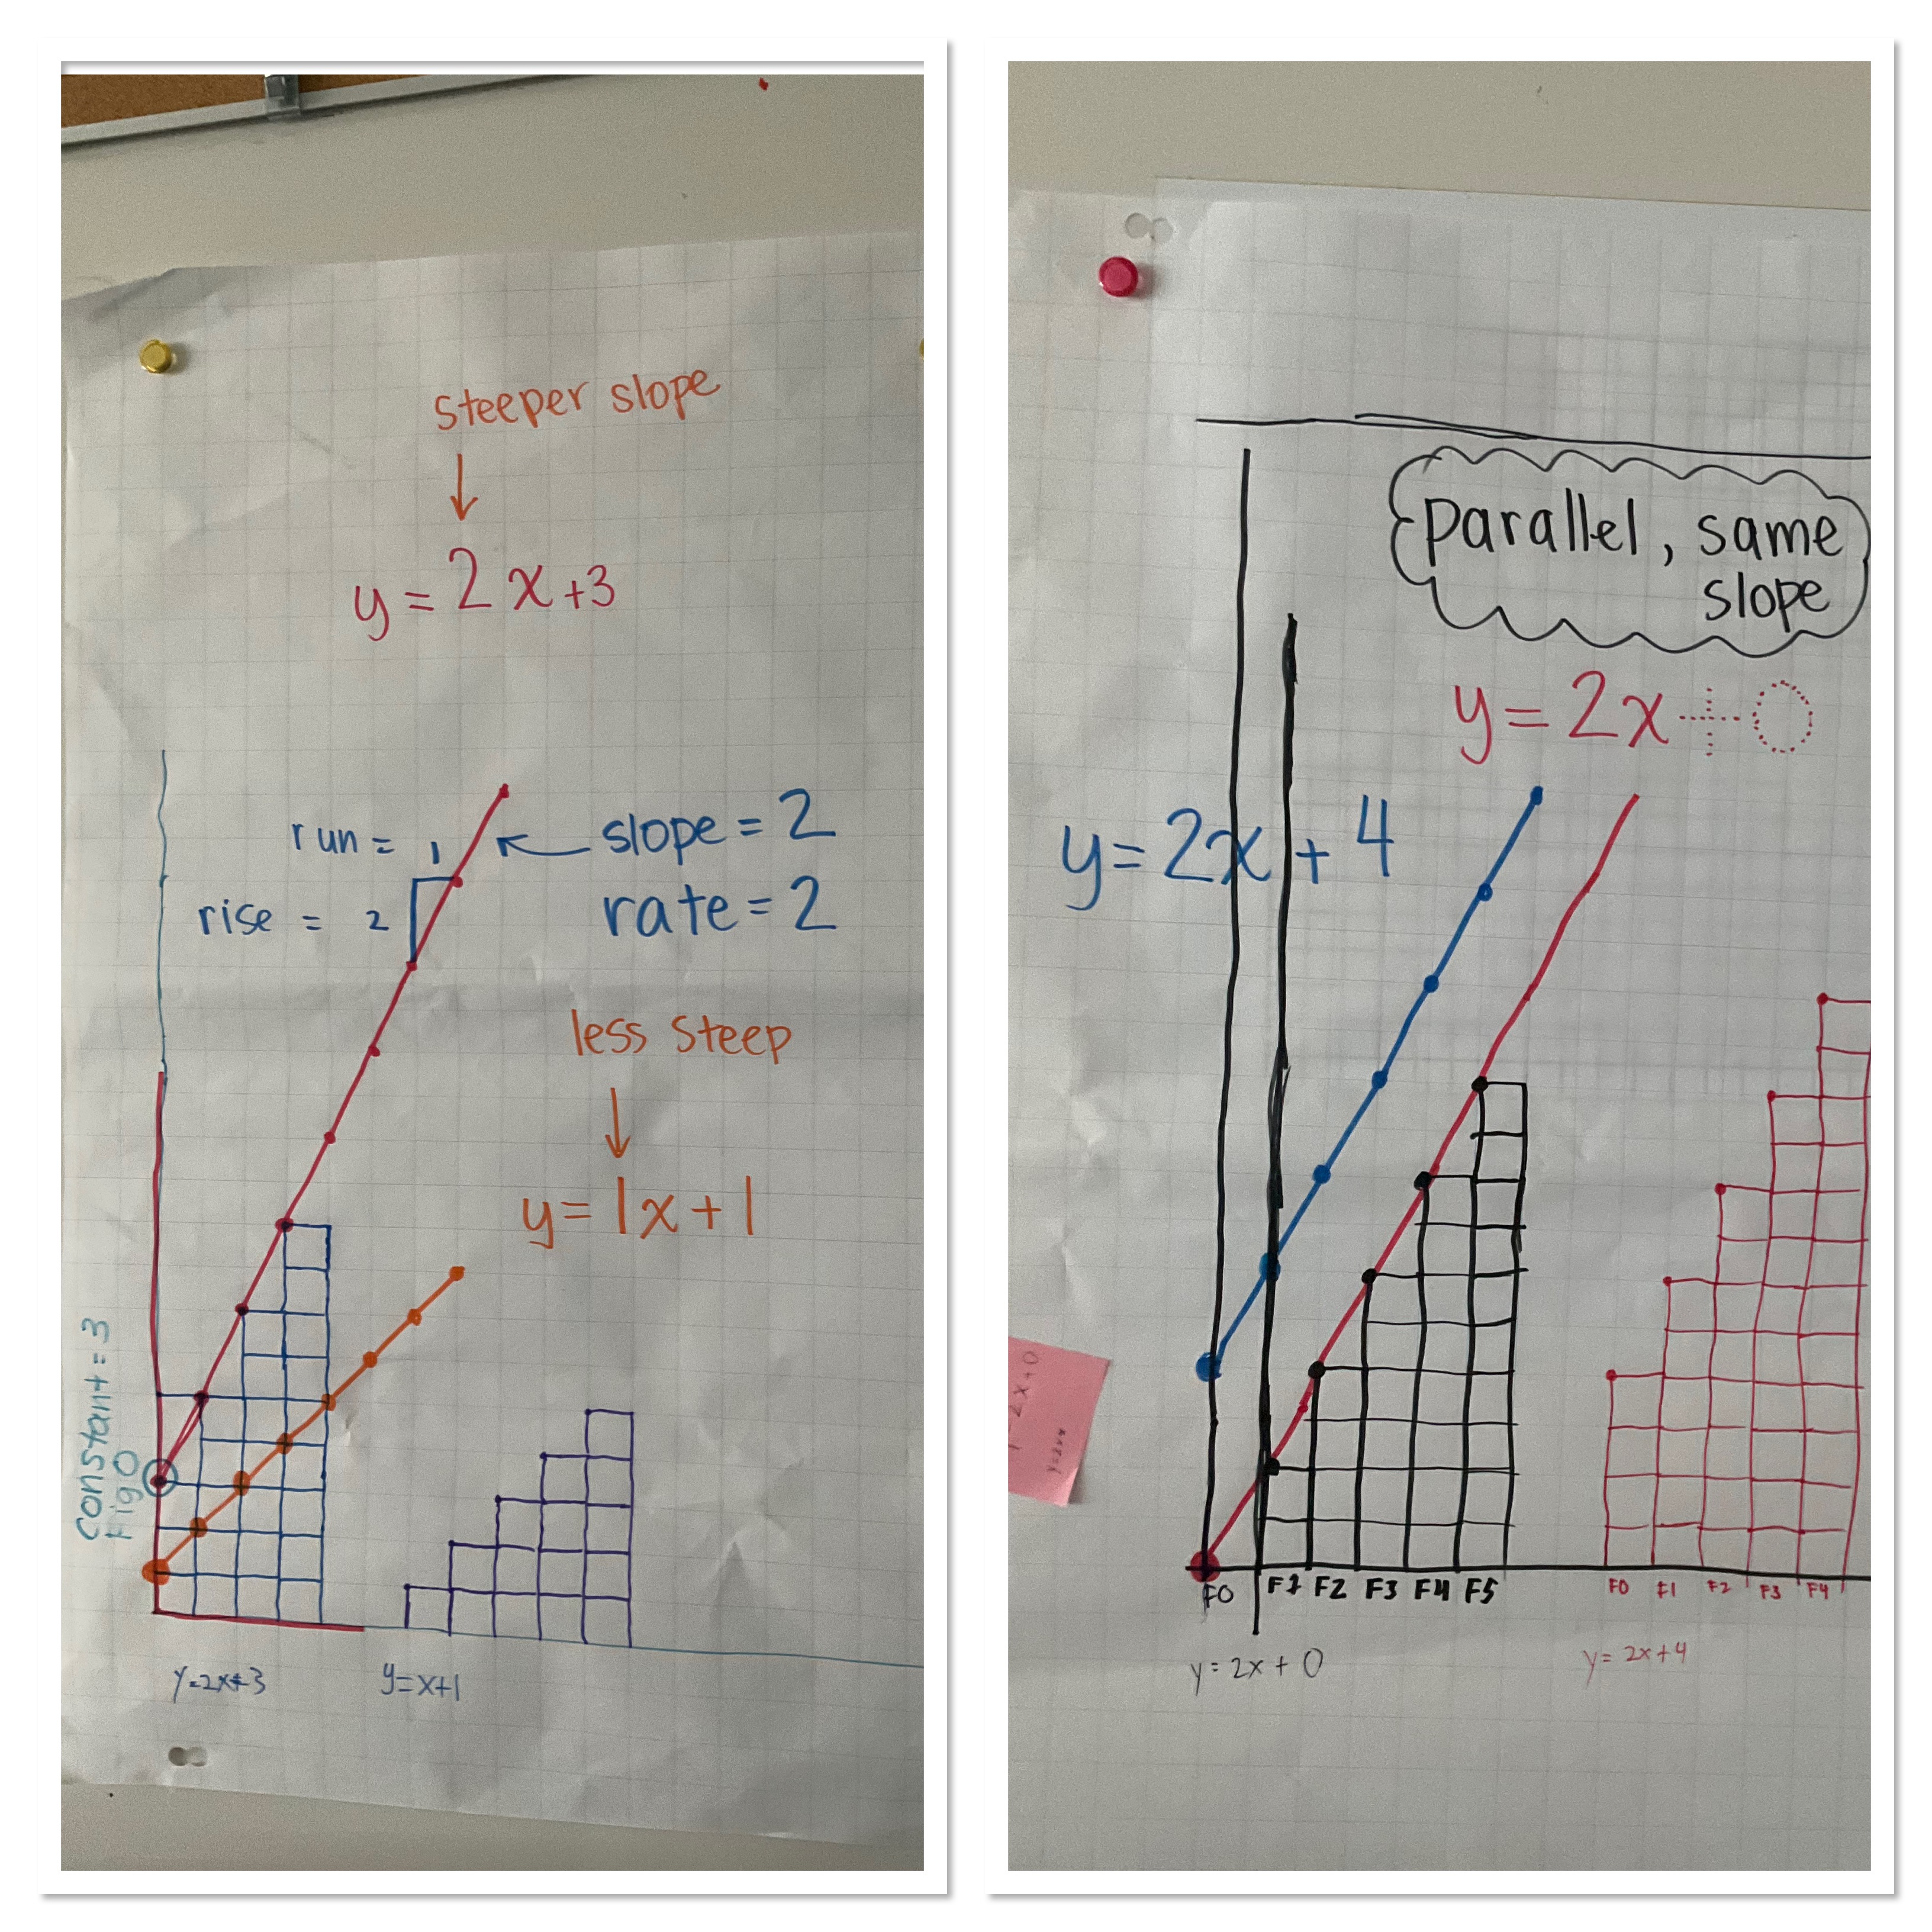
We talked about what negative signs do, if the rate is negative, or the constant is negative. We talked about intersection points and how to show that a point is on both lines.

We looked at making a lot of parallel lines. We repeated a lot of times that parallel means “same slope”. We noticed that we don’t have to write +0 at the end of the equation when the constant is 0. These 2 lines cross at the origin (0,0).

We noticed that if the constant is the same for 2 lines it will be the point of intersection. We also noticed how we could do the same task but with quadratic relationships. Here there are 2 intersection points between a line and a parabola.
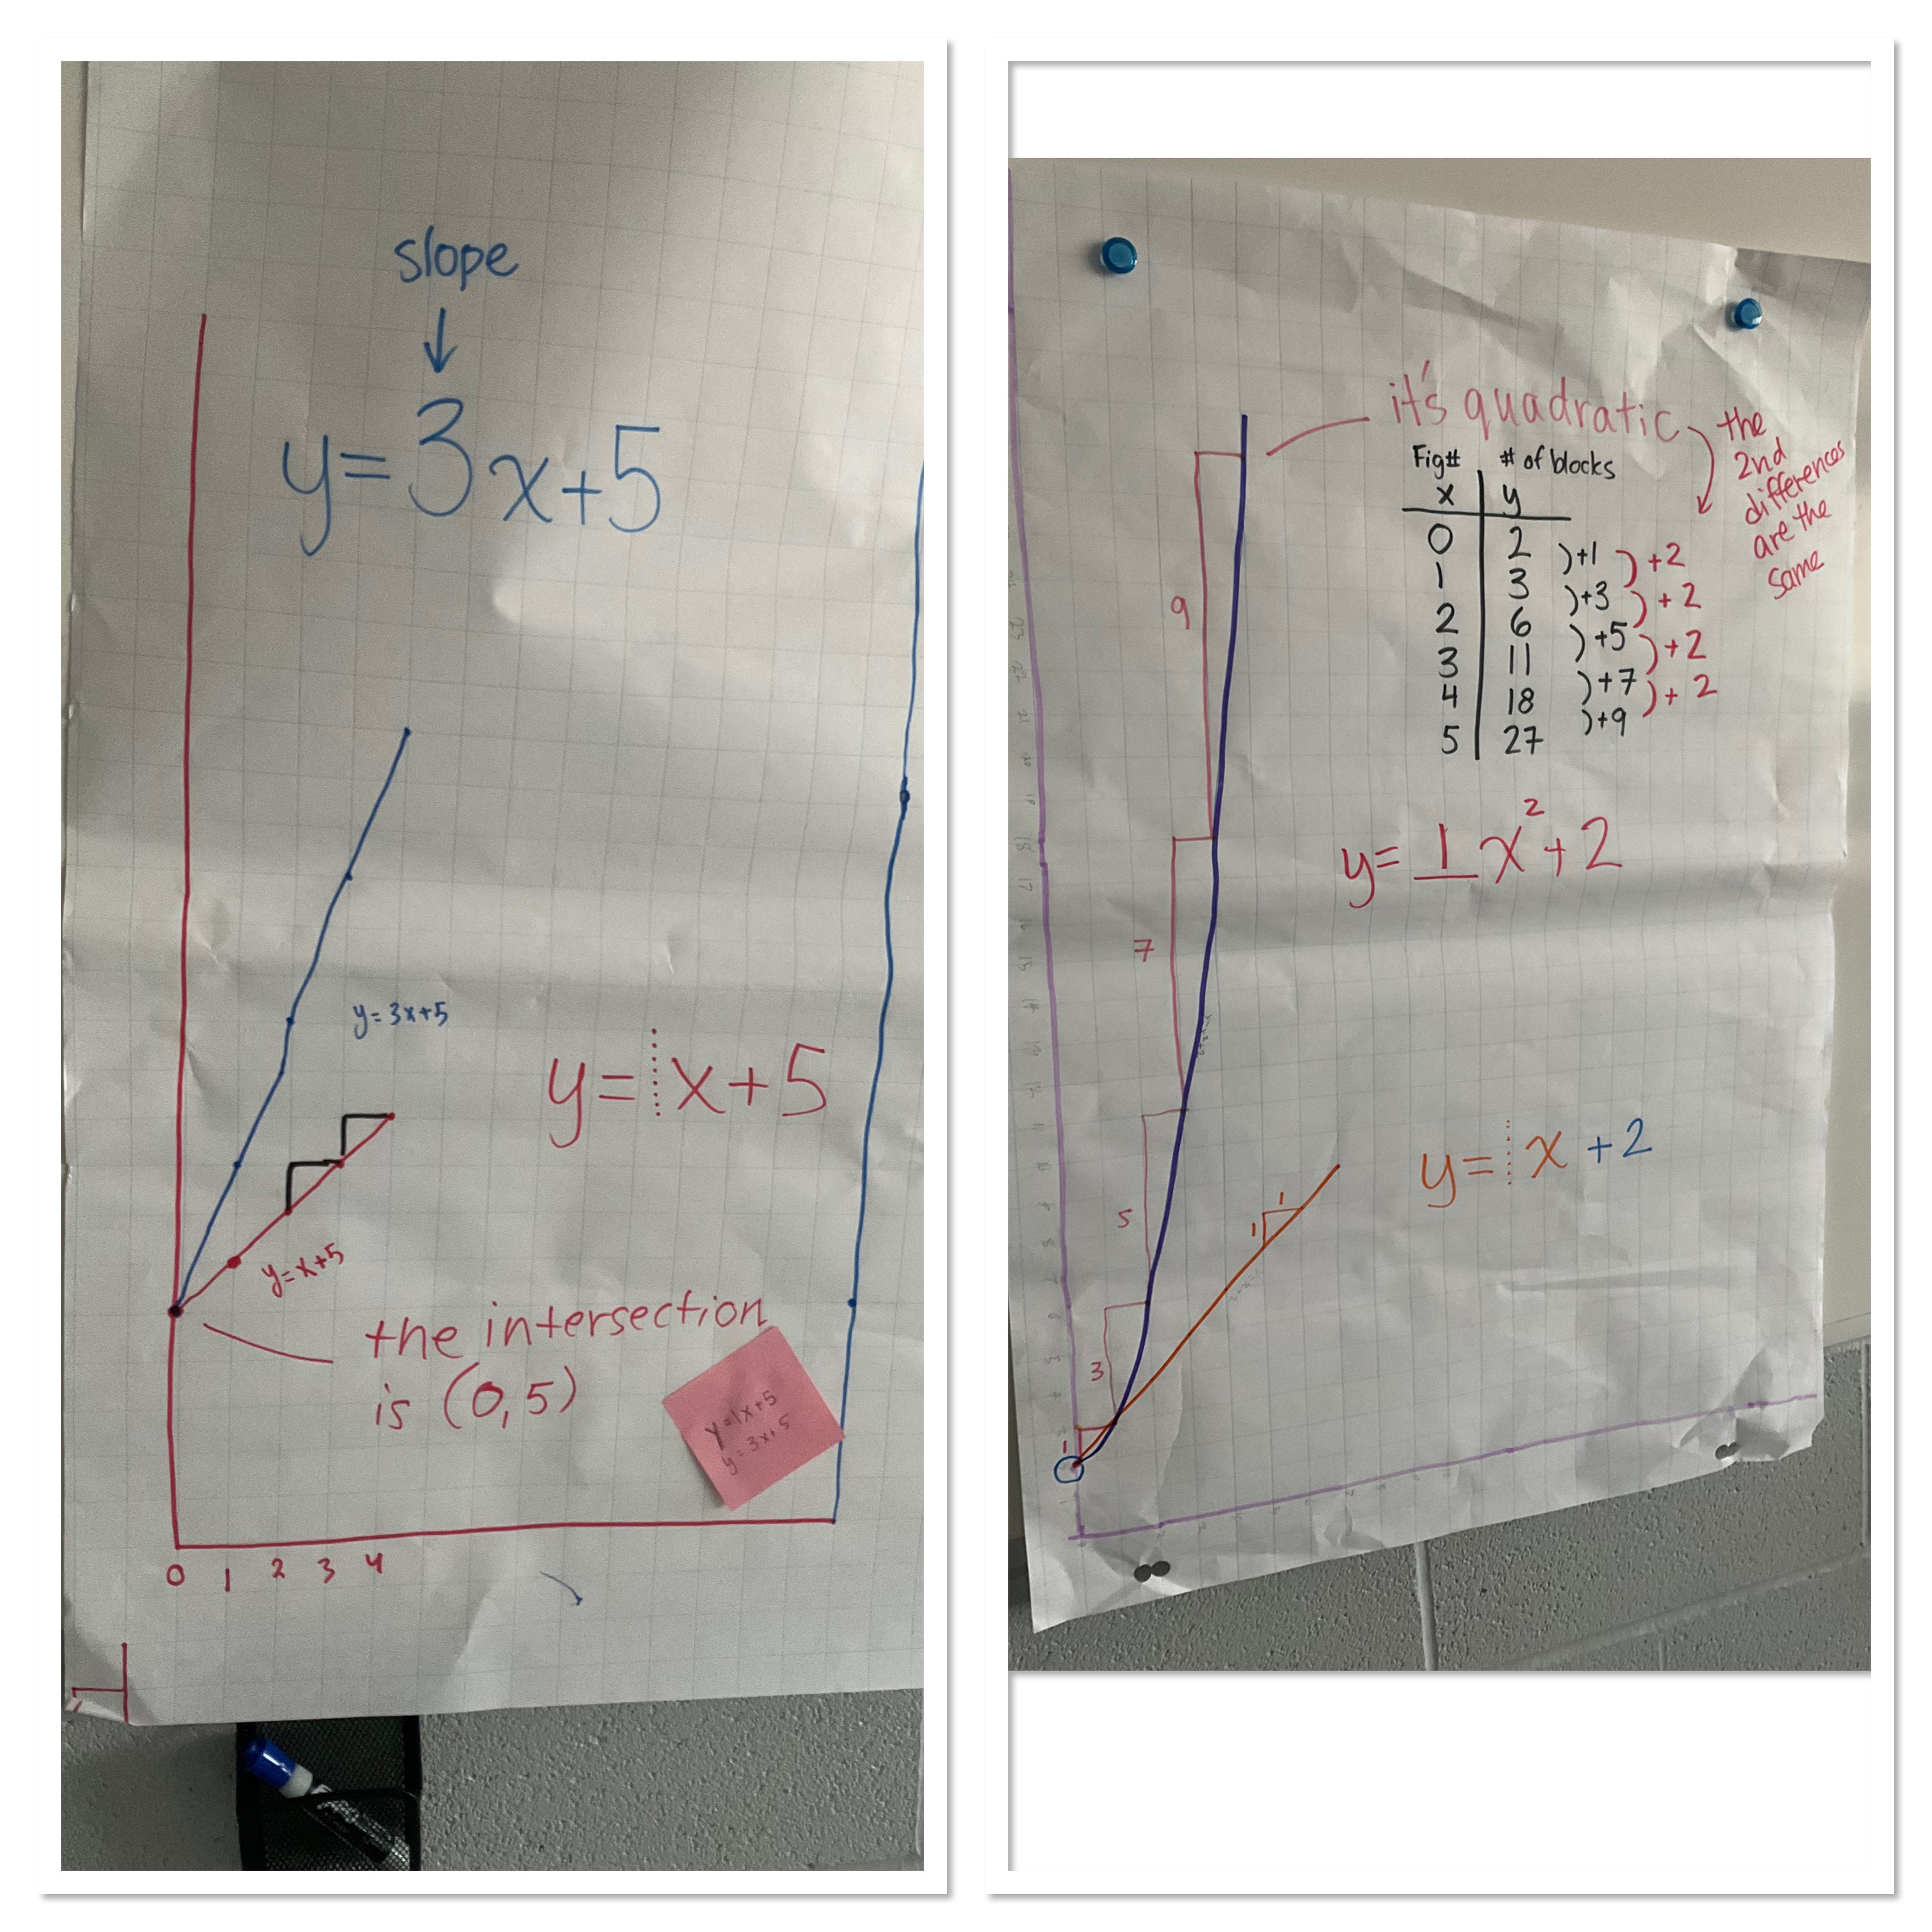
By the end of the 2nd day we are getting really confident with out graphing skills.
Intro to Pseudocode
I had the chance to work with a grade 9 class this week to introduce pseudocode to them. Their teacher had a neat idea to start us off: write the steps for tying your shoes. We had several attempts which were not highly successful, and then edited our directions to add more details.

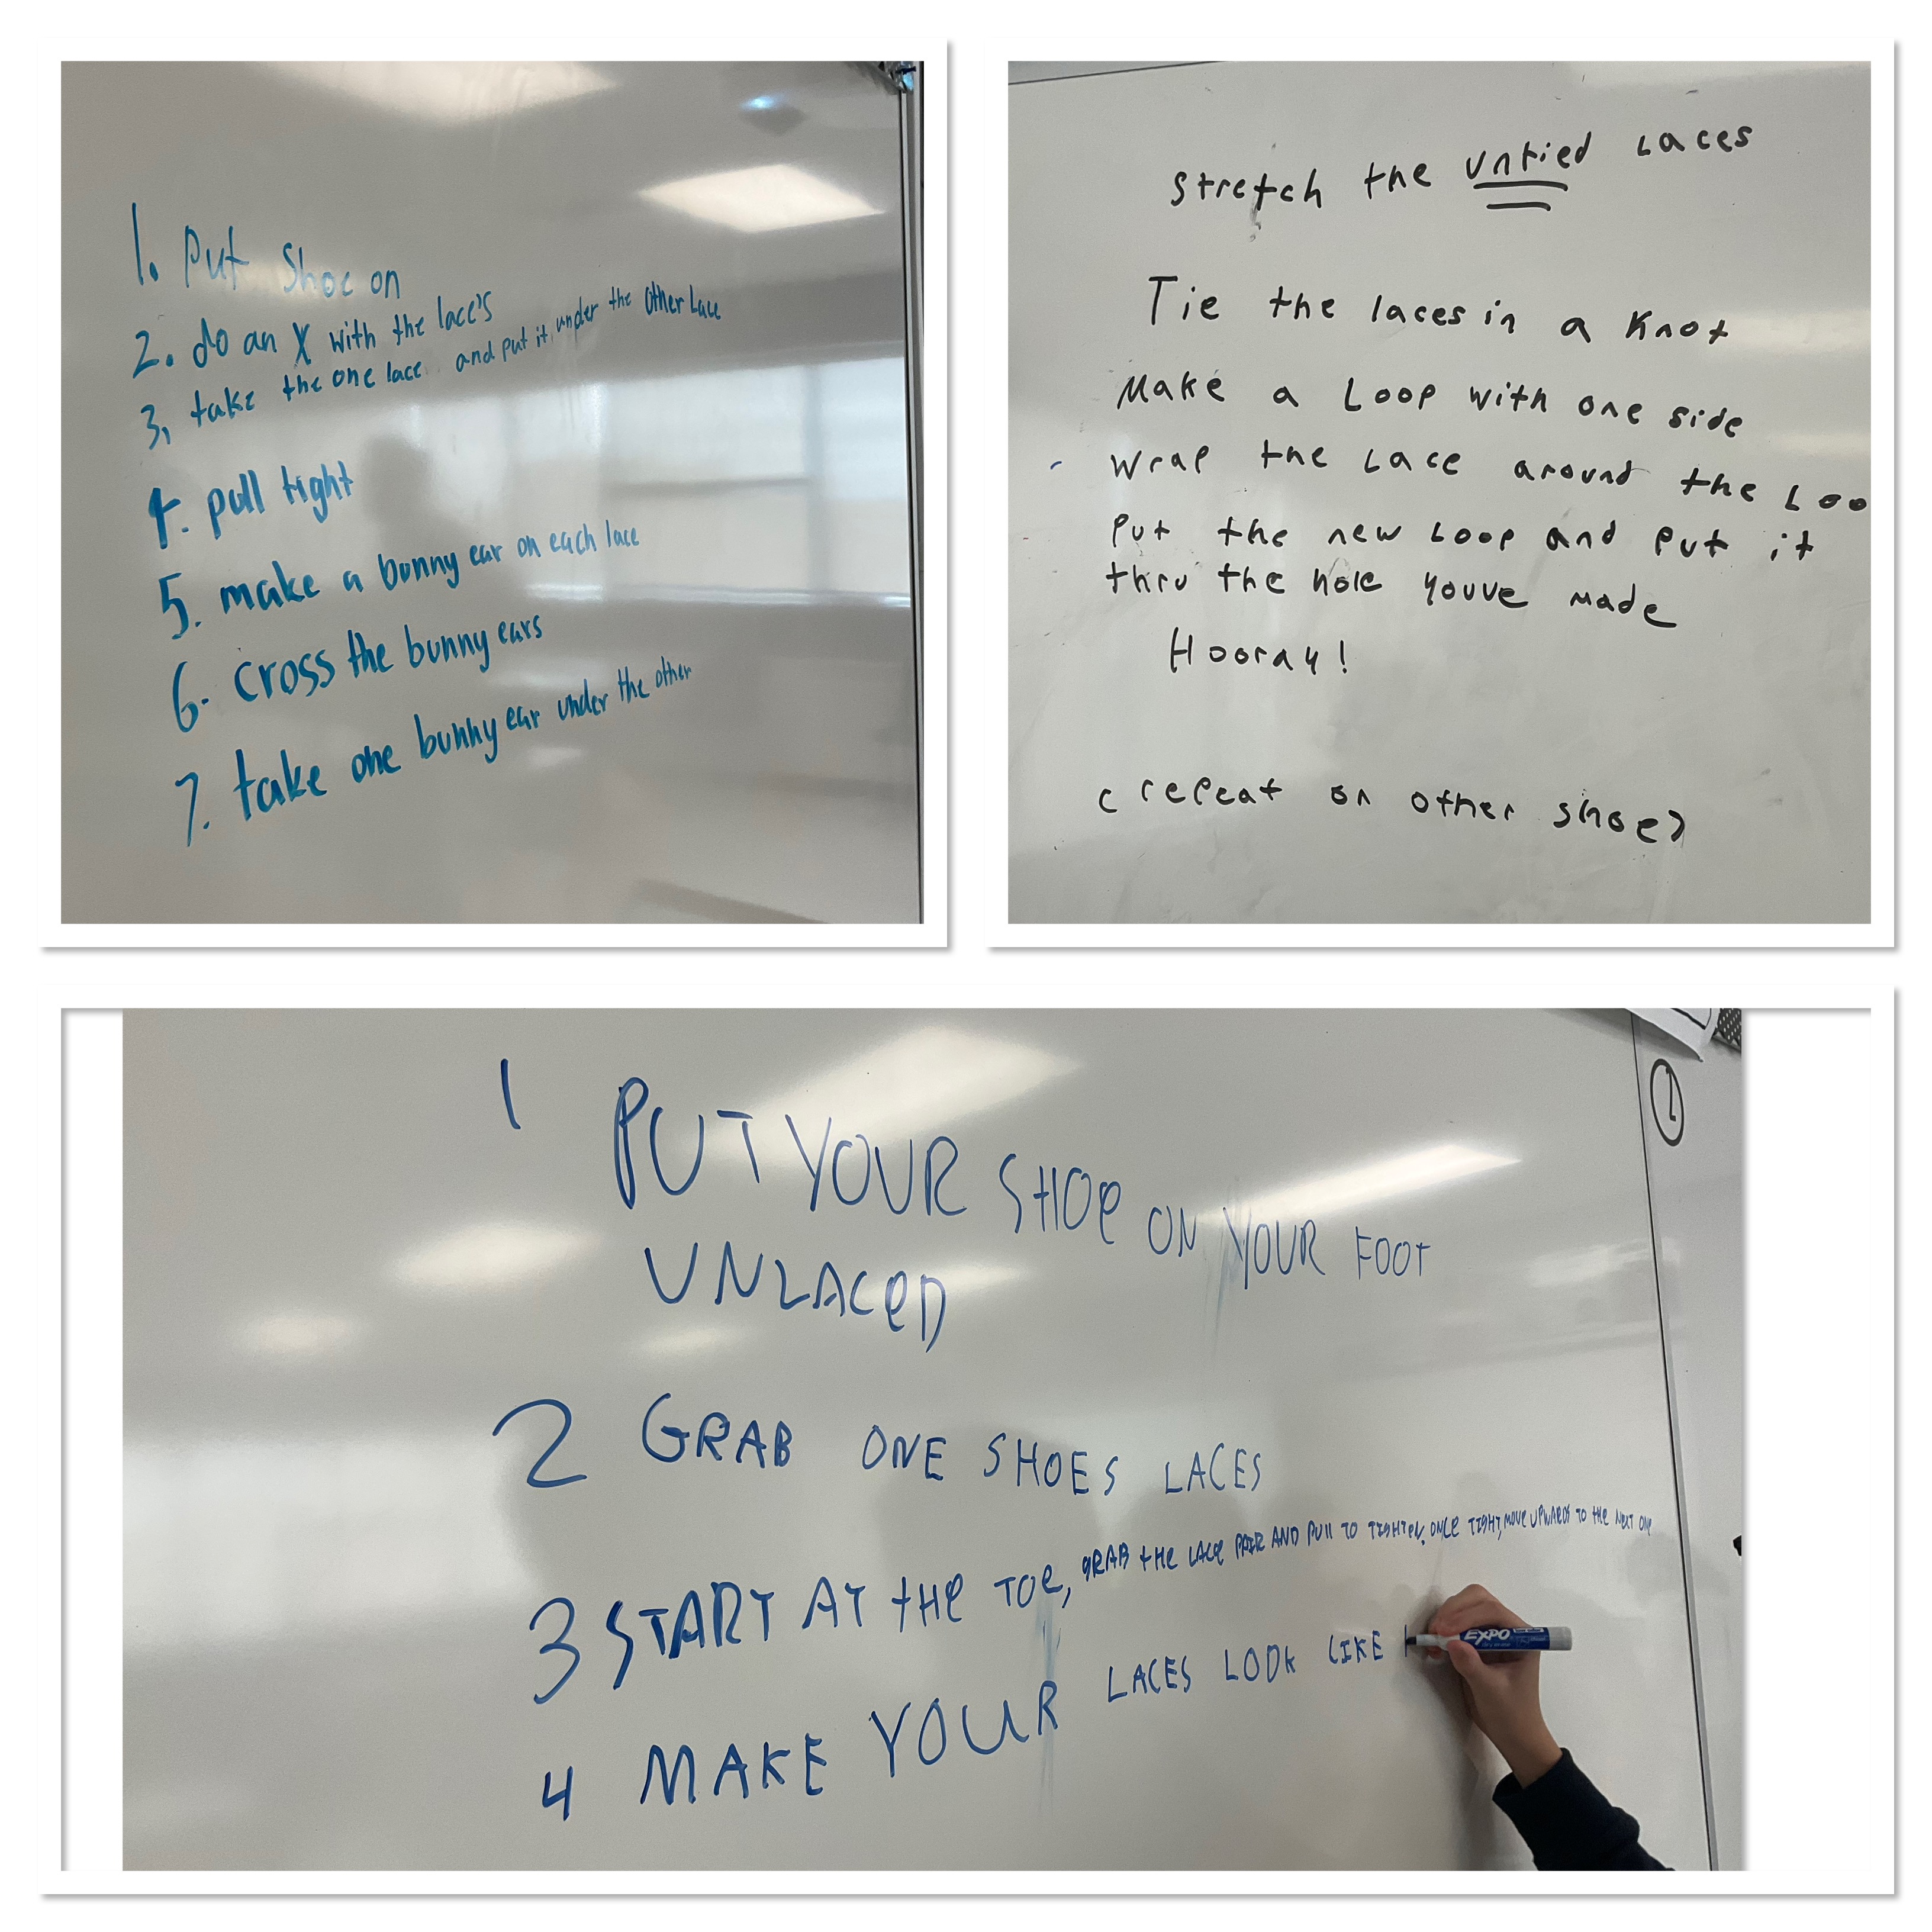
We followed up this task with a video of how to make a peanut butter sandwich.
Finally we started to put some pseudocode in the right order like a puzzle.
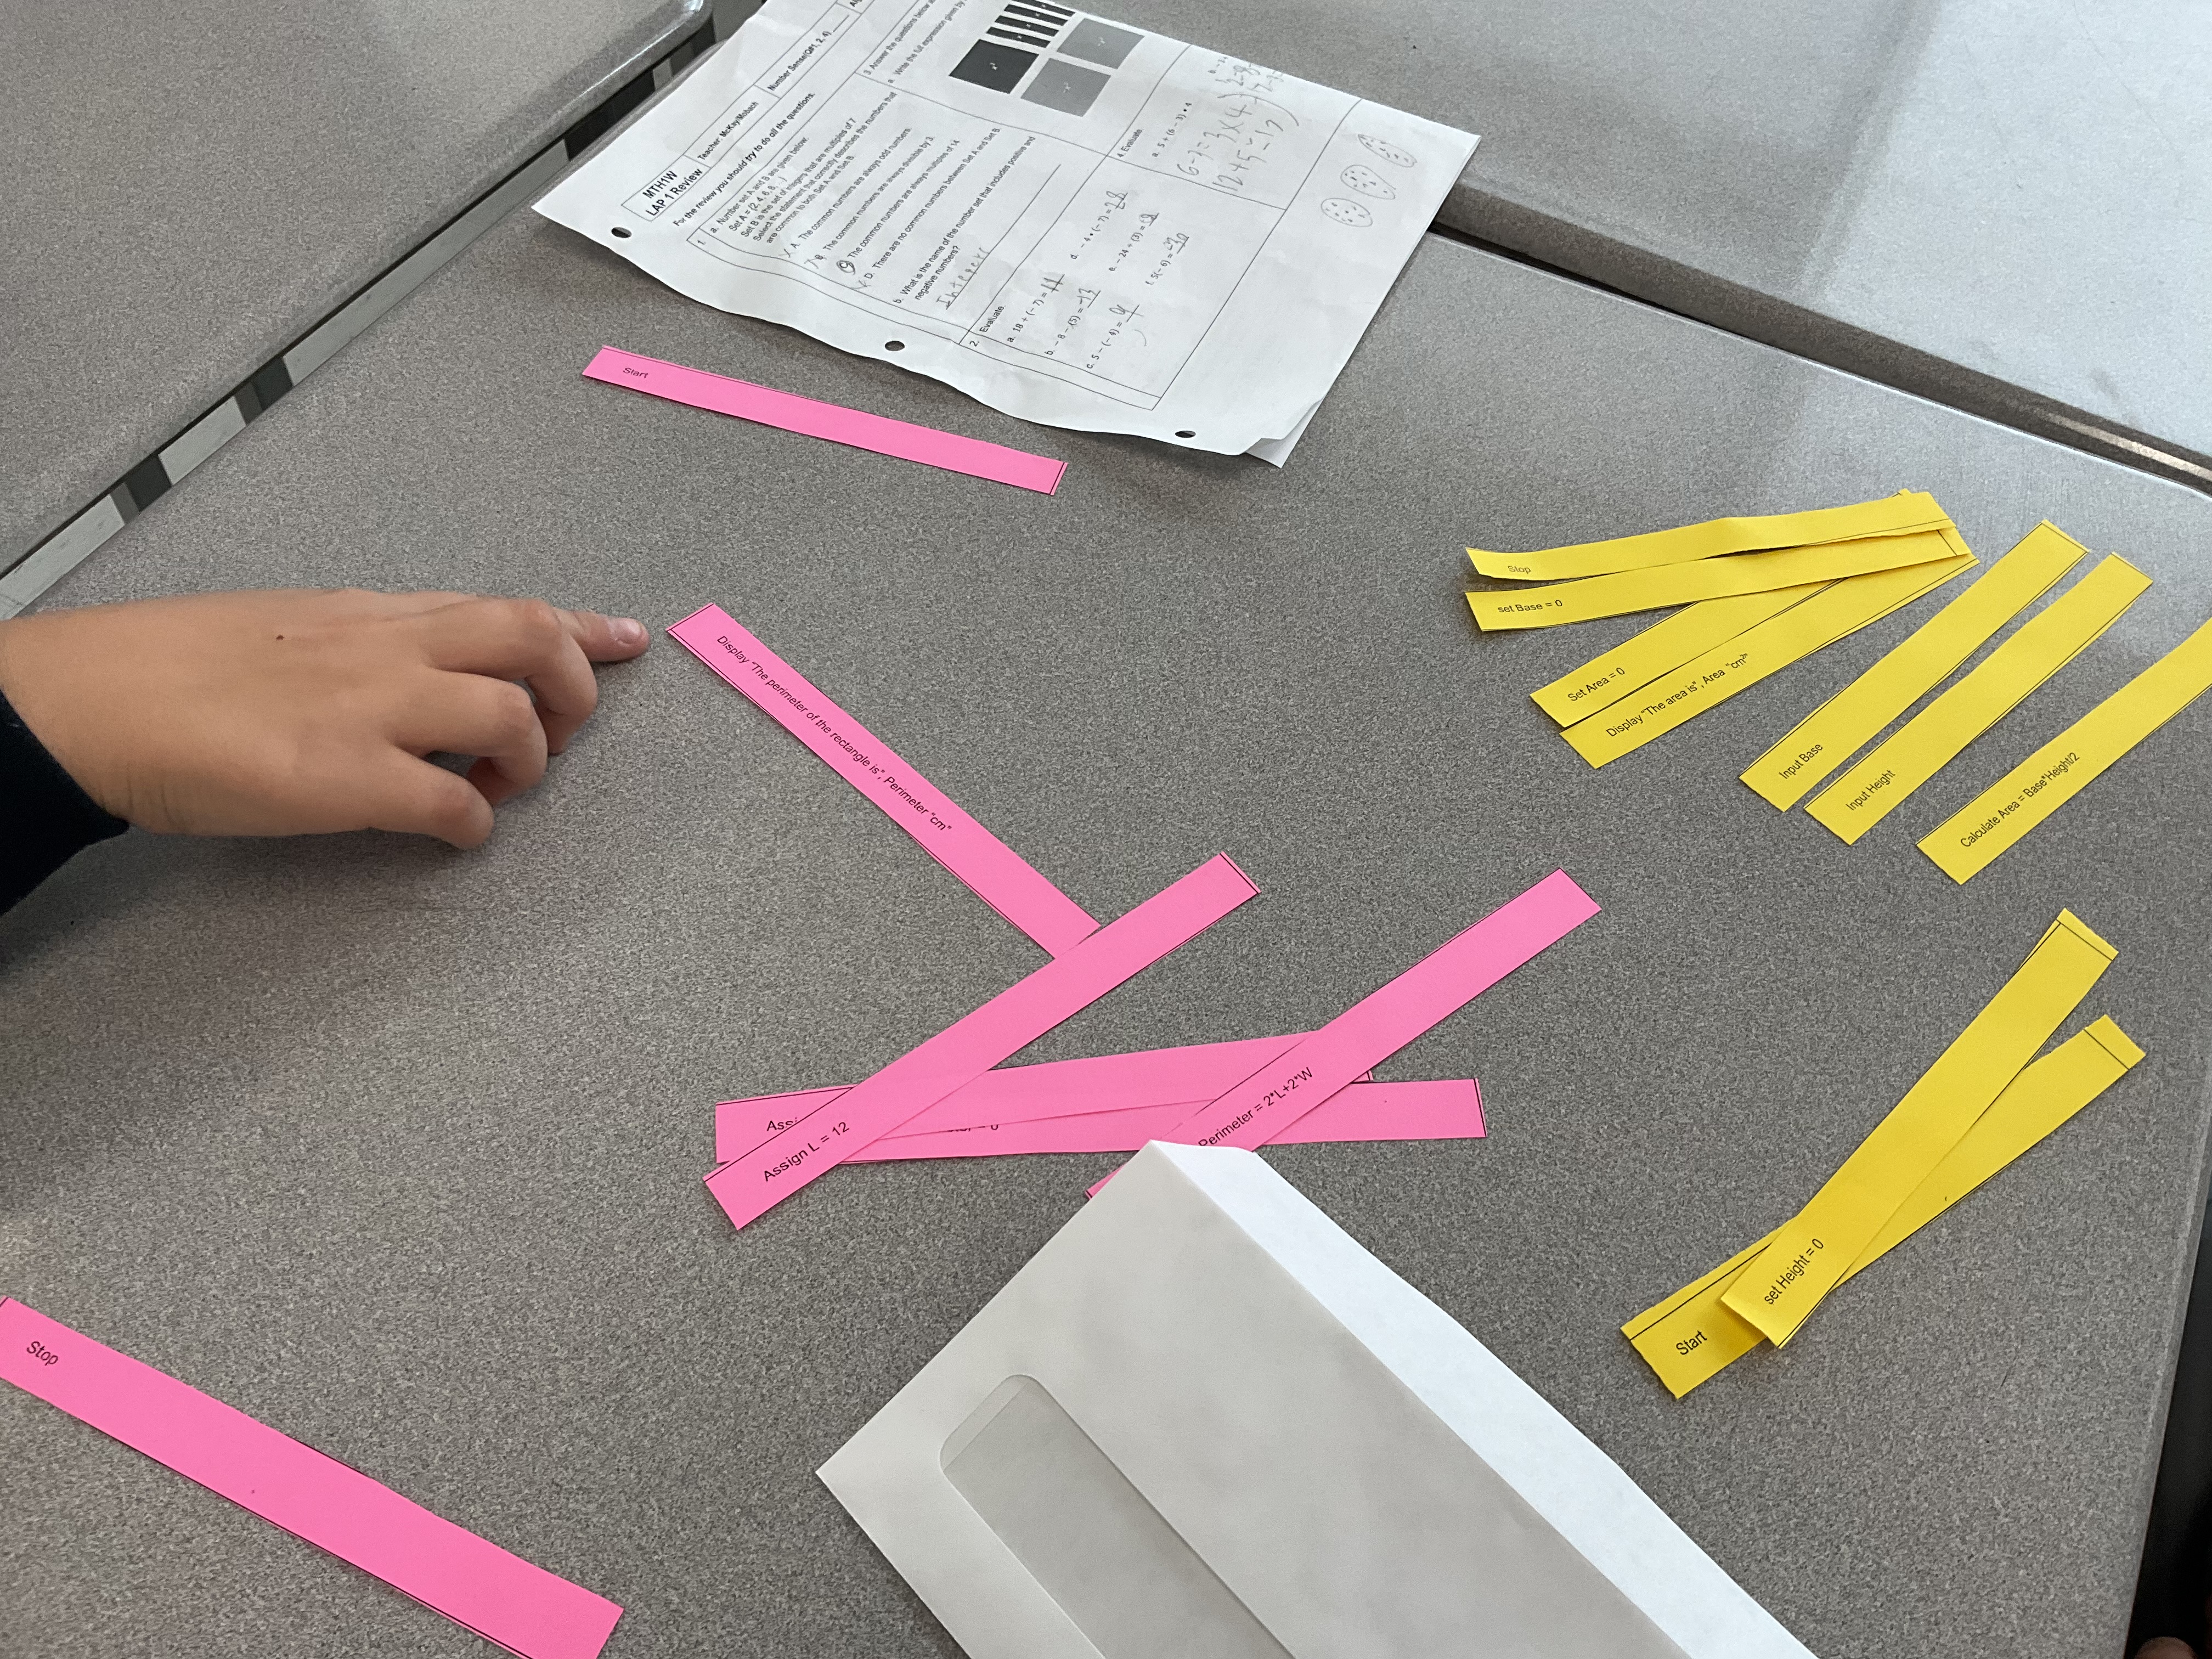
once we had the code we debriefed what the instructions meant, and what the key aspects of code are (variables and calculations and what to display on the screen).

This is a nice start to understanding code, and a preview about calculating area and perimeter. It was a fun active lesson with lots of participation and giggles.
QSLMA mini conference 2025
I was thankful to have had the invitation to present at the QSLMA mini conference this year. My presentation was about Creating Brave Spaces in your Math Classroom (slides here).
We talked about how we start our term at KSS focusing on establishing norms, and encouraging participation, including lots of examples of noticing and wondering, and using various low floor high ceiling thinking routines and tasks, like which one doesnt belong, slow reveal graphs, dot talks, 3 act tasks and more. (The slides have more information and links to these sites).
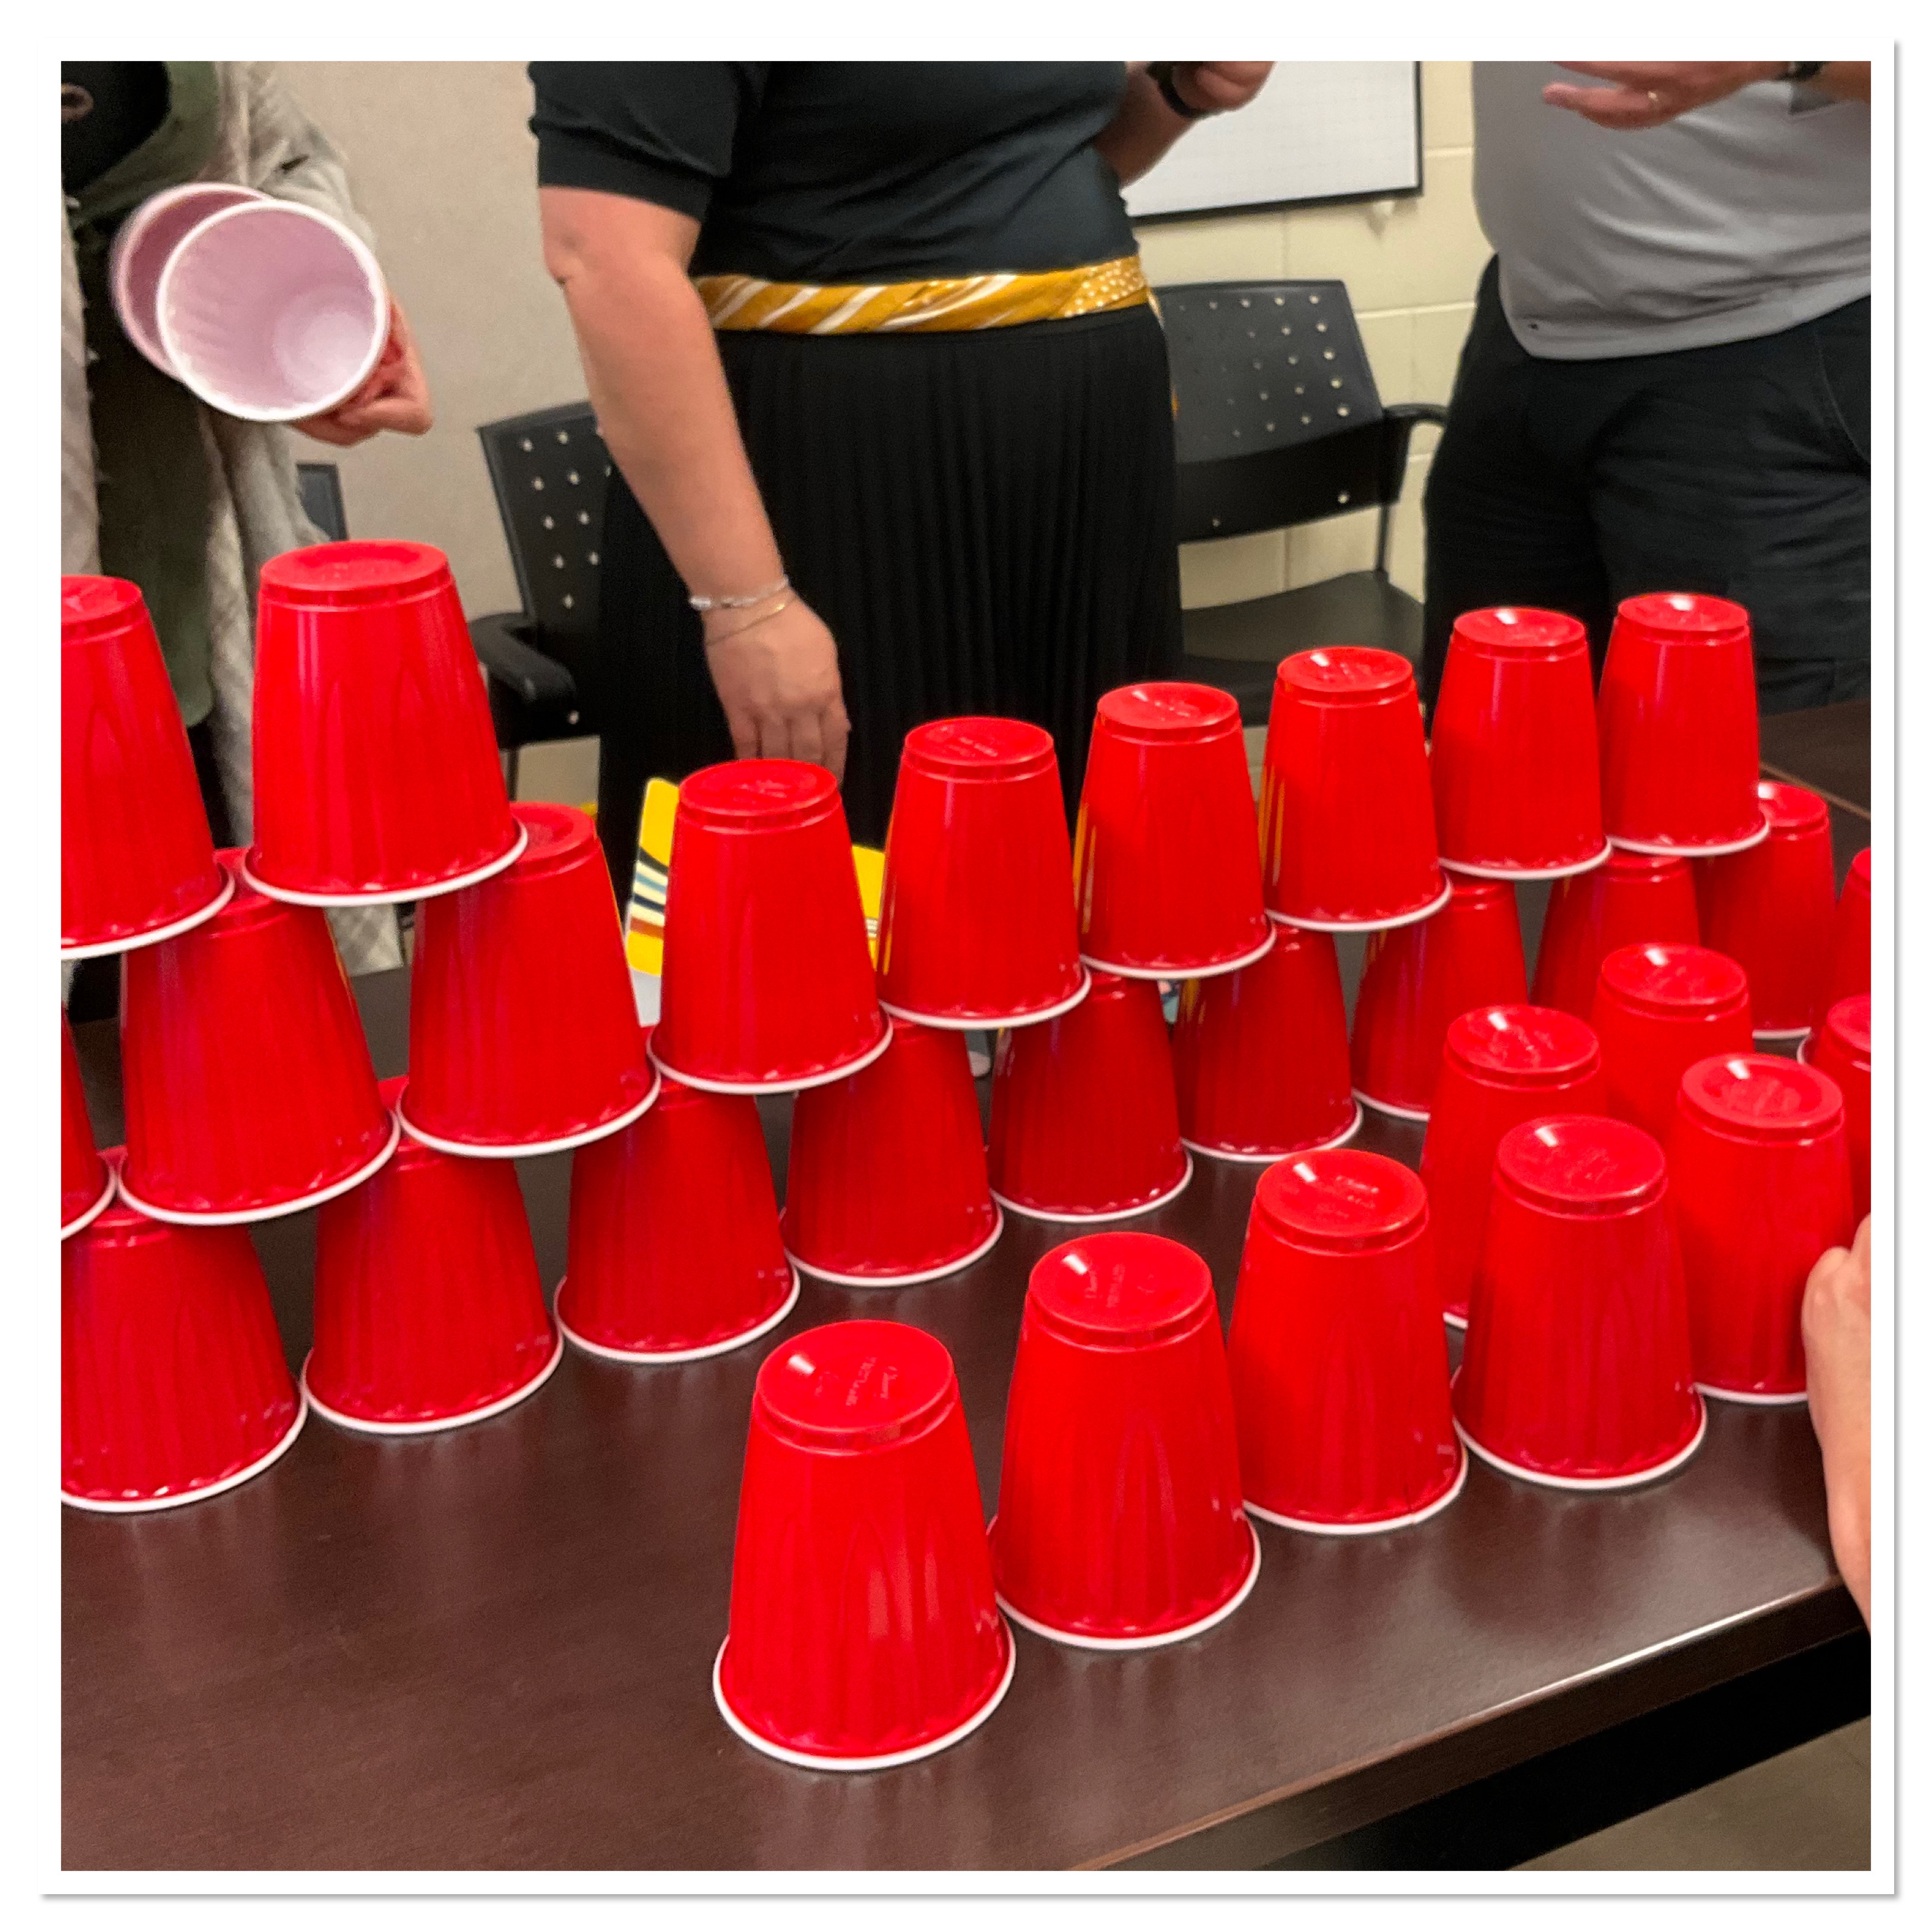
The most fun part for me was when we did a cup stacking task. The challenge was the same as I had brought to my classes this week: to build a stack of cups as tall as me.

We had a few ways to do it. It was neat to see the variety of strategies. The triangle stack extension idea had people working in different ways again. This group made a flat triangle, so each row was one less cup than the row below.
This group decided to try something I’d never tried: a triangle based pyramid of cups. (They had really wanted to have unicorn emoji faces, but my options were limited!)
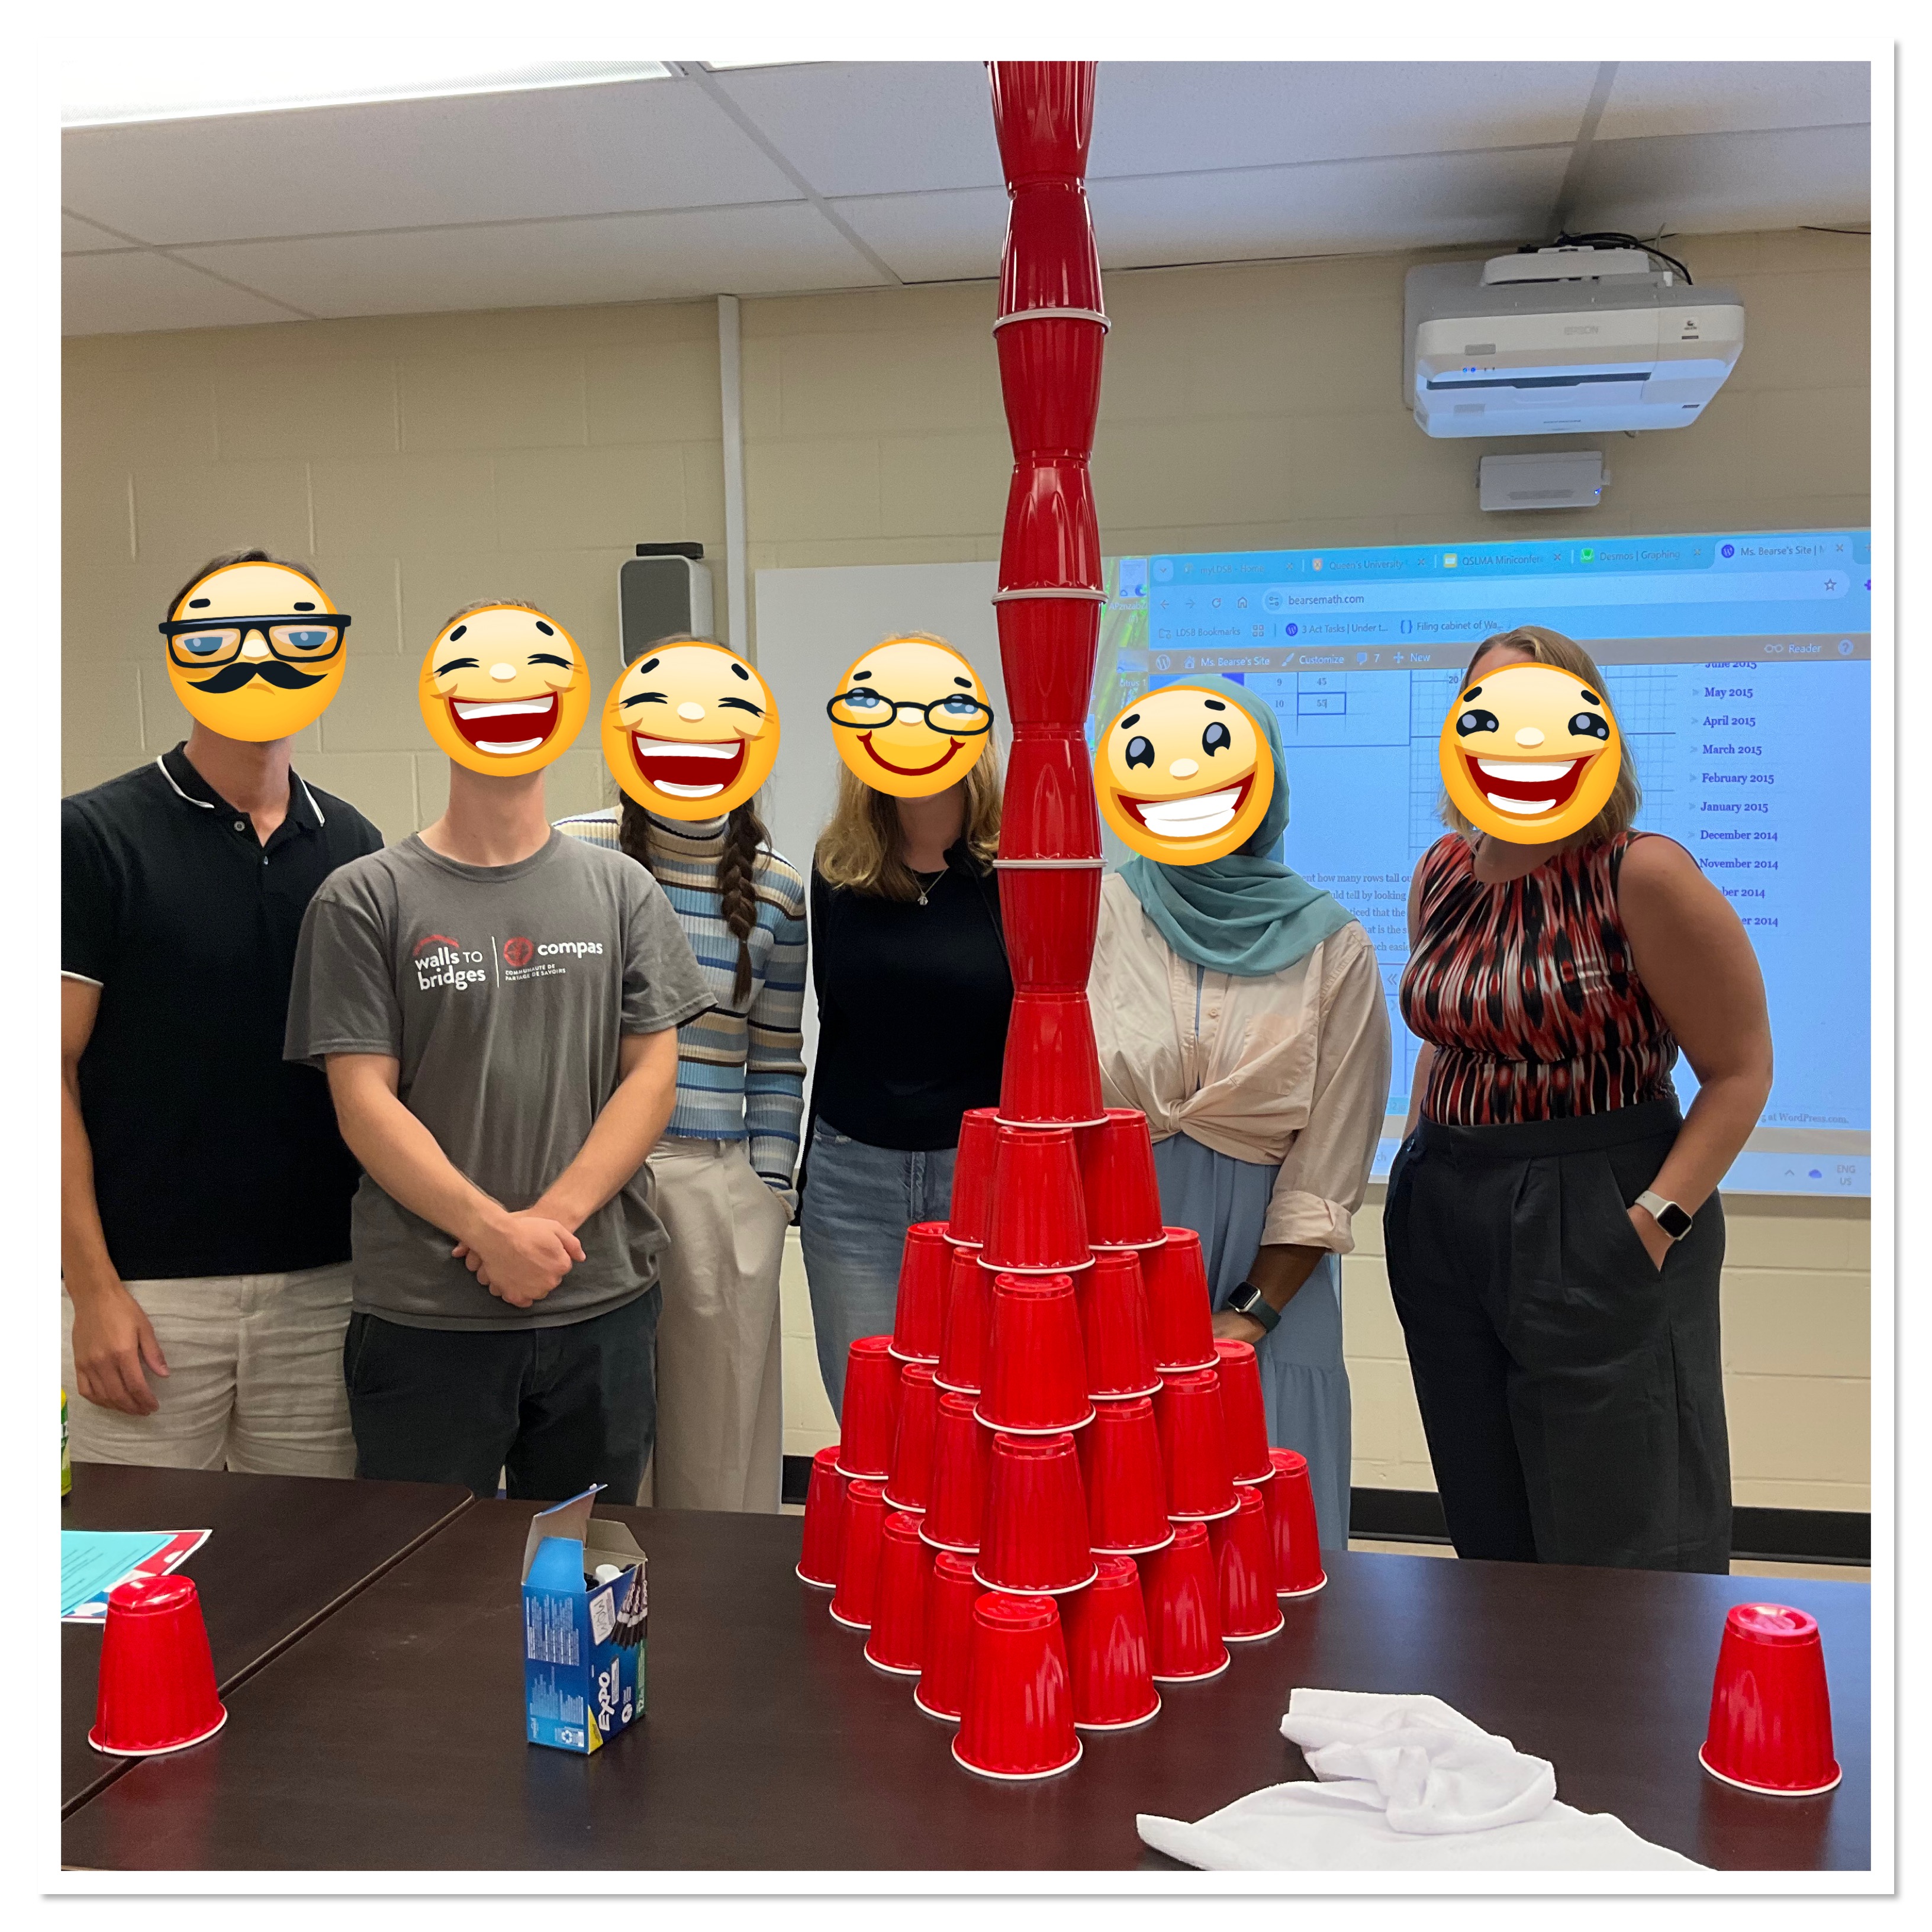
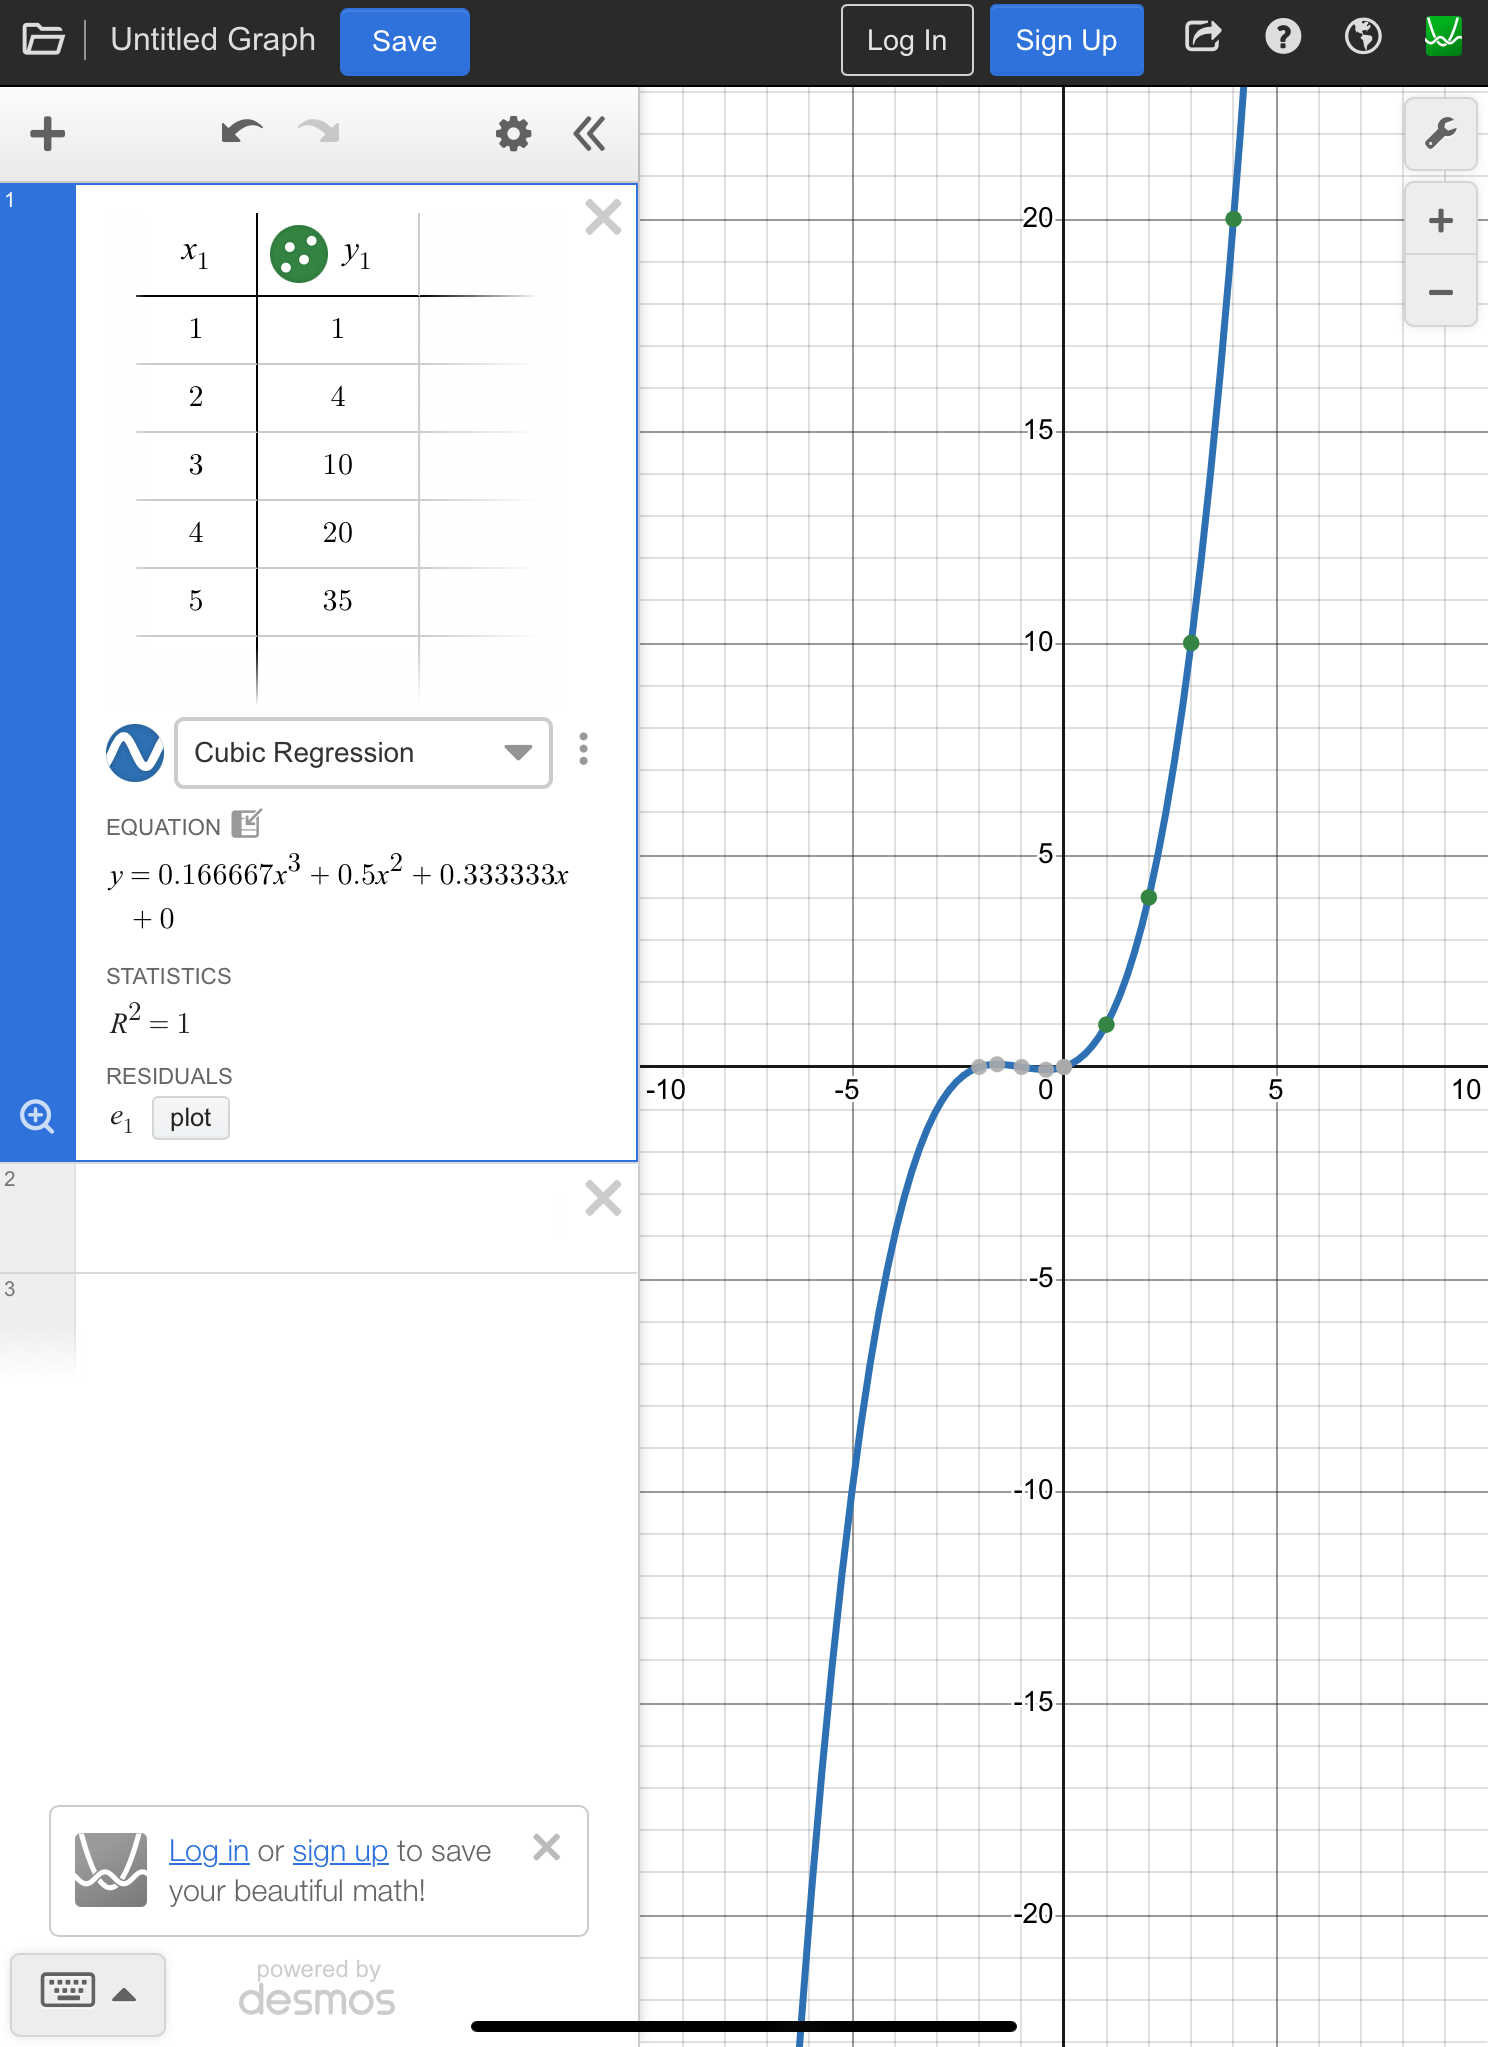
We worked on modelling the growth for this stack, and based on 3rd differences being the same, we think it is cubic. We start with 1 cup, then add successive triangle numbers as each row is added. We know that triangle numbers are a quadratic pattern, so it makes sense that it is cubic. Desmos can be used to do the regression for us.
Thank you to the enthusiastic participants for the session. It was great to have so many teacher candidates in the room.
