Fractions with Pattern Blocks
We did some work with fractions today in grade 8. I’ve been helping a small group of students build their skills this term. Today we worked with pattern blocks and concept circles. This first one had 1 yellow hexagon as 1, then I placed blocks in each segment and students needed to write the fraction. I made sure that we had some that were greater than 1, and some that could be simplified.
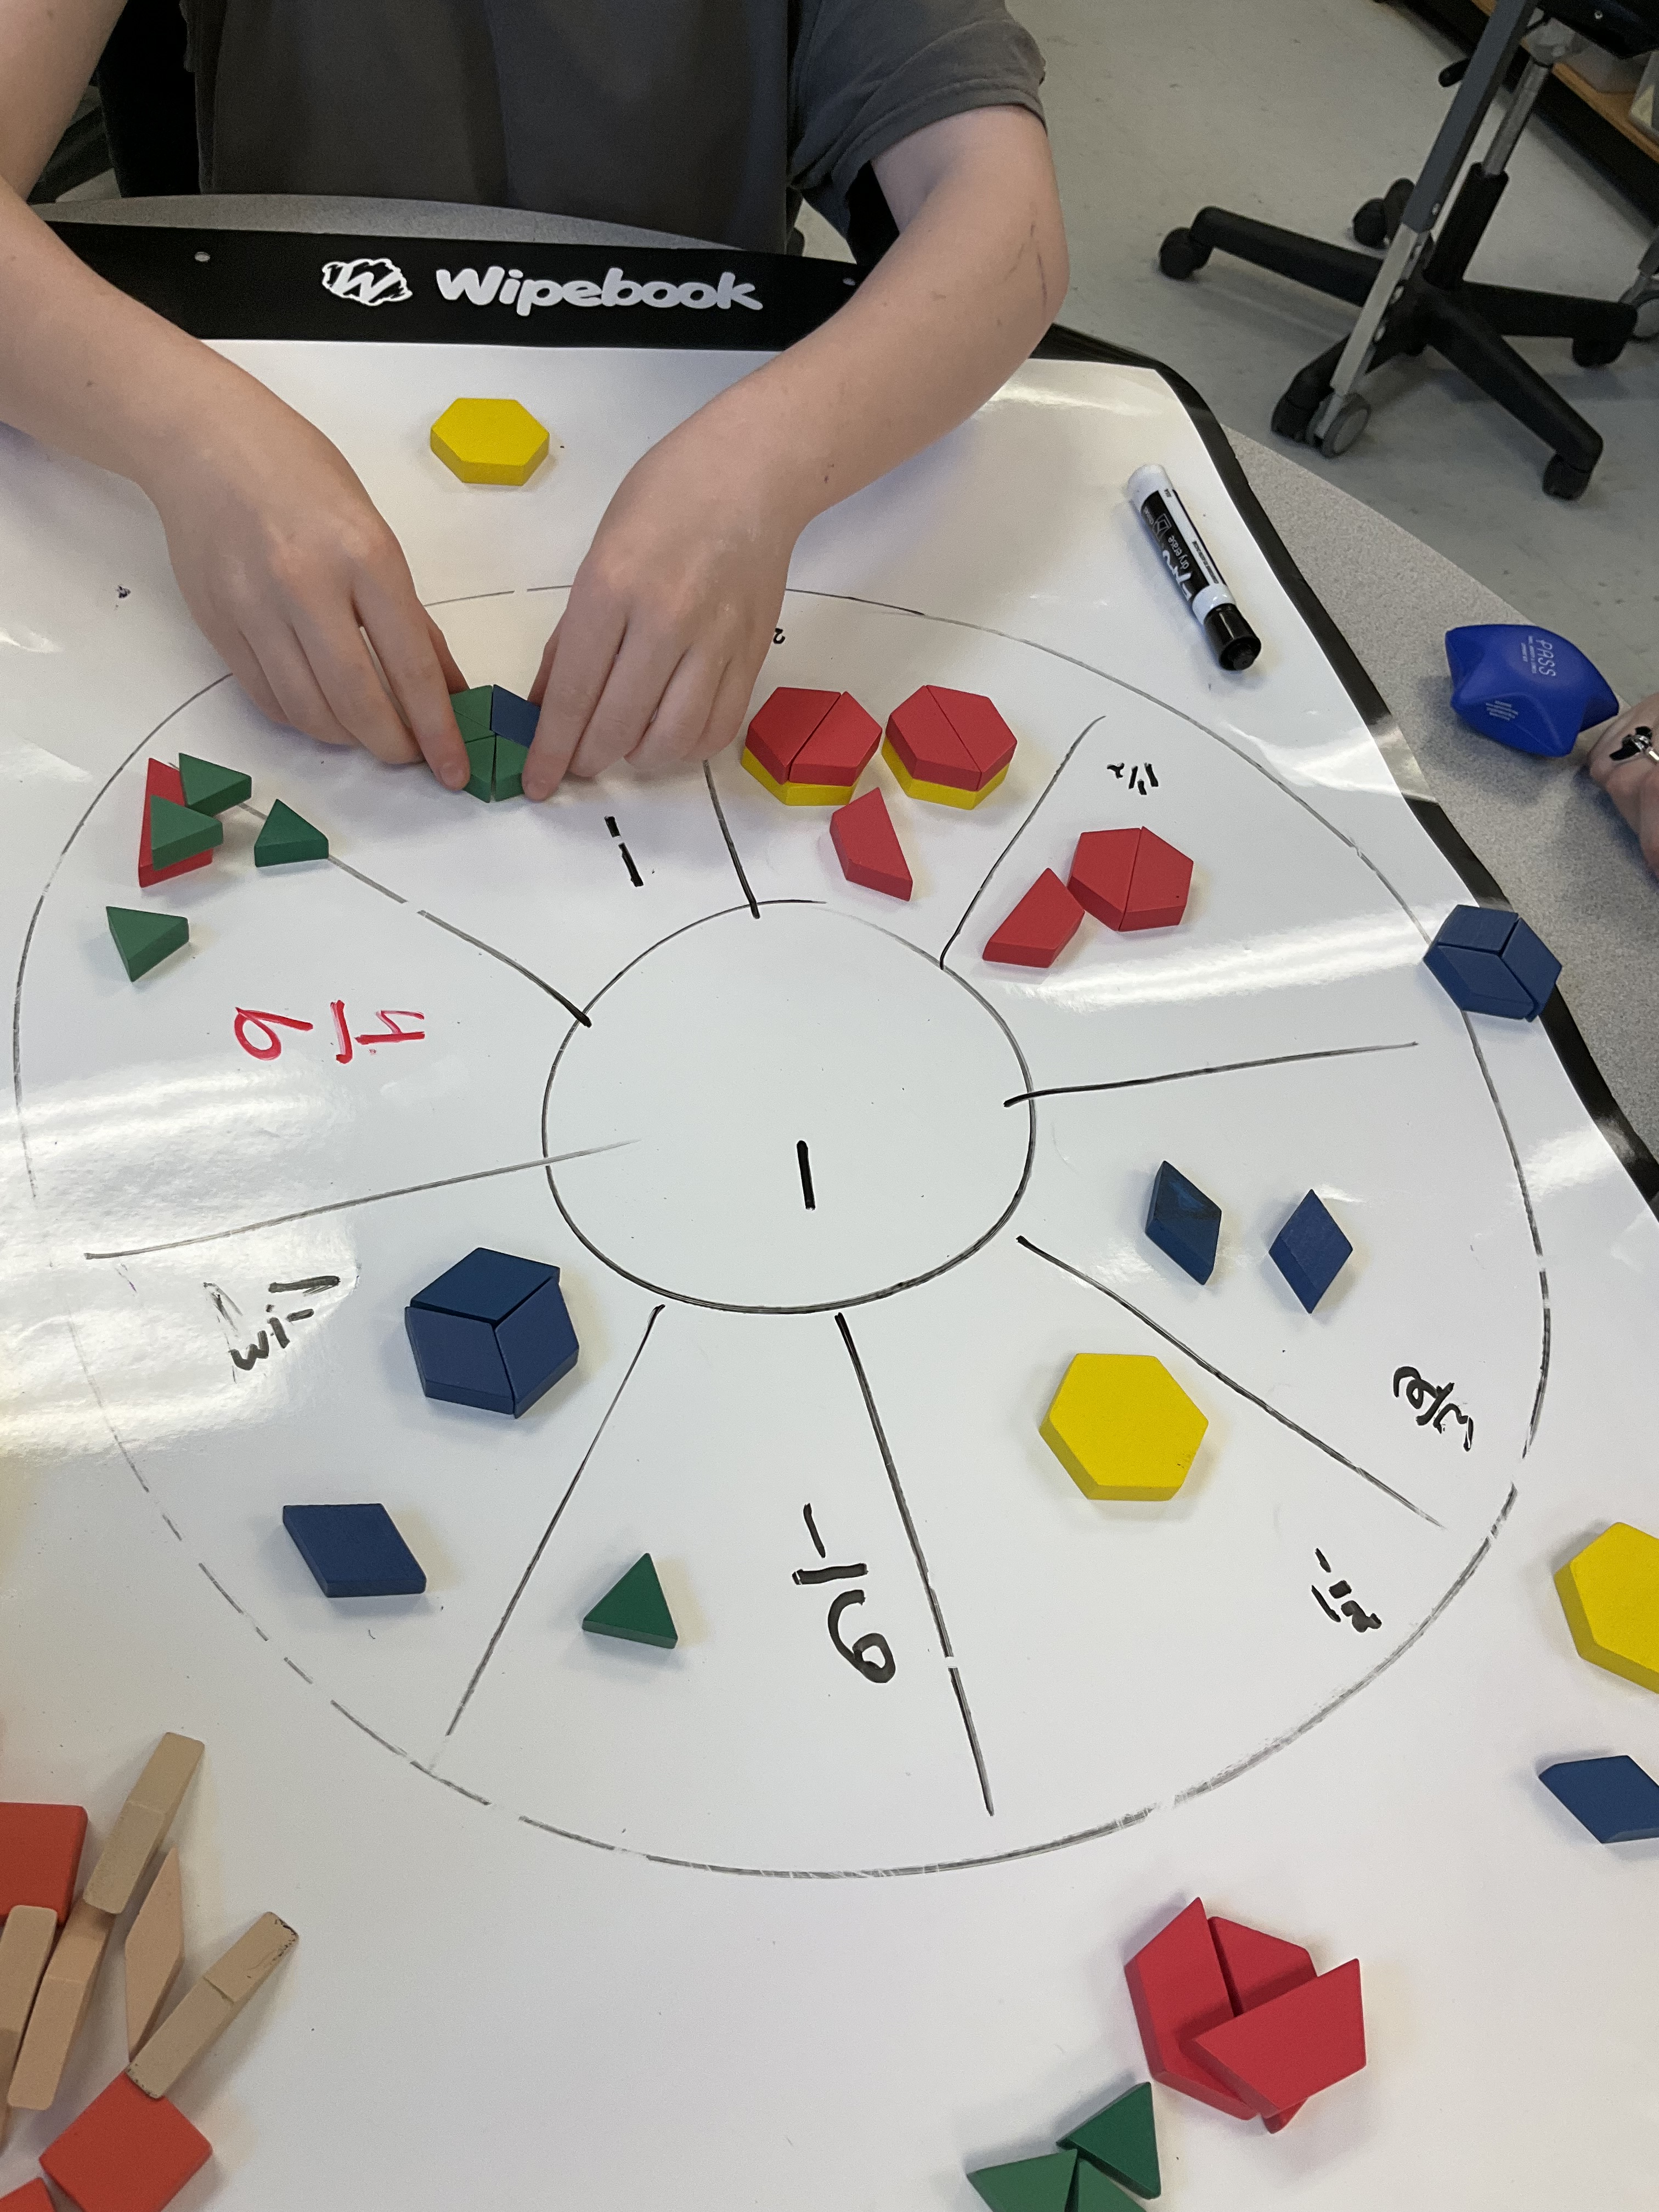
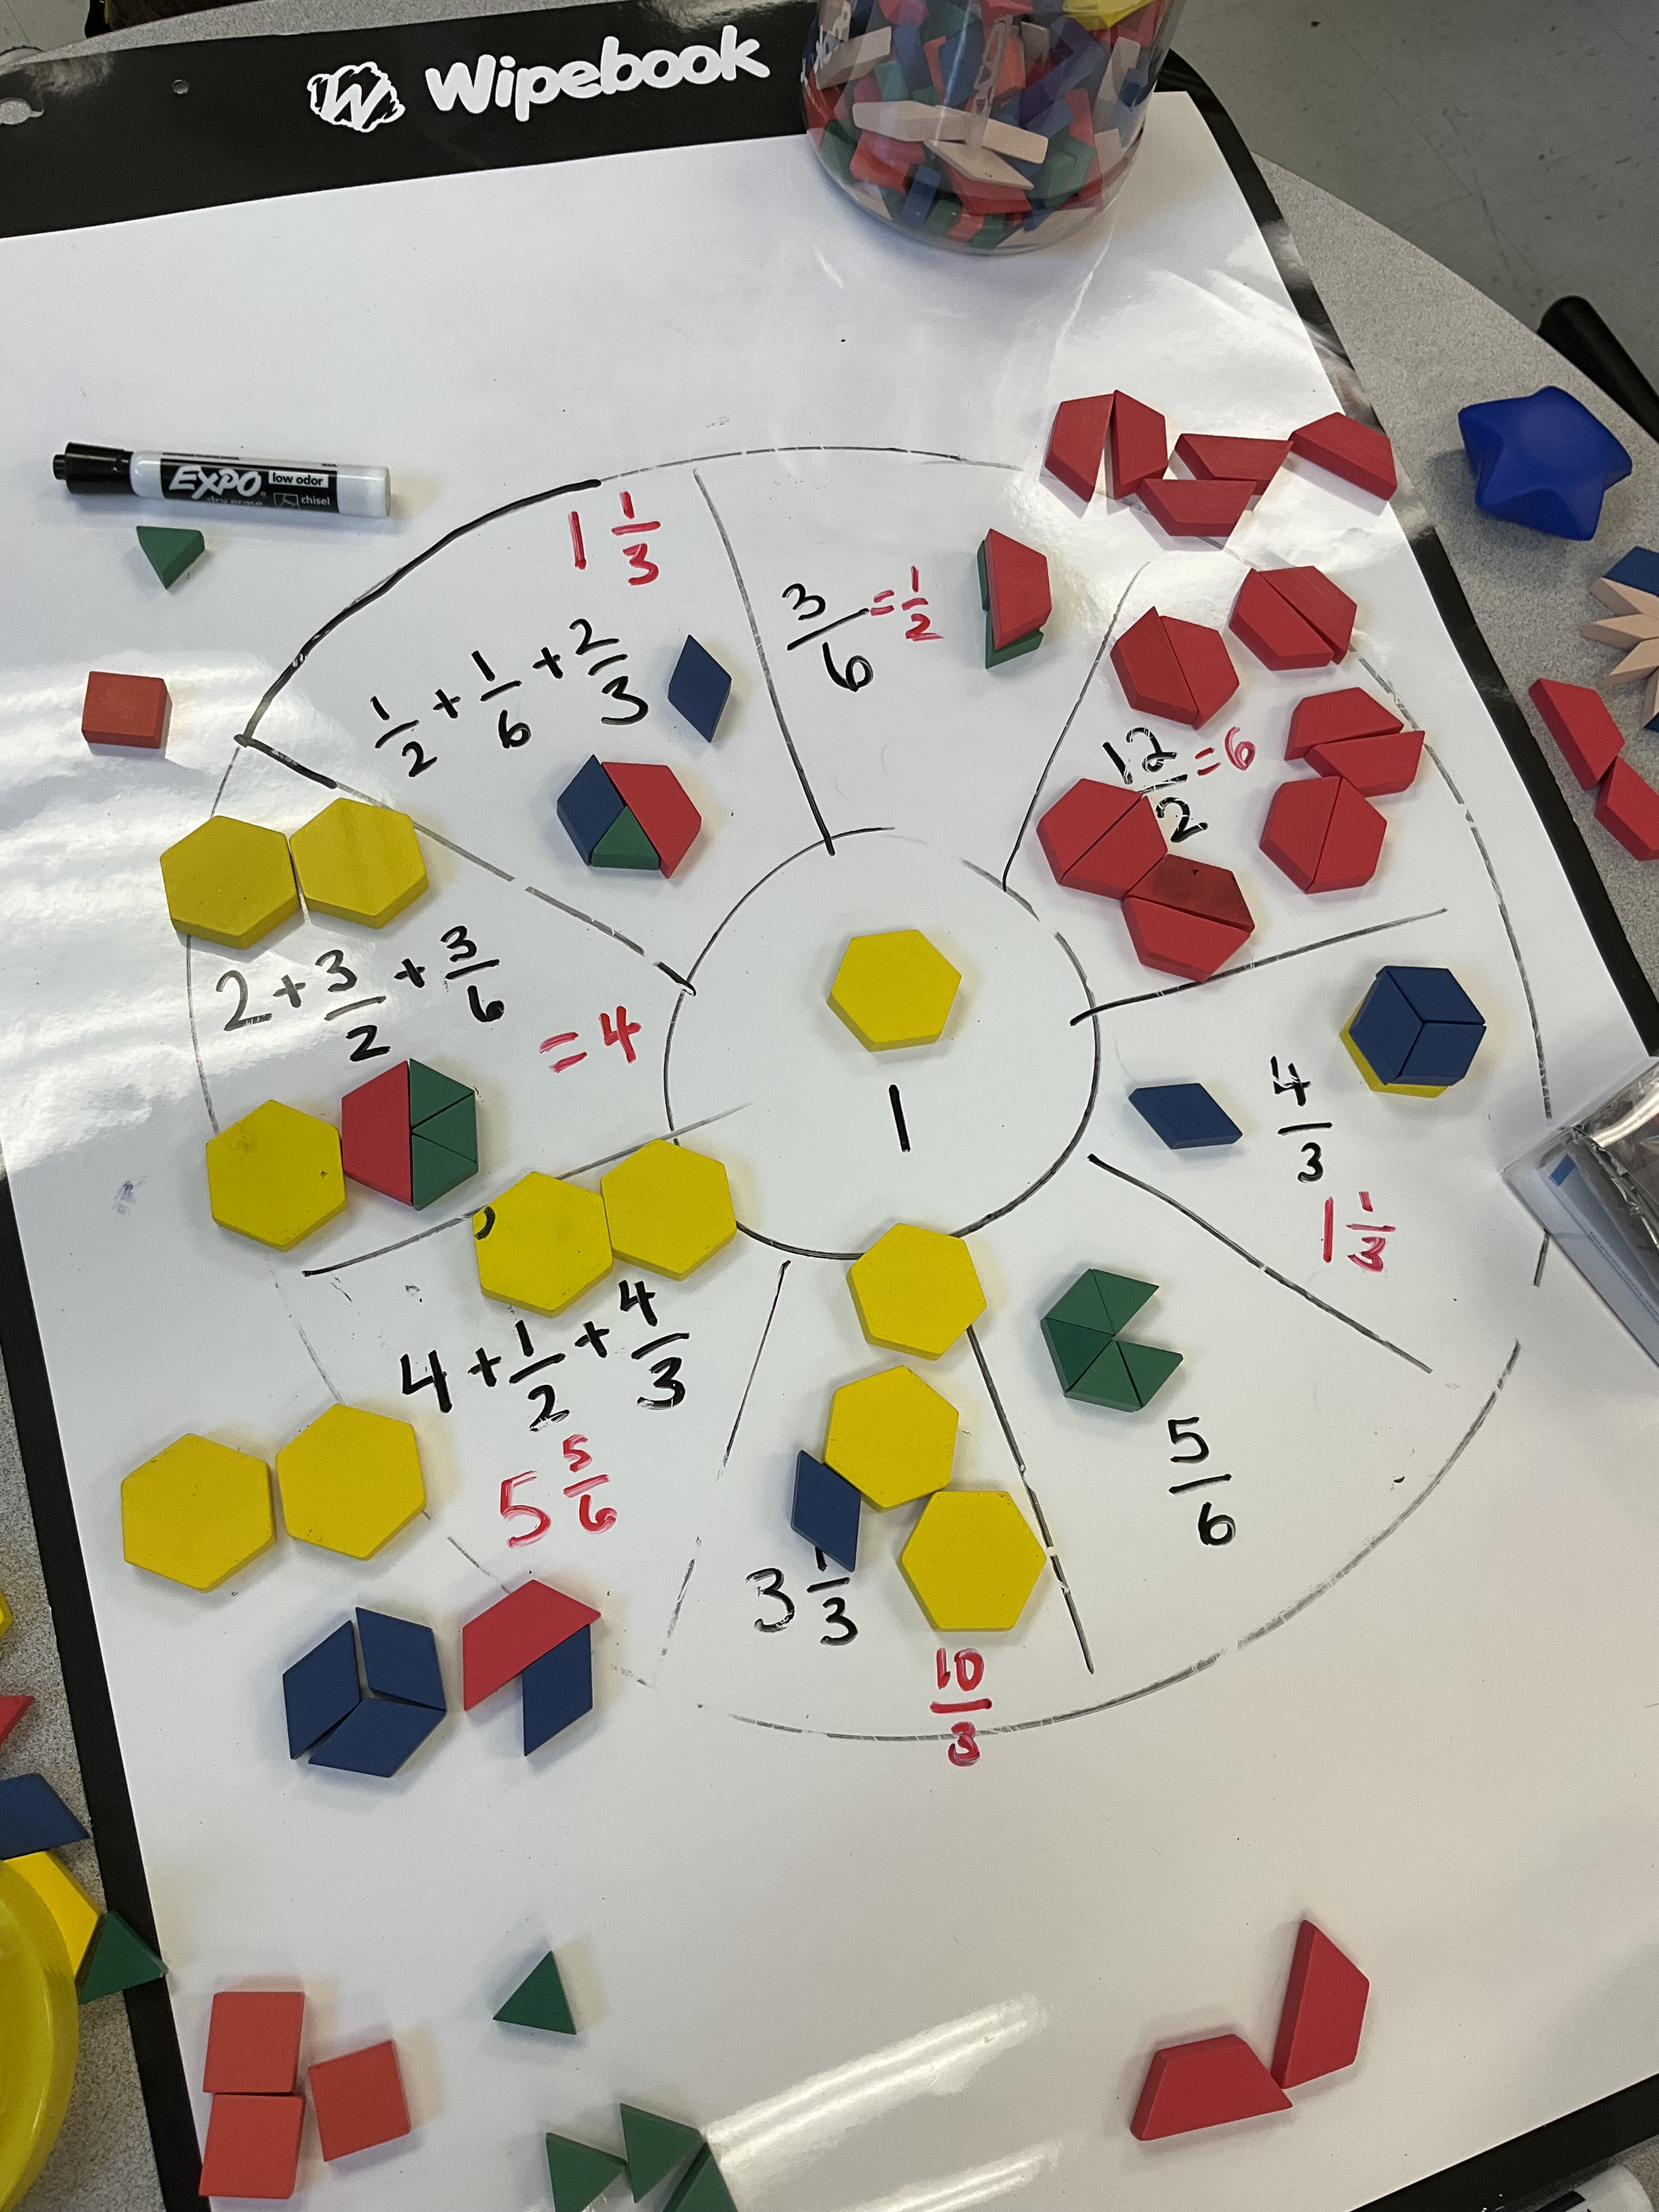
Next I put fractions in the segments and the students needed to build them. We branched out and did some adding as well. It was neat to see how quickly they were putting together the various fractions to make hexagons. We talked about how we can represent everything in triangles and get to the same answer using a common piece (common denominator).
We got partway through this last one, which was a bit tricky since we renamed 1 to be 1 red trapezoid.
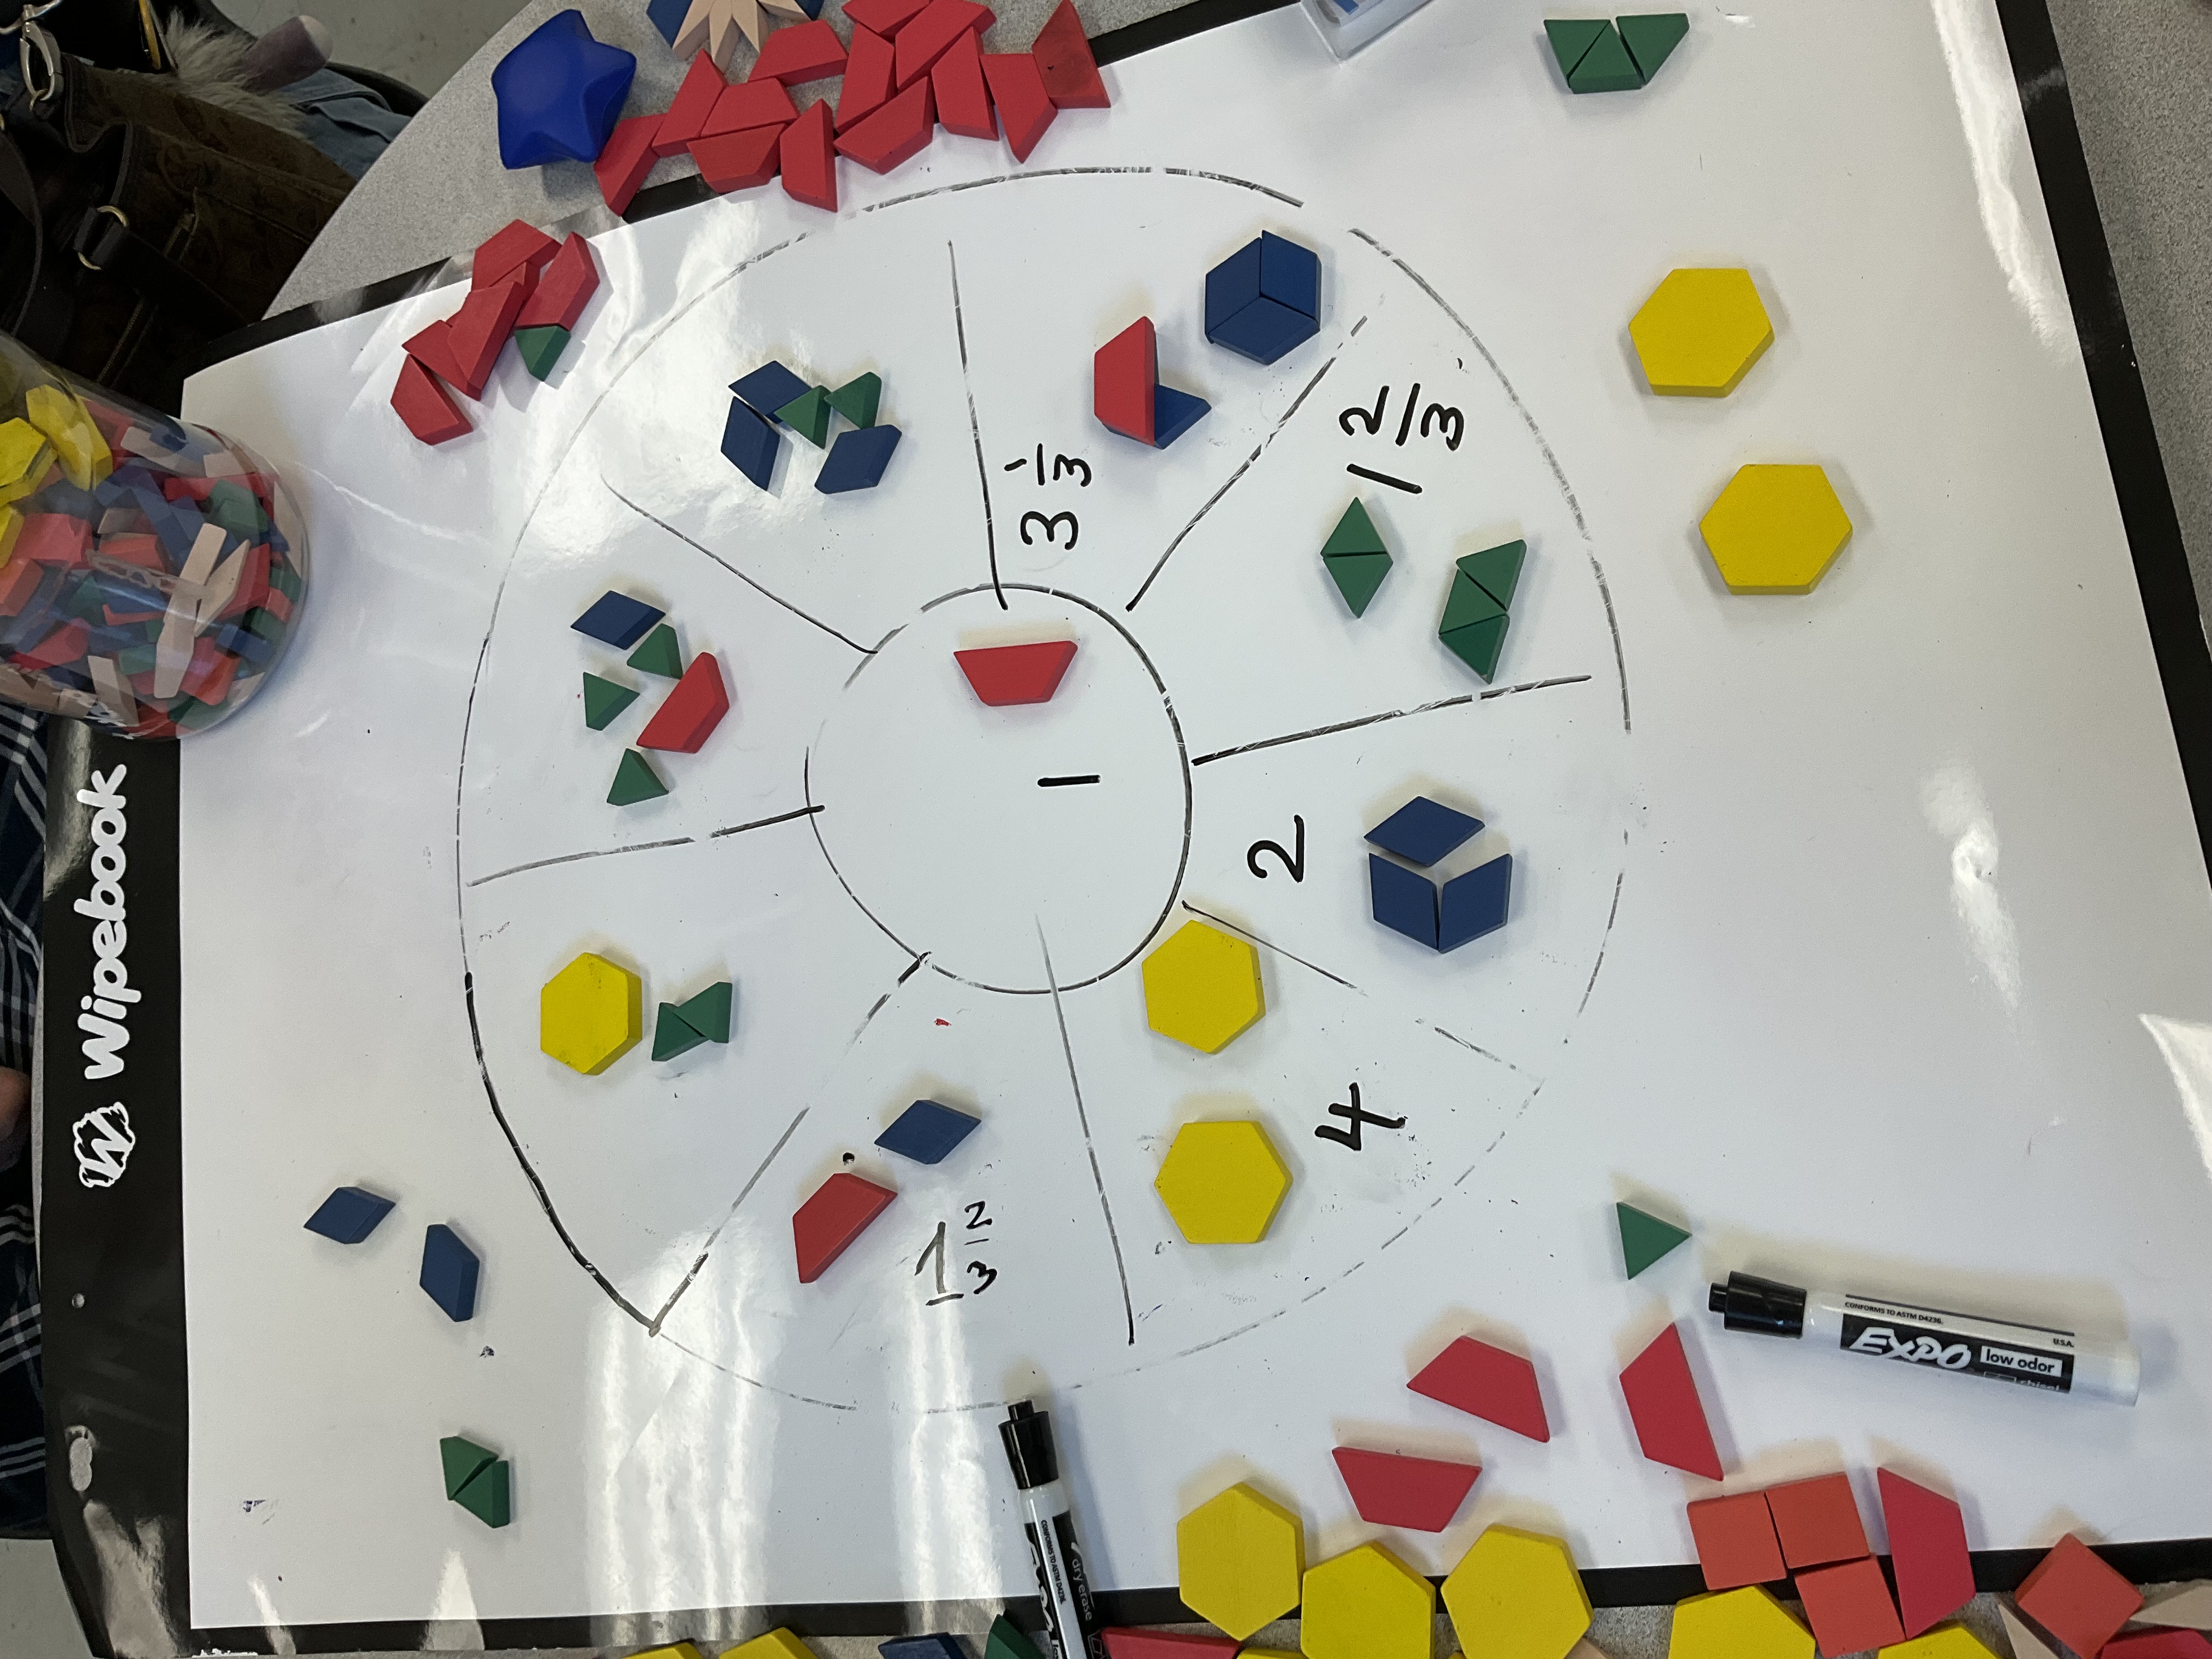
Because we were used to building hexagons, it took a minute to get reoriented, and count trapezoids instead. It was a good challenge to change what “1” was. Using the manipulatives and combining them with fractions can help take away the fear of the fractions in their abstract state. Sometimes seeing fractions and knowing that they can be built, or drawn, or represented in another way can add meaning, but also help keep us calm when using them.
Problem Solving with Guests
Today we had the pleasure of hosting several mathy people from Queen’s. They came with some rich tasks to present to a grade 11 class and a grade 10 class
The first one was a question about maximizing area of a fenced field located against a long barn.
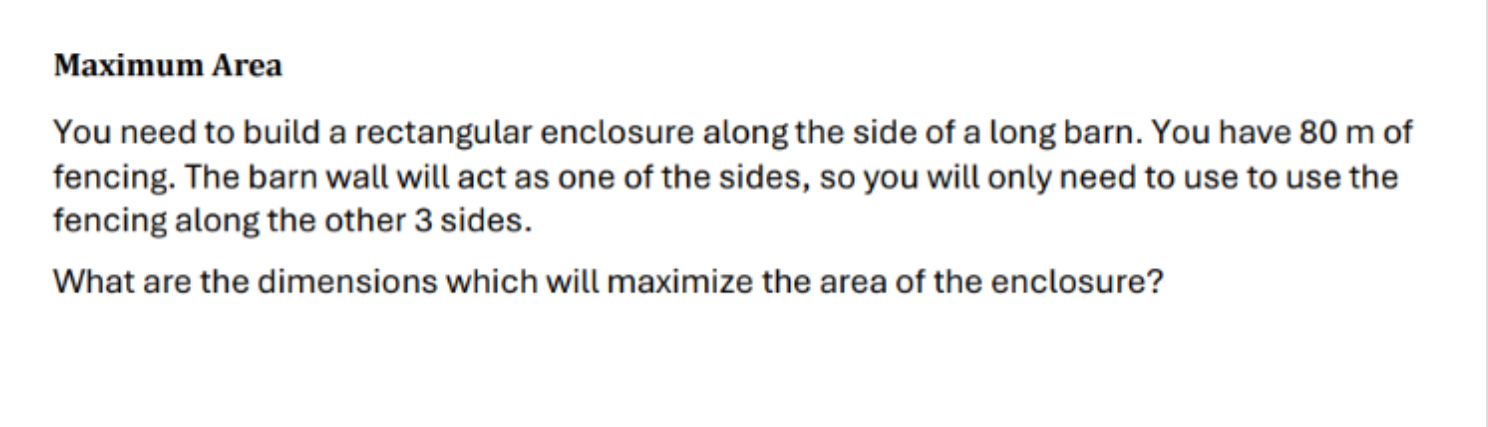
Students worked on different ways to model the problem, with a picture, and variables, and equations. They had different strategies for finding the vertex, some completed the square, some found the axis of symmetry, some used the quadratic formula and found roots and then the axis of symmetry.
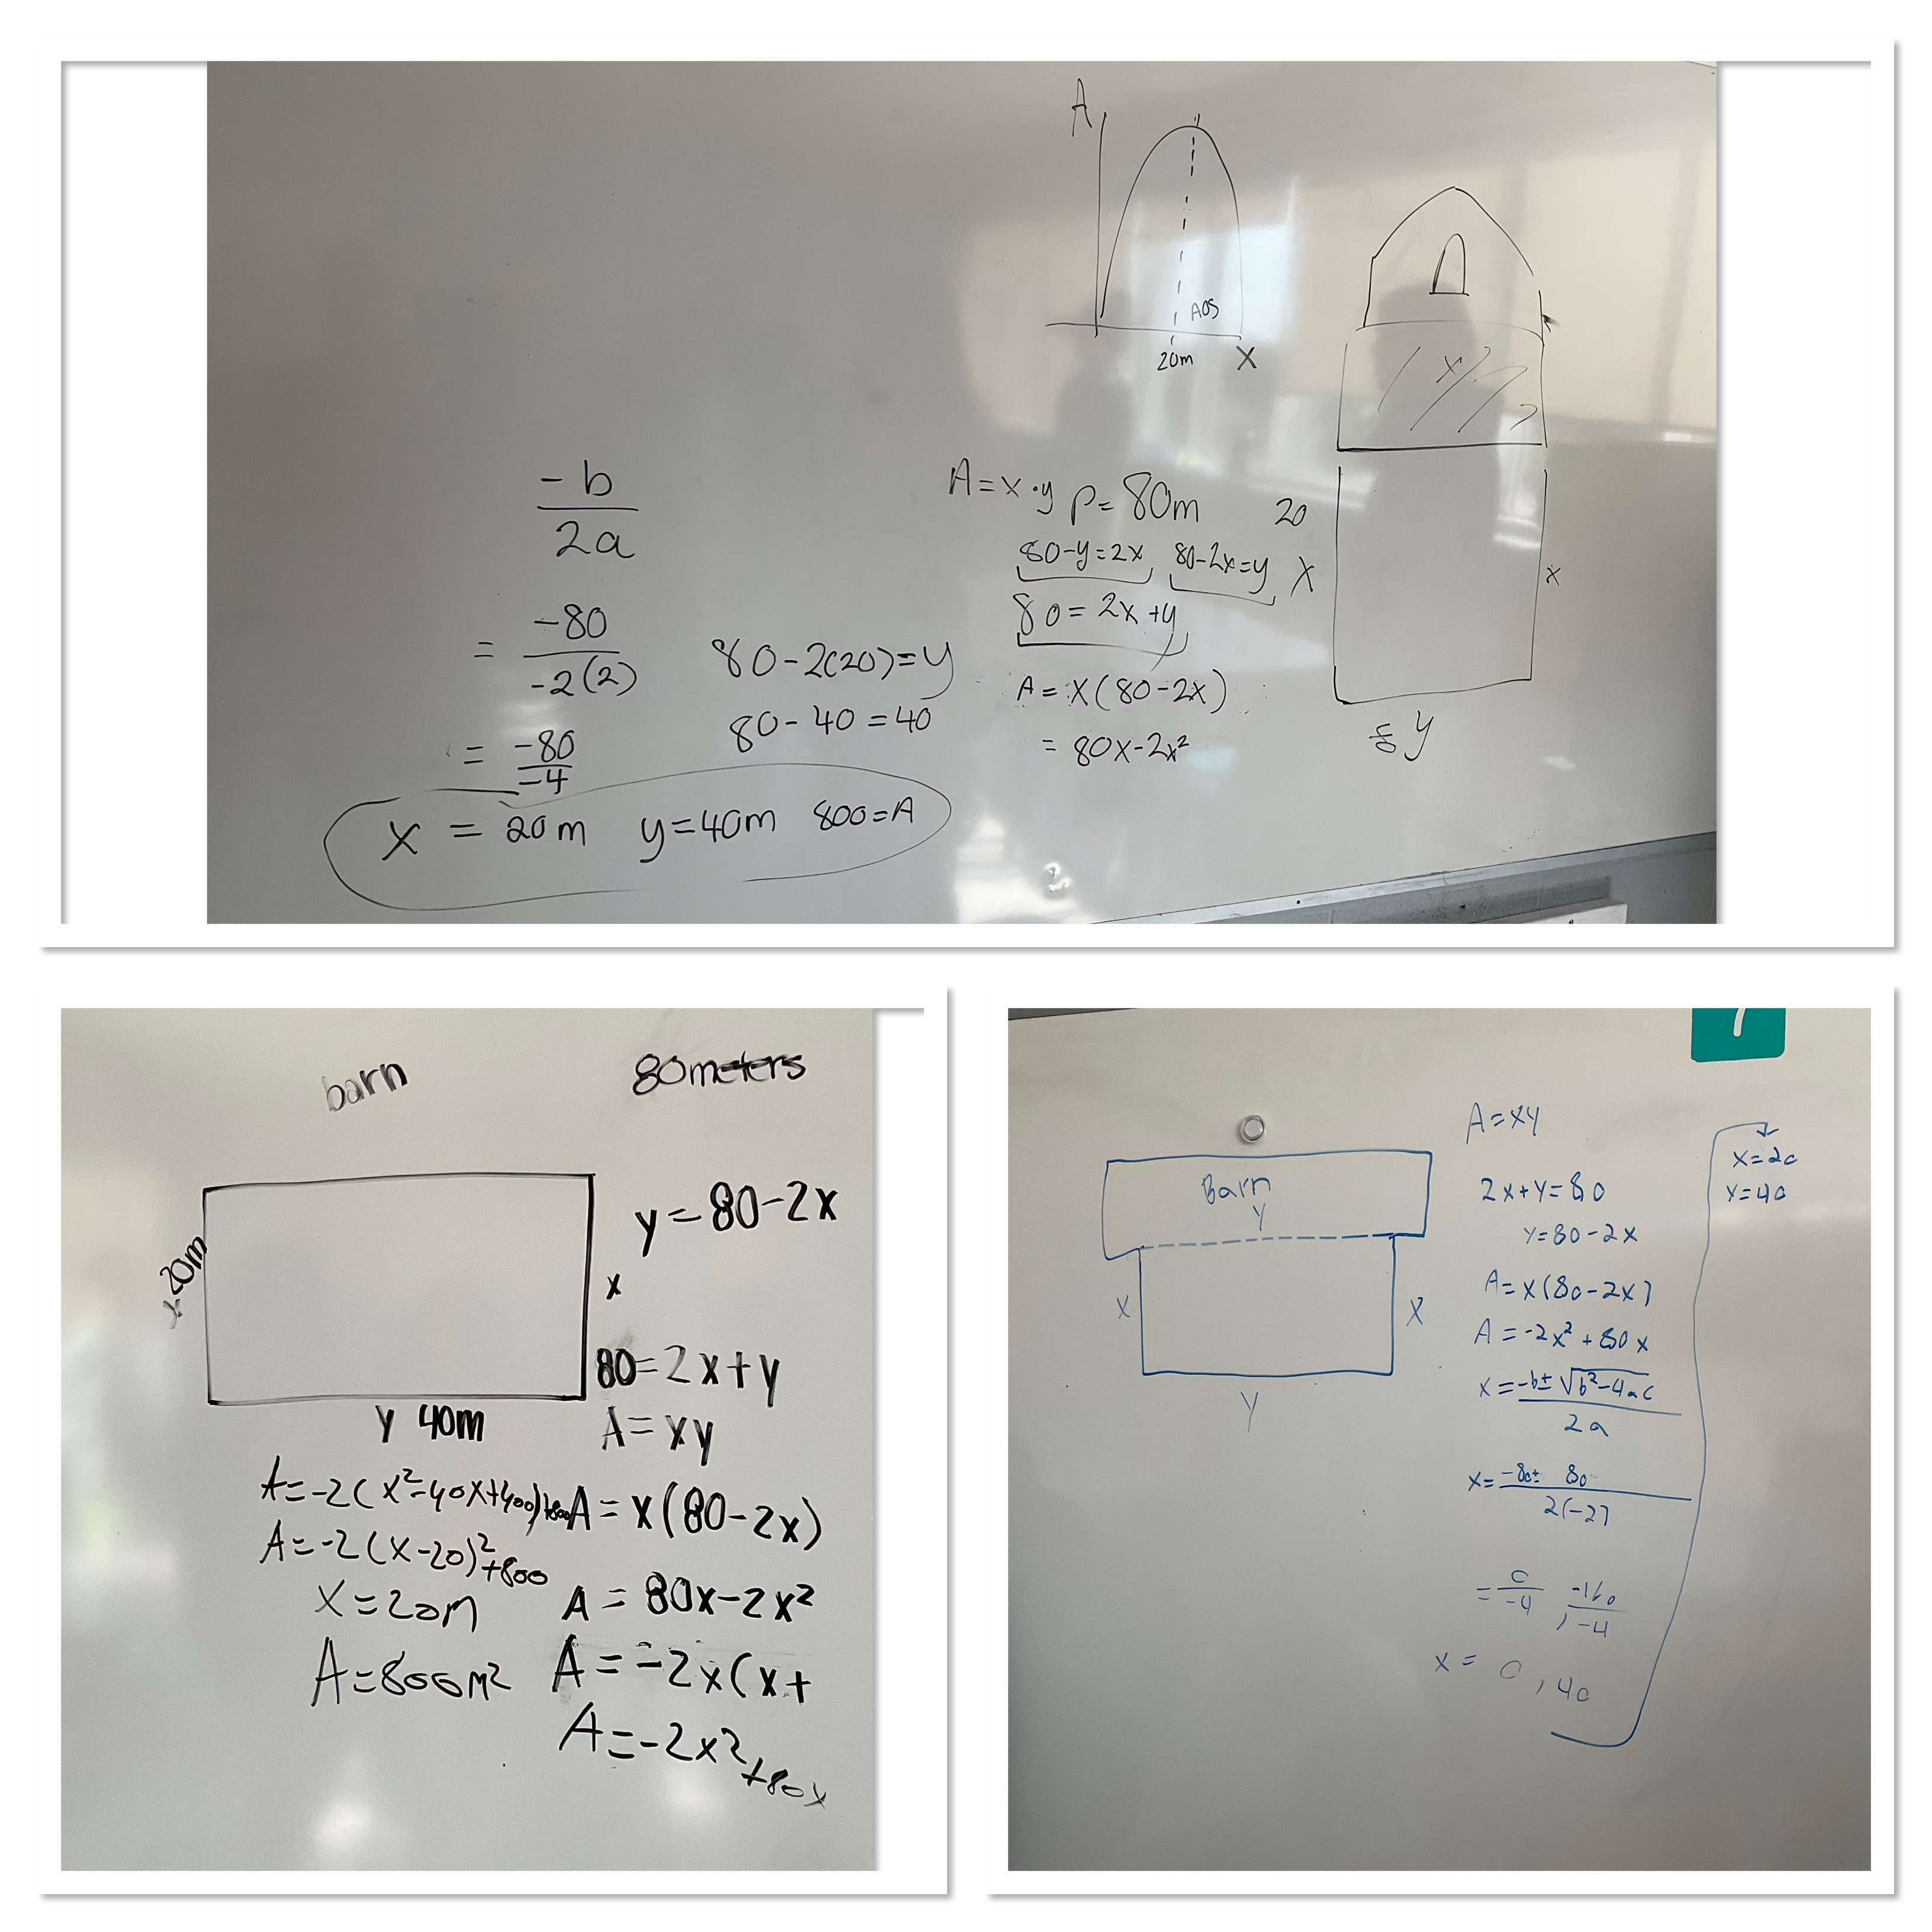
It was great to see how actively groups collaborated together to solve the problem. The next challenge was a bit trickier. We needed to find the rectangle inscribed within a certain parabola with the maximum perimeter.
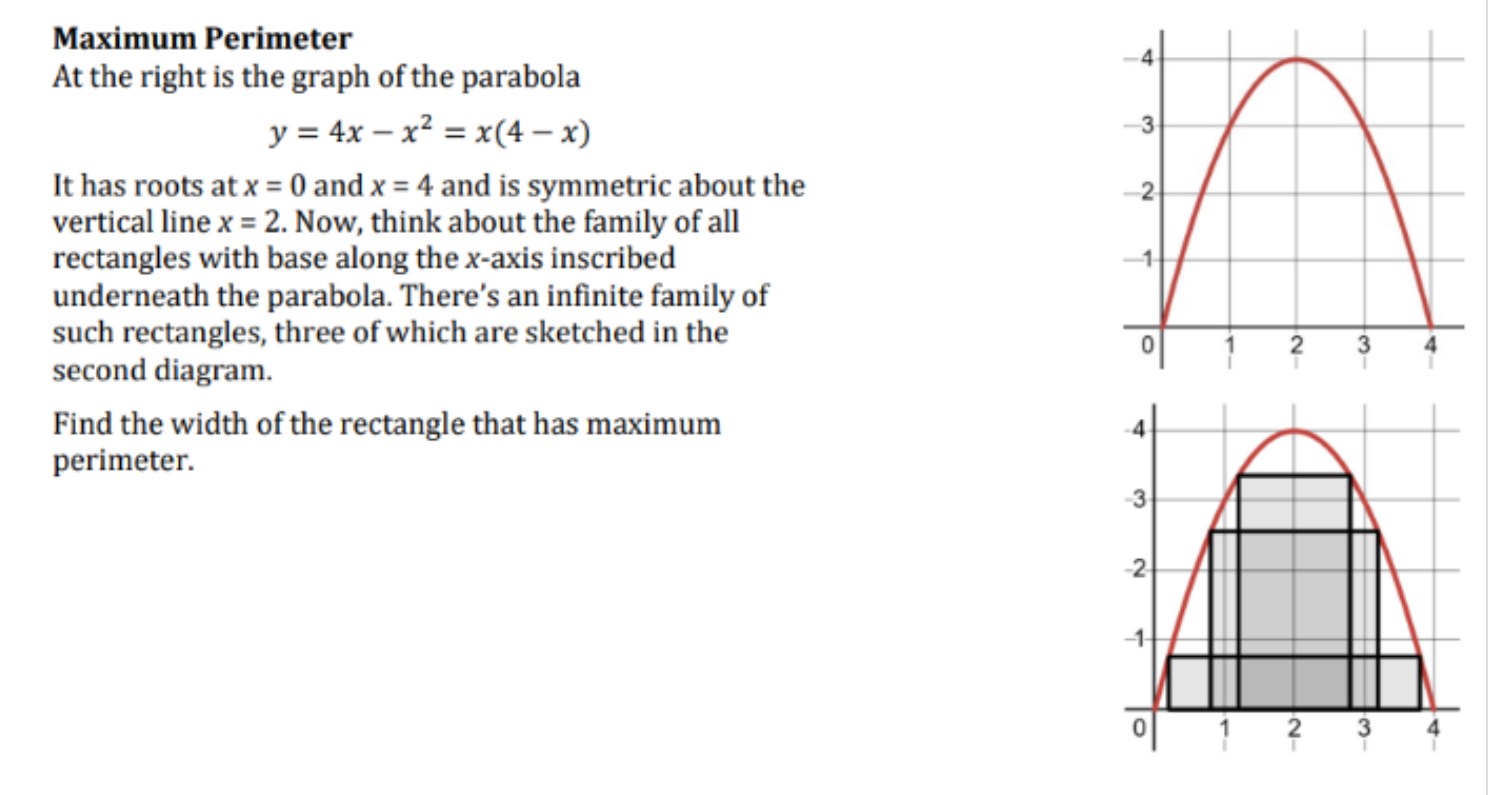
Students had challenges knowing where to start, and how to proceed. Many of them struggled with calling the length and width of the rectangle x and y, so that brought in 2 conflicting definitions of x. By labelling the width of the rectangle as “w” we were able to build an equation for w in terms of x and use that in the other equations.
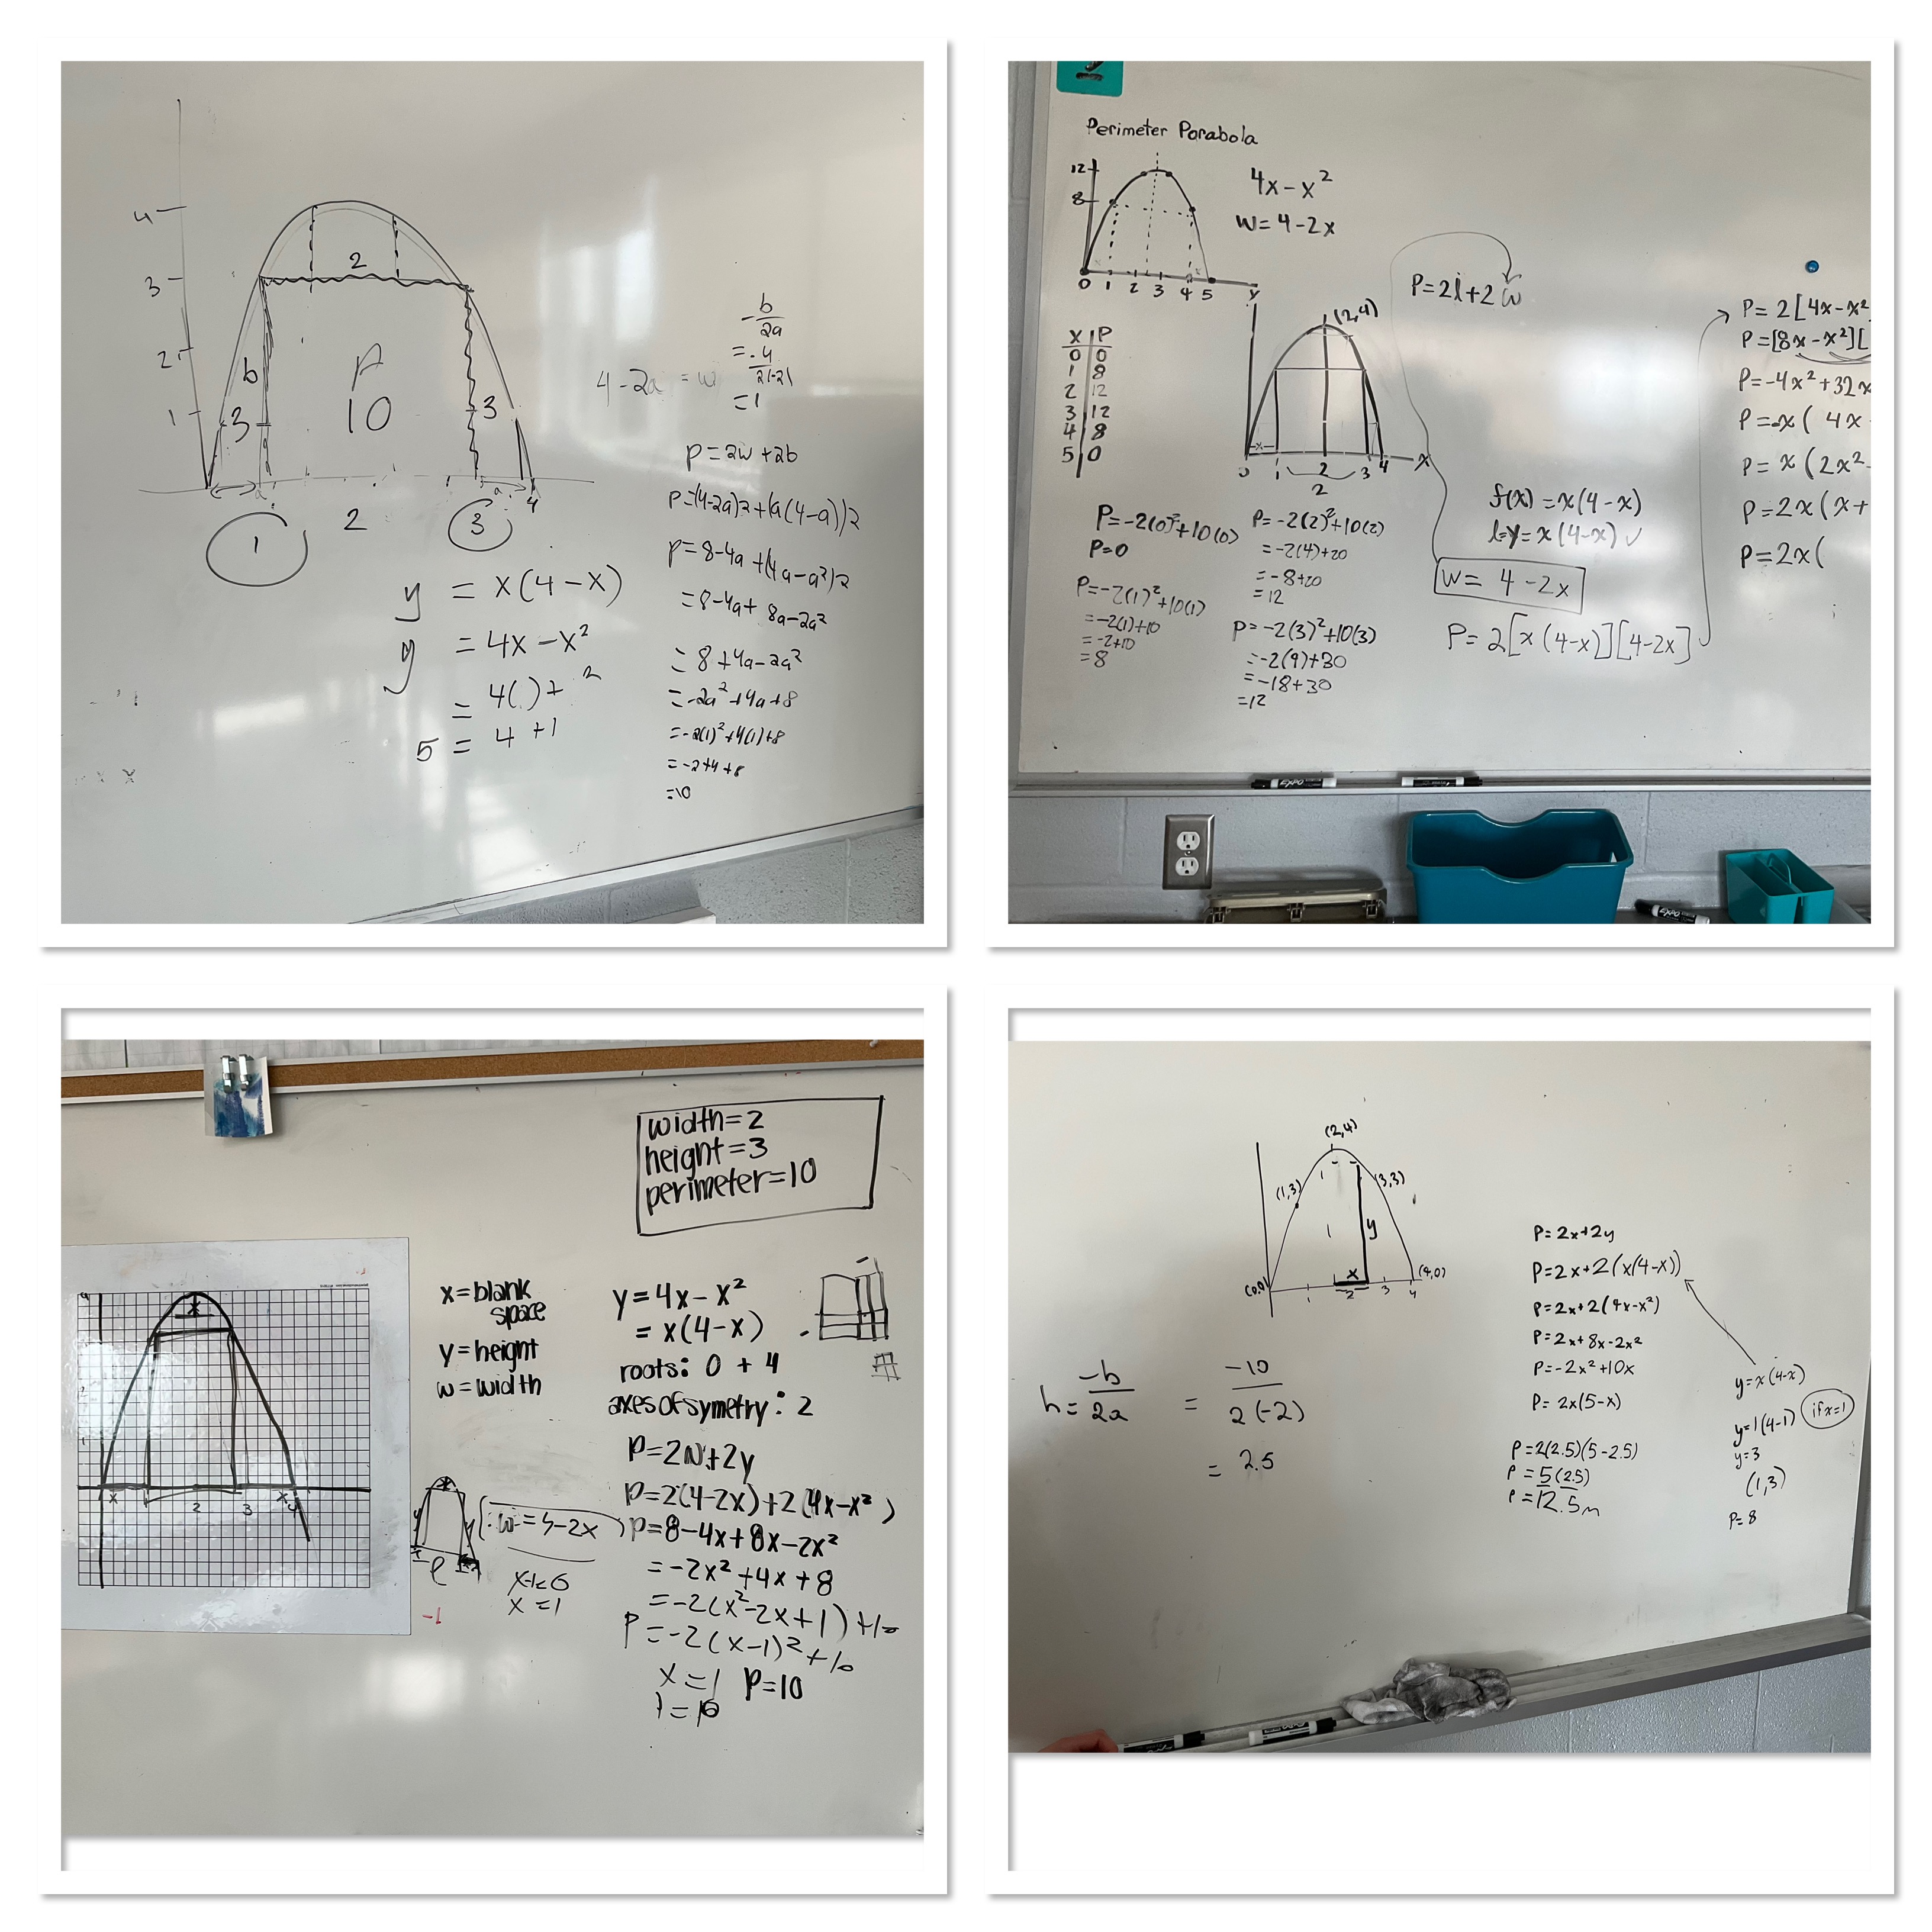
Here’s some examples of works in progress. It was neat to see some groups base their perimeter calculations on different things: some counted x as the distance from the origin. Others counted the horizontal distance from the axis of symmetry to the edge of the rectangle.
We had a lot of struggle, but kept working through the struggle and made some progress before the end of class.
Making Mistakes
Today was a day that made me glad that I had made a mistake. We all make mistakes, and the response my students had today made me so happy. It was a small moment, but made me realize that my messaging around mistakes is being heard and adopted by my students.
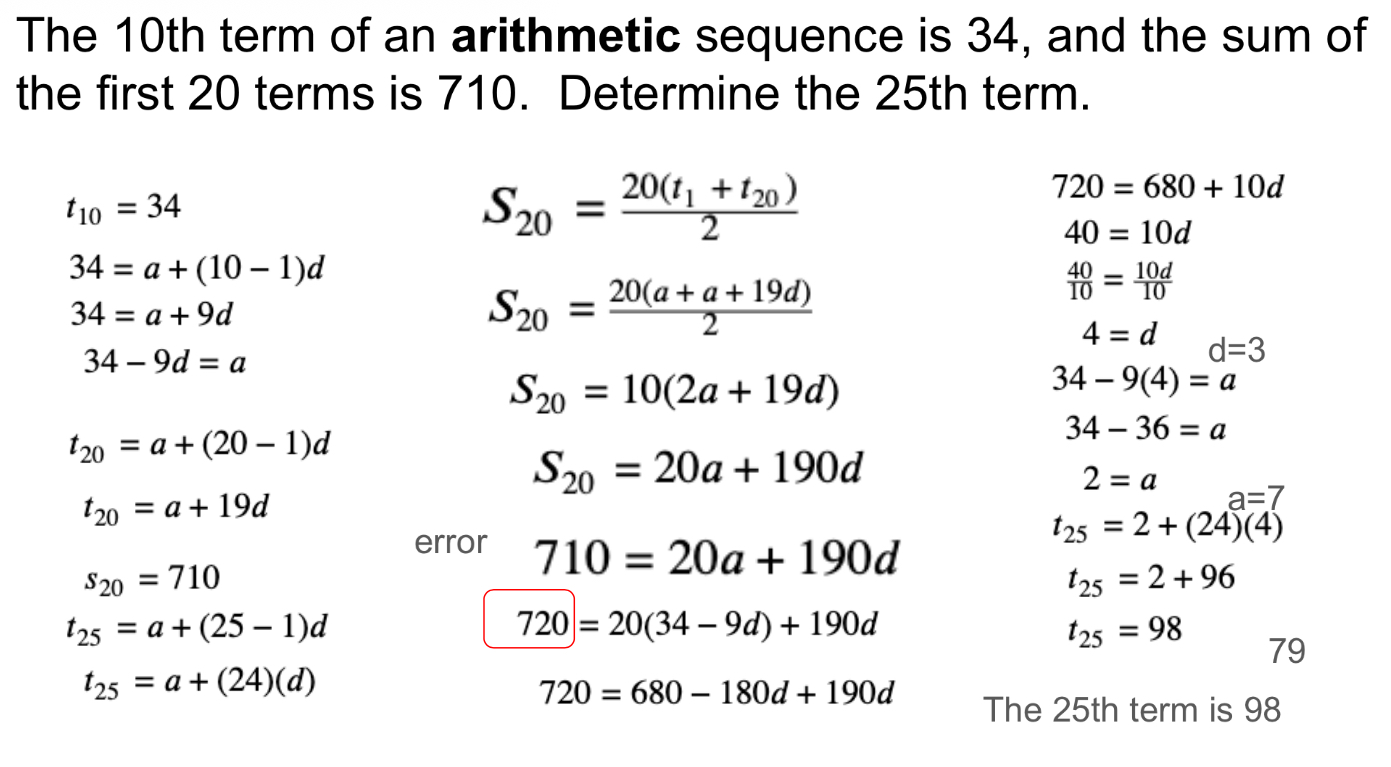
Here was the question that we were doing. Students were working in small groups up at the whiteboards. We’ve done lots of work with sequences and series, and now we are practicing reading problems and interpreting what we need to do to solve them.

After working for a while, one group was huddled by my laptop. The projector screen was frozen, and the students had advanced my slideshow to see the solution to the problem to check their work. I went over to see what they were doing, and they alerted me to the fact that their answer and my answer didn’t match. They had looked through my answer and noted where I had gone wrong. They were discussing how a 710 in one line had changed to a 720 in the next line. I had a look, realized that it was a typo, and agreed that they were right, and mine needed a correction. They told me their answers so I could update the slide, and then they told me that it was ok, it wasn’t a conceptual error, just a typo. They told me that my process was correct and this wasn’t a big deal of a mistake.
We’ve worked a lot this term on learning from our mistakes. We classify them as inattention (loss of focus or concentration…an “oops”), computation (mistake with integers, order of operations, exponents etc), precision (sloppy work that’s hard to follow/read, incomplete communication for introducing variables or doing final statements, missing units etc), and problem solving (conceptual issues, getting stuck, not having a plan). Each test gets handed back with an error analysis sheet for students to engage with their errors, identify what type of error it was and to write the correct solution. Those pages get handed back to me to get checked, returned, and revised if needed.
Today my students identified the error, classified the error, realized it was an “oops” and carried on. They were polite and respectful while letting me know about the whole thing.
The conversations that followed were pretty rich. We talked about how this question might be marked, and how many marks the question should be assigned. We agreed that a small error like this should not be a large impact on the mark, that this answer would be a level 4 answer, or a 4+, just not perfect, but so close. We’d want to have maybe 5 or 6 points total so that a loss of 0.5 would still leave a high mark for the question.
I’m glad that I made an accidental mistake, and allowed for some time and discussion about it. I’m thankful my students were able to share with me that they are understanding that not all errors are the same, and that they know which ones to worry about more. I hope they will give themselves the same grace they extended to me!
Cheerio Stacking Race
Today in grade 9 we were working on graphing linear equations, remembering y=mx+b, and next looking for intersection points and interpreting their meaning.
We started with x+y=5 and talked about how sometimes we just know some points that are on the line because they work. E.g. (2,3) works because 2+3=5. We made a list of points and graphed them. We talked about the special points which are on the axes, and named them.
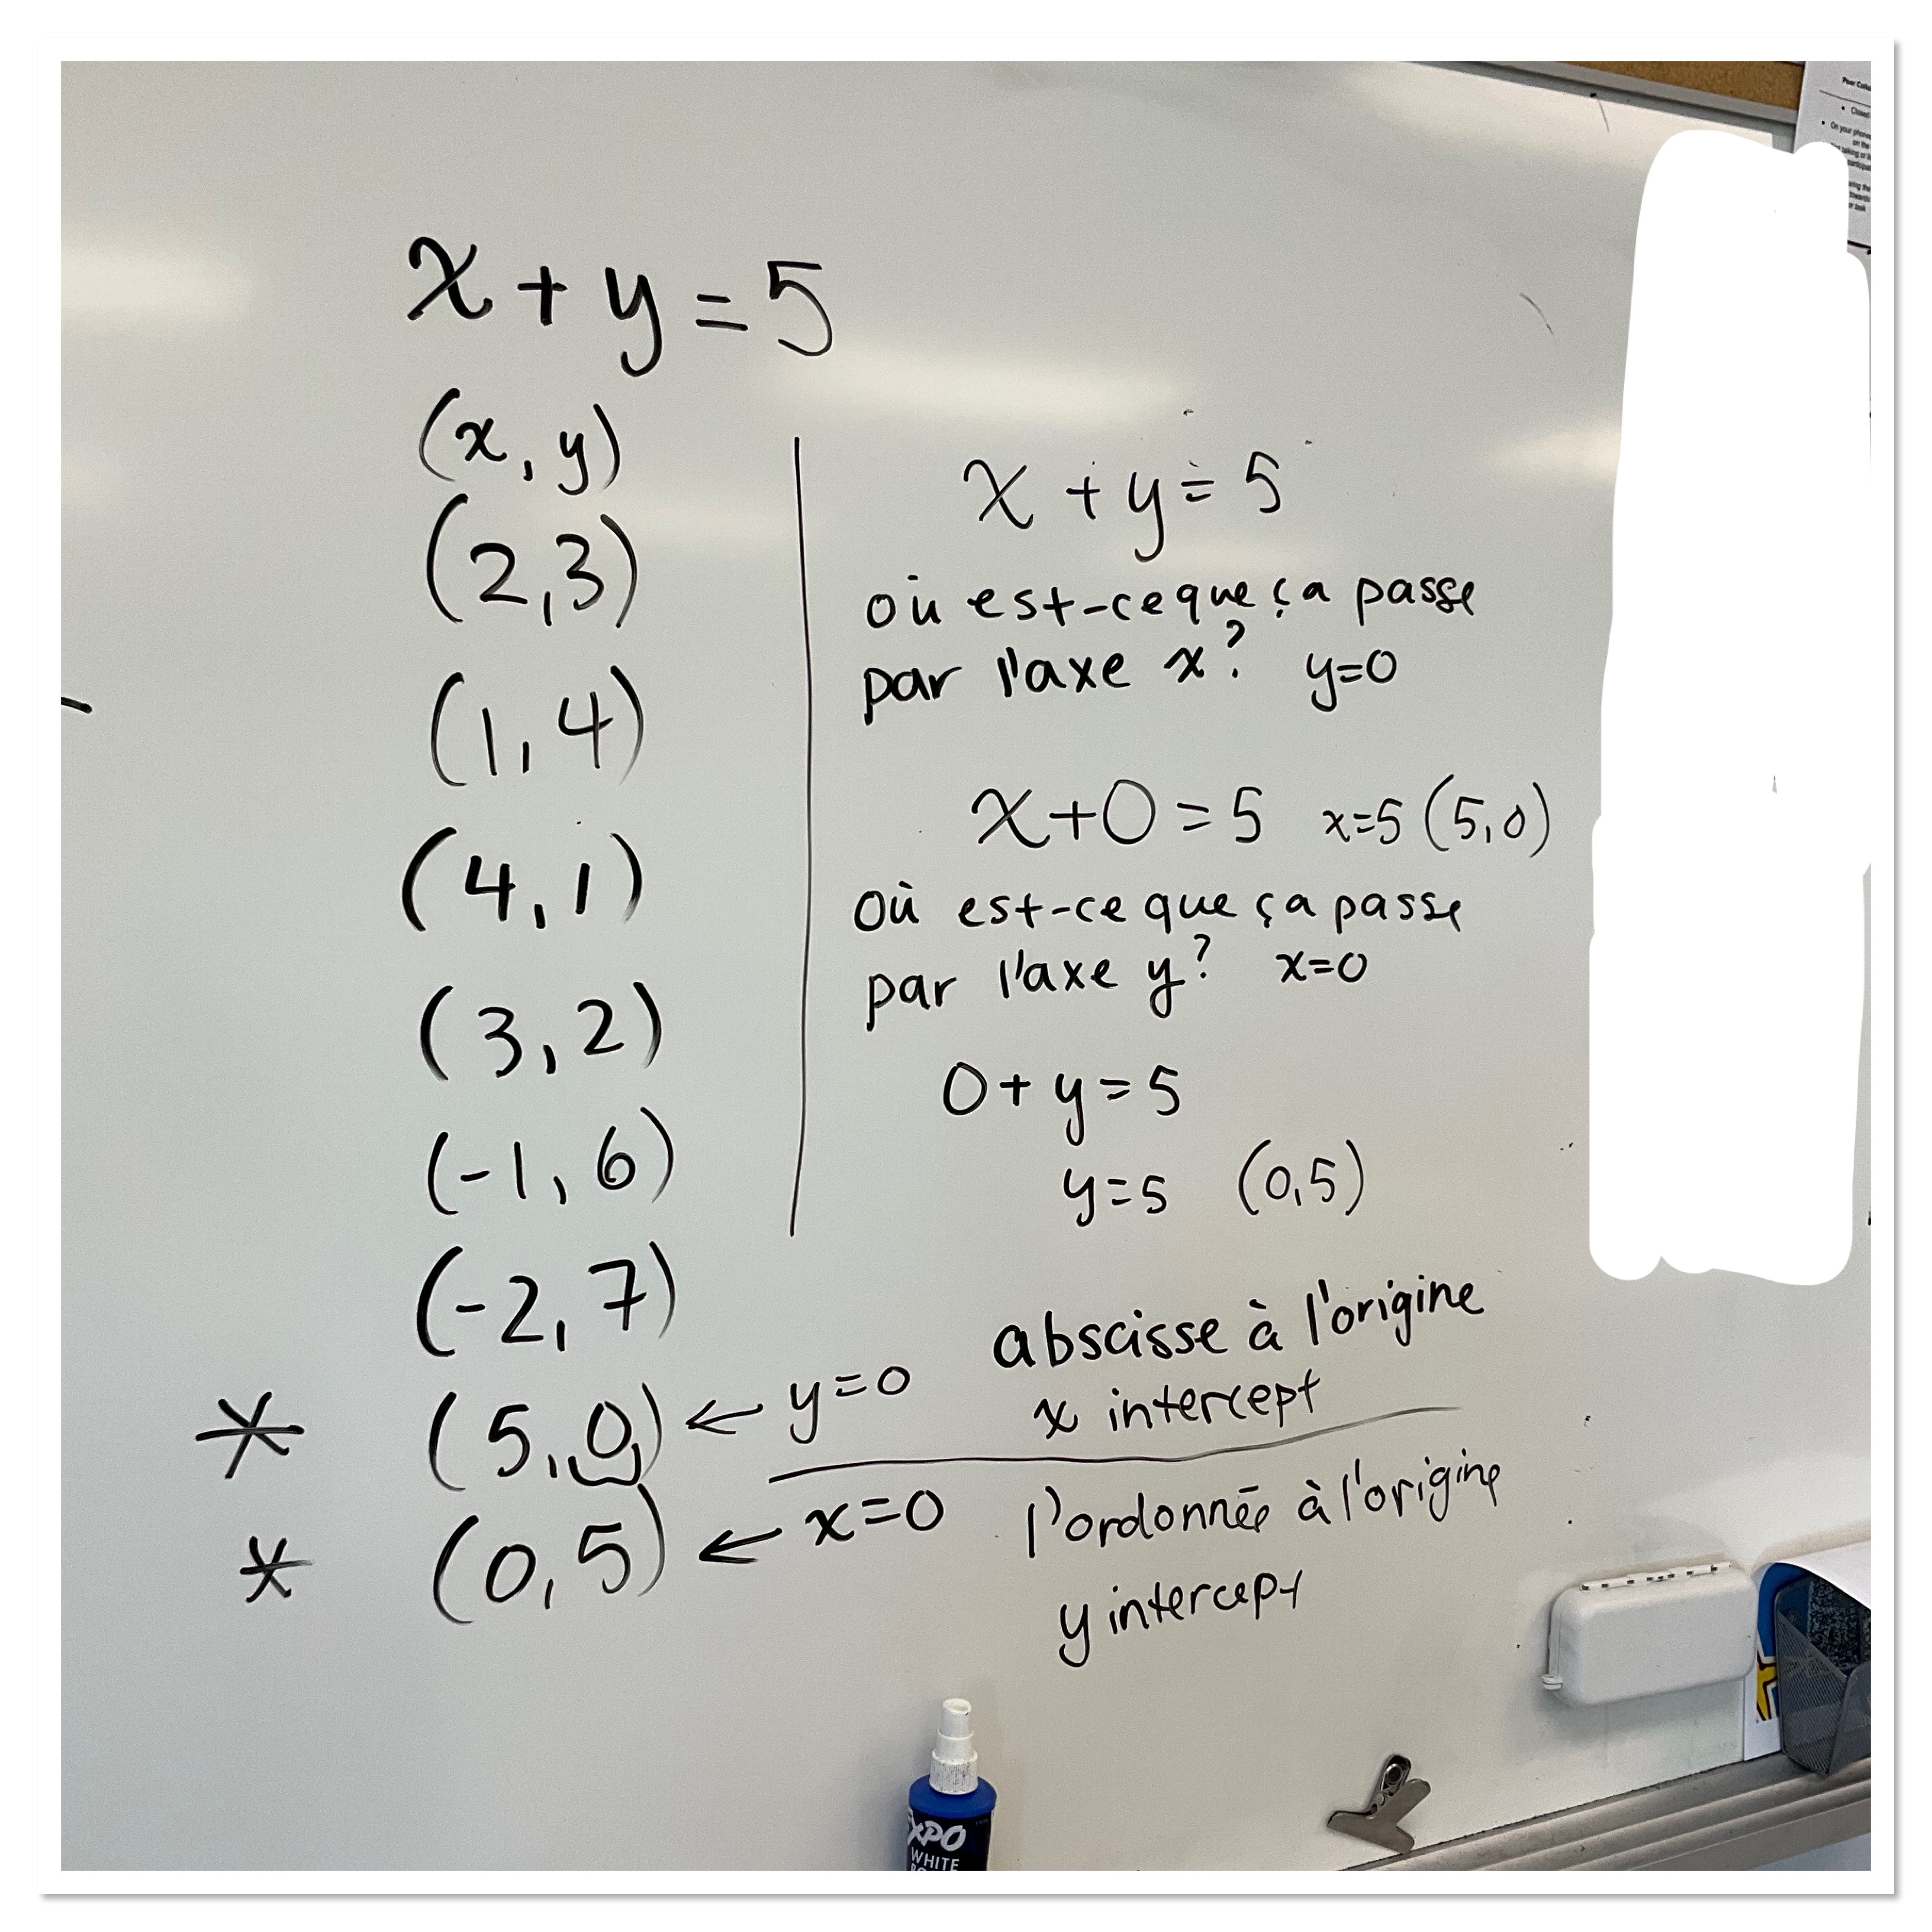
We next looked at an equation that was more complicated 2x-y=4
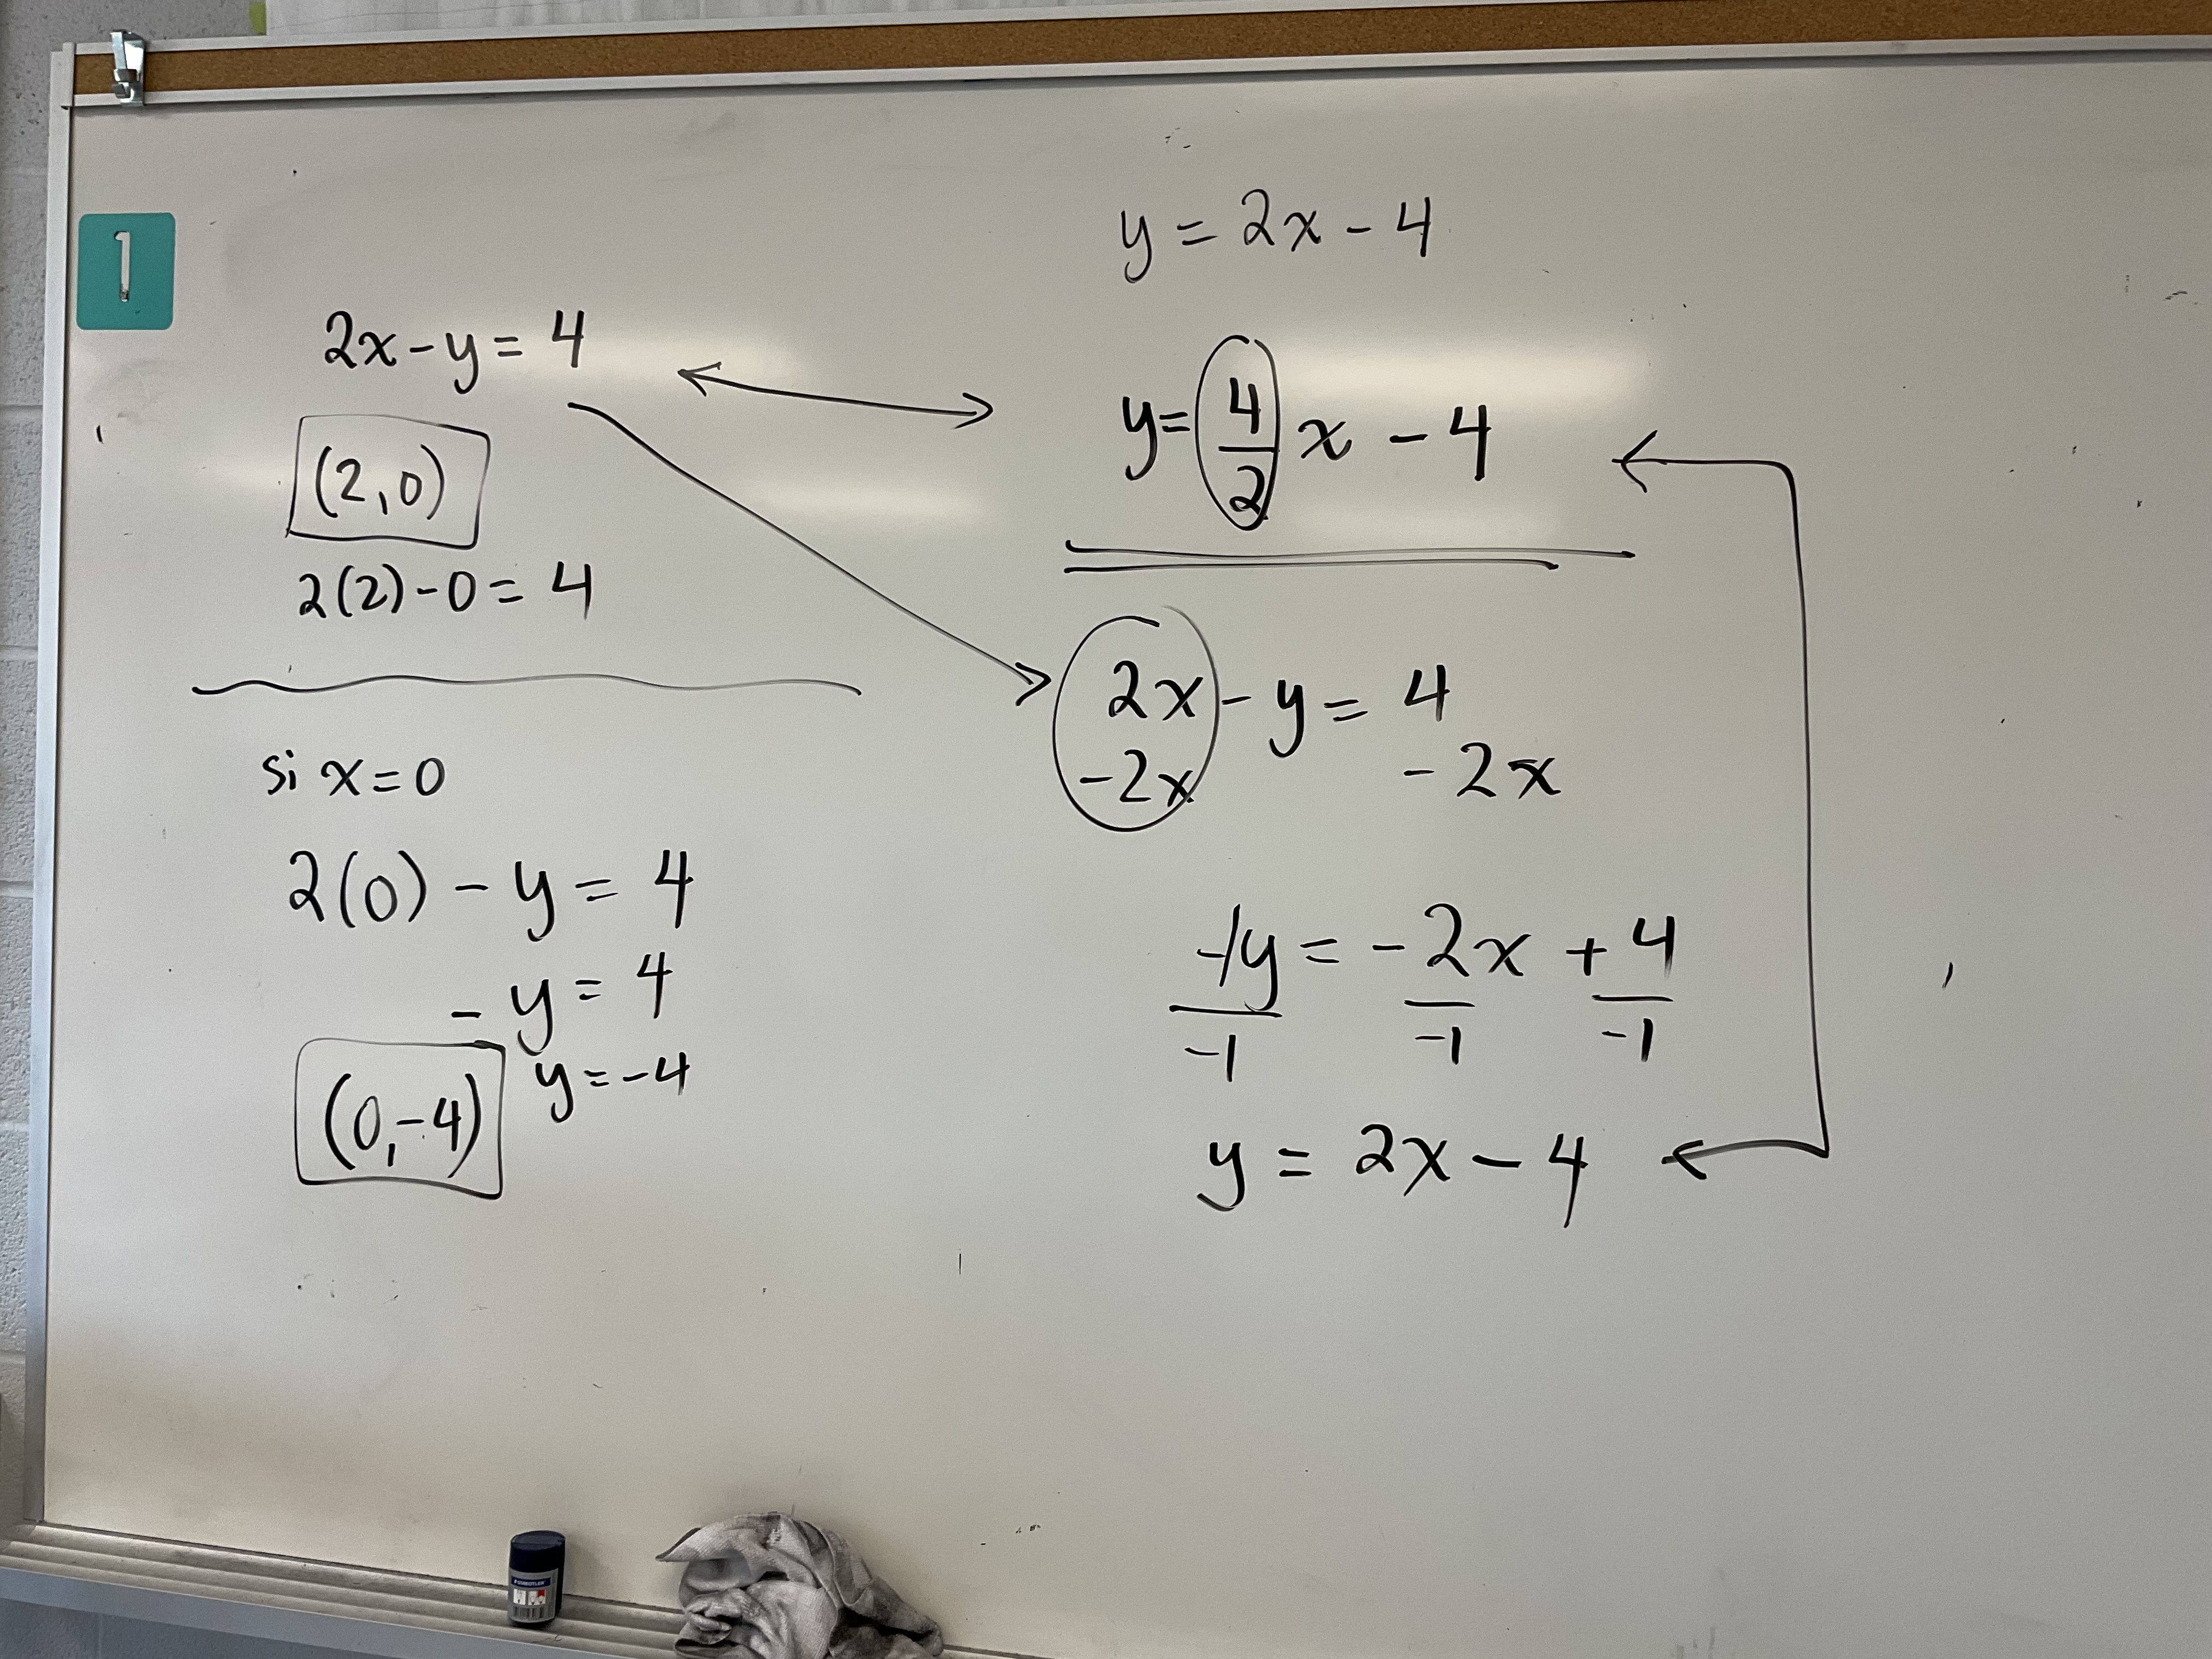
We found the x and y intercepts and plotted them to make a line. We noticed that the graph had a rise of 4 and a run of 2, and started with a y intercept of -4, so we could make an equation. We also determined the y=mx+b form of the line by isolating y. We realized quickly that the slope of 4/2 is the same as the slope of 2/1 or just 2.
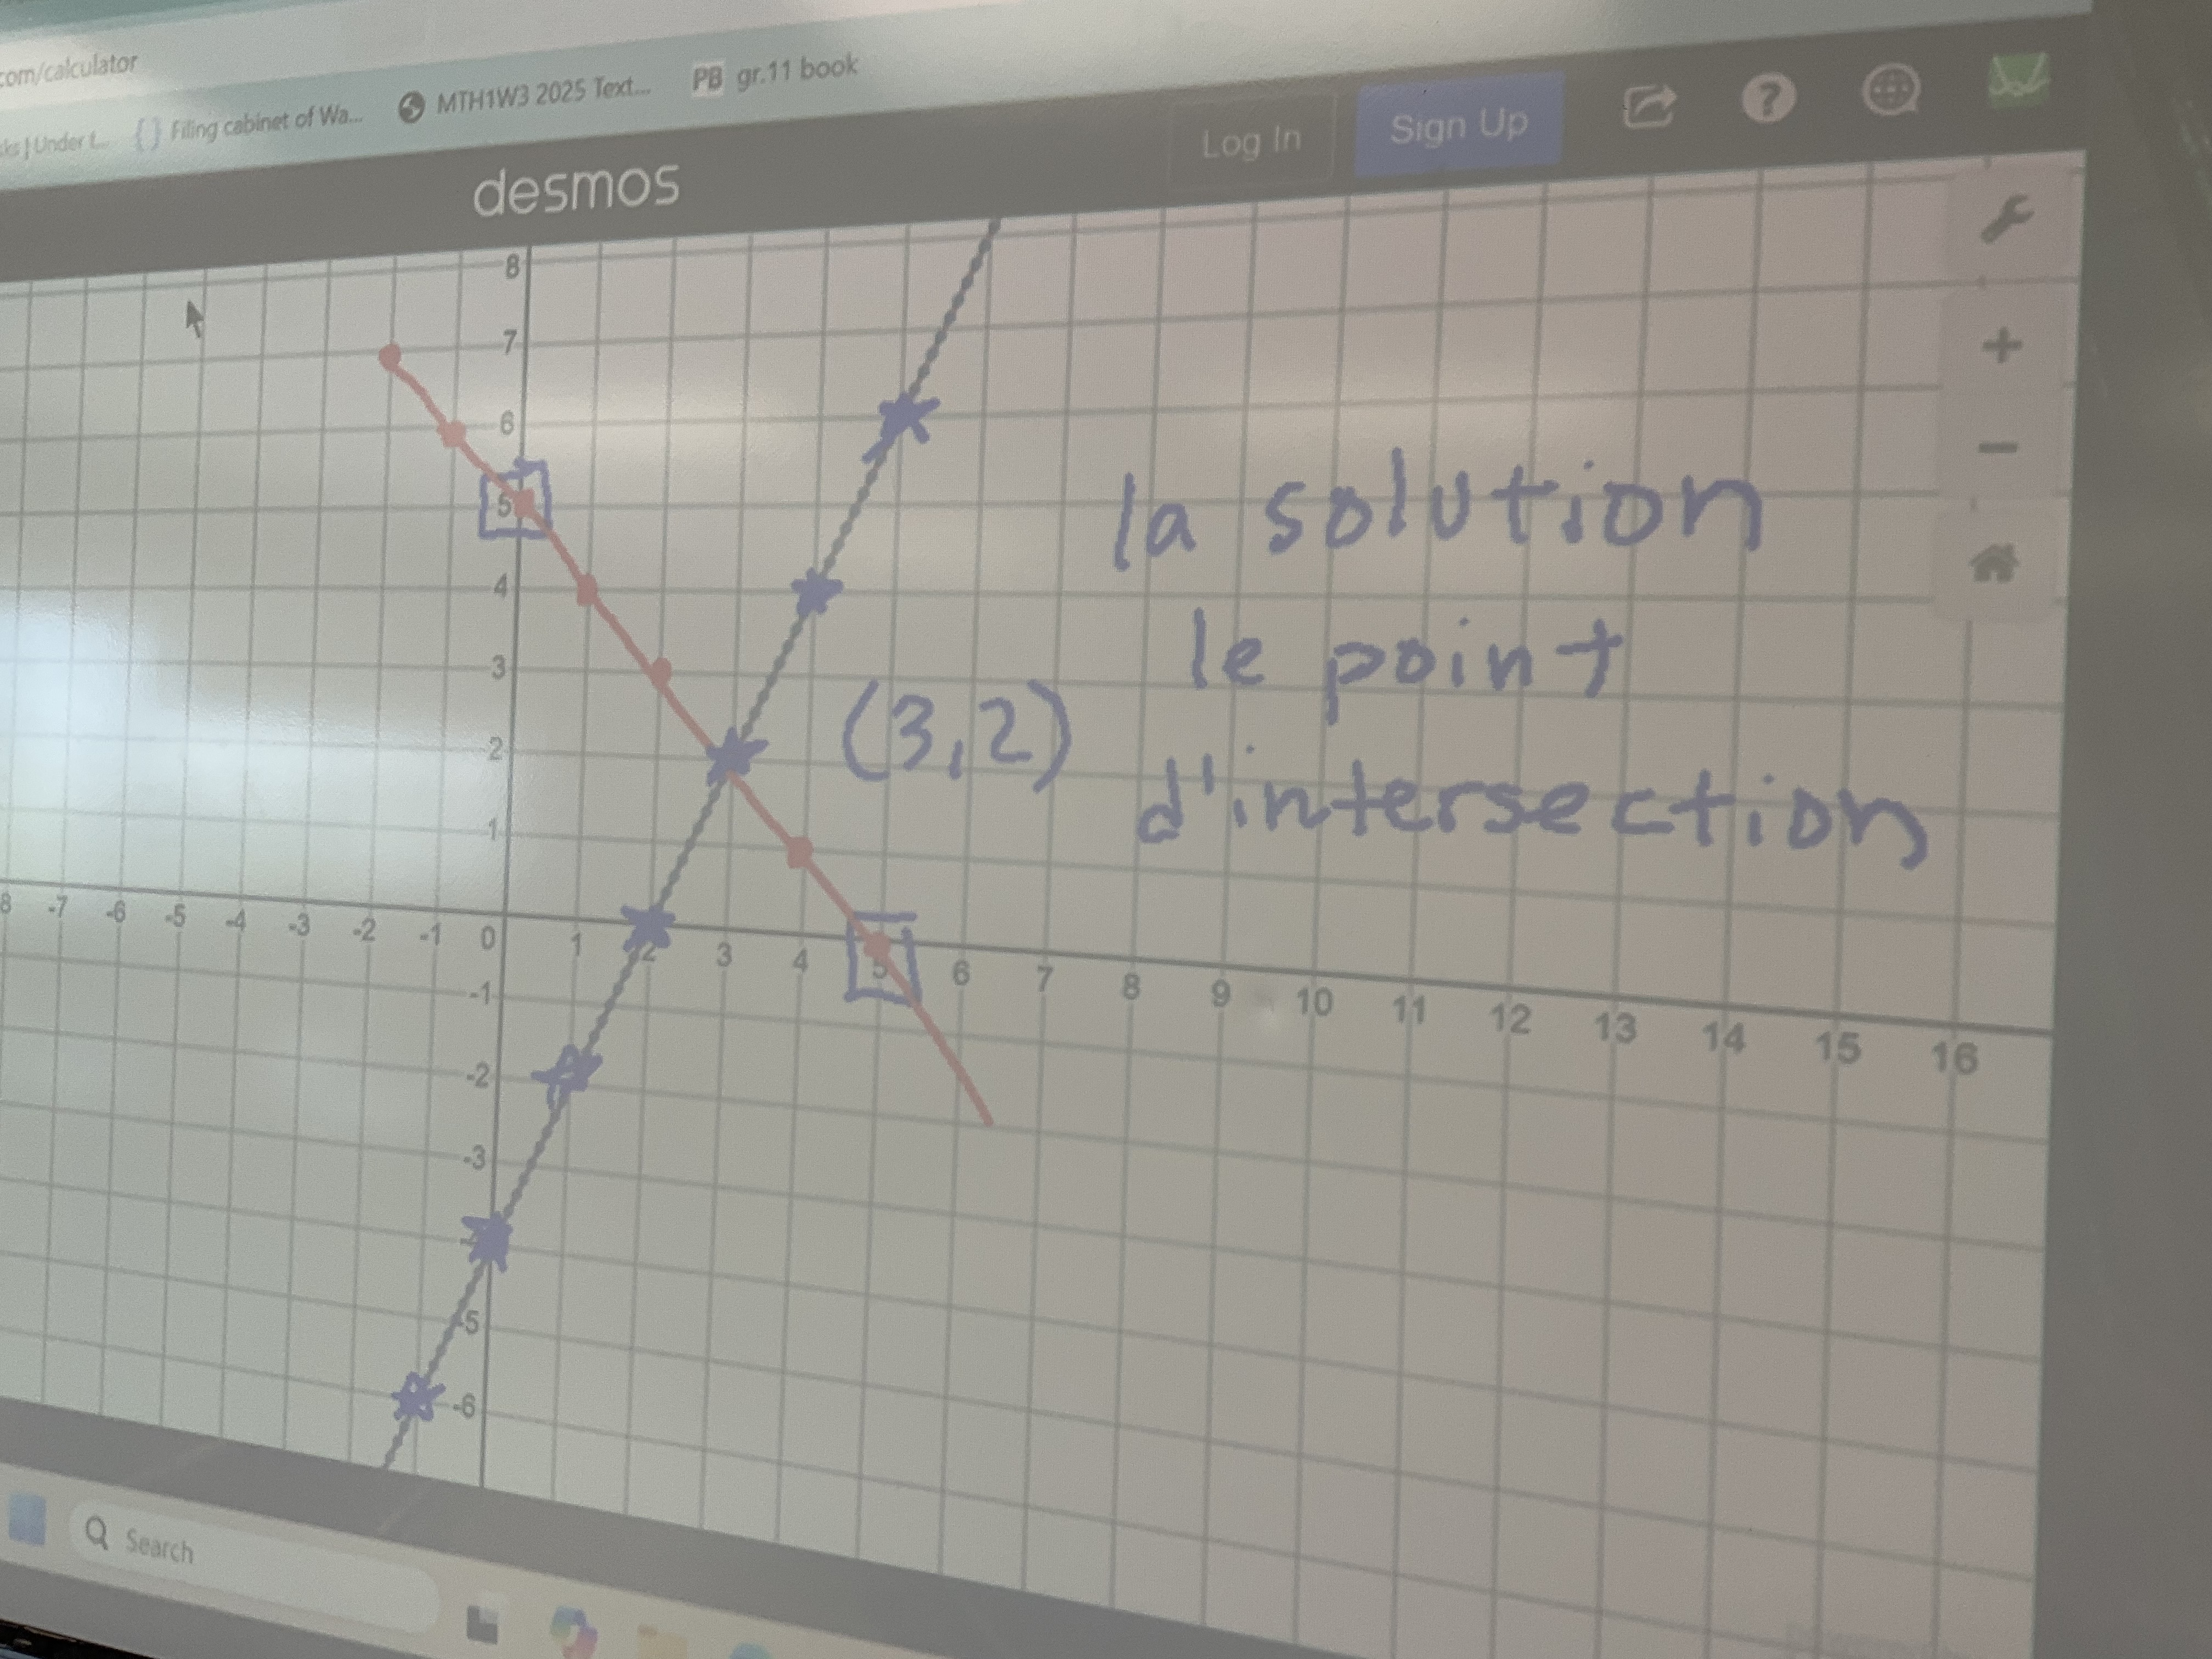
Next we looked at the graph of both the lines, and noticed that there was a point where they crossed. That is the only point that is on both lines.
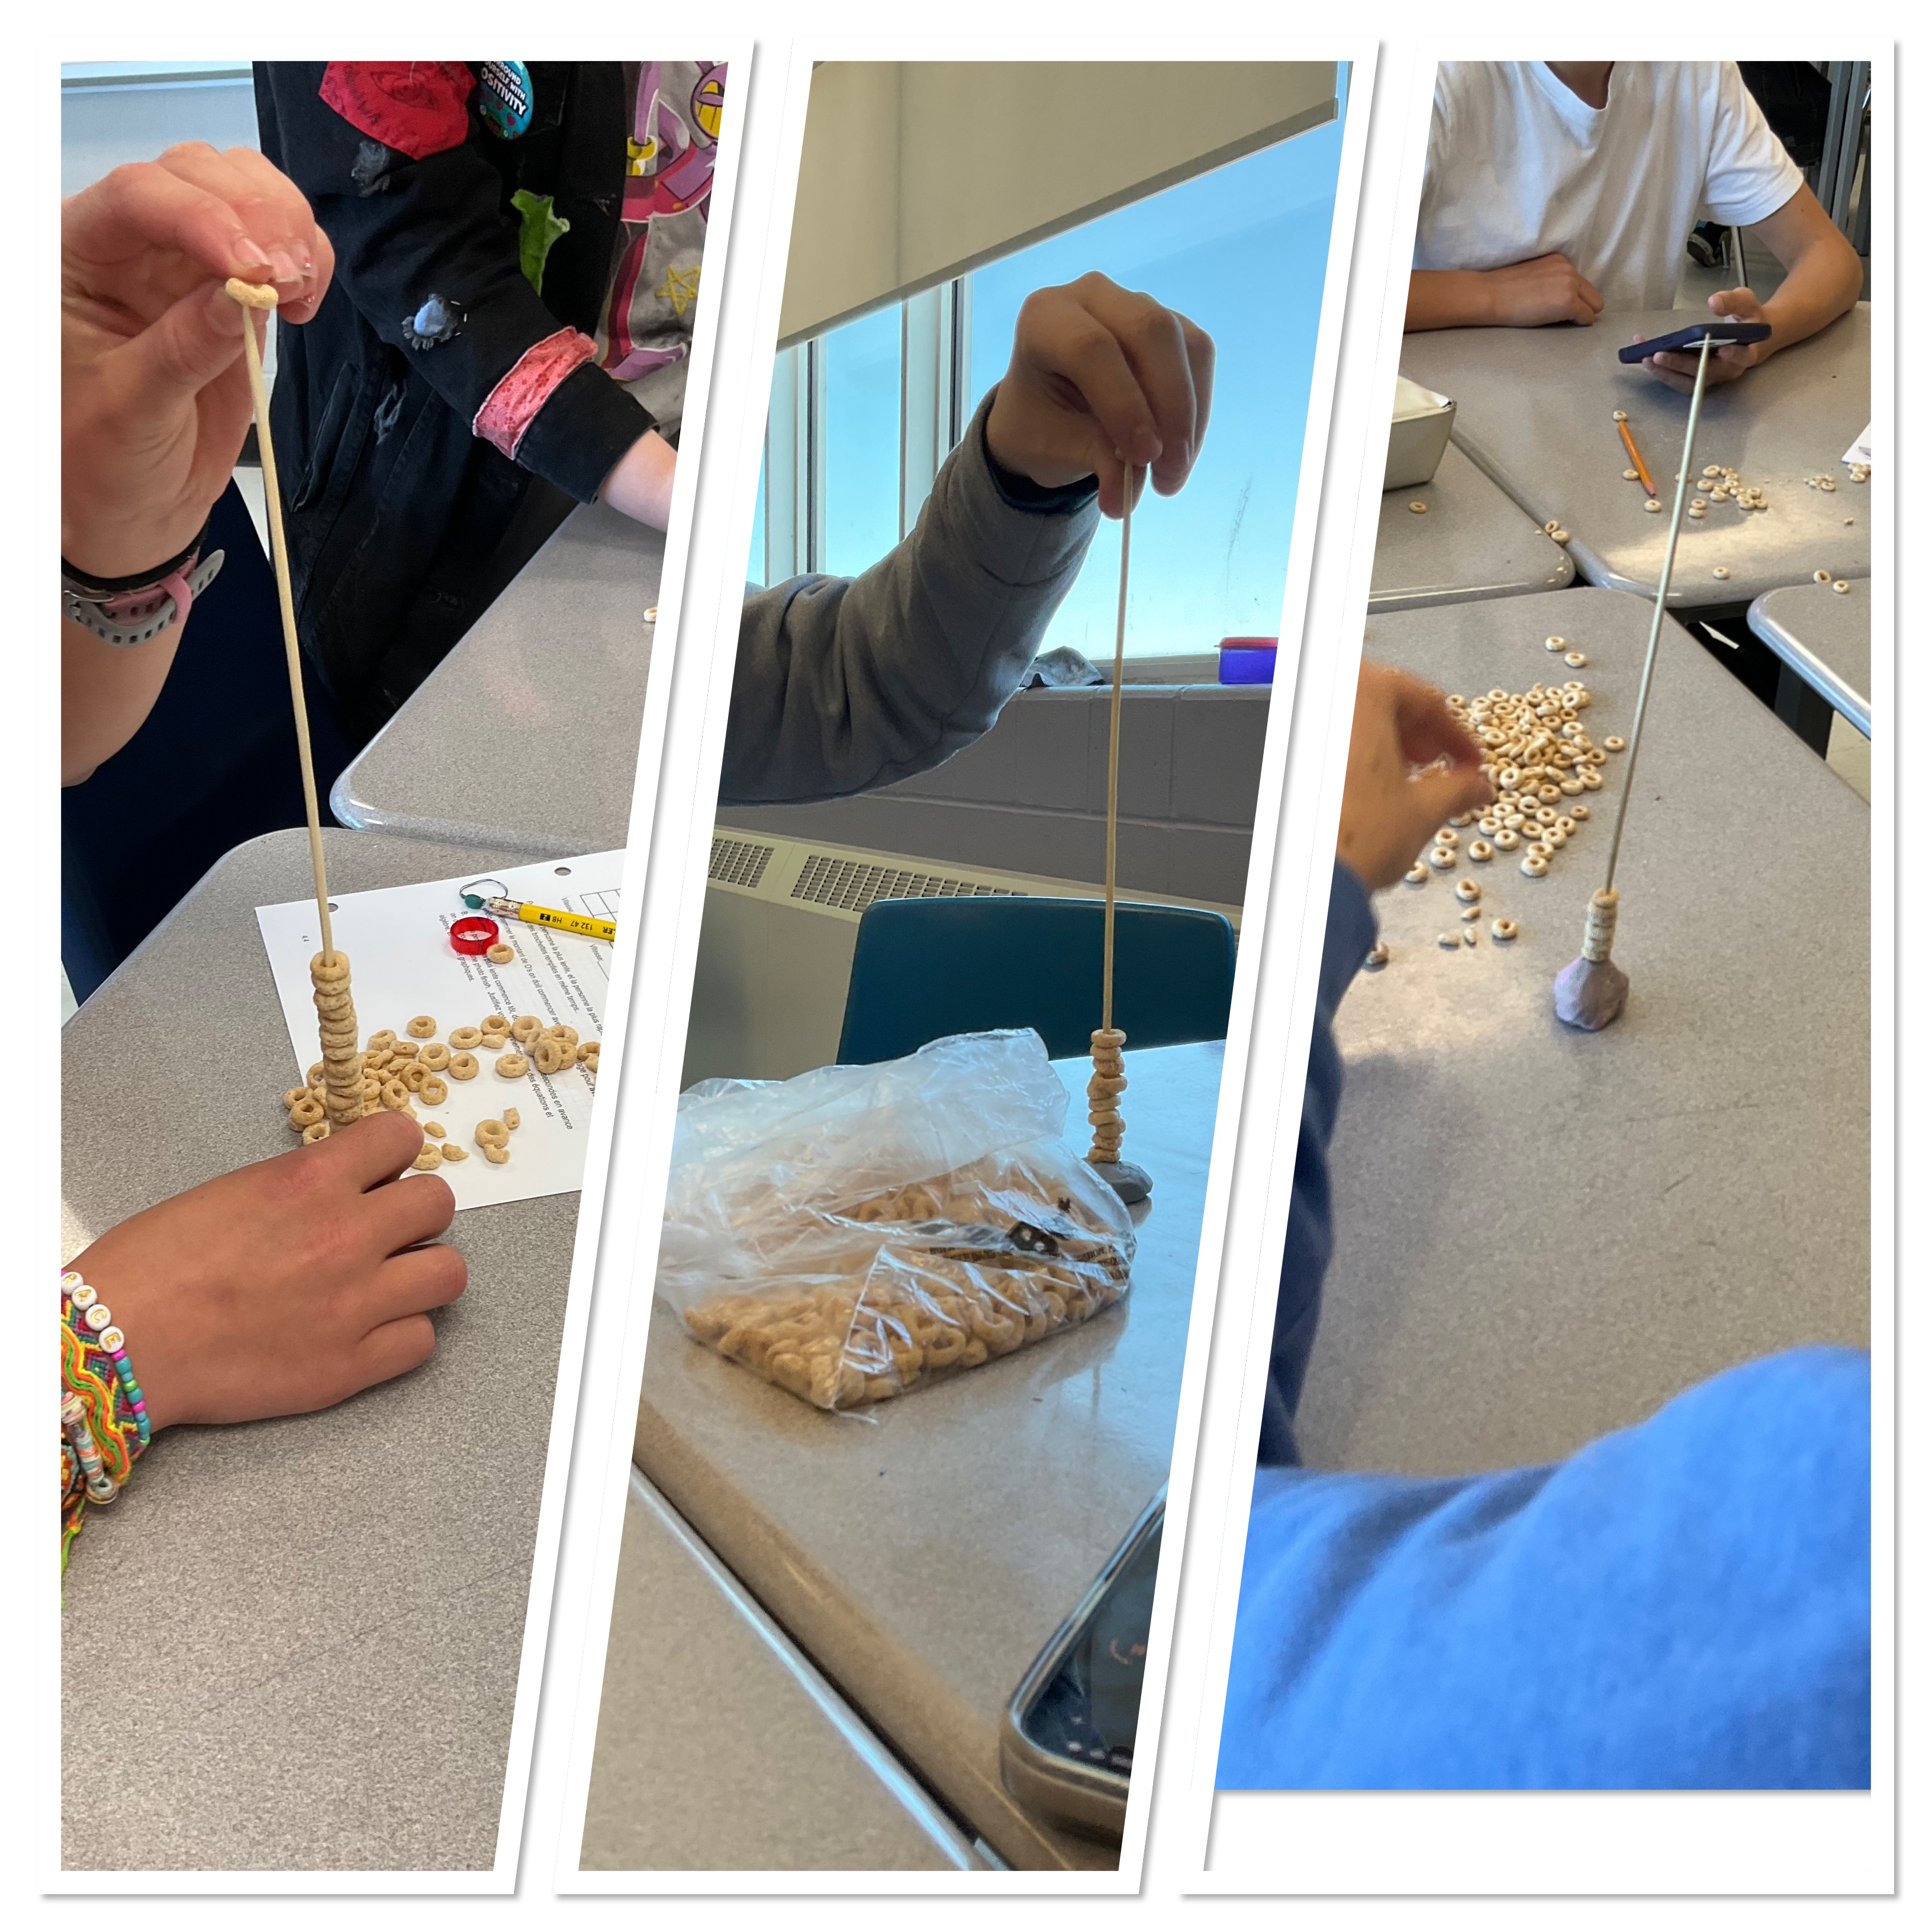
To give ourselves a context for what intersection points are, we participated in a cheerio stacking race.
Students each determined their cheerio stacking speed, in cheerios per minute. We used non dominant hands just to make things interesting. Once they knew their cheerio per minute speed, we tried to set up a photo finish between the slowest in the group and the fastest in the group with both having a full skewer of cheerios. To do that, the slowest person needed a head start of a certain number of cheerios.
We used graphs to help us figure out the head starts. We knew that we wanted both people to have a full skewer at the same time as the fastest stacker. We used the fastest stacker’s data to draw the red line. We know a full skewer is 54 cheerios, so we want that to be our intersection points. We know the slow stacker’s speed, so we can use their slope to count backwards from that intersection point, and we can extend the line to the axis to determine the head start needed.
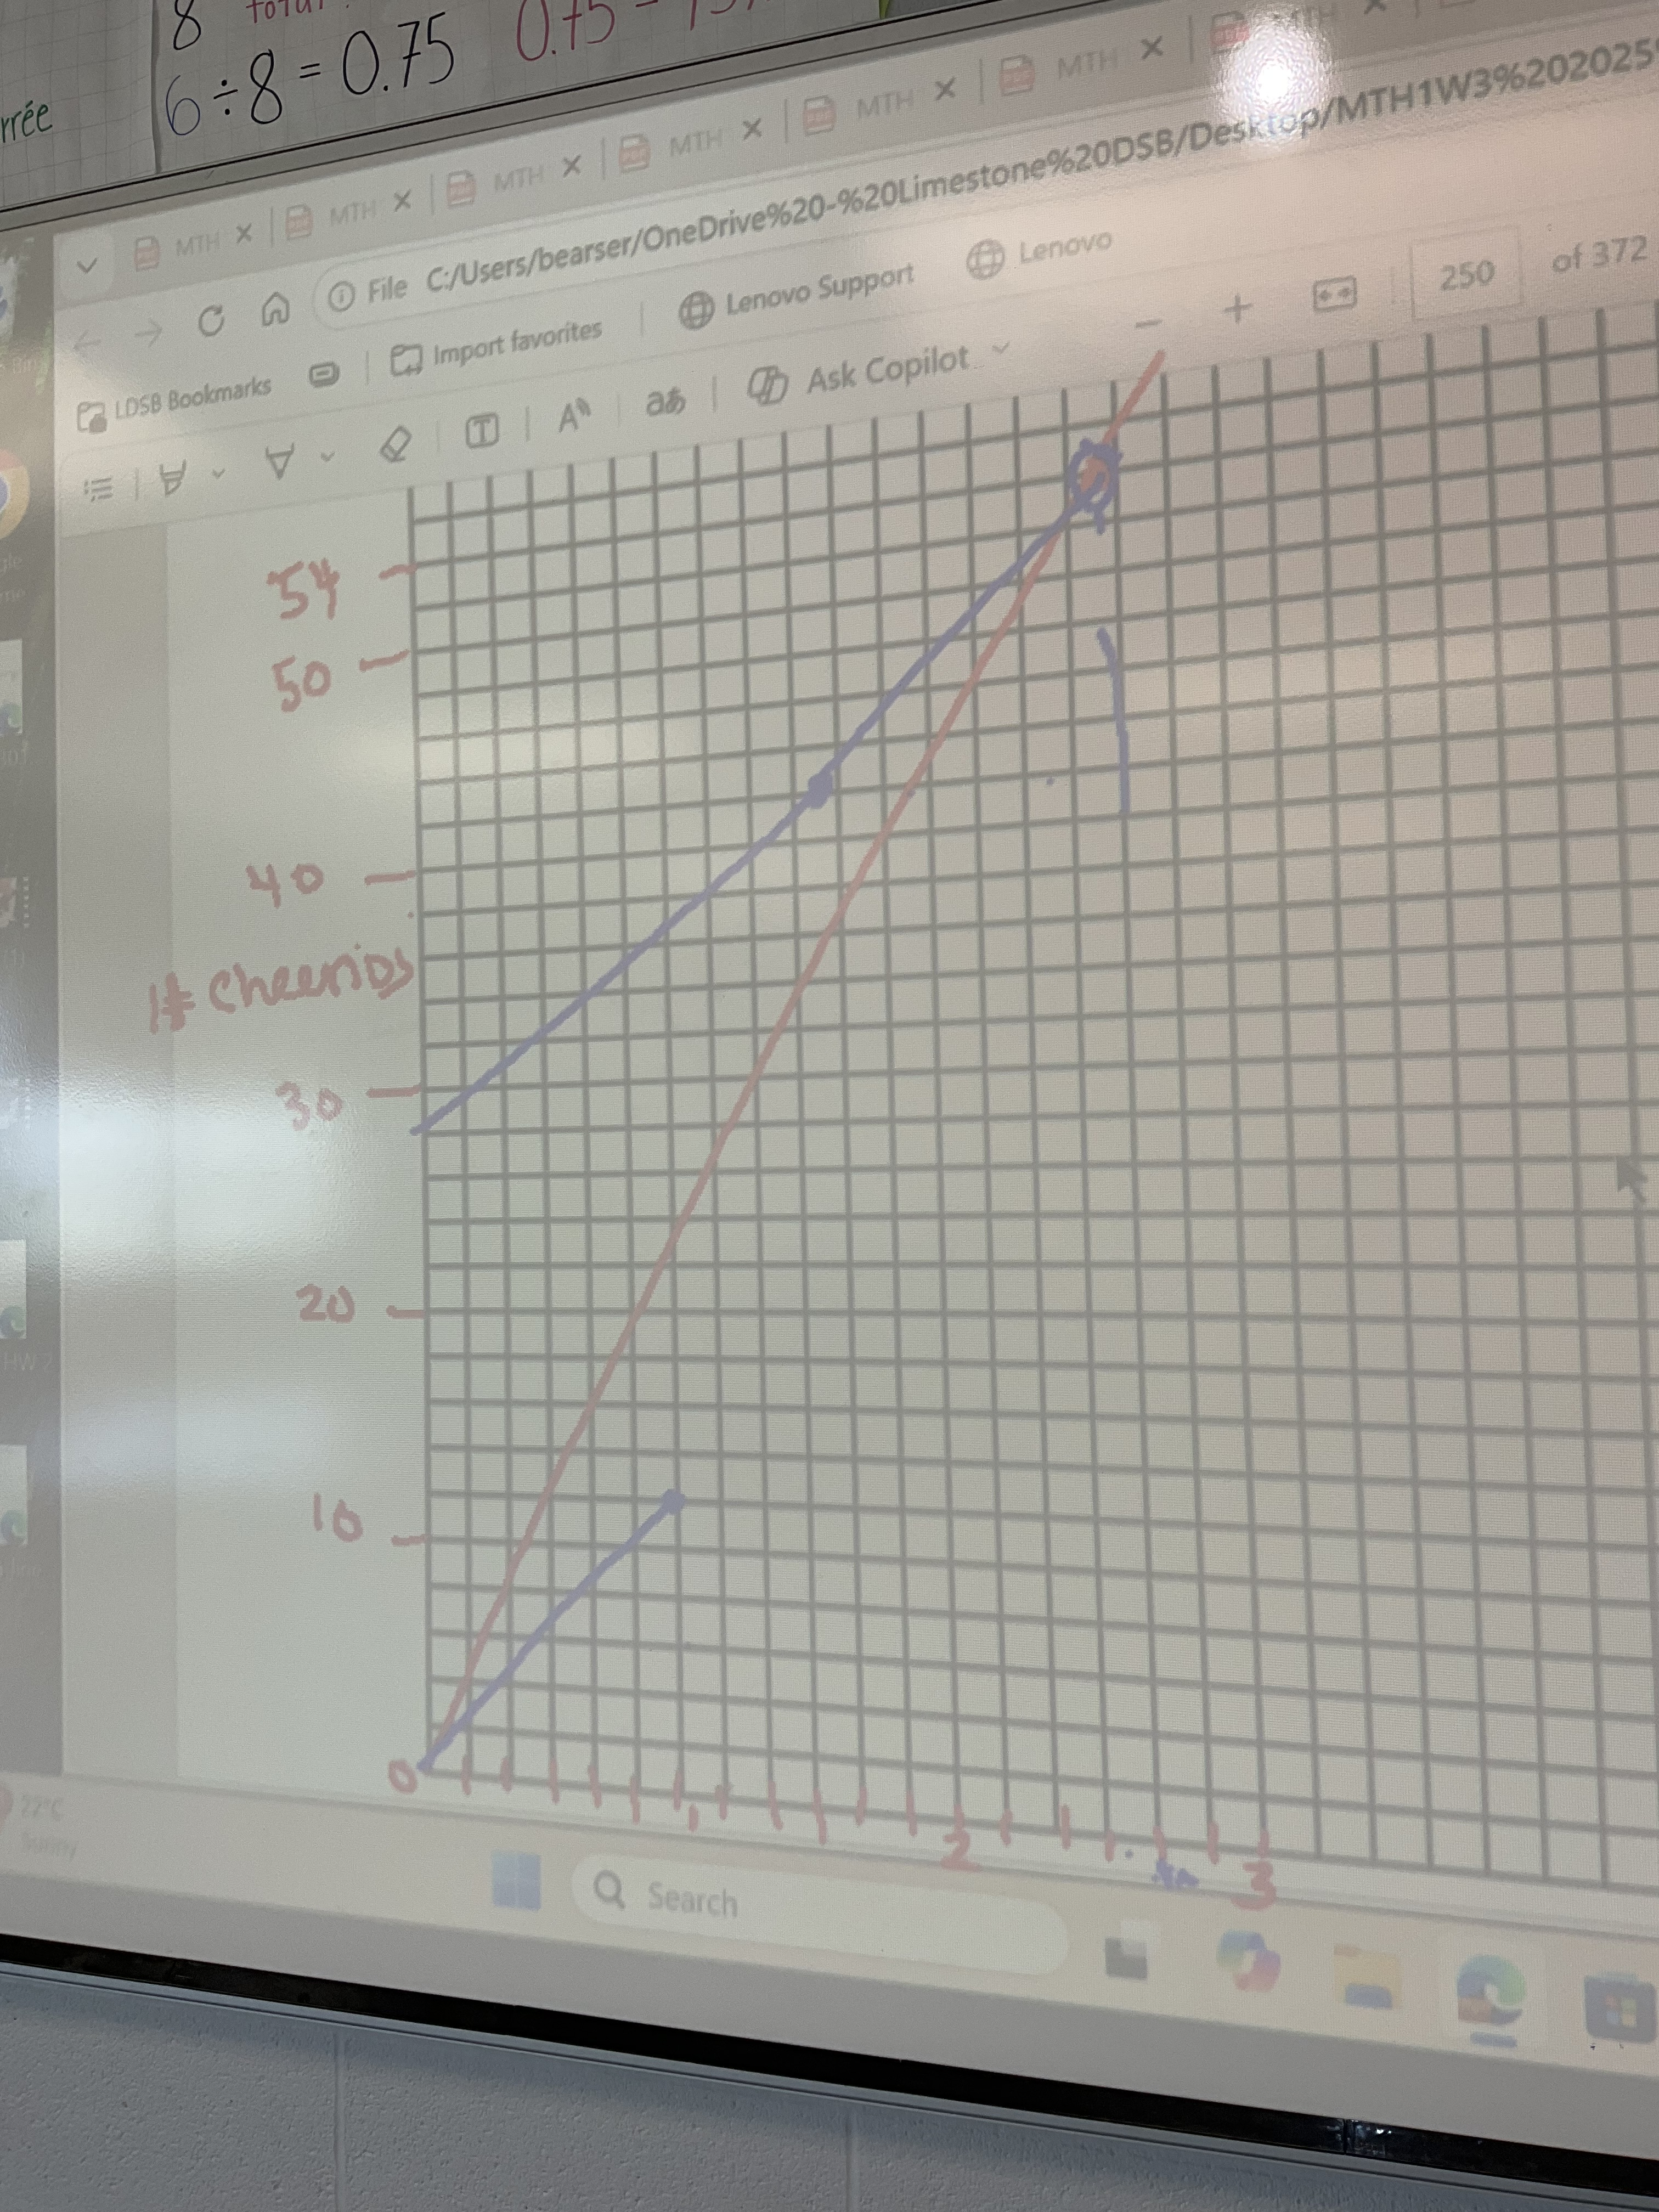
Some groups had more luck than others when testing their head start numbers. Some people had gotten better with practice, or they’d calmed down so hands weren’t as shaky. Some had maybe been cheating a bit the first time, so they had misrepresented their speed. Most of them ended up with a pretty close photo finish even if it wasn’t exact.
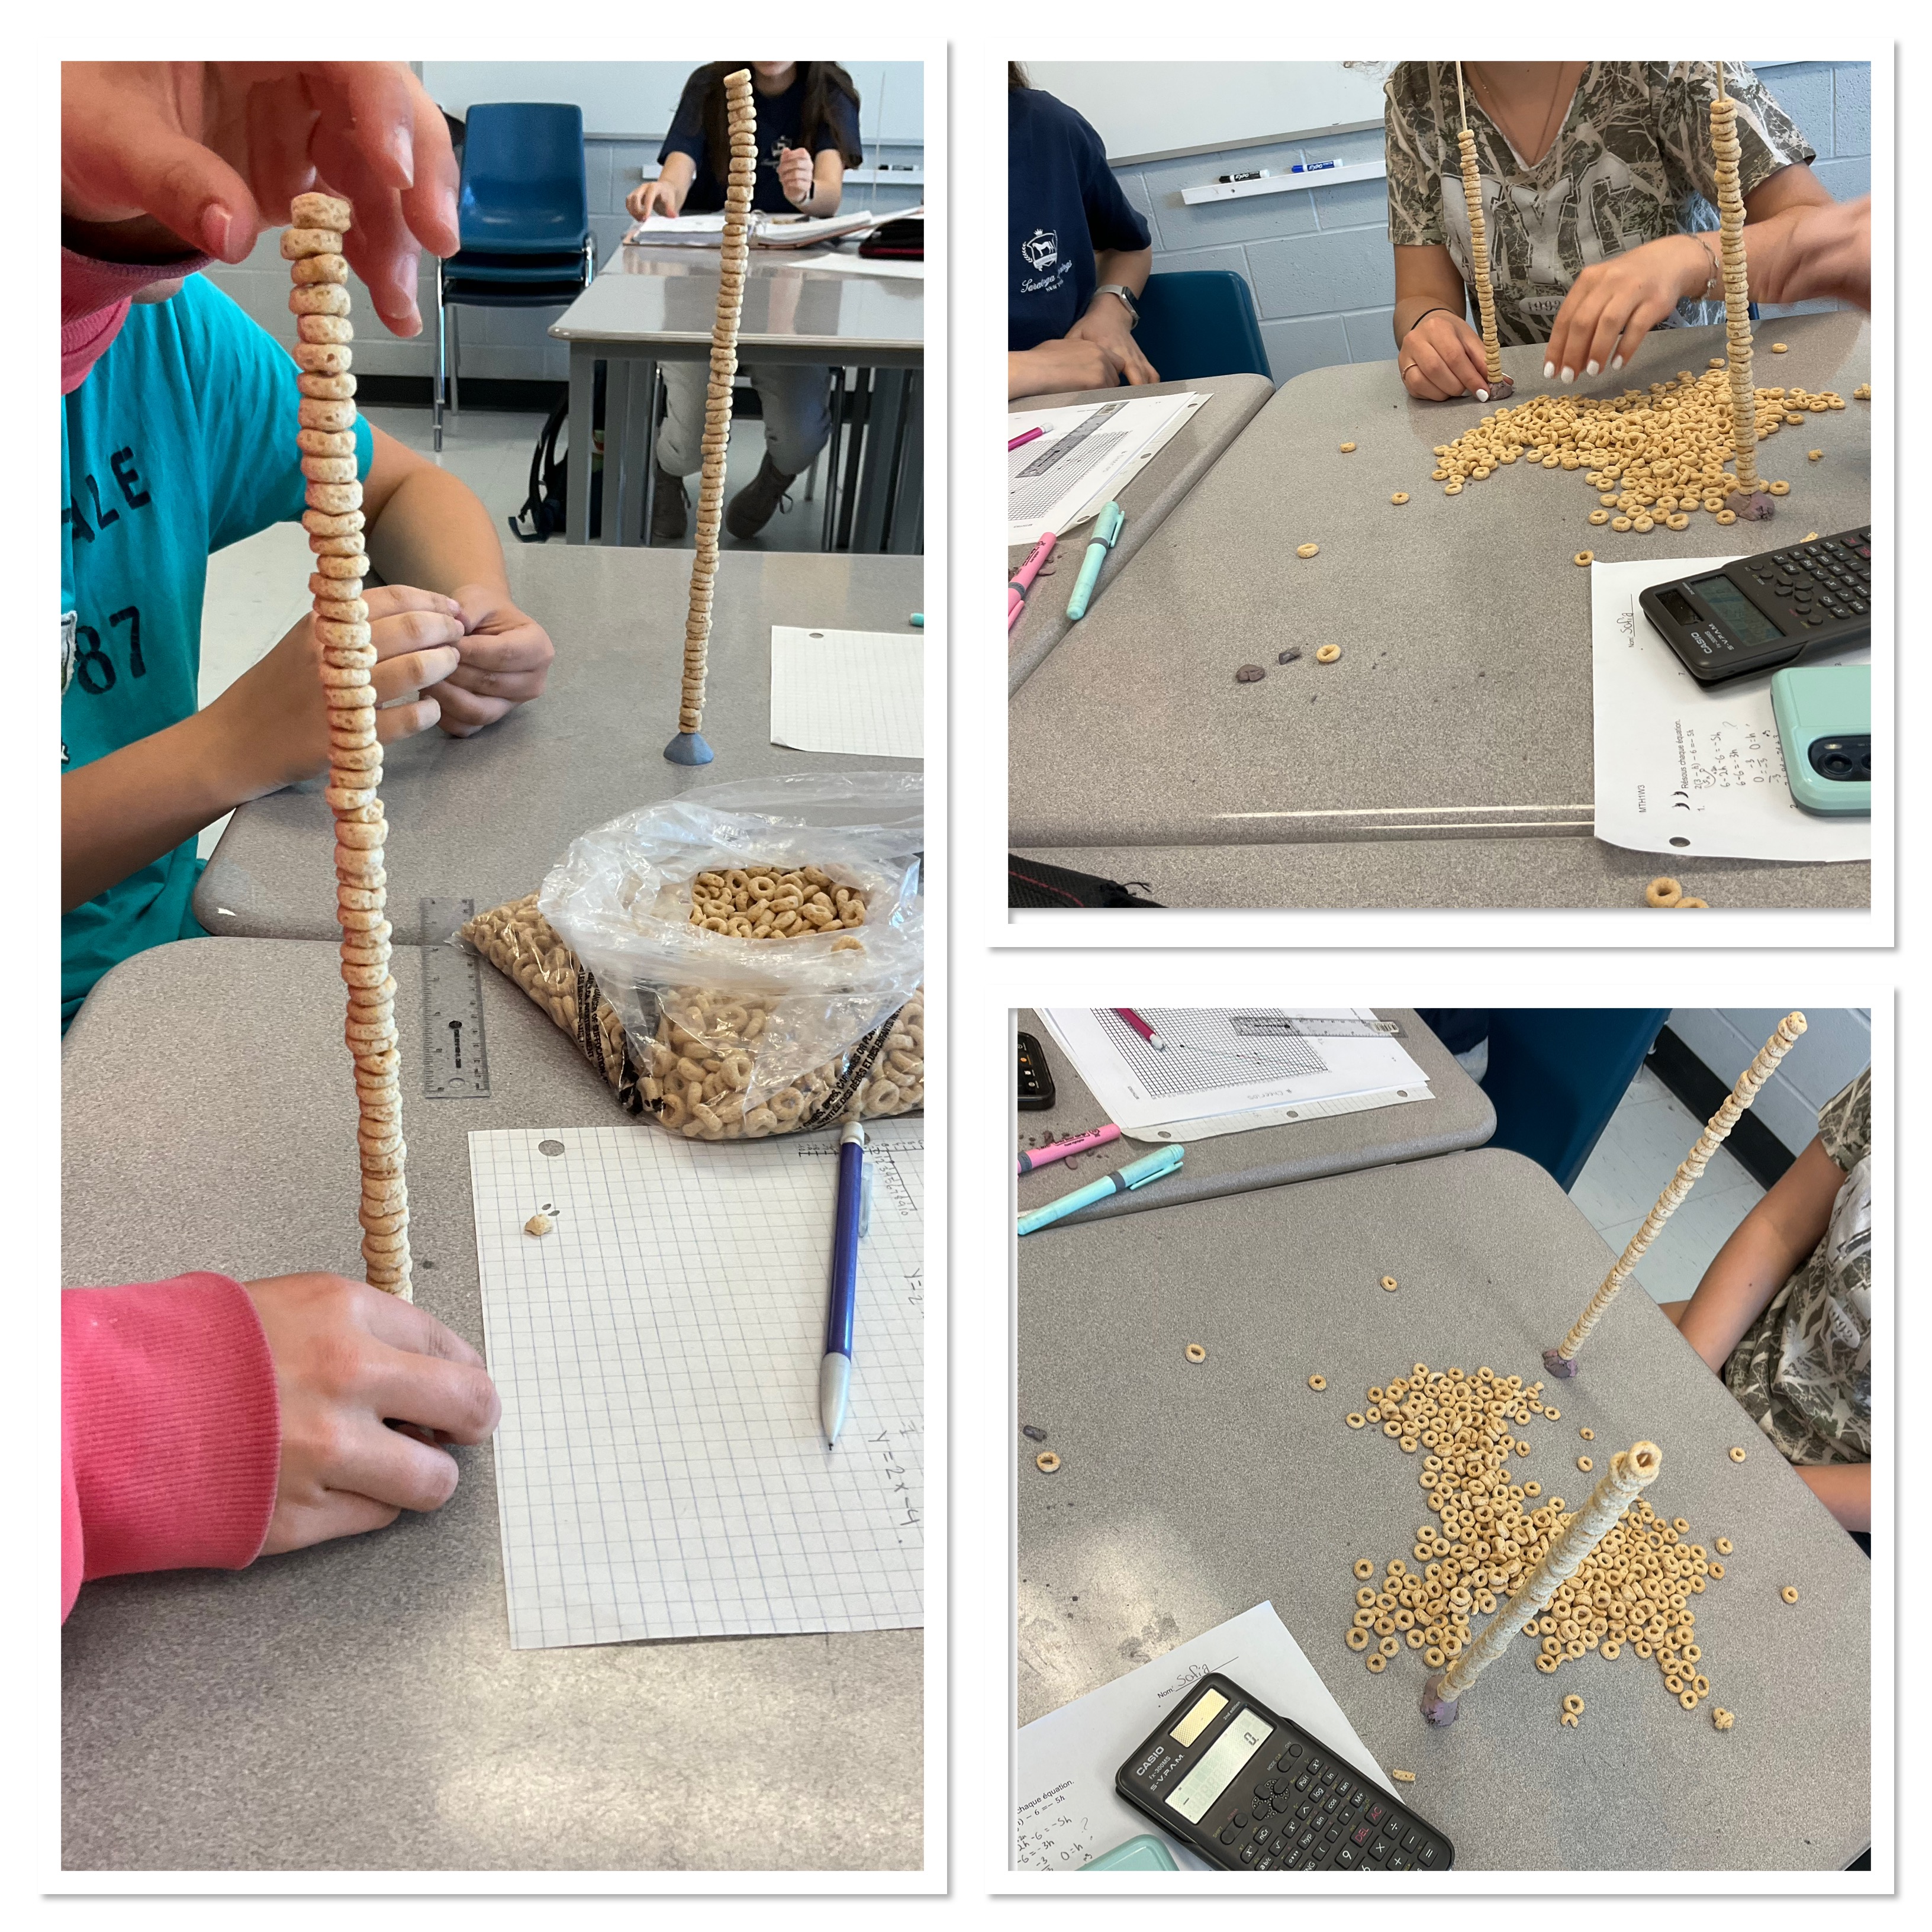
I was particularly proud of how they were willing to try something new, work together, figure out what information they needed, and how to figure out a head start. Also at the end of the class materials were cleaned up and put away without issue which is not always the case when it comes to cheerios! Thanks grade 9s 🙂
Desmos and Inequalities
Grade 9s are using desmos to explore inequalities and equations on the cartesian plane. We started by making a list of all the possible numbers we know that add up to something less than or equal to 10.
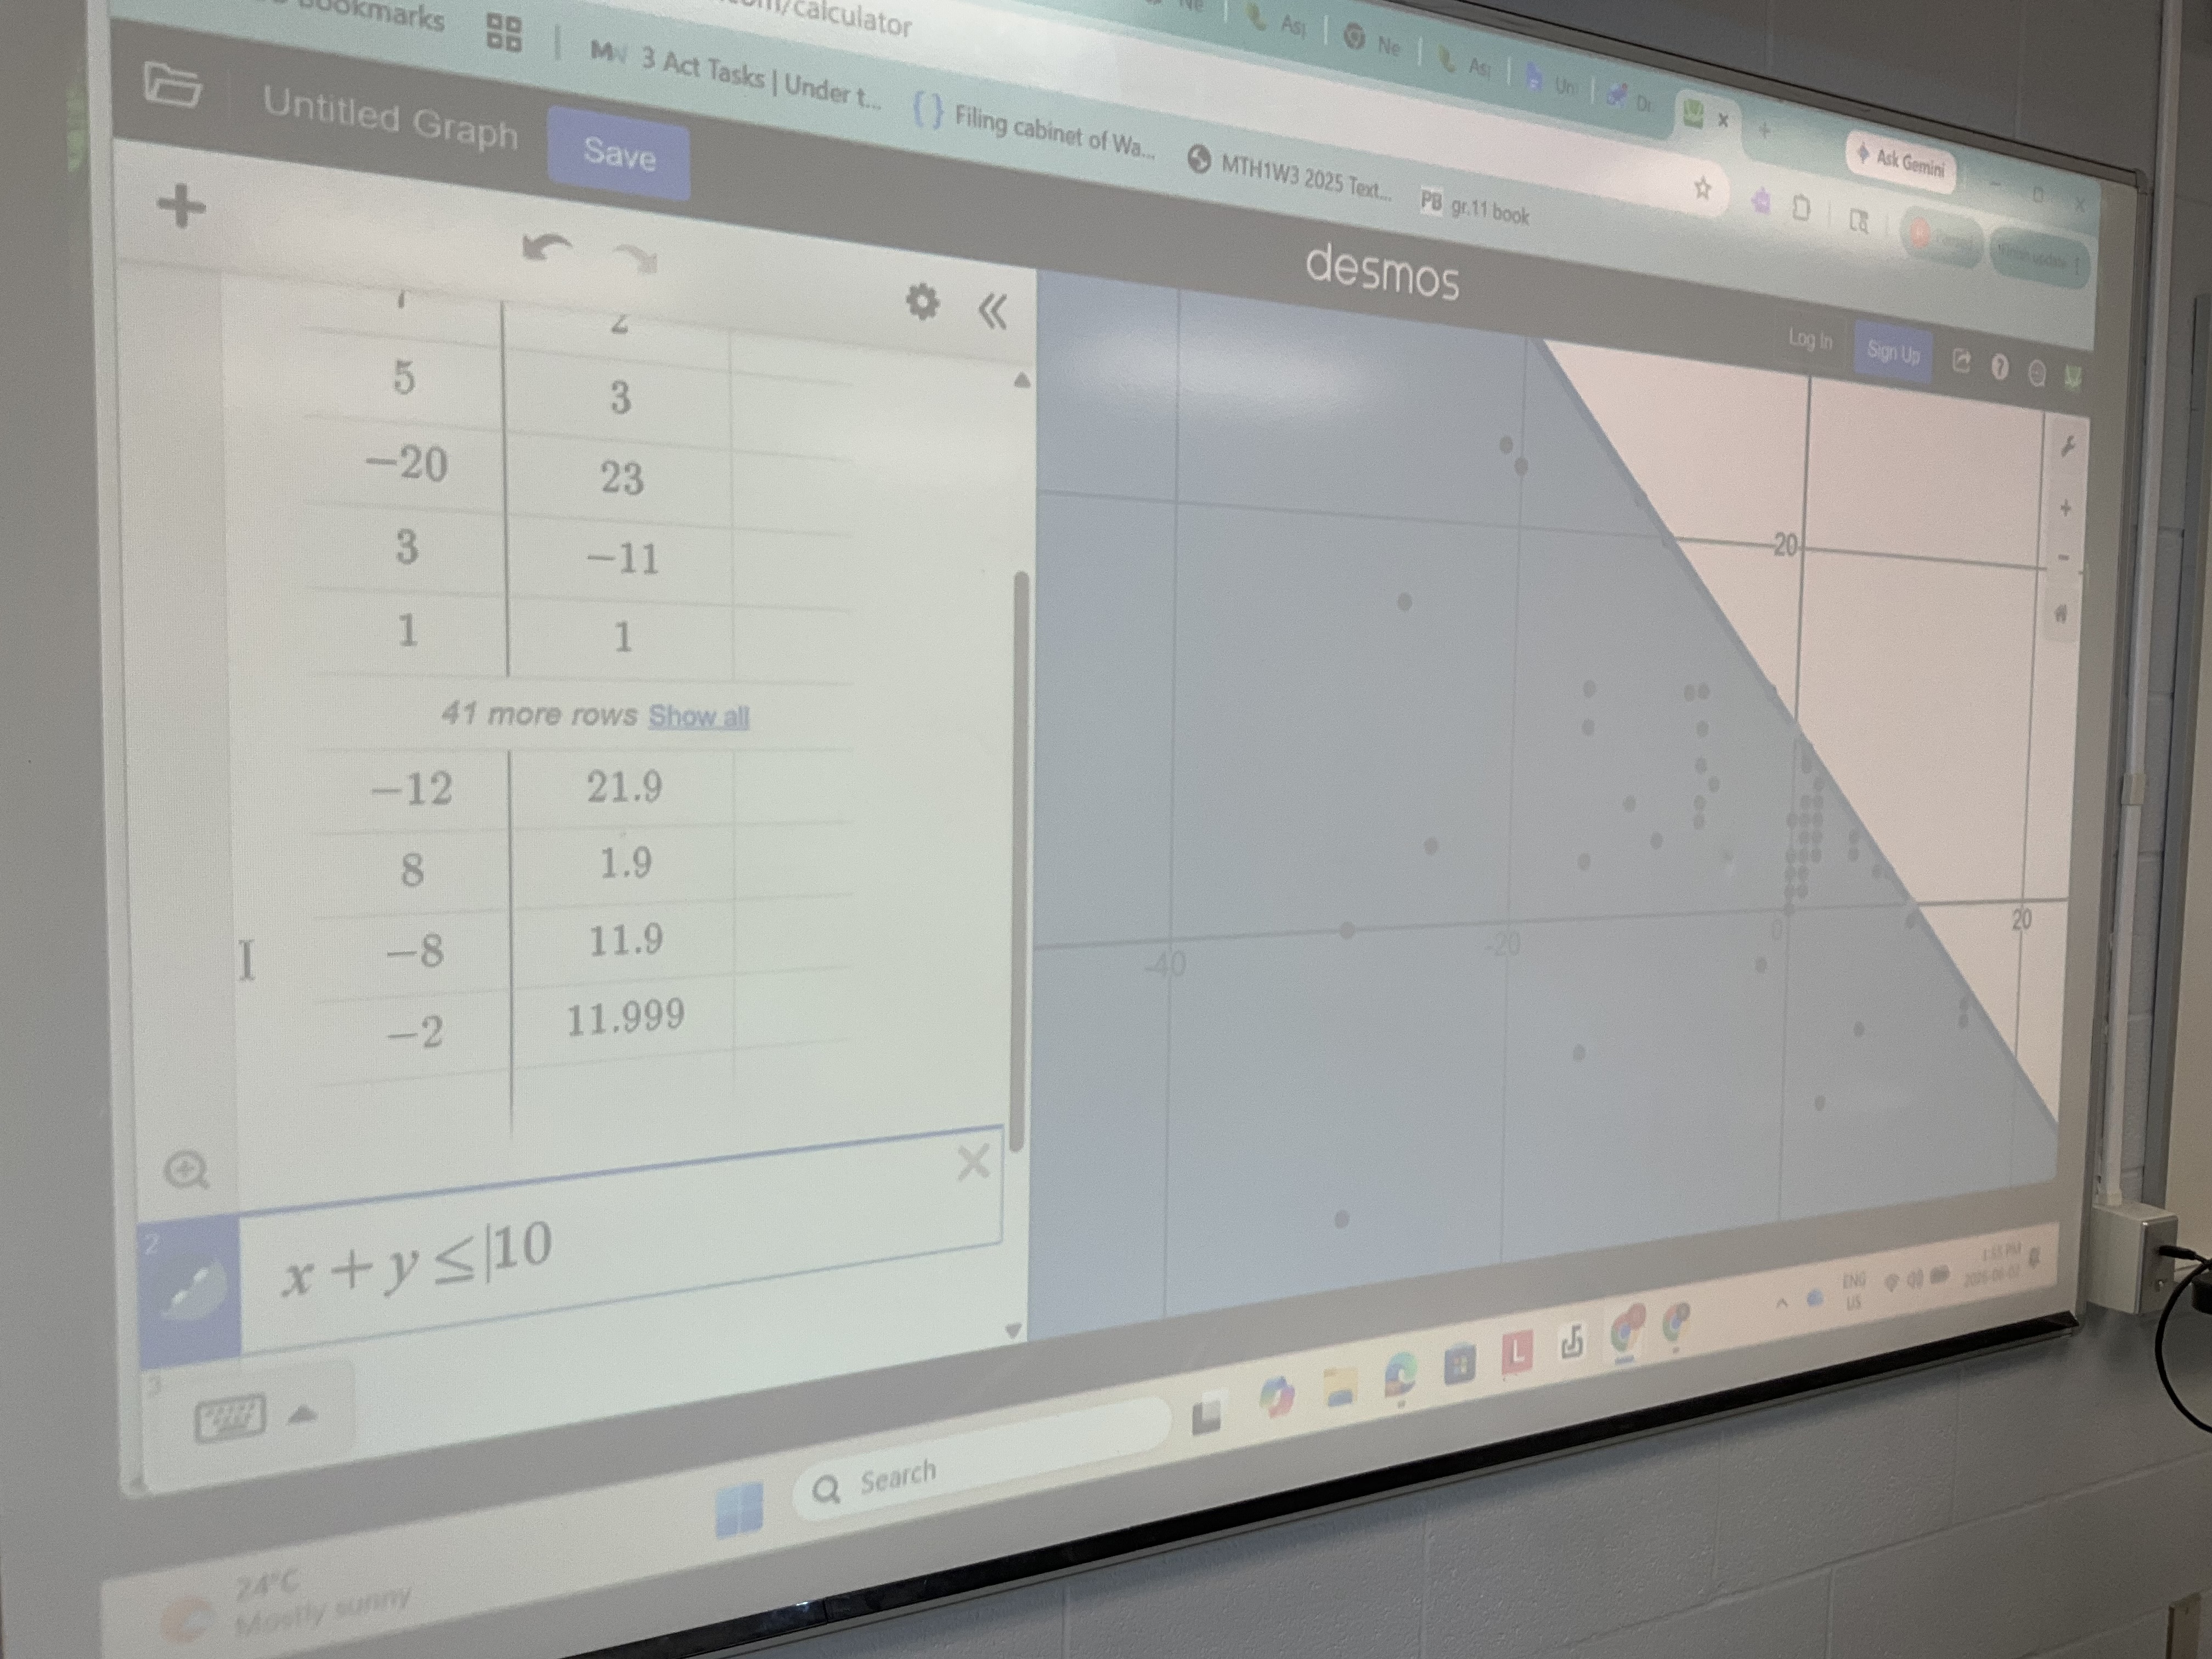
After we compiled the list, we noticed that there was a region that had dots, and a region that didn’t. We then found out that you could type inequality symbols in desmos and it will show the region coloured in, bound by a dotted or solid line depending on if there’s an “or equal to” in the symbol.
We got to review skills of isolating y, remembering what slope and rise and run are, what’s the y intercept. We also looked at how to calculate the x and y intercepts because sometimes that’s a faster approach. We substituted 0 in for x, and then for y and calculated the intercept values.
We’ll keep working on more graphing tomorrow and solving systems graphically. There’s so much to review before the exam and EQAO. I’m very glad we spiralled through material so it all is kind of building on past skills and review.
Arithmetic Series
Today grade 11s were working on making rules for adding up arithmetic sequences. We started off with adding all the counting numbers from 1 to 1000. The challenge was interesting for me to watch. Some groups started adding, looking for patterns in the list. Some got overwhelmed by the 1000 and said it’ll be big, and stopped there. I redirected the class to try adding the numbers from 1 to 10 as a more simple task and then to see id they could find a strategy that might help them.
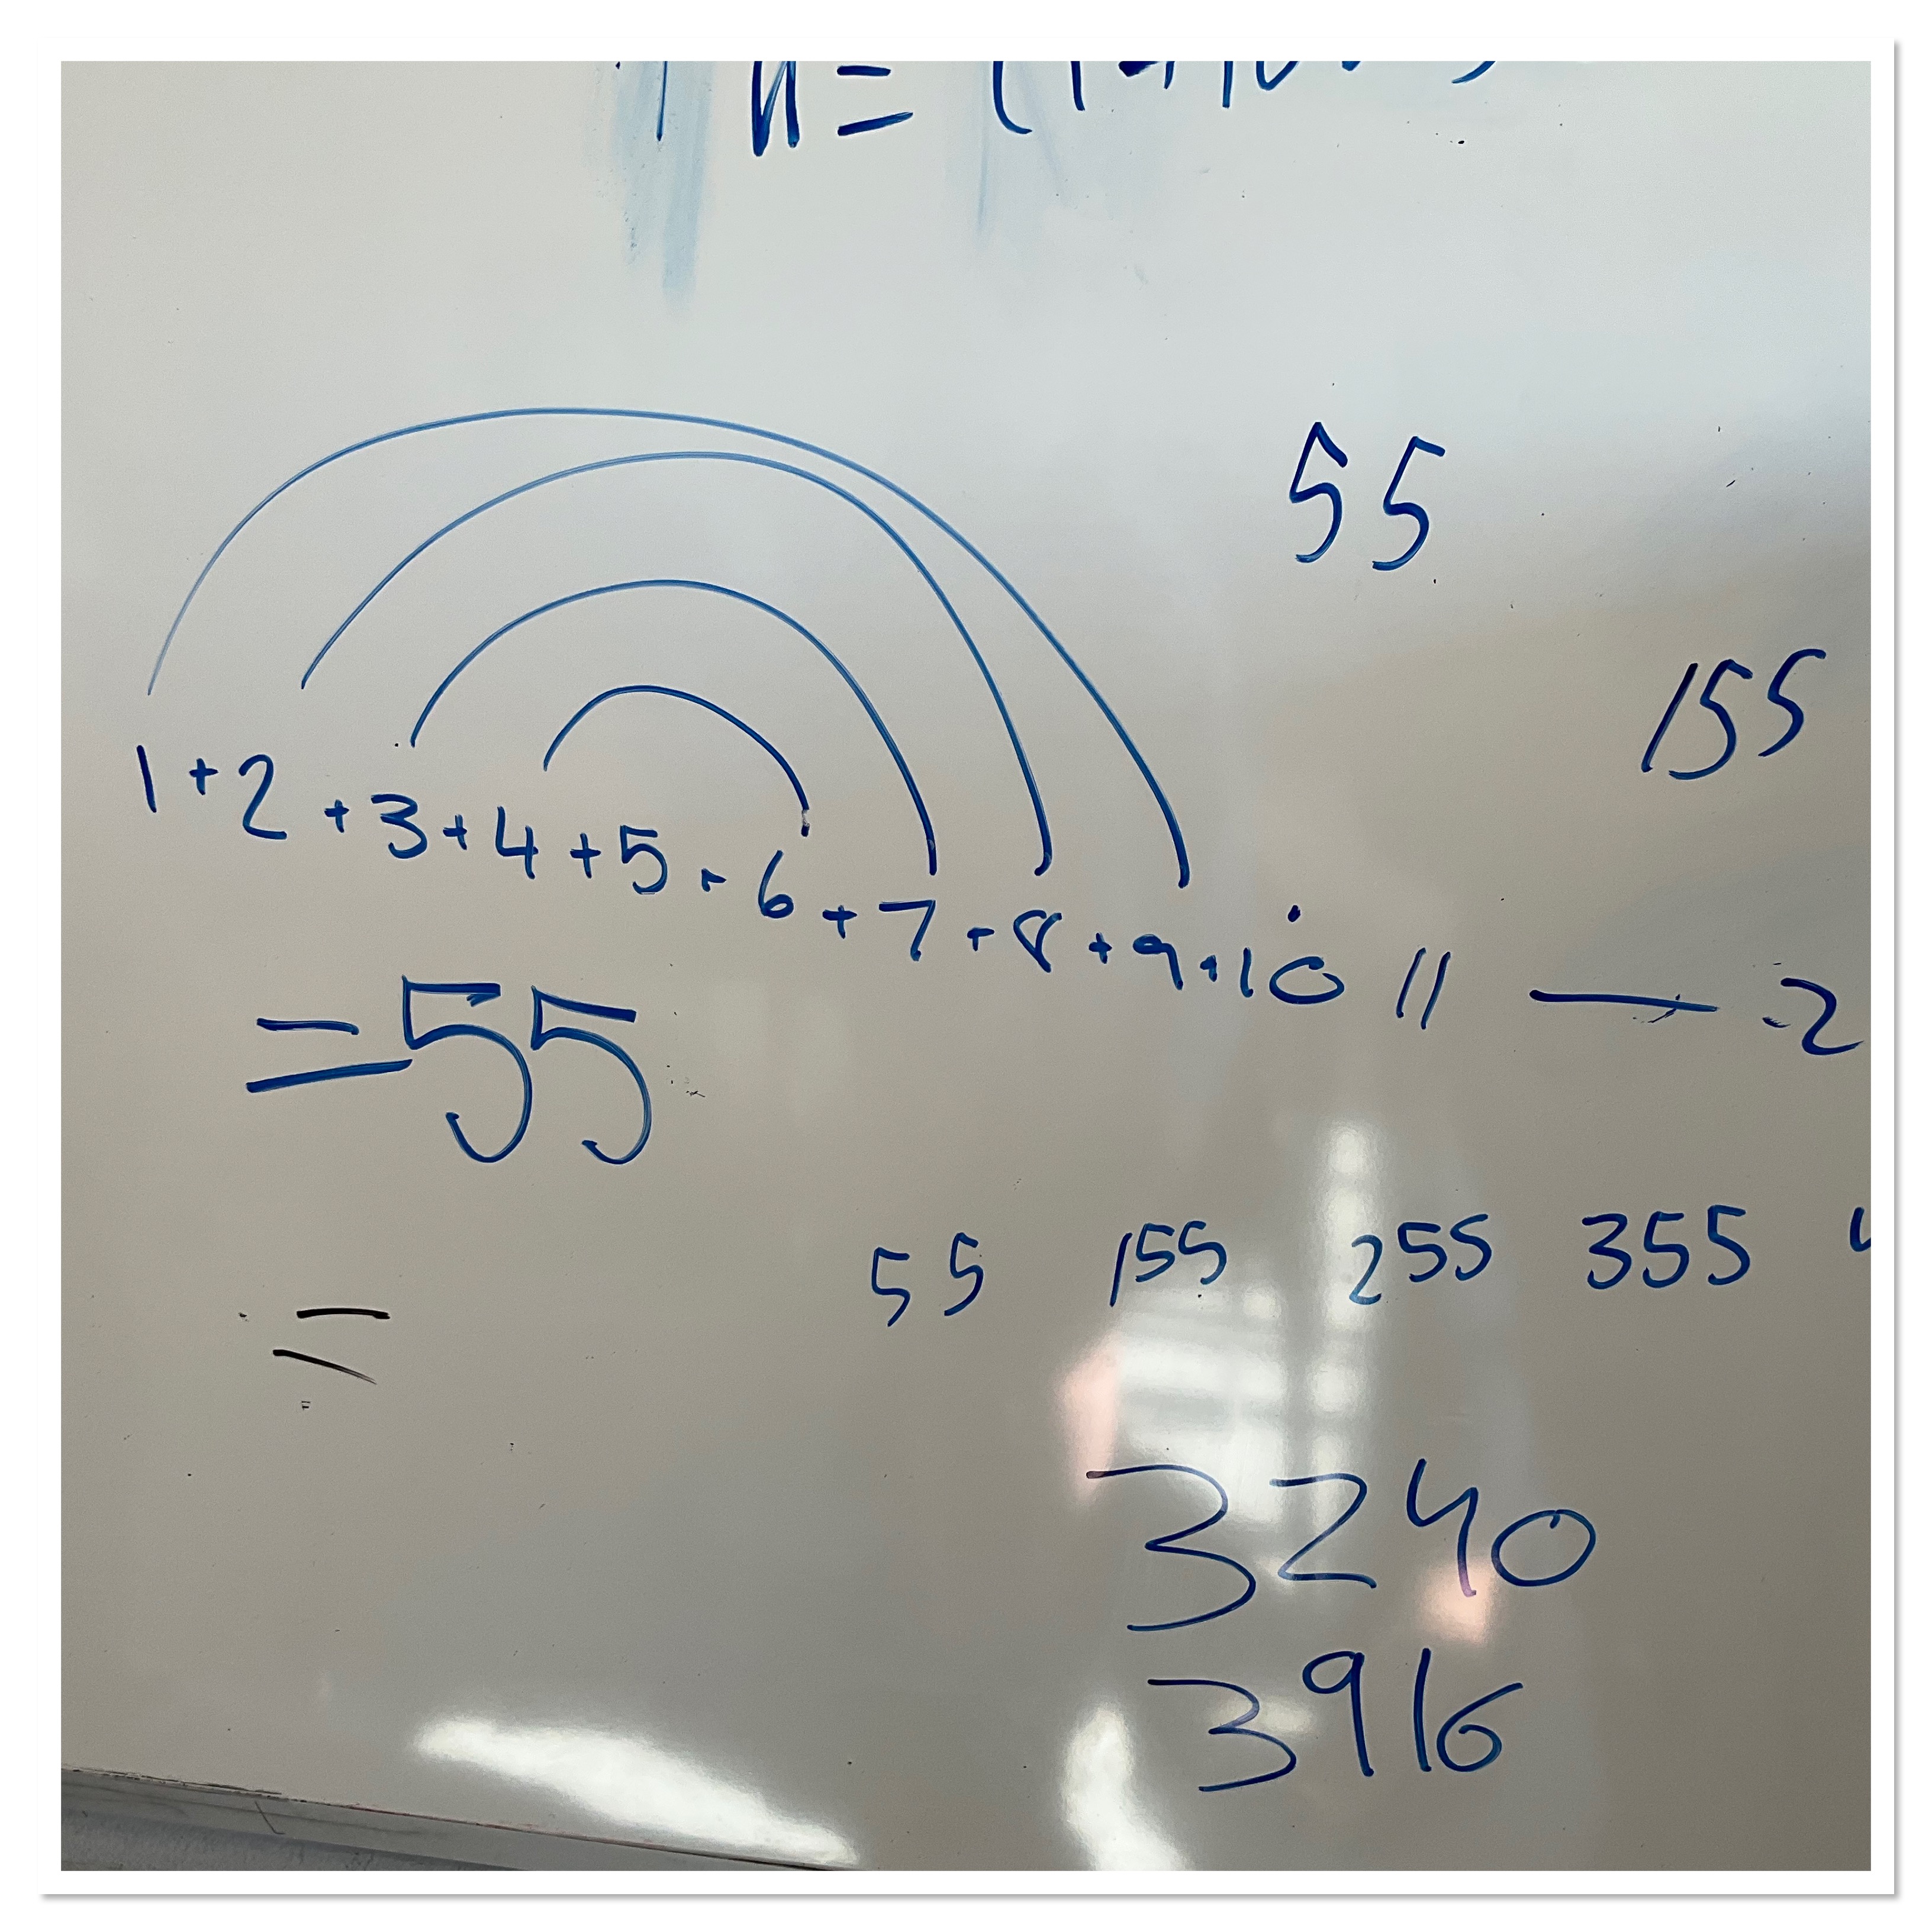
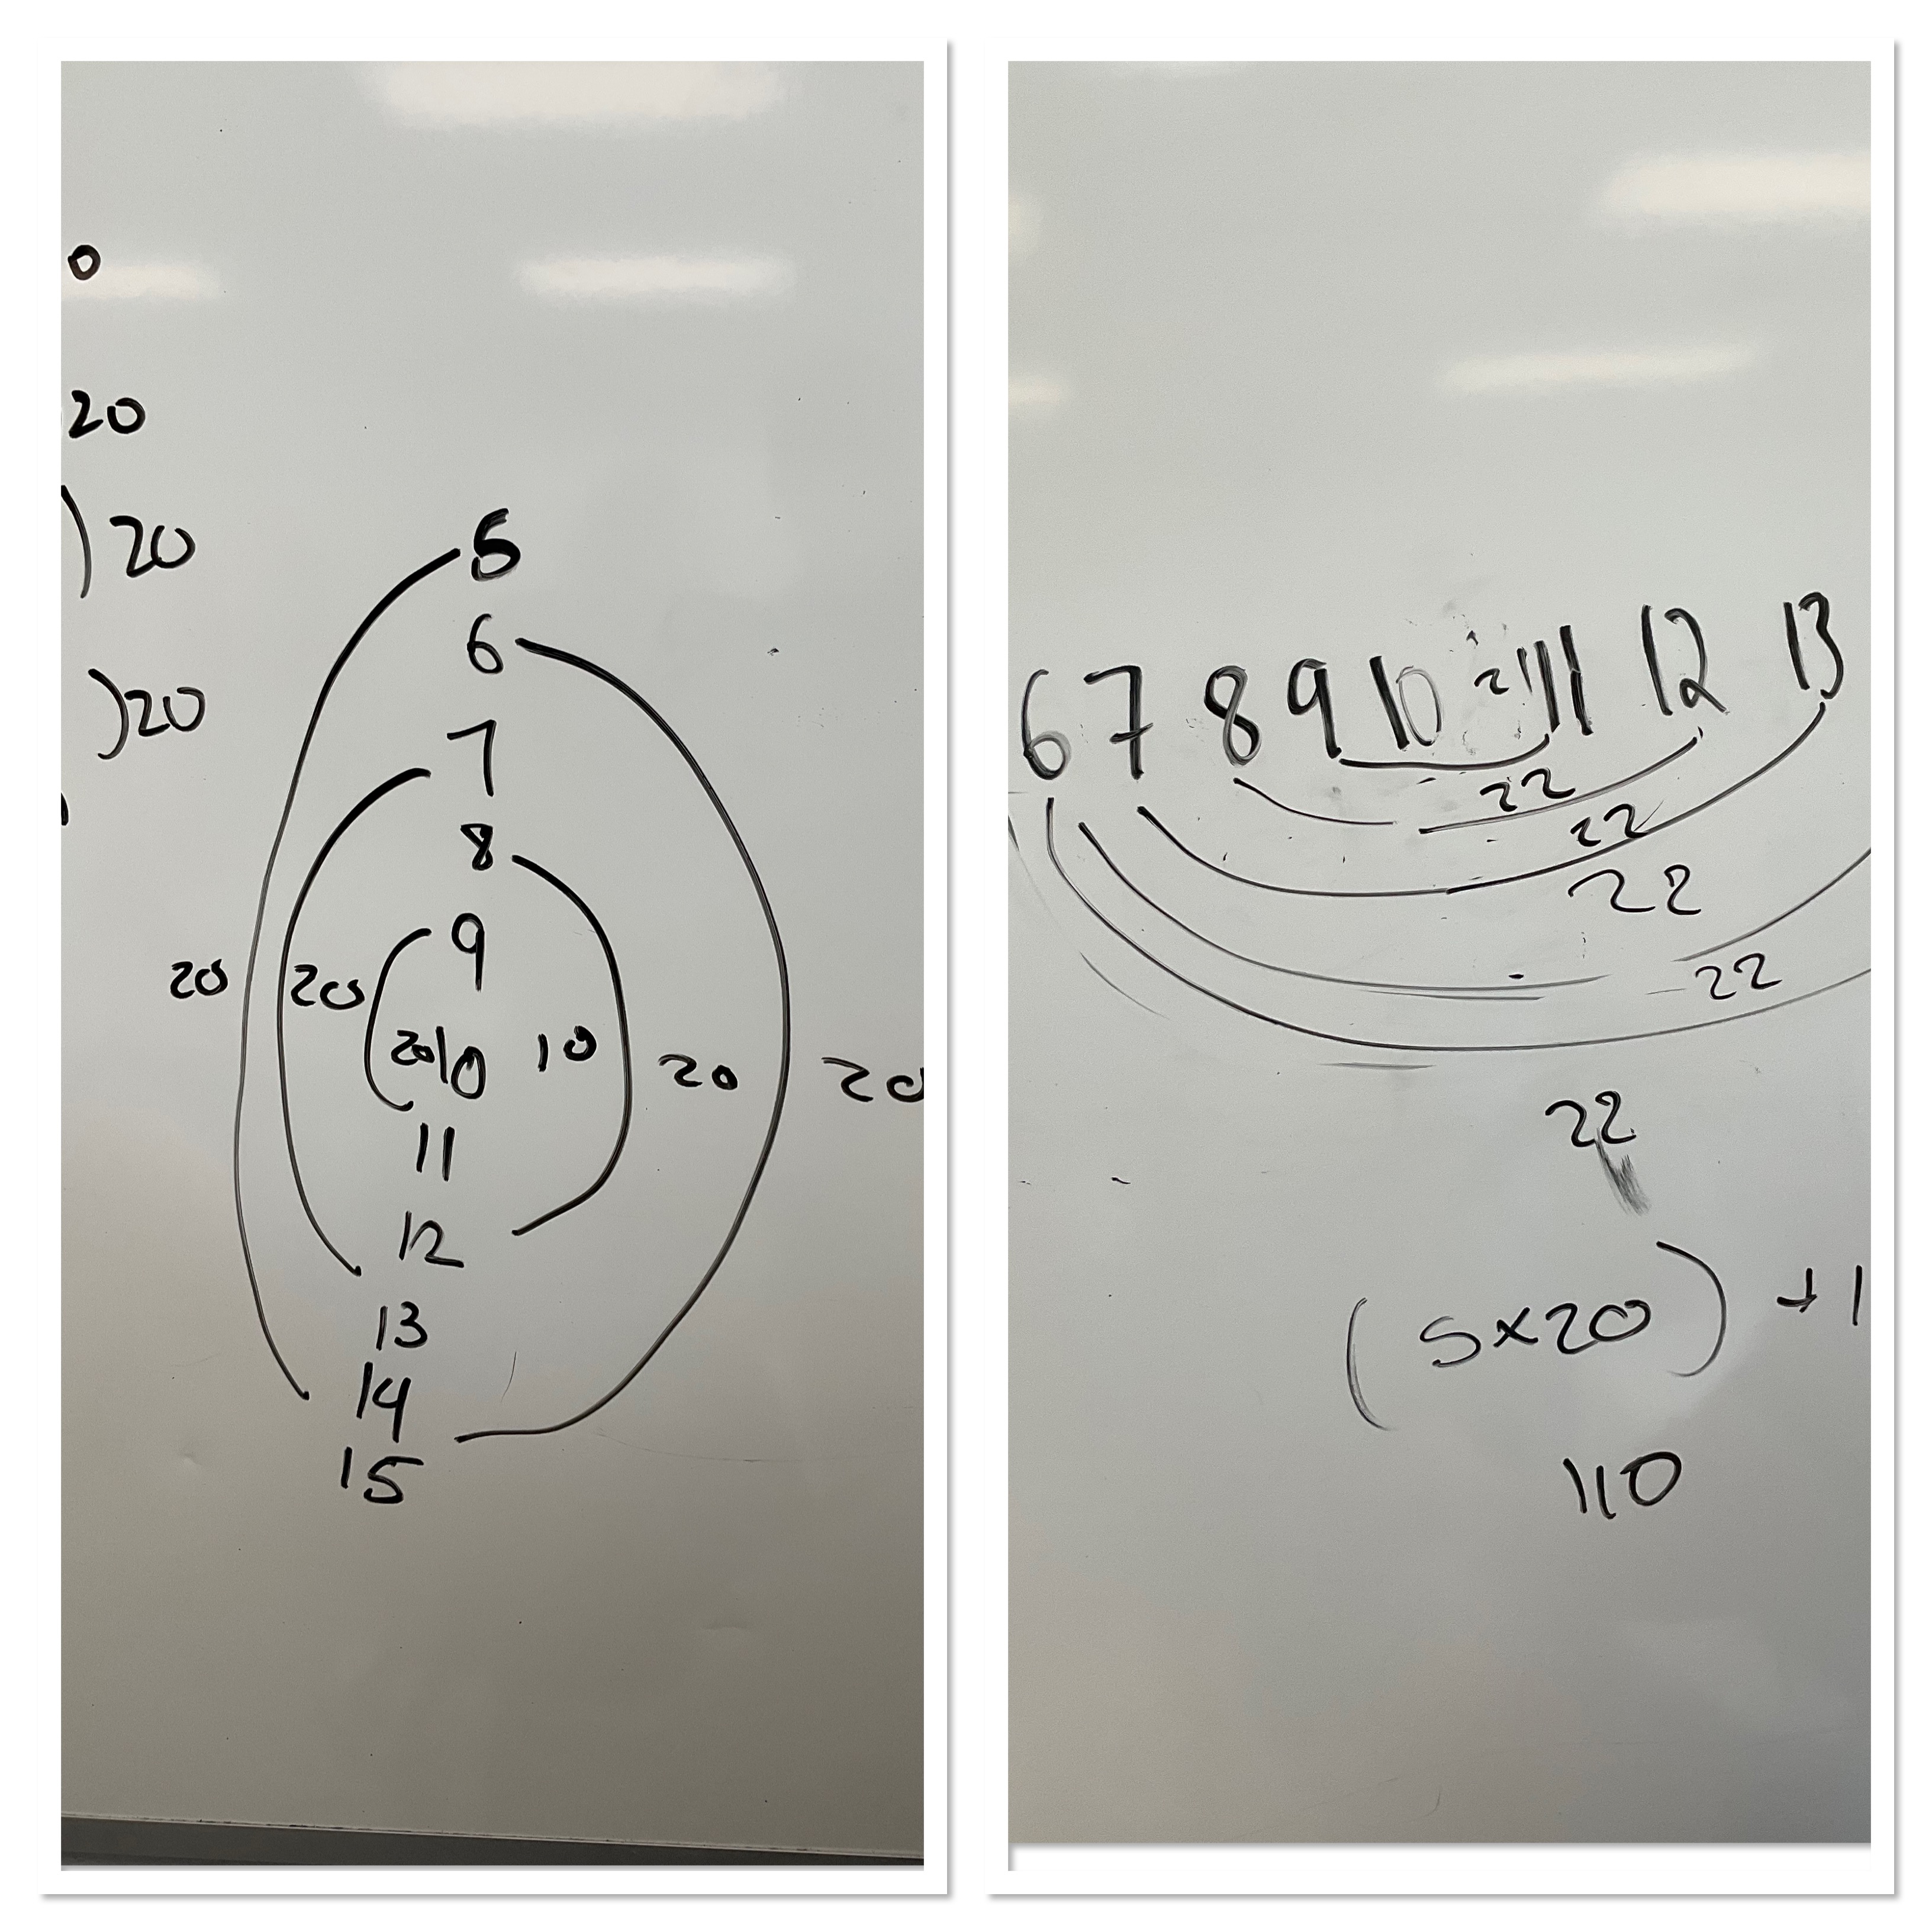
This group got right into it. They grouped numbers to make tens, they used the 1+9, then the 2+8 etc. The 5 is in the middle and dealt with at the end. The 10 was already a 10 so they didn’t change it. They knew that adding 1-10 made 55, so they then looked at adding 11 to 20 and they knew that it’d be 55 (because you are adding 1×10 again) but you’re also adding 10 more 10s, so they generalized that you’d add another 100 on top of the 55 for each group of 10 that we go up. I had not anticipated this approach at all!
Some groups added first and last, then second and second last and made groups of 11, then realized that there were 5 groups needed.
We tried some more challenges like adding 5+6+…+15, or adding 6+7+8+…+16. This was different because the “a” value changed, but not much else.
We started to see patterns like adding the first and last terms is important, then you need (n/2) groups of that sum.
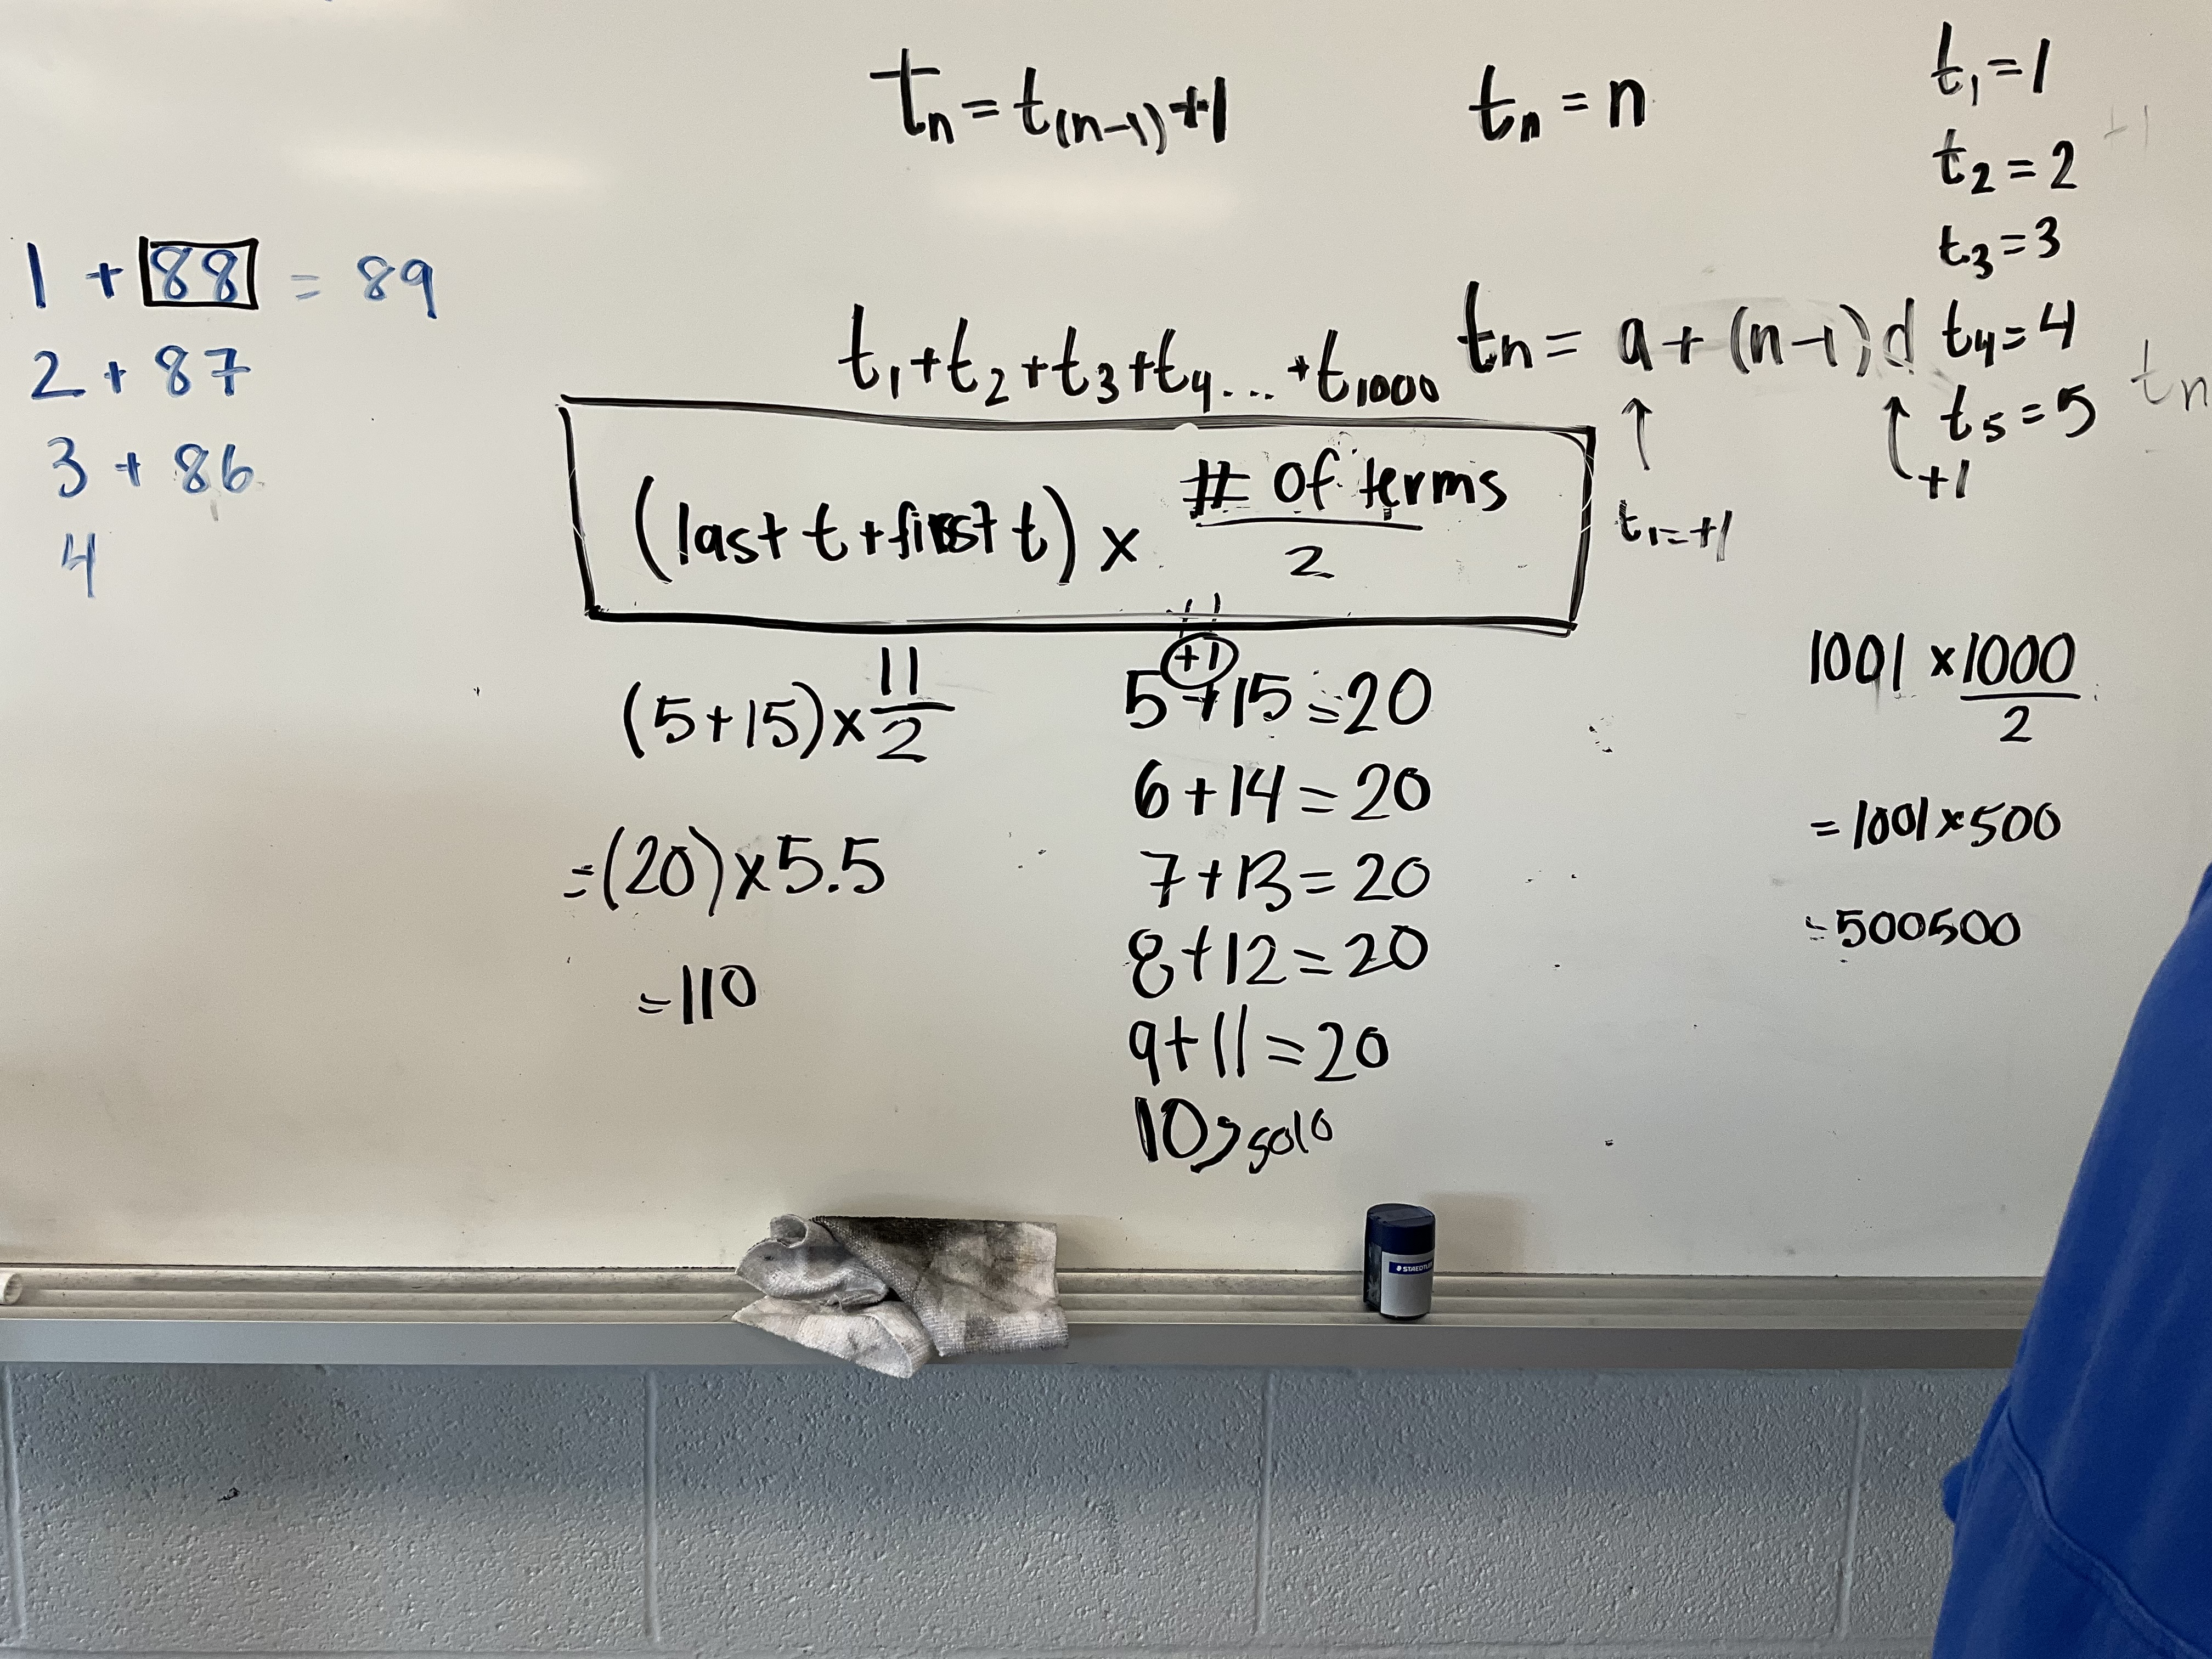
We tried this with different sequences, with different common differences next, to show that our conjectures were still true.
By the end of class we were comfortable with arithmetic series, and had developed a few working formulae.
Fibonacci Numbers in Plants
In grade 11 we watched these videos and then explored the Fibonacci sequence. We drew spirals, and then explored how Fibonacci numbers are found in unusual places. It’s even hiding in Pascal’s/Kayaam’s/Yang Hui’s triangle.
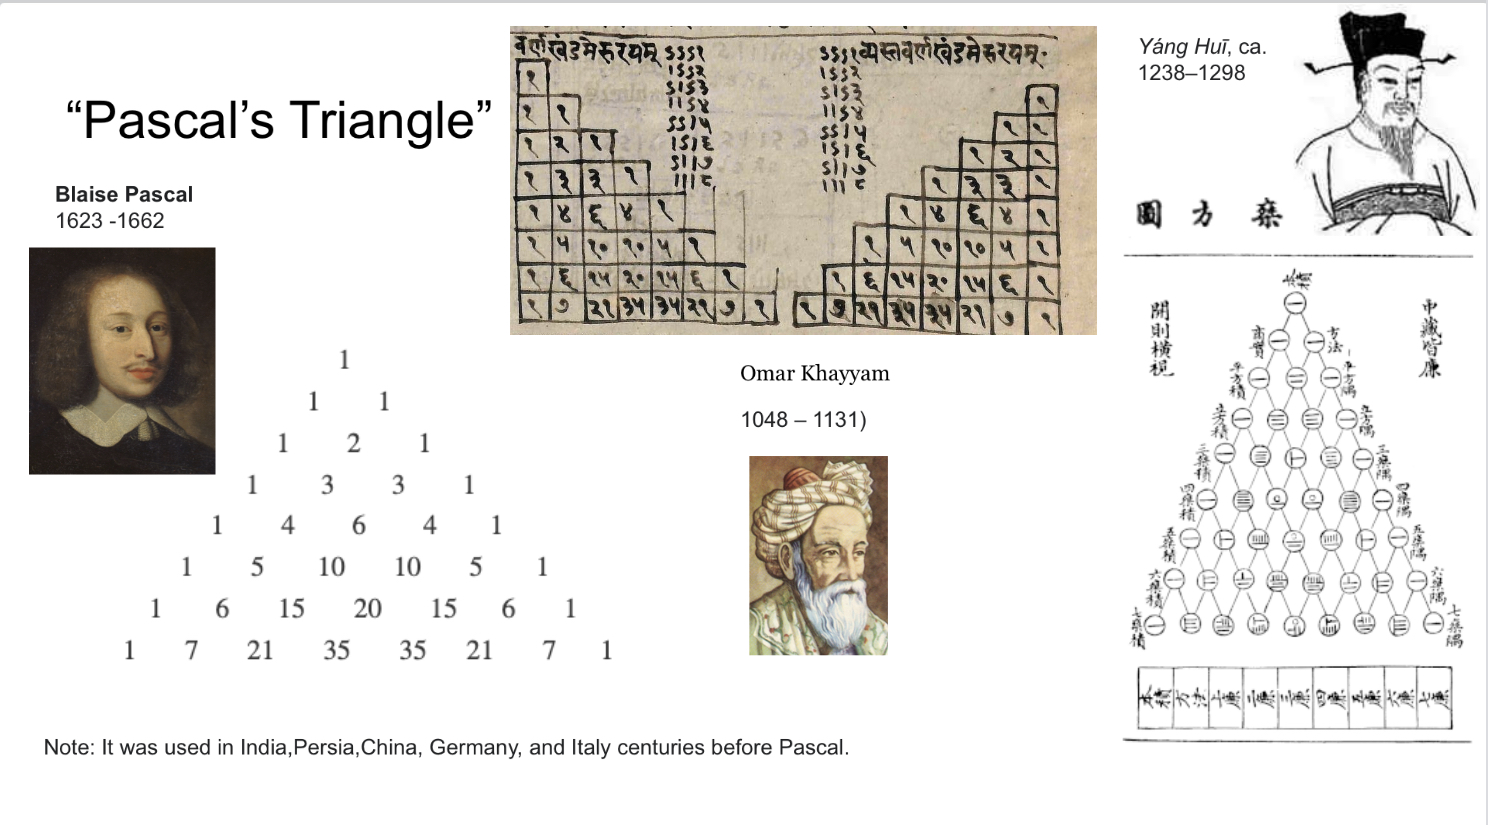
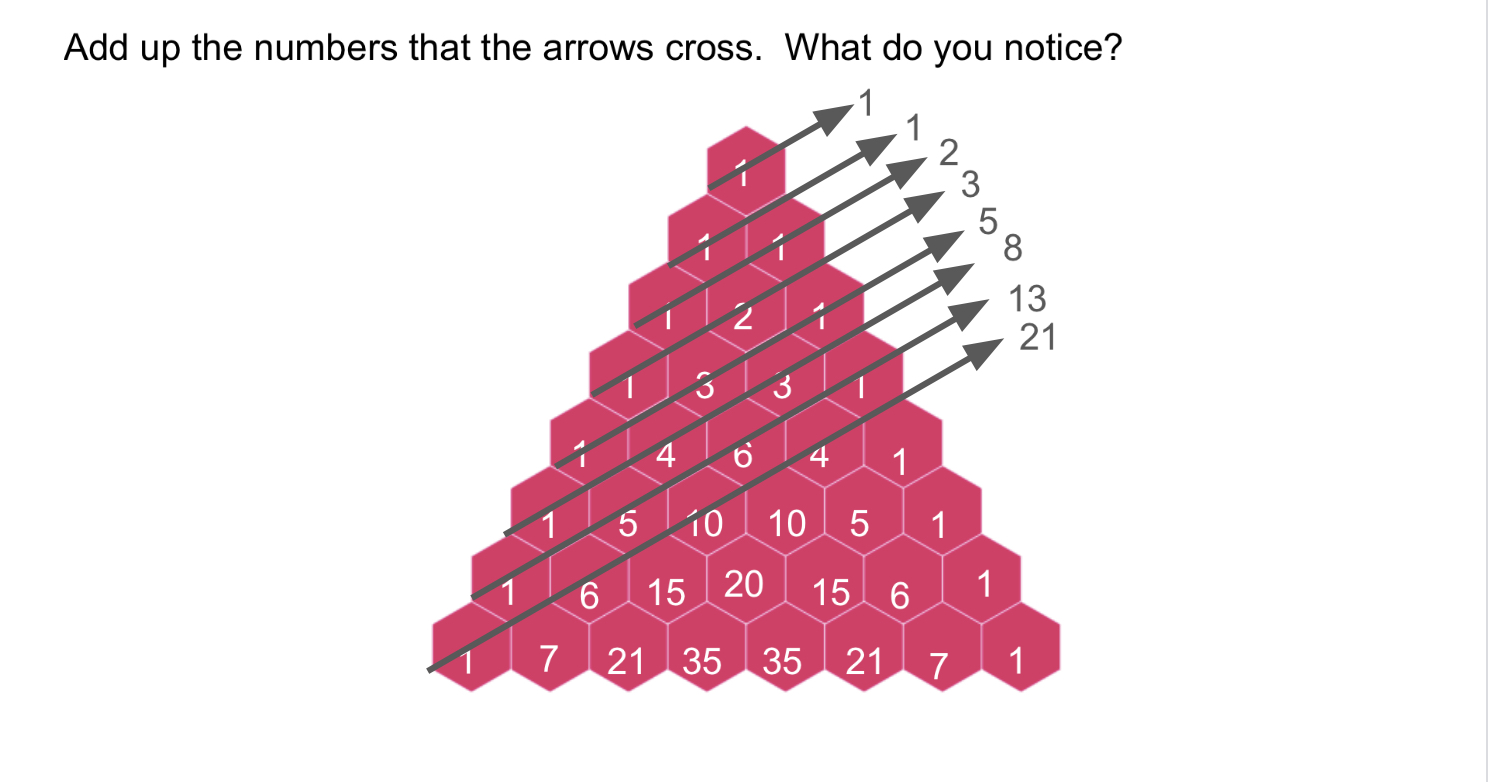
Next we explored some other benefits of this triangle, and how it can help us with binomial expansion.
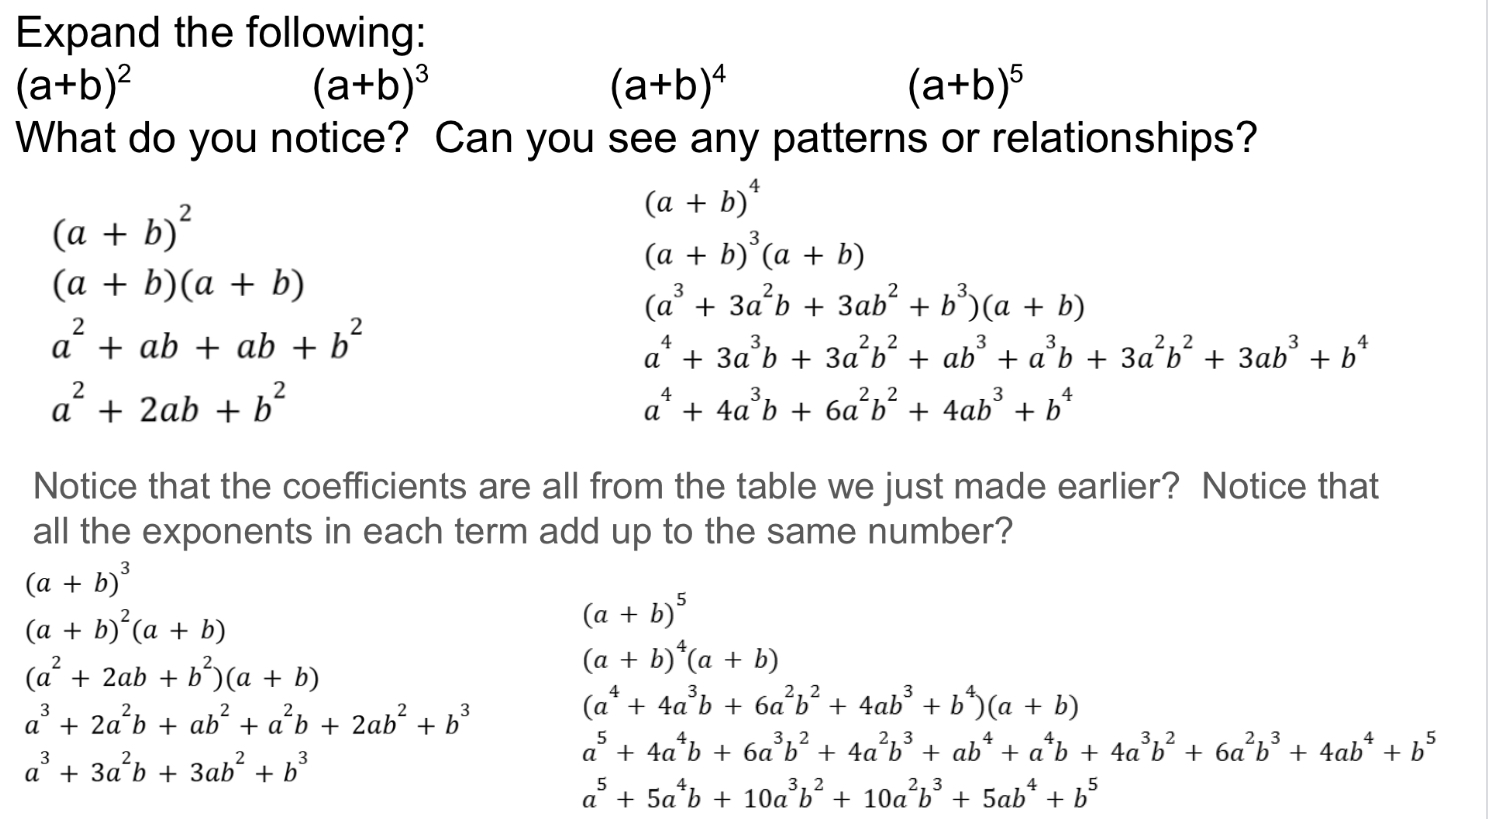
They don’t know it yet, but this is a foundational skill for math next year!
Distance Time Graphs
Grade 9s are working on various relationships, and today we looked at slopes on a distance time graph and how that relates to speed. There’s a fantastic game which I enjoy watching students play on the big screen each year.
They click and drag on a stick figure and see what distance/time graph gets made. The goal is to match the given graph.
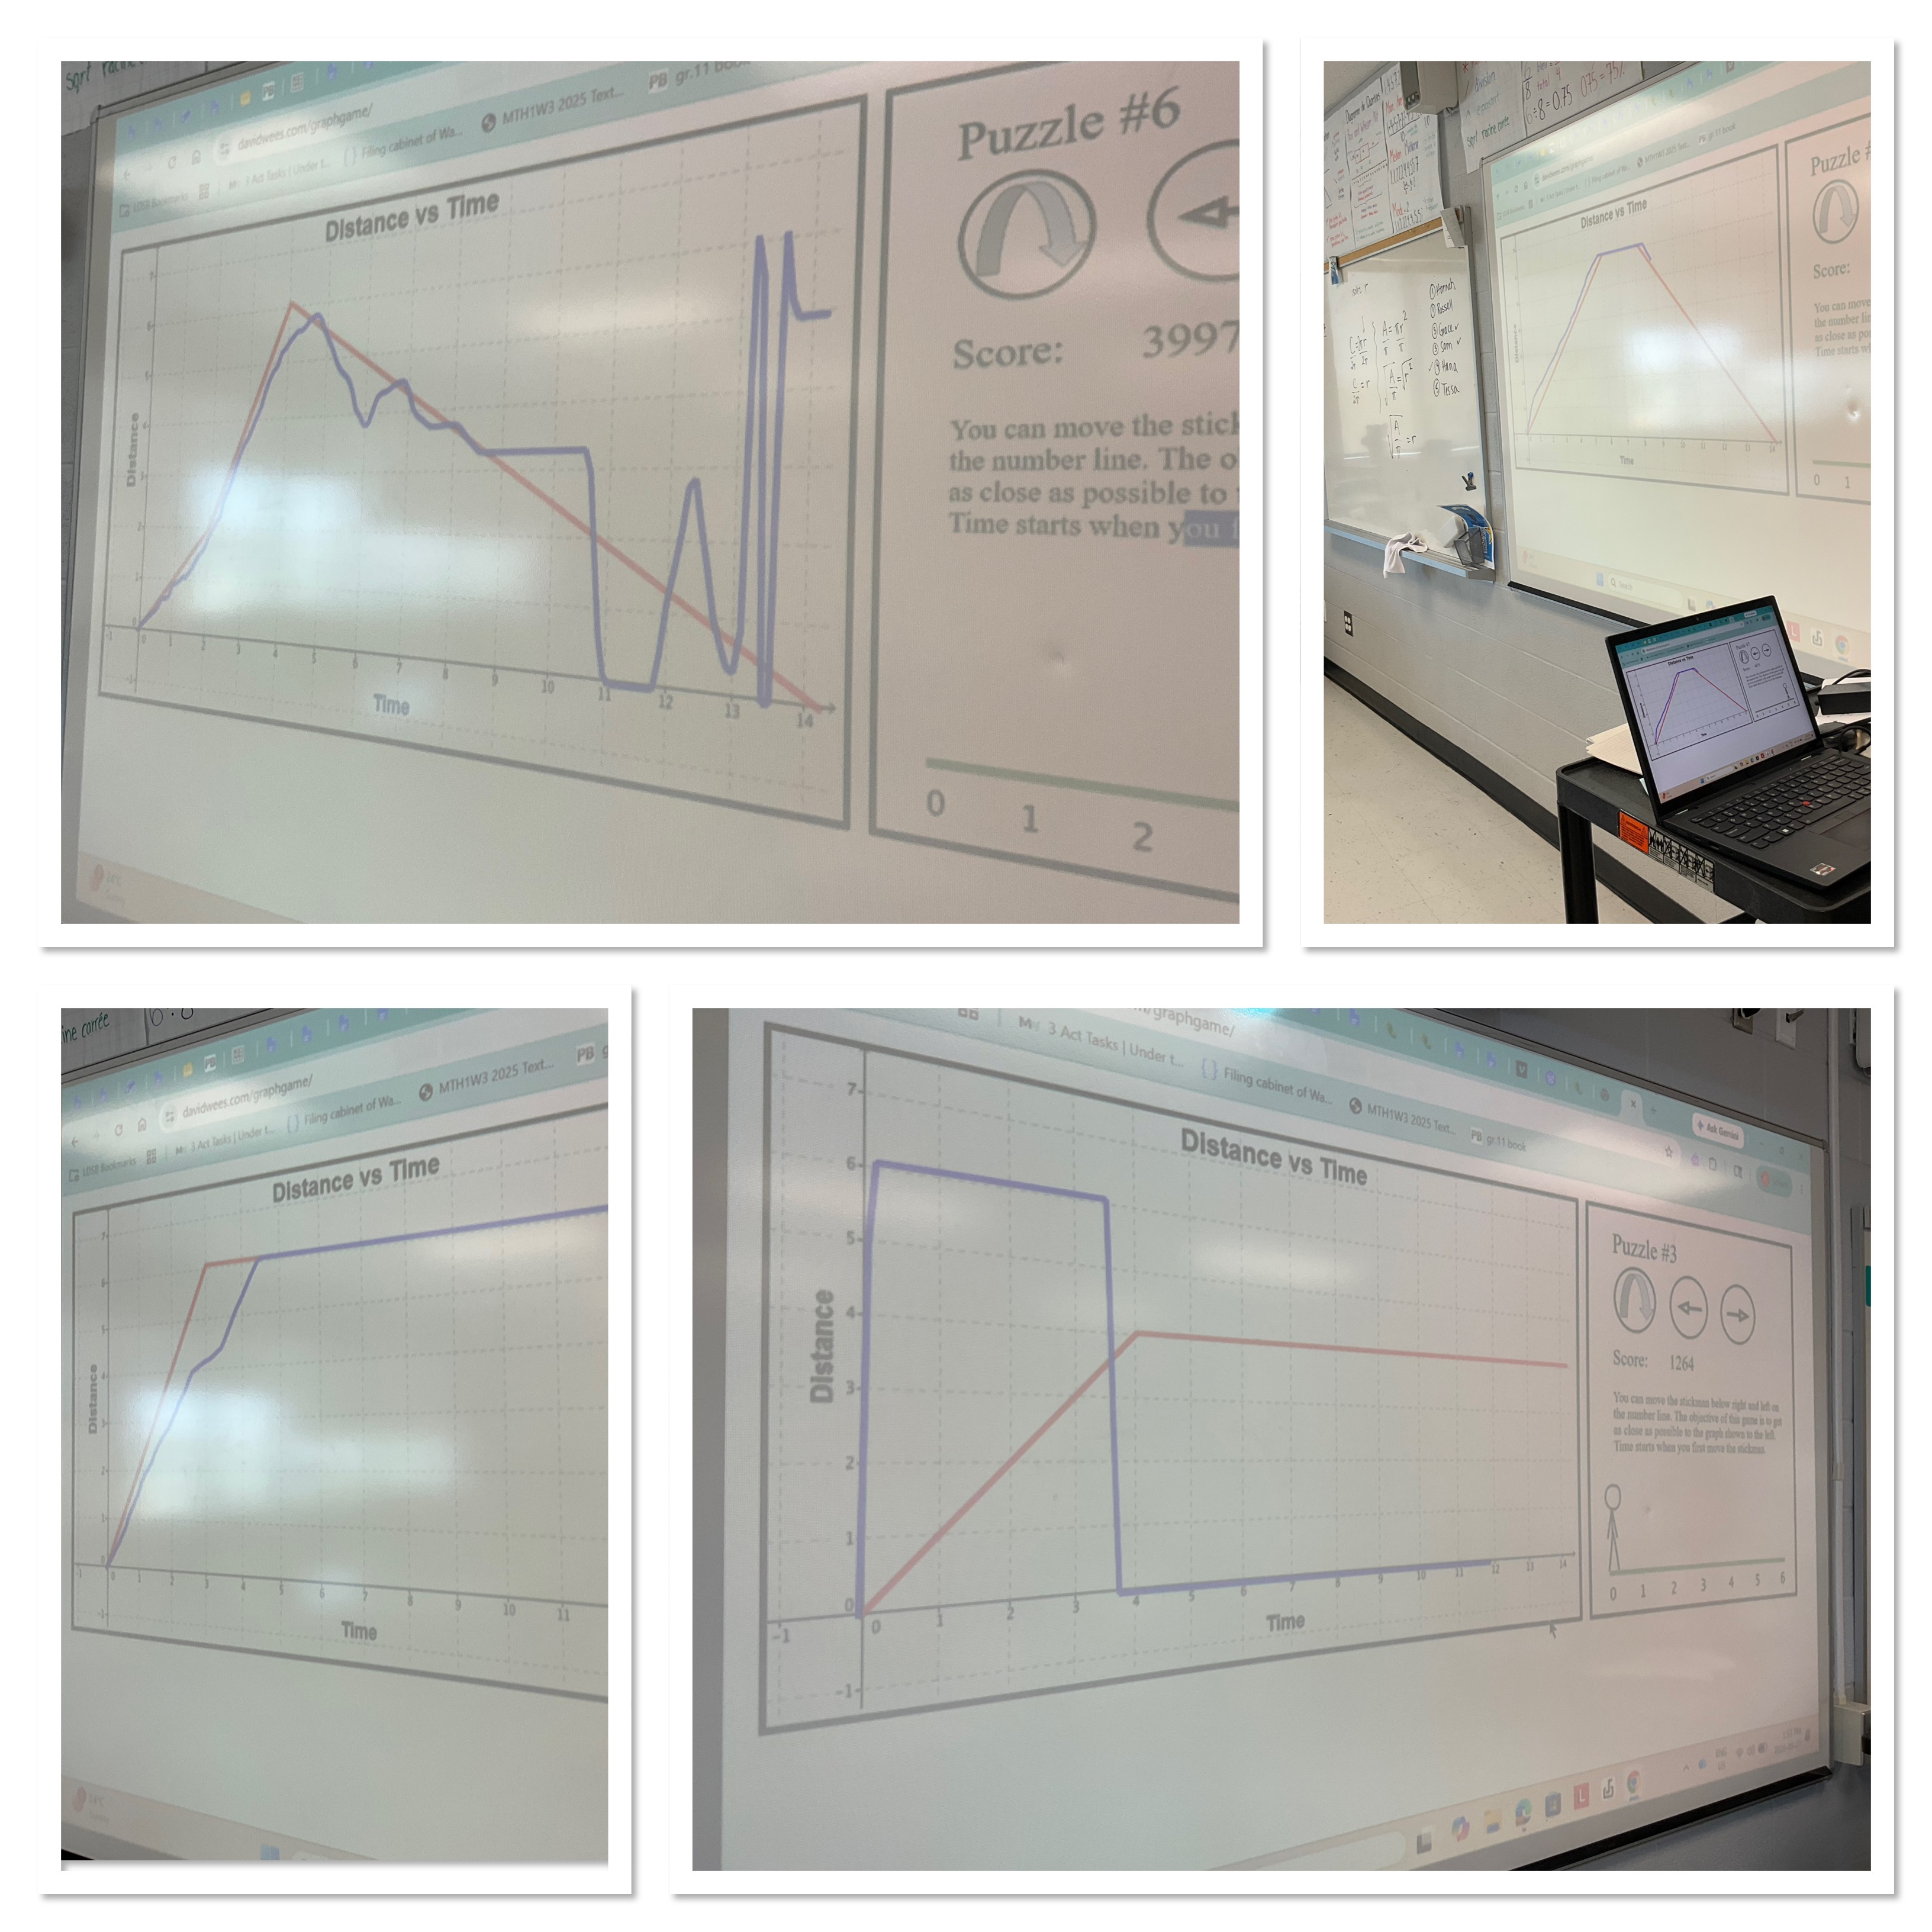
I asked students to be brave volunteers to either do a good job, or a really bad job at matching the graph. Sometimes allowing it to be done badly and have it be no big deal will encourage more people to come try. There are 12 different scenarios, and they can be replayed if students want to do some head to head competition.
Before each attempt the class puts into words what the stick figure should do. They make a plan and end up saying things like, “one space per second” or “2 spaces per second” or “in 3 seconds it needs to end up at 3 spaces”. Some connected the positive and negative and zero slopes to the direction of movement. It’s a fun way to explore a concept before doing some more individual practice.
Exponent challenge question
At OAME I learned several new problems which I have been sharing with my classes, colleagues, and friends. One that’s been particularly fun with grade 9s has been an exponent question.
The question is: how many digits are in the answer to this question.
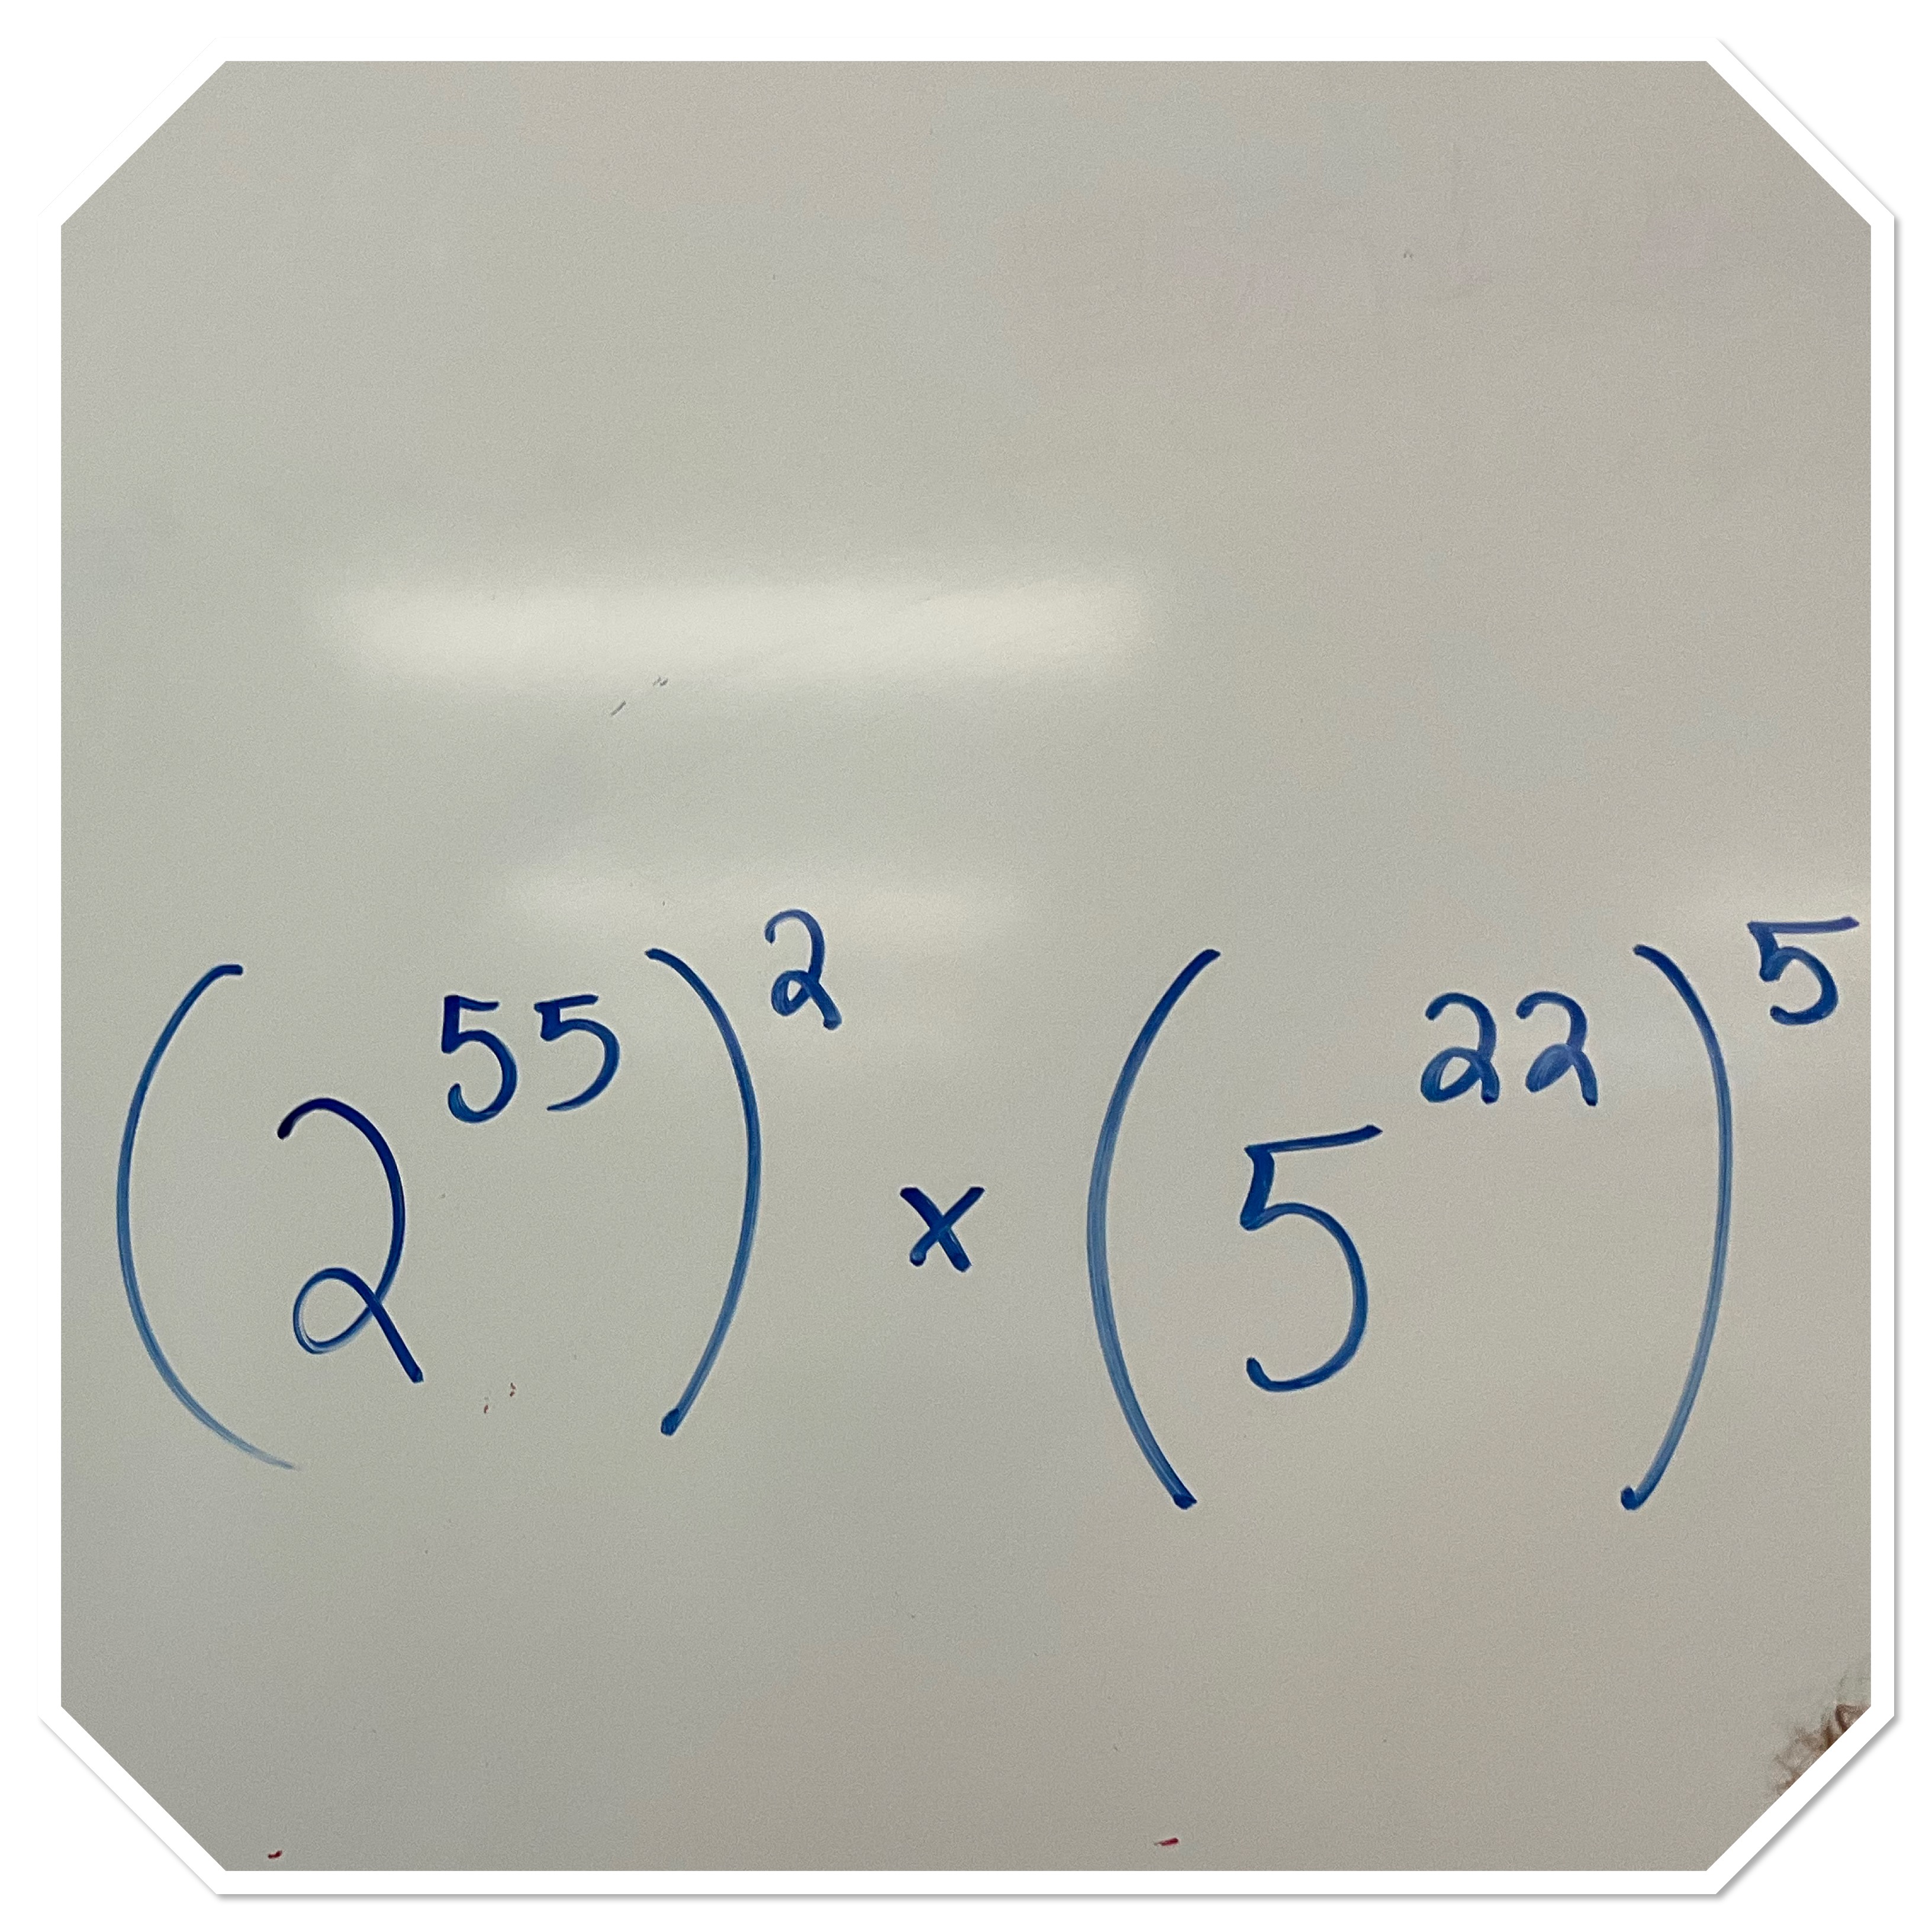
We quickly notice that calculators can’t handle this problem (phones can, so I’ll need to change it for the future). It’s fun to tackle problems that are too big for calculators, but our brains can figure them out.
This question illustrated so many misconceptions my students have about exponents. It was good to see them exposed so we could tackle them together and build more number sense.
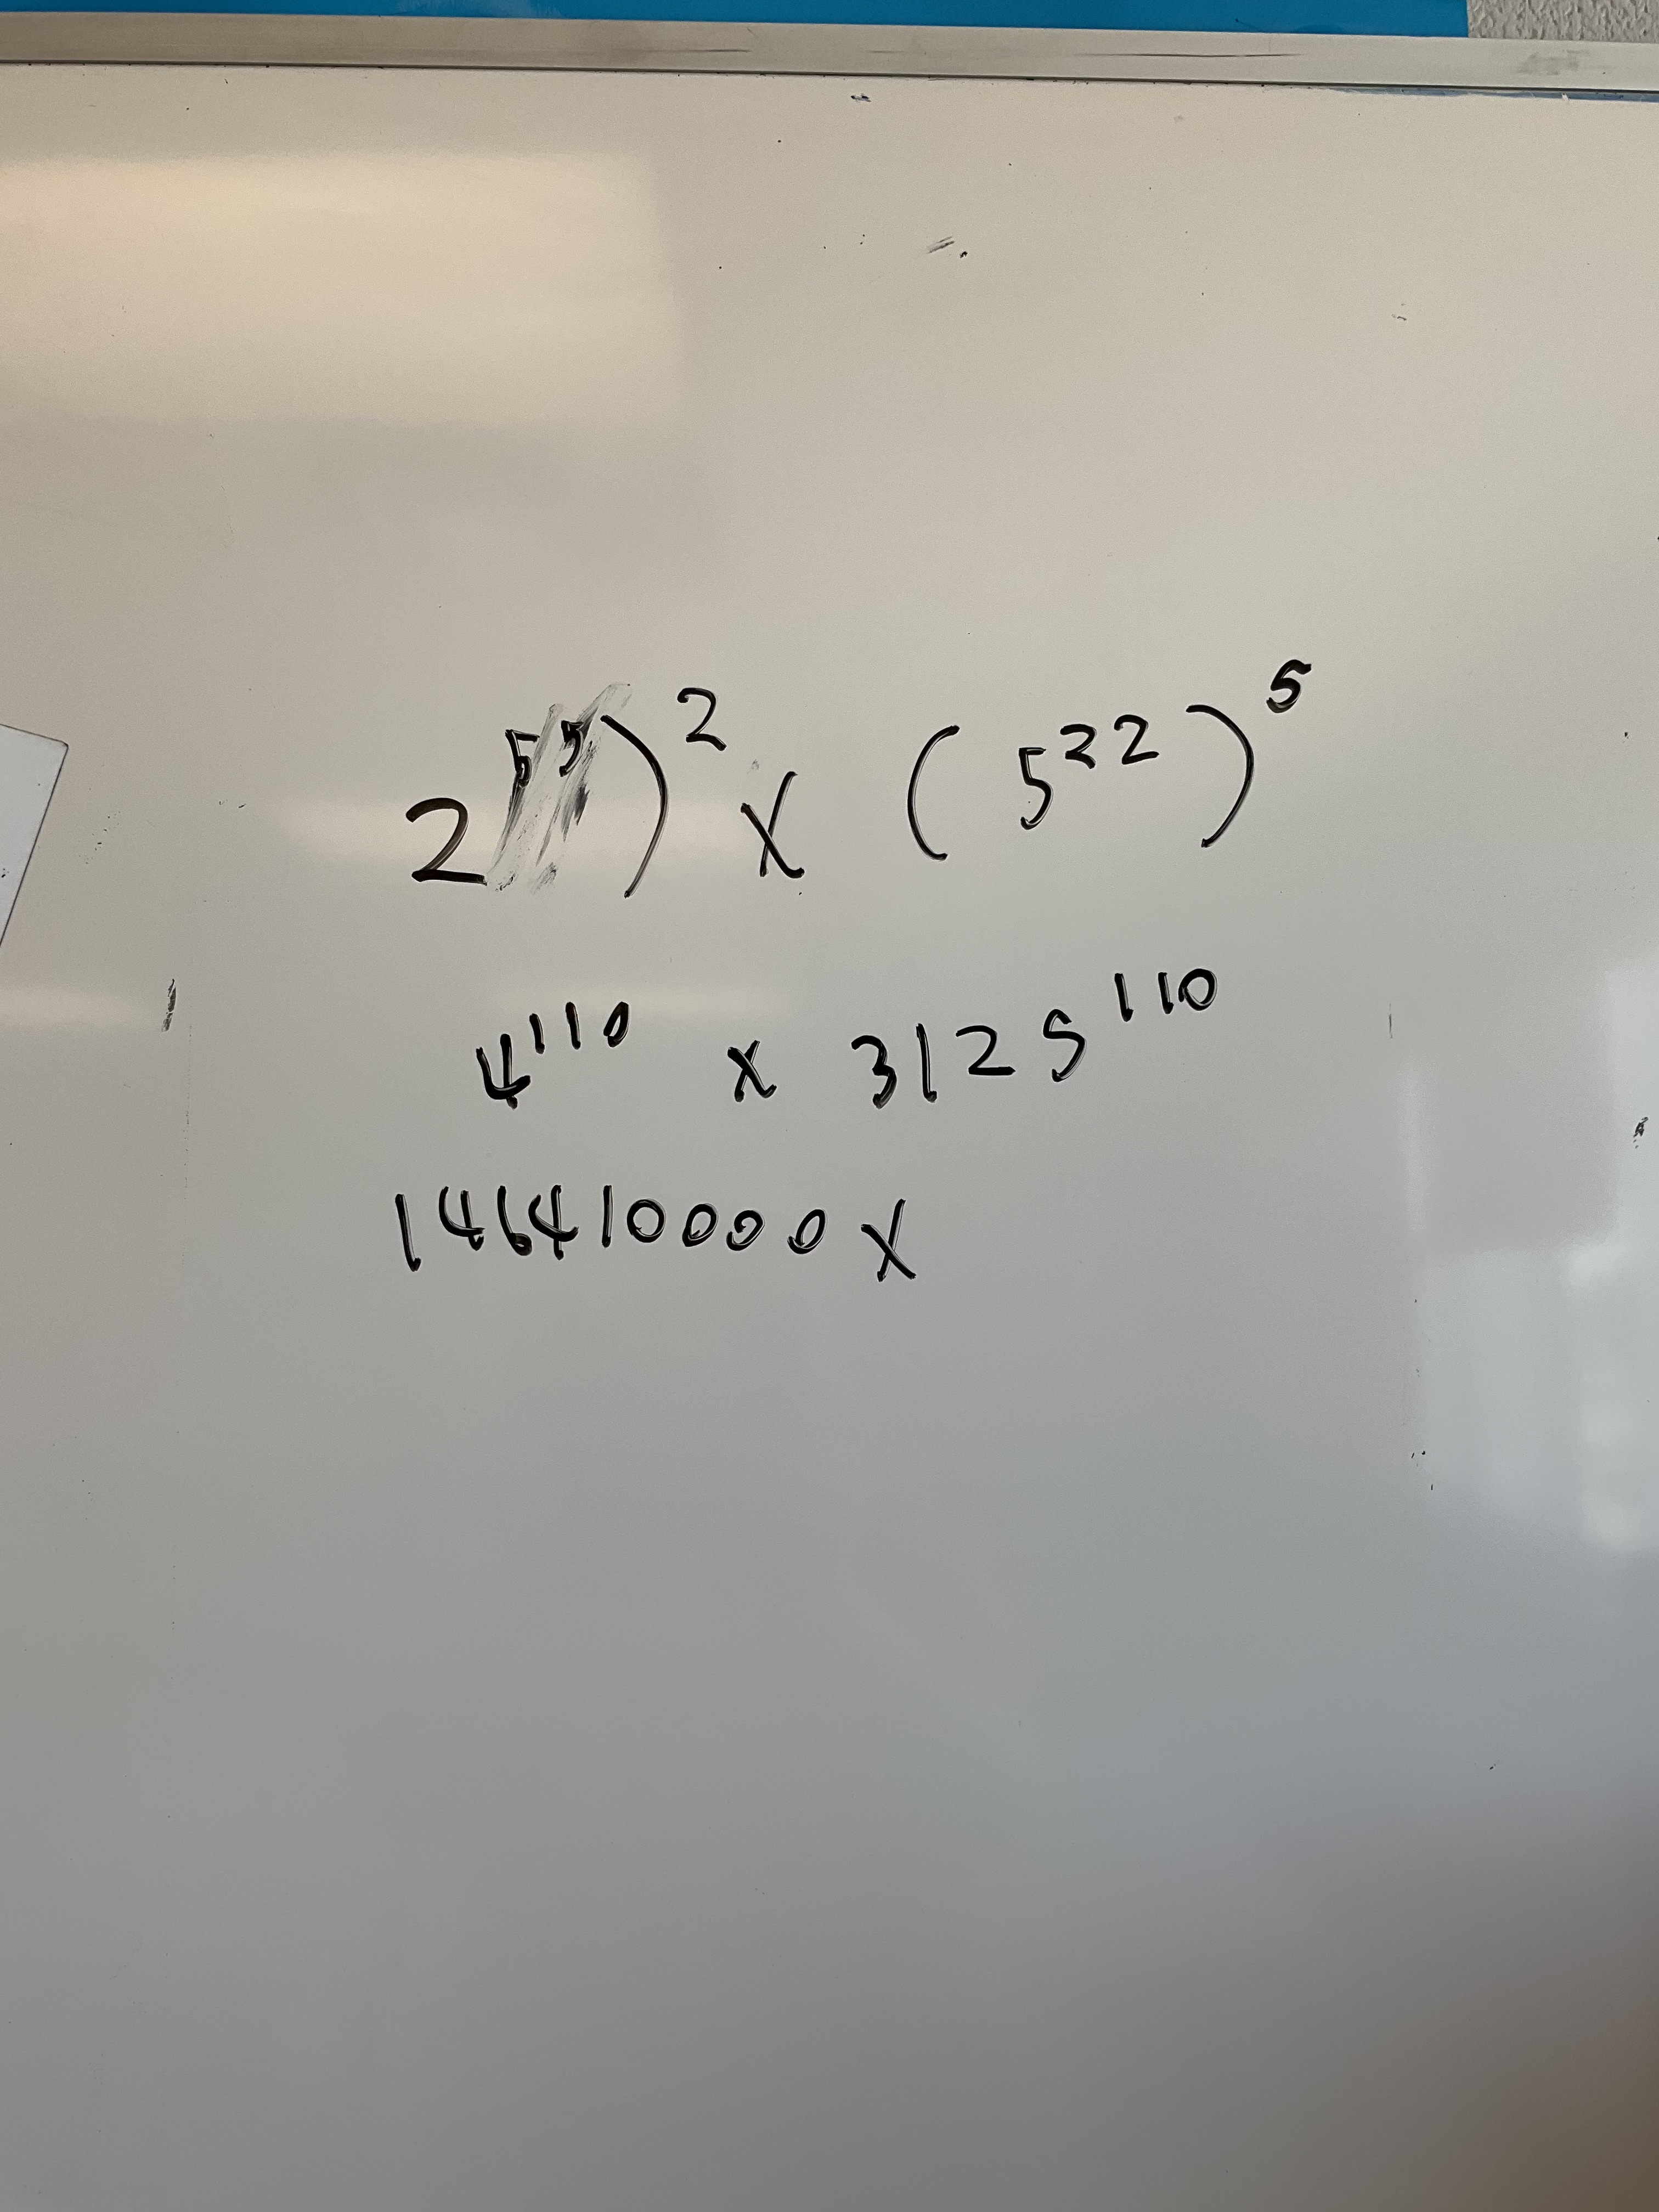
The first misconception was that the base and the exponent would both be changed when raised to a new power. This makes me think we’ve done too much practice with algebraic bases where we’ve ignored the base because it’s a letter. They knew that the power of a power multiplies the exponents together, but they missed the idea that it’s that many 2s or 5s being multiplied together.
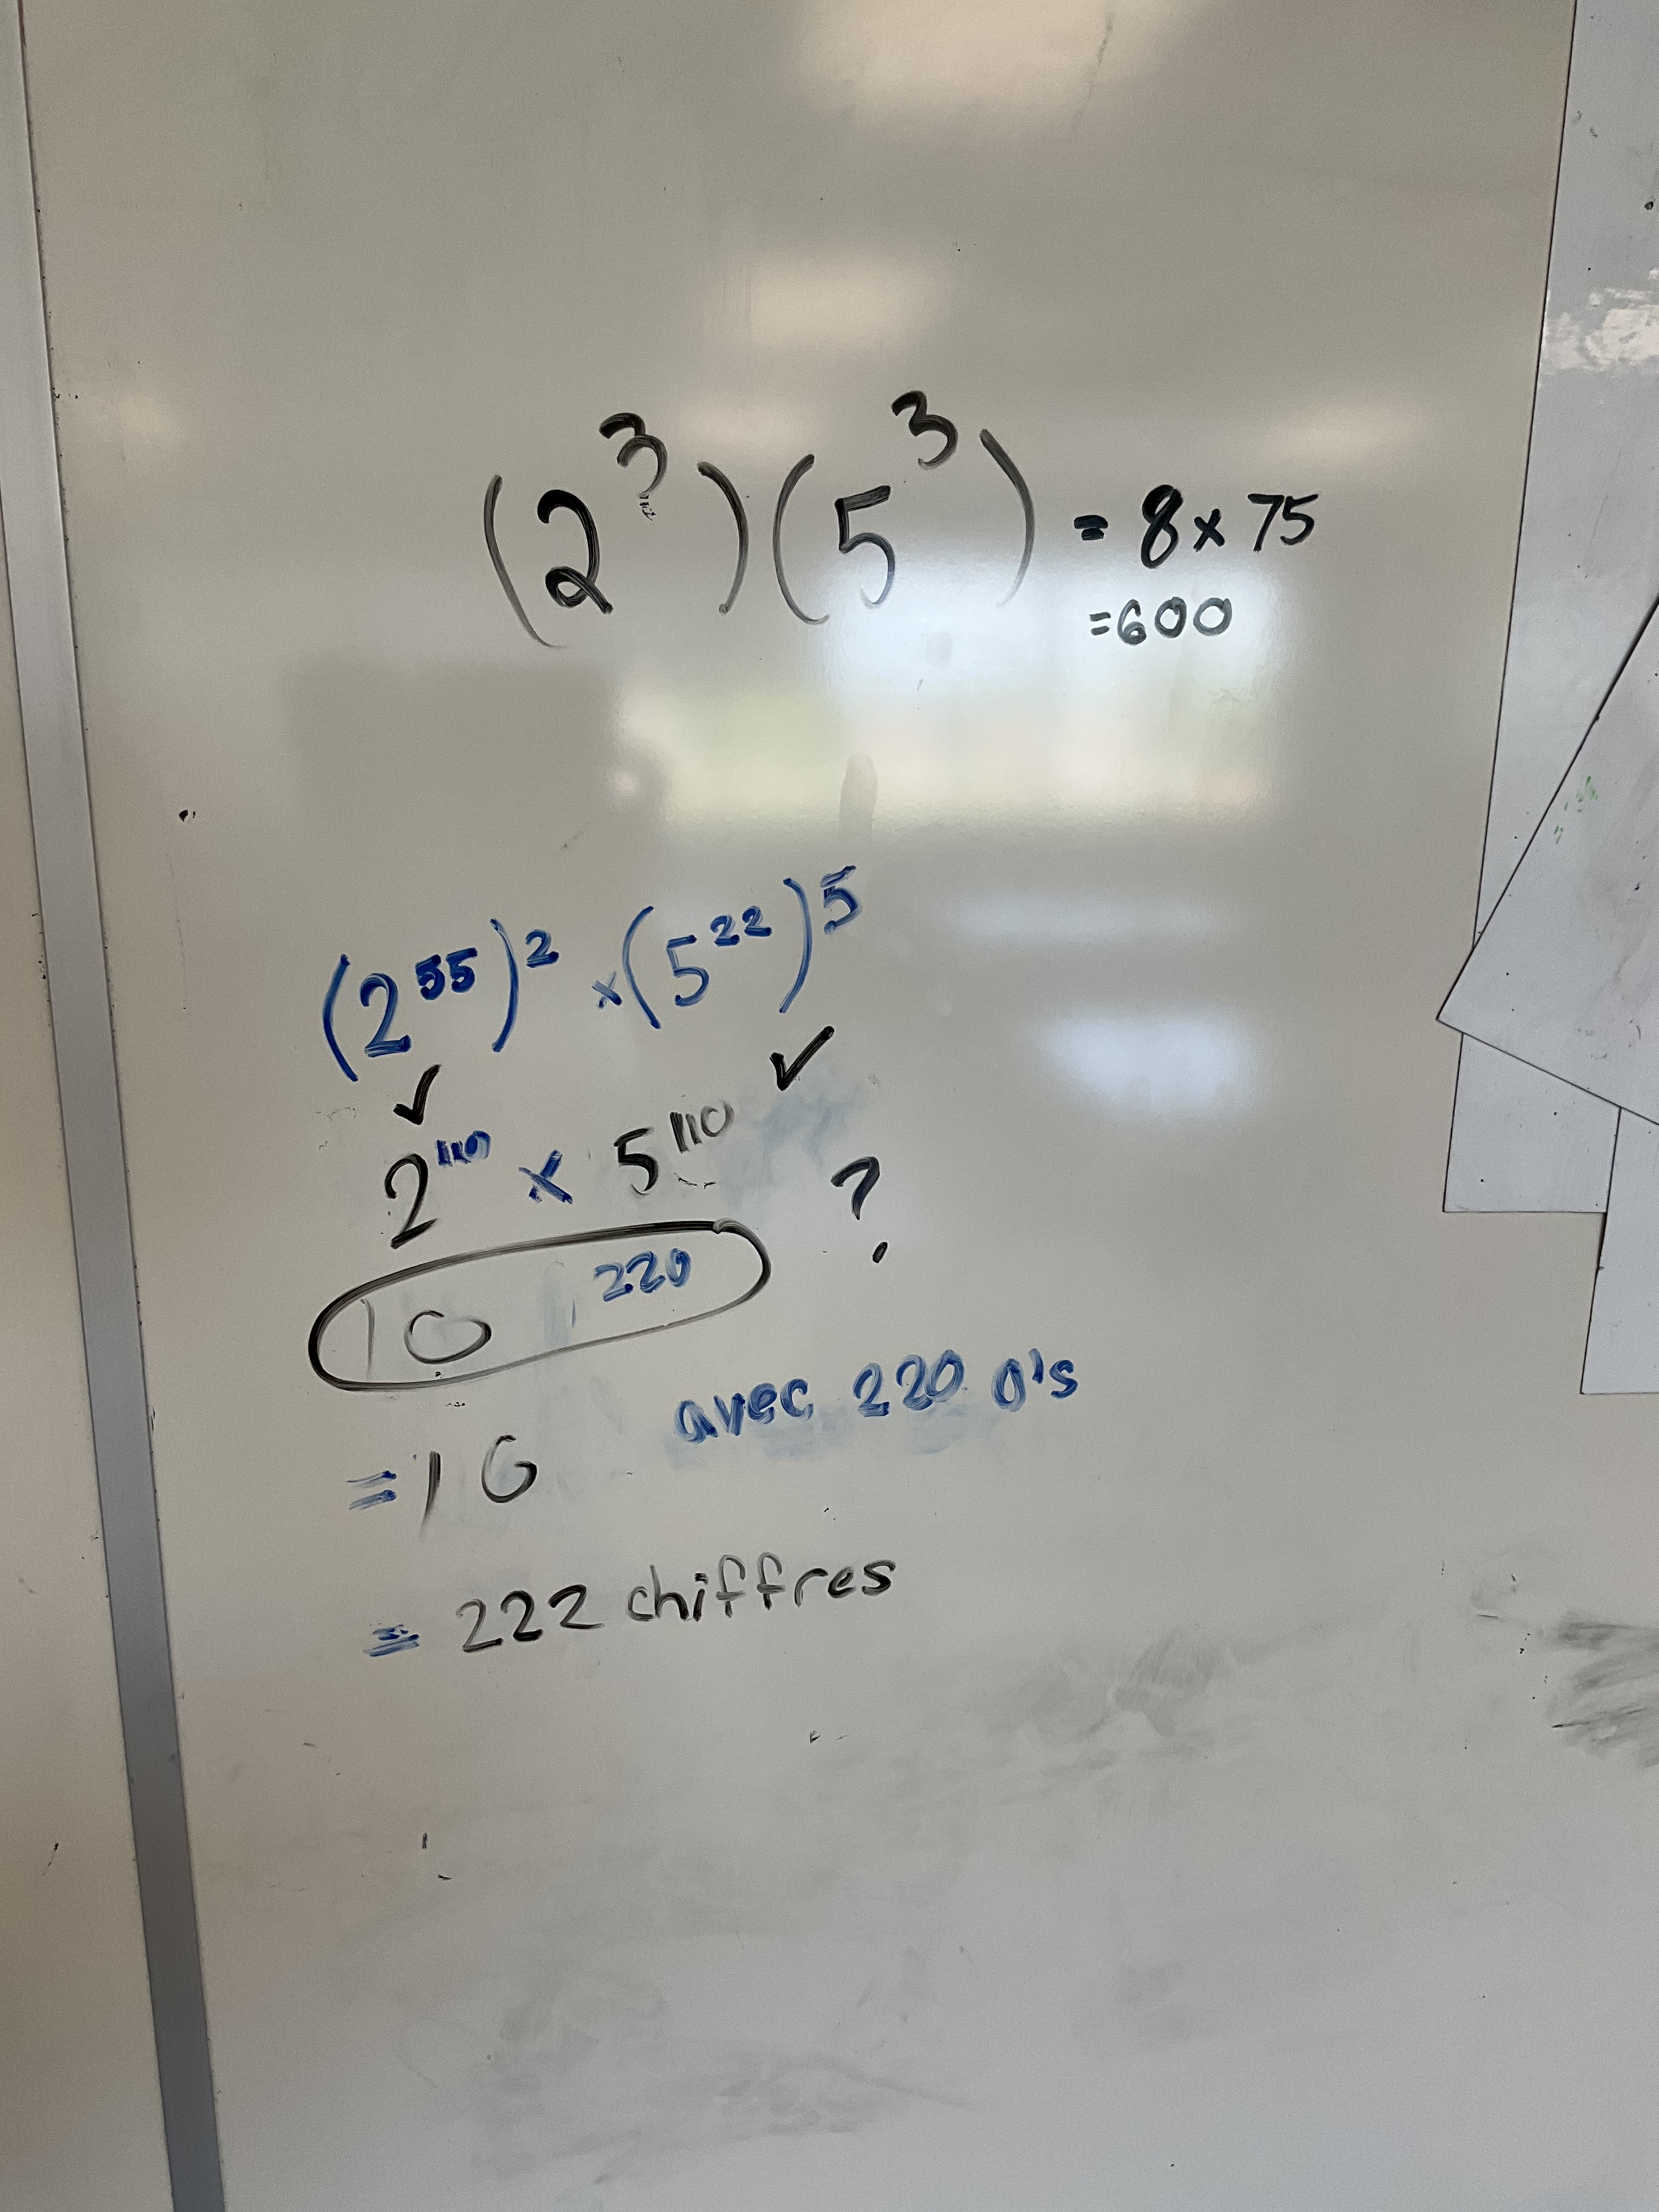
The next misconception is that when multiplying, we add the exponents and multiply the different bases. They are used to adding exponents together when the bases are the same, and maybe thought that you do that all the time. They are working on remembering rules, and not understanding the concepts.
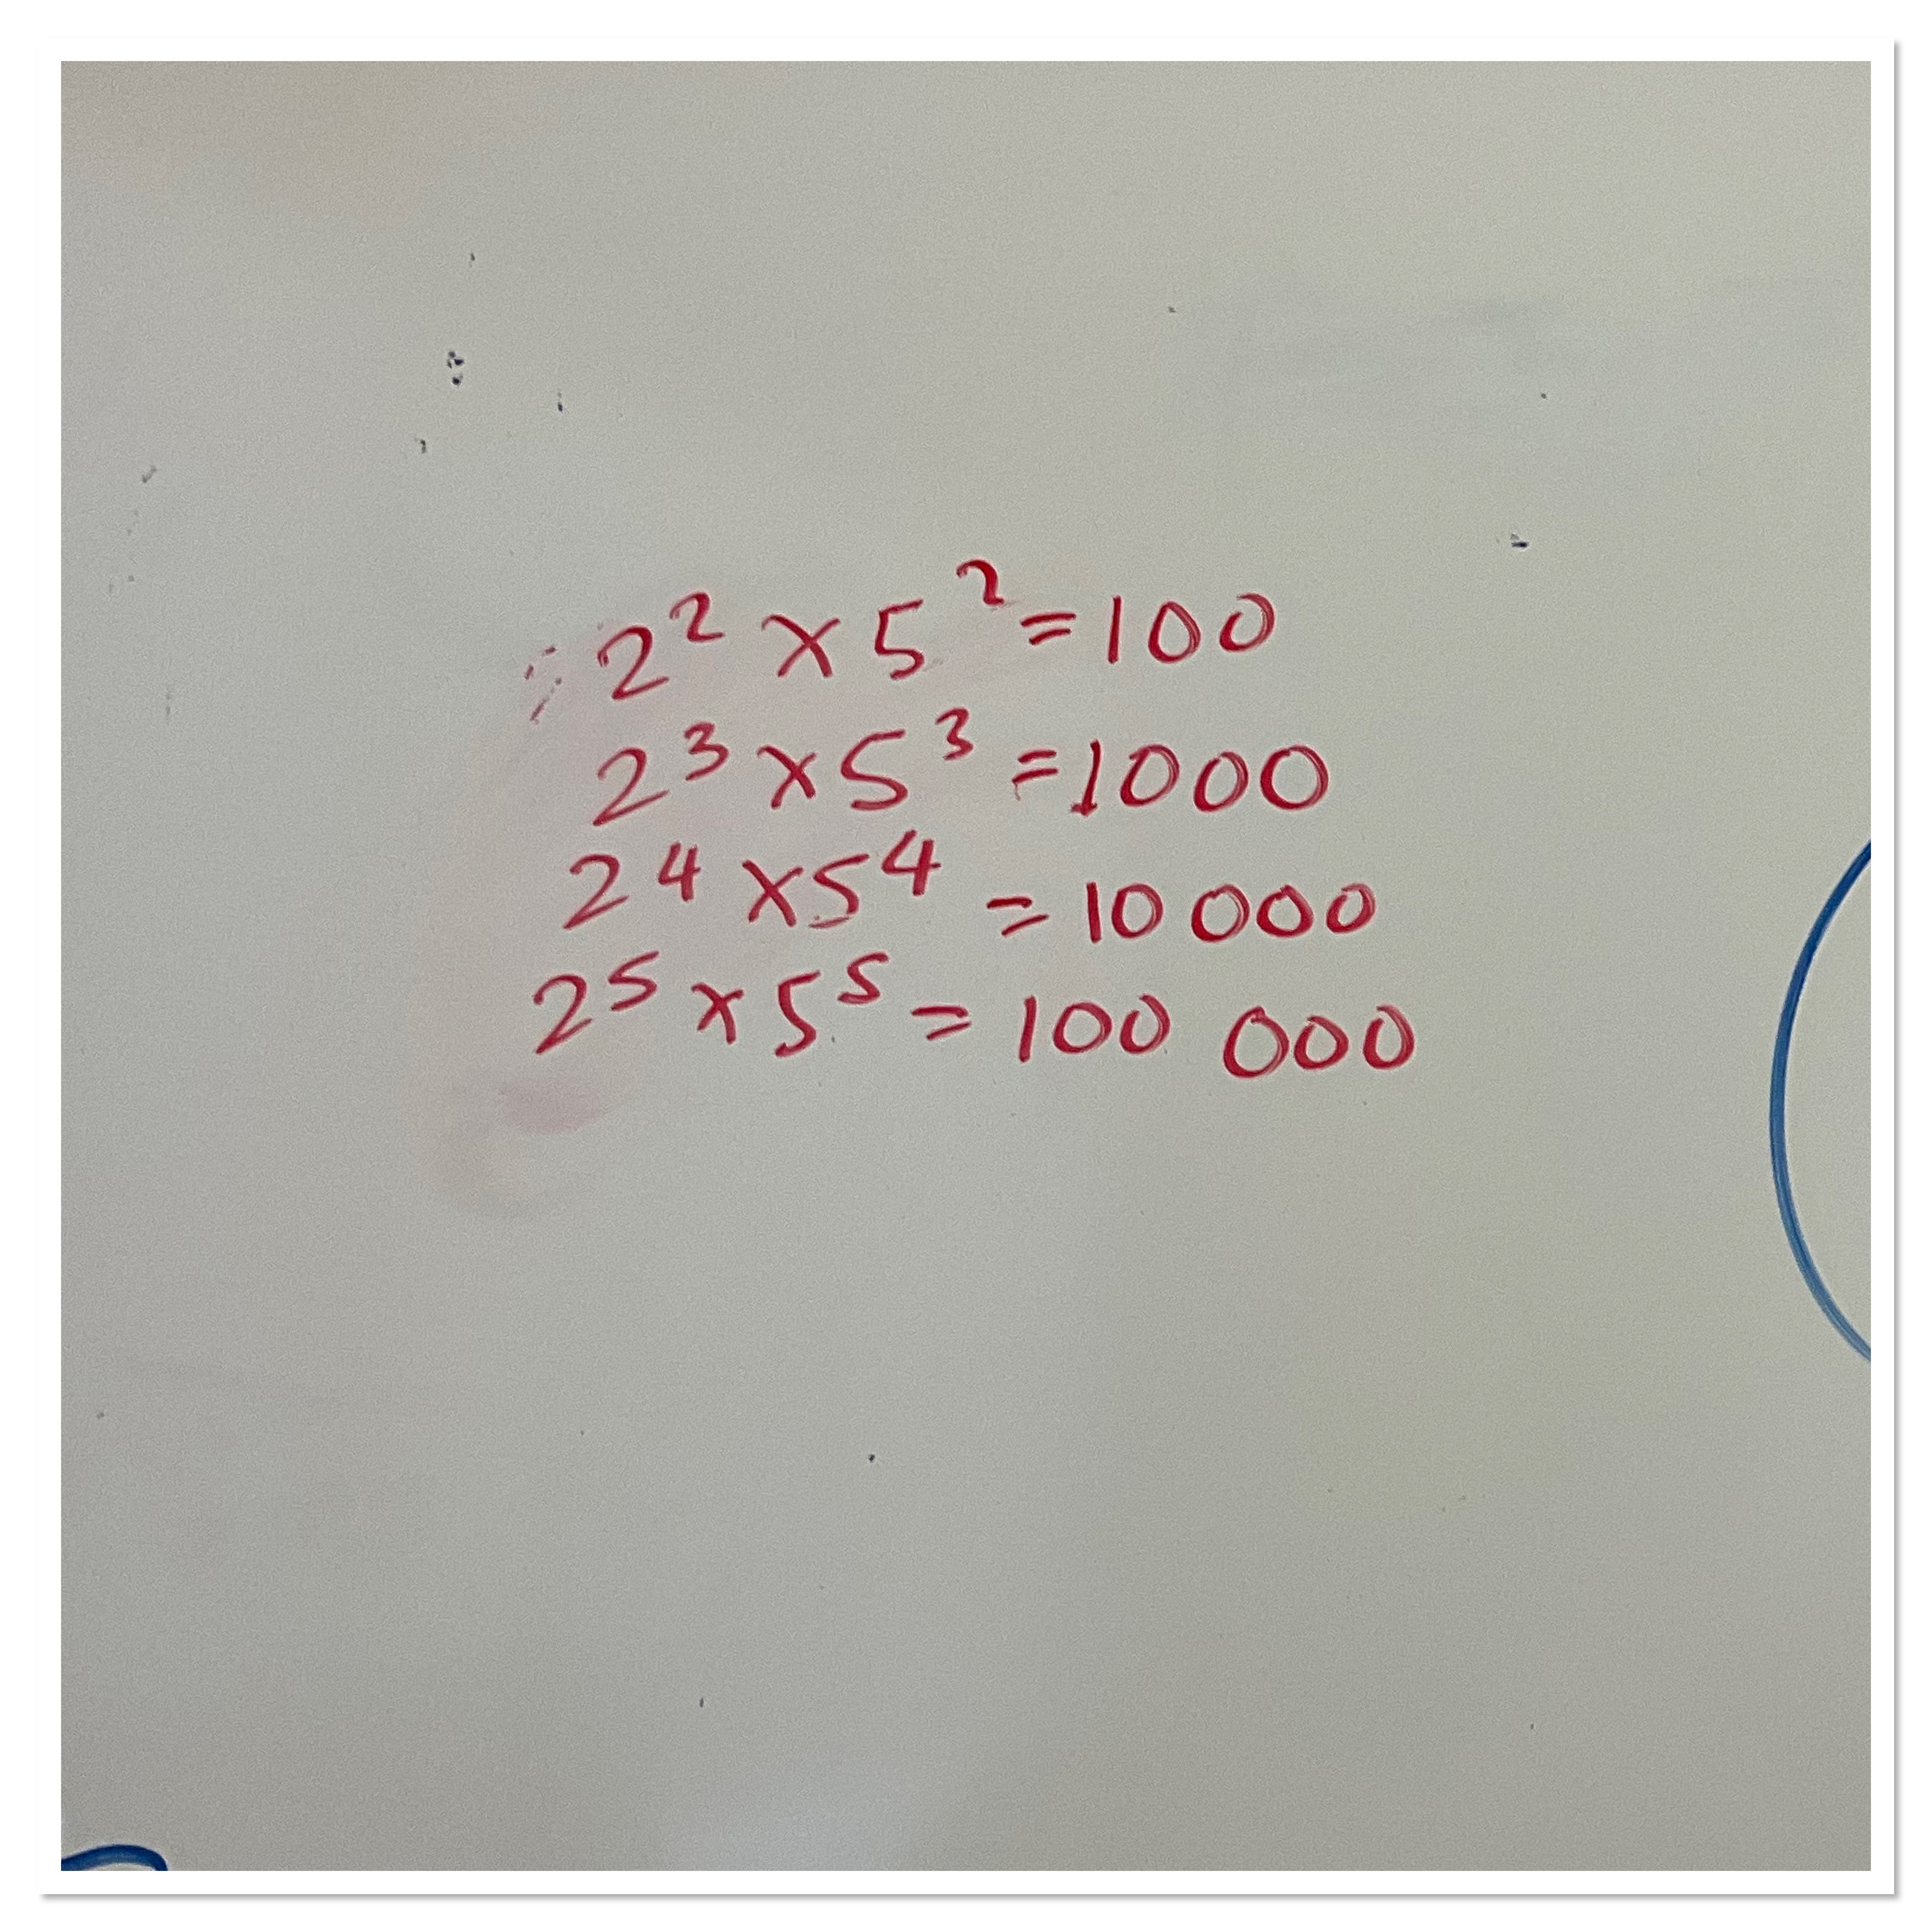
We brought it down to a smaller scale to see if that would help. We tried 2 squared x 5 squared etc,
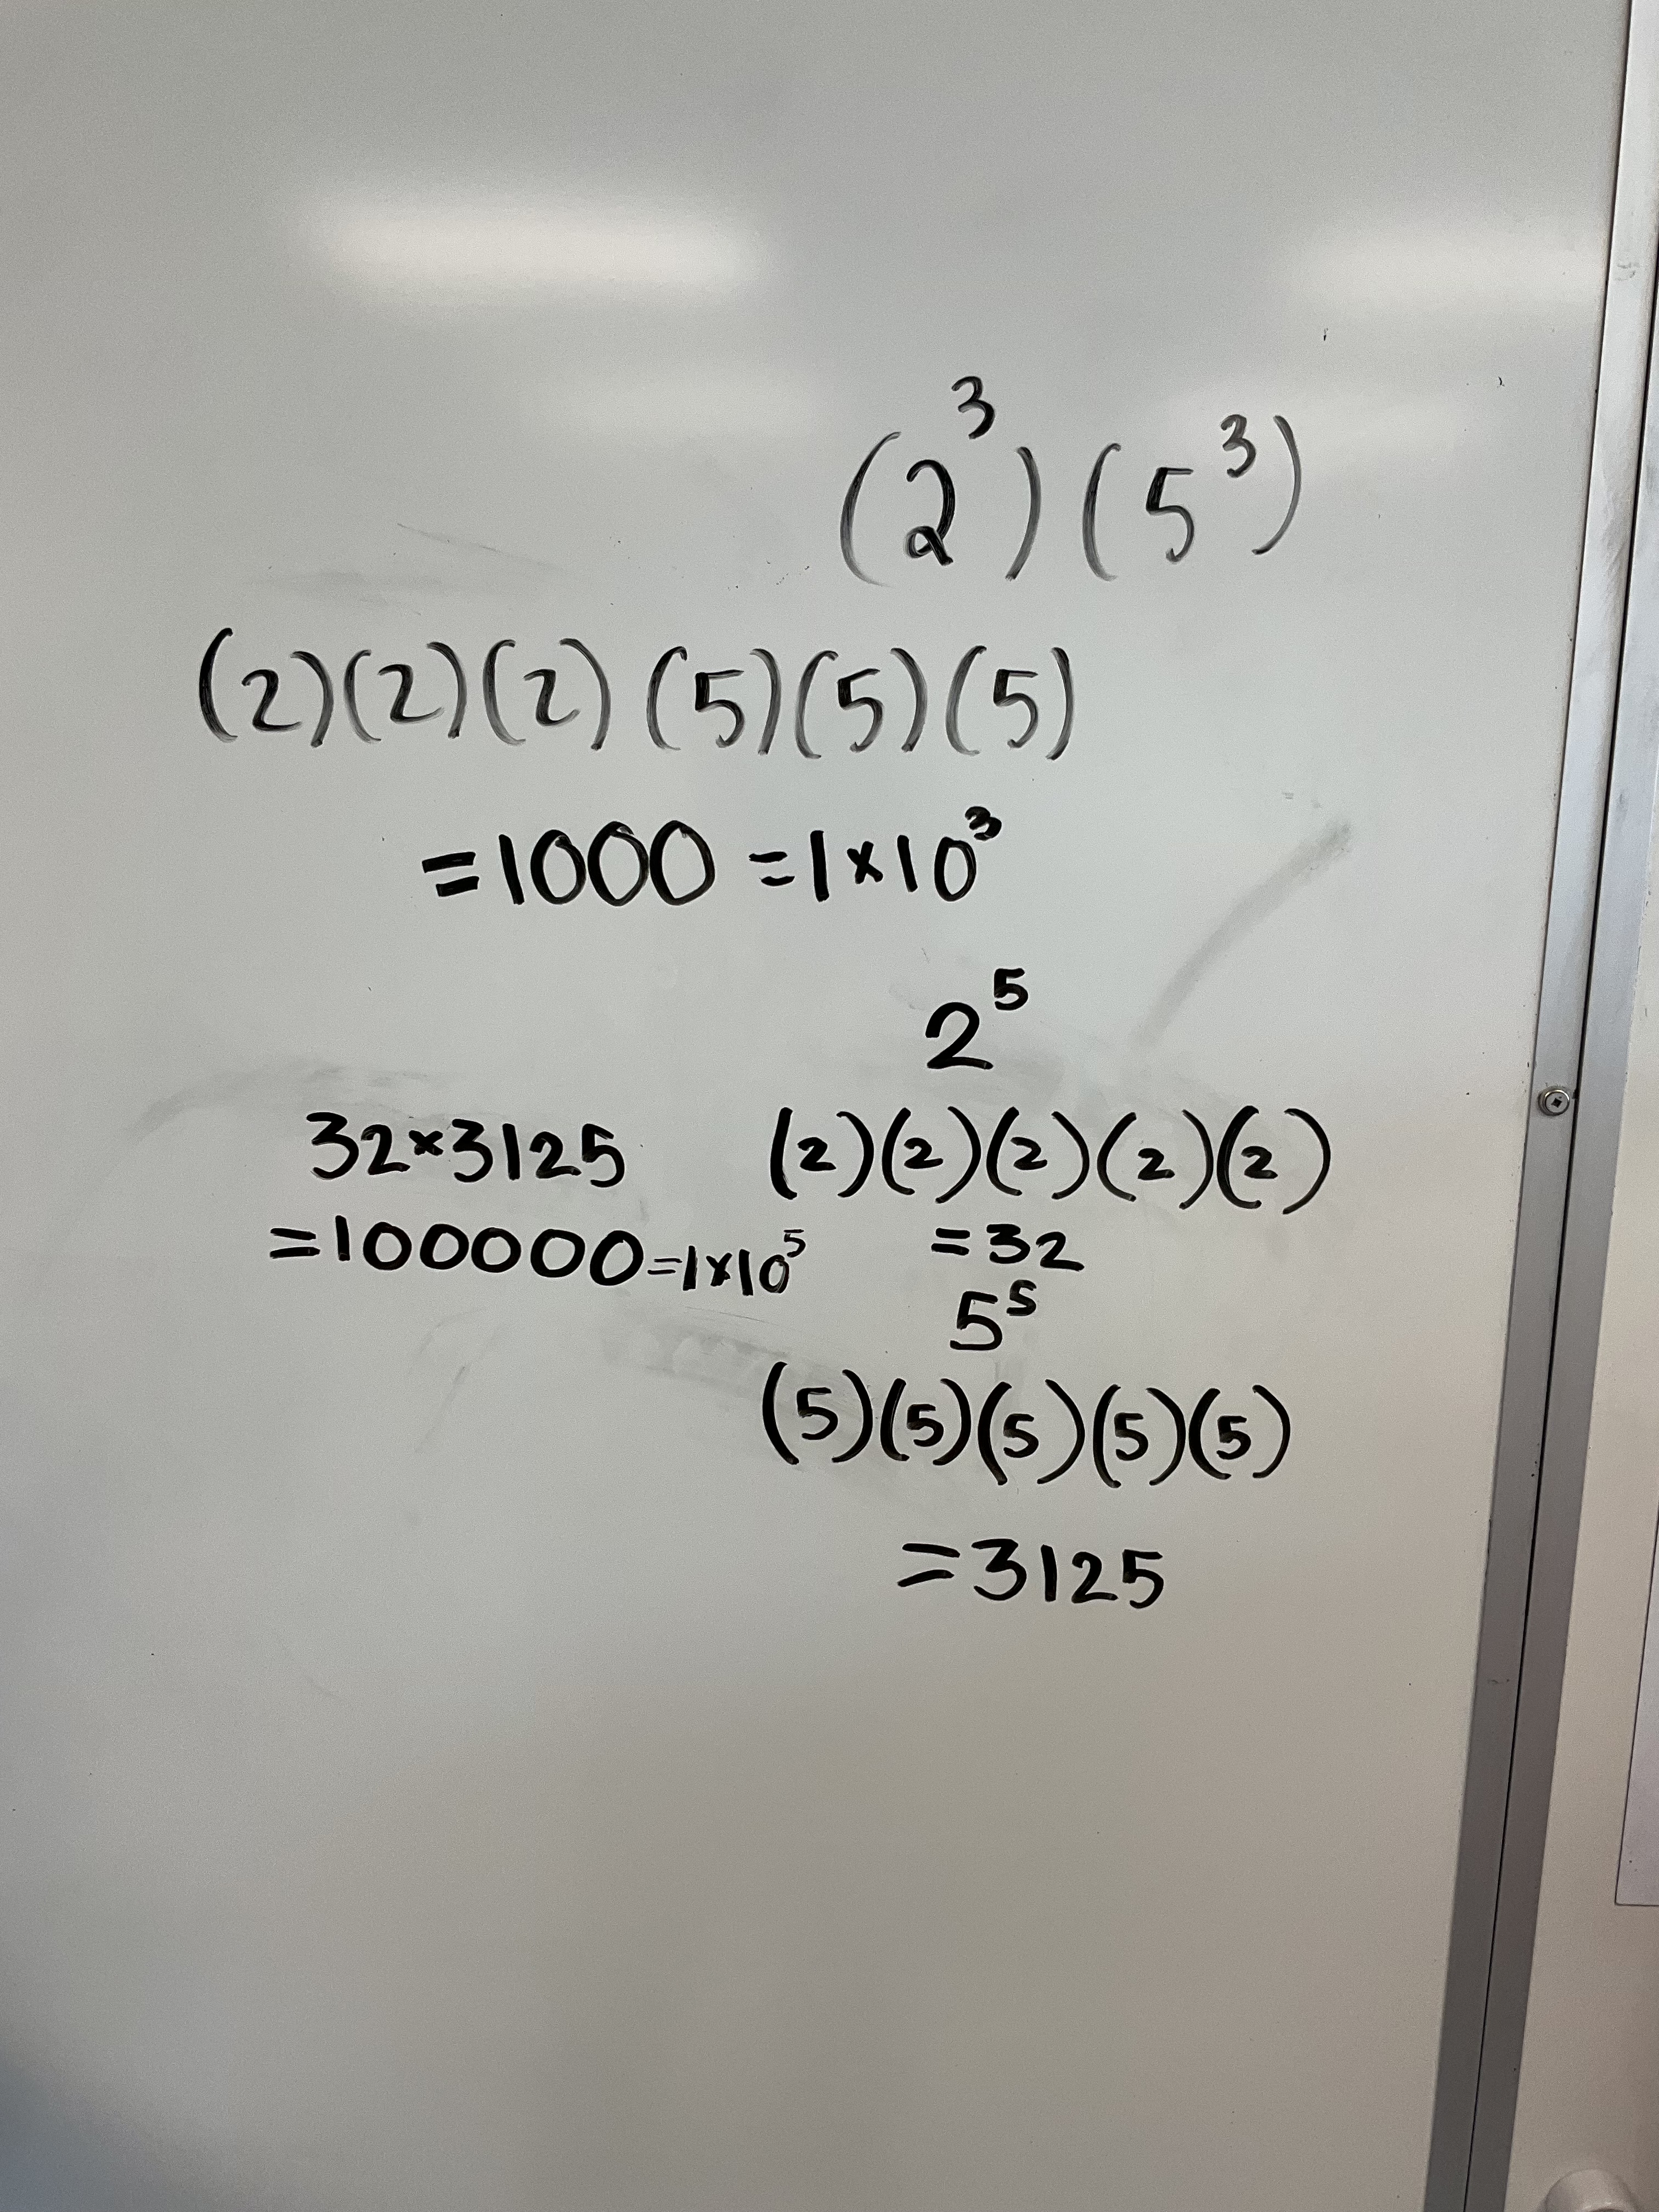
Students were making connections more quickly now, seeing that all the answers were powers of 10. We’d just done scientific notation so this was a nice connection to see.
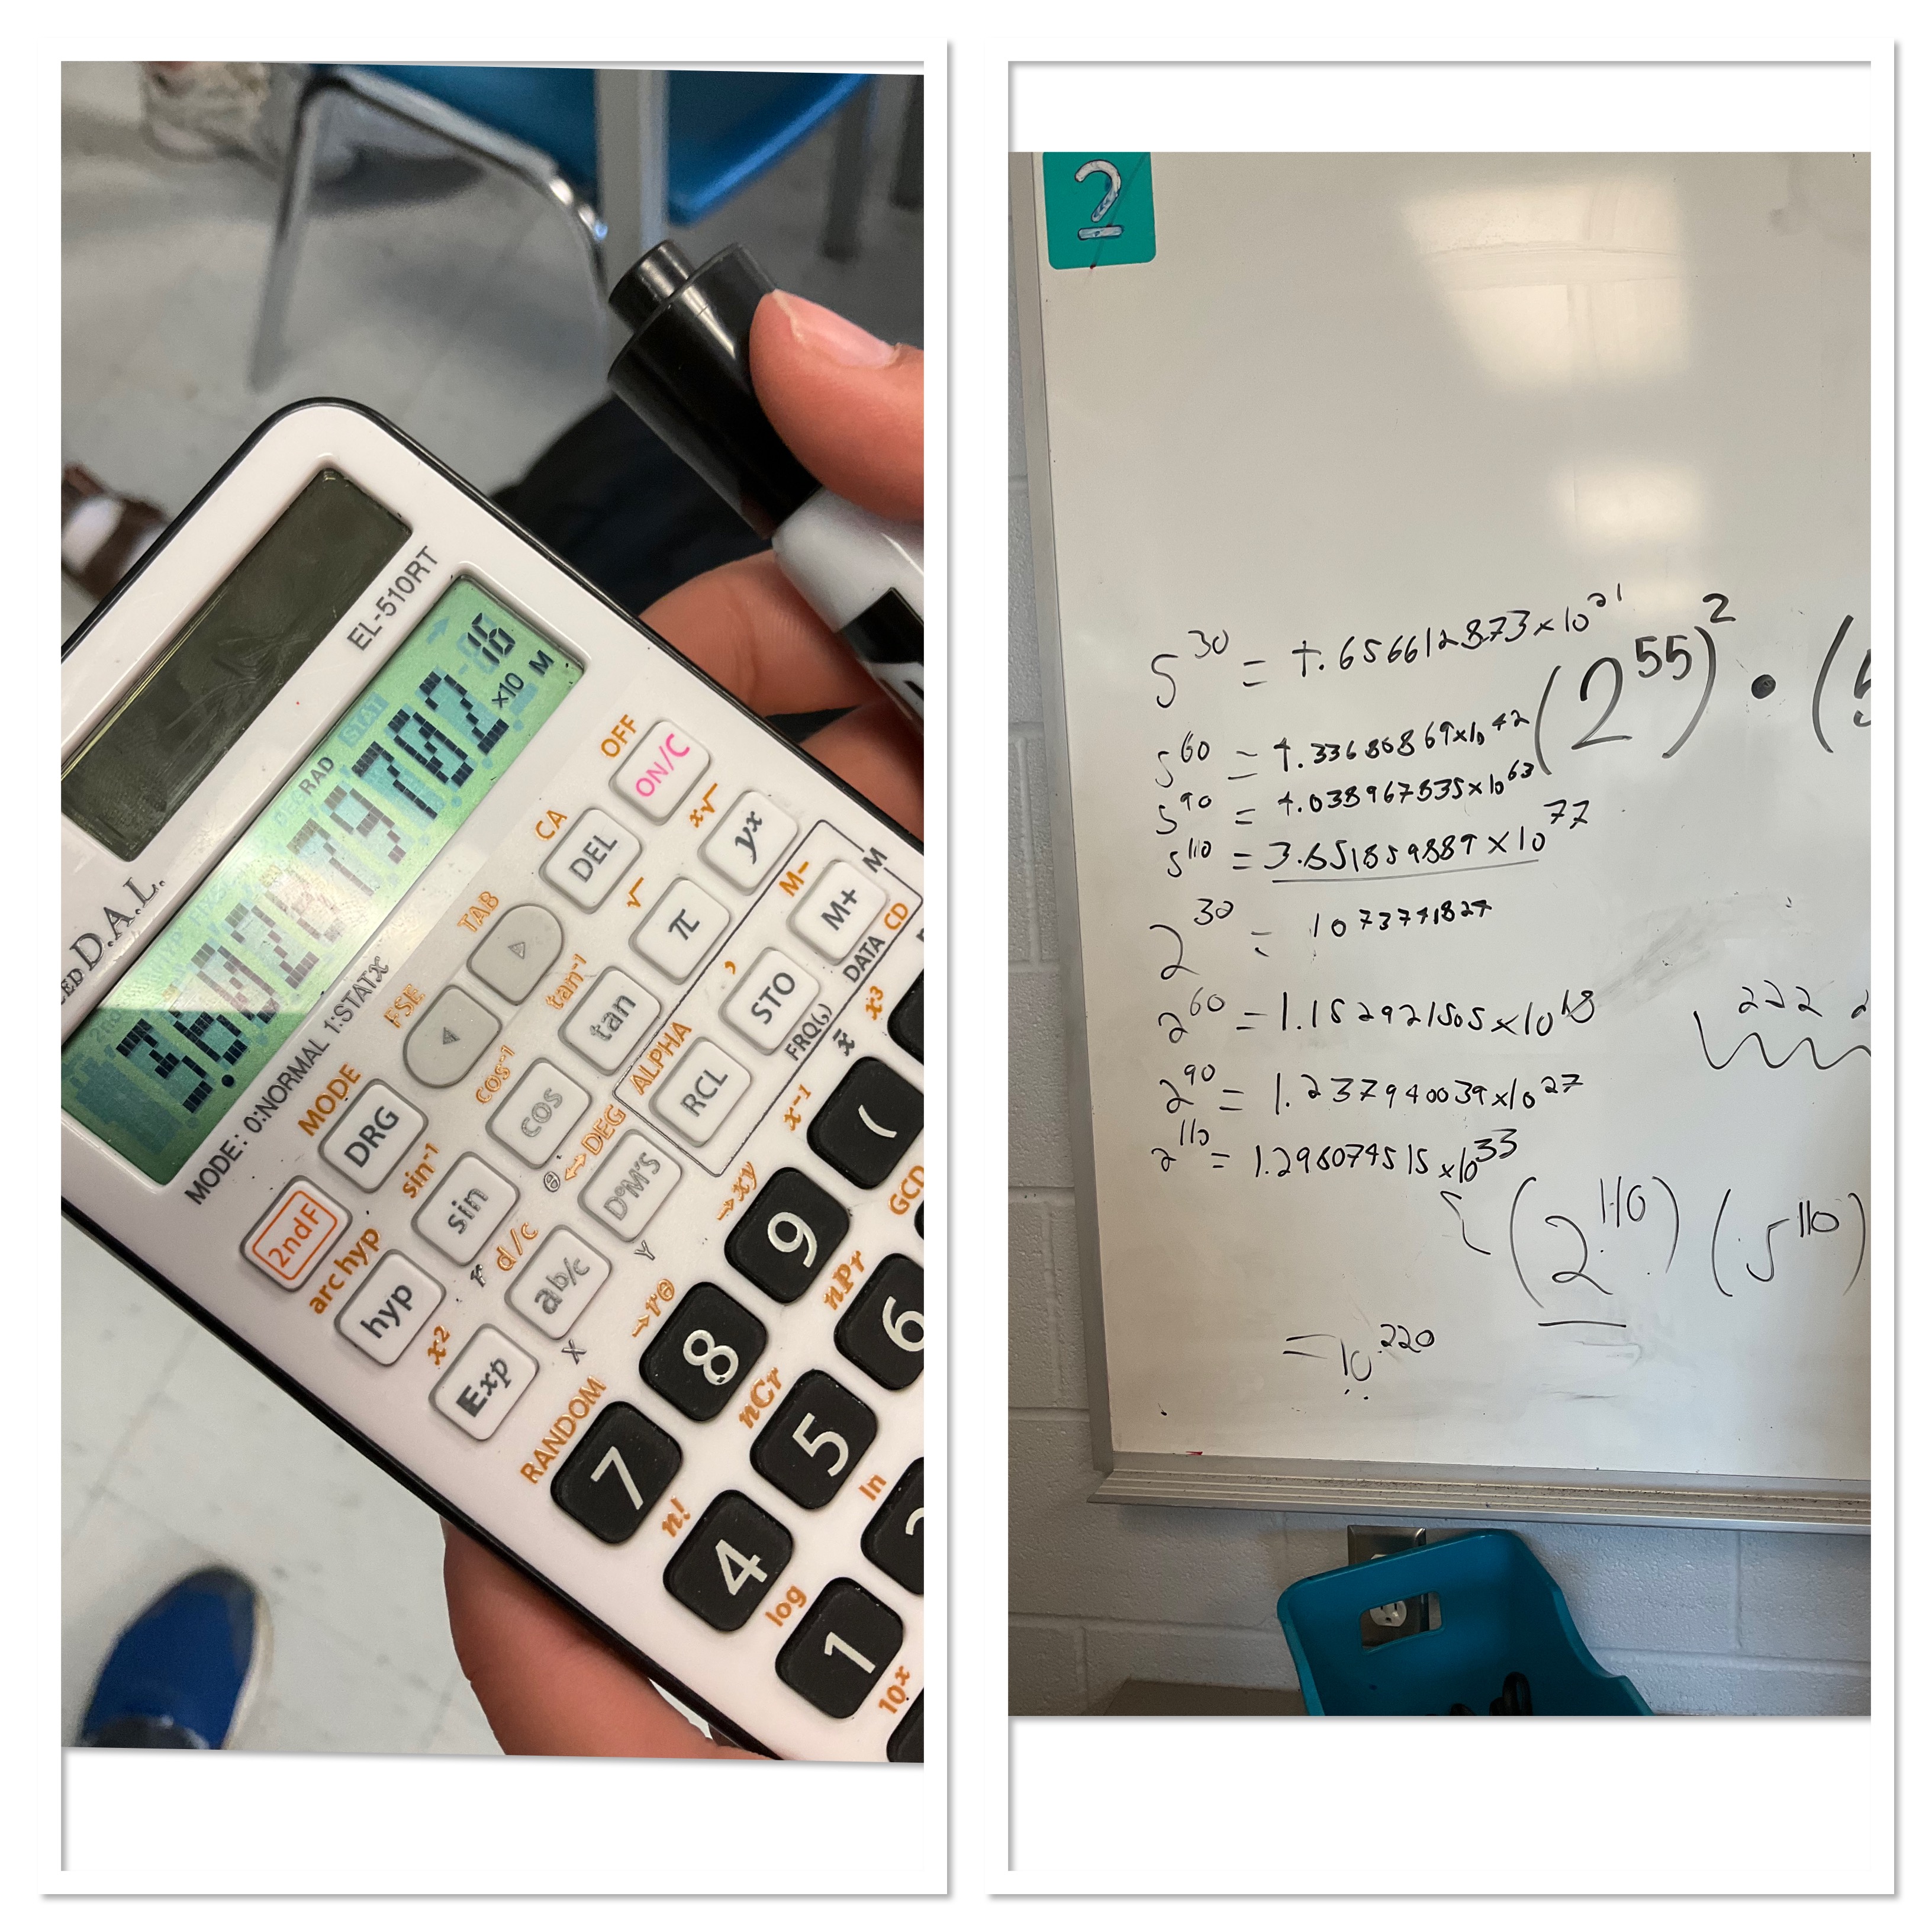
Some spent a lot of time exploring various powers of 2 and 5 and seeing how they grew. We practiced how to calculate this (where the exponent buttons are) and how to interpret scientific notation on our calculators.
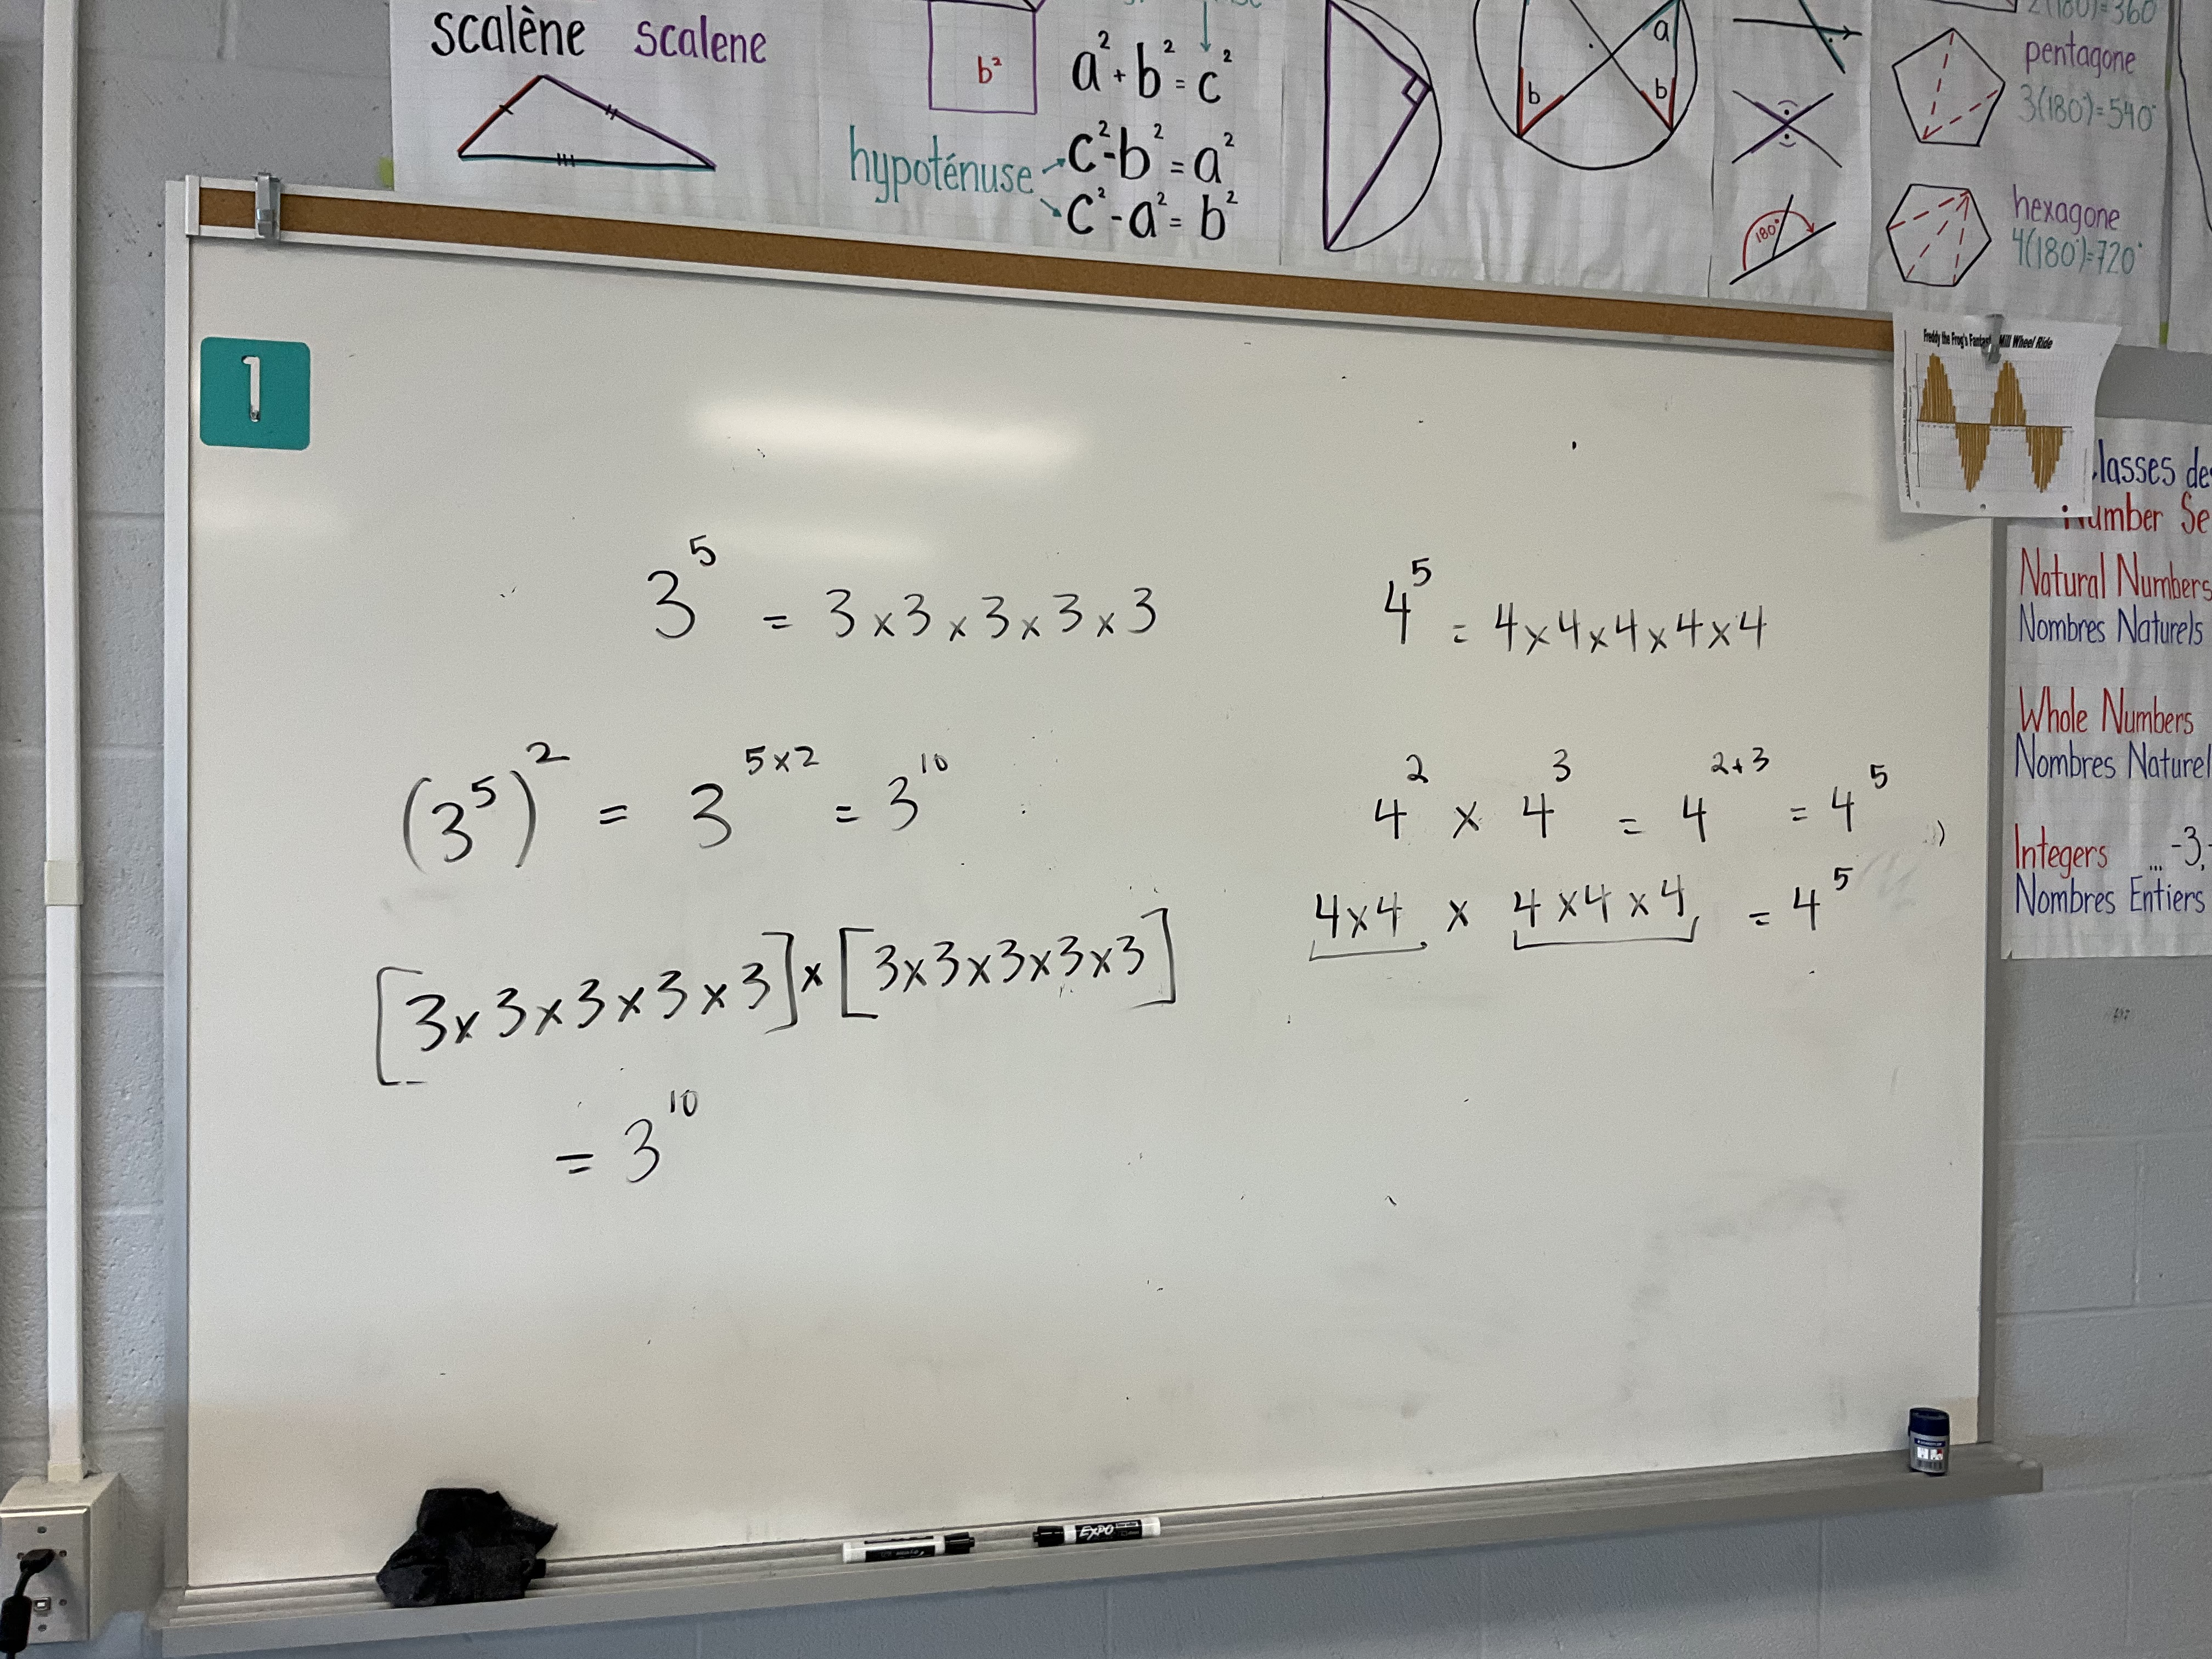
While consolidating the lesson we had time to talk about many aspects of the math that we’ve learned. We reviewed what exponents mean, and what the power of a power does, and why the base stays the same.
We reviewed 2 different ways to multiply 16×625, using area model or by doubling 4 times.
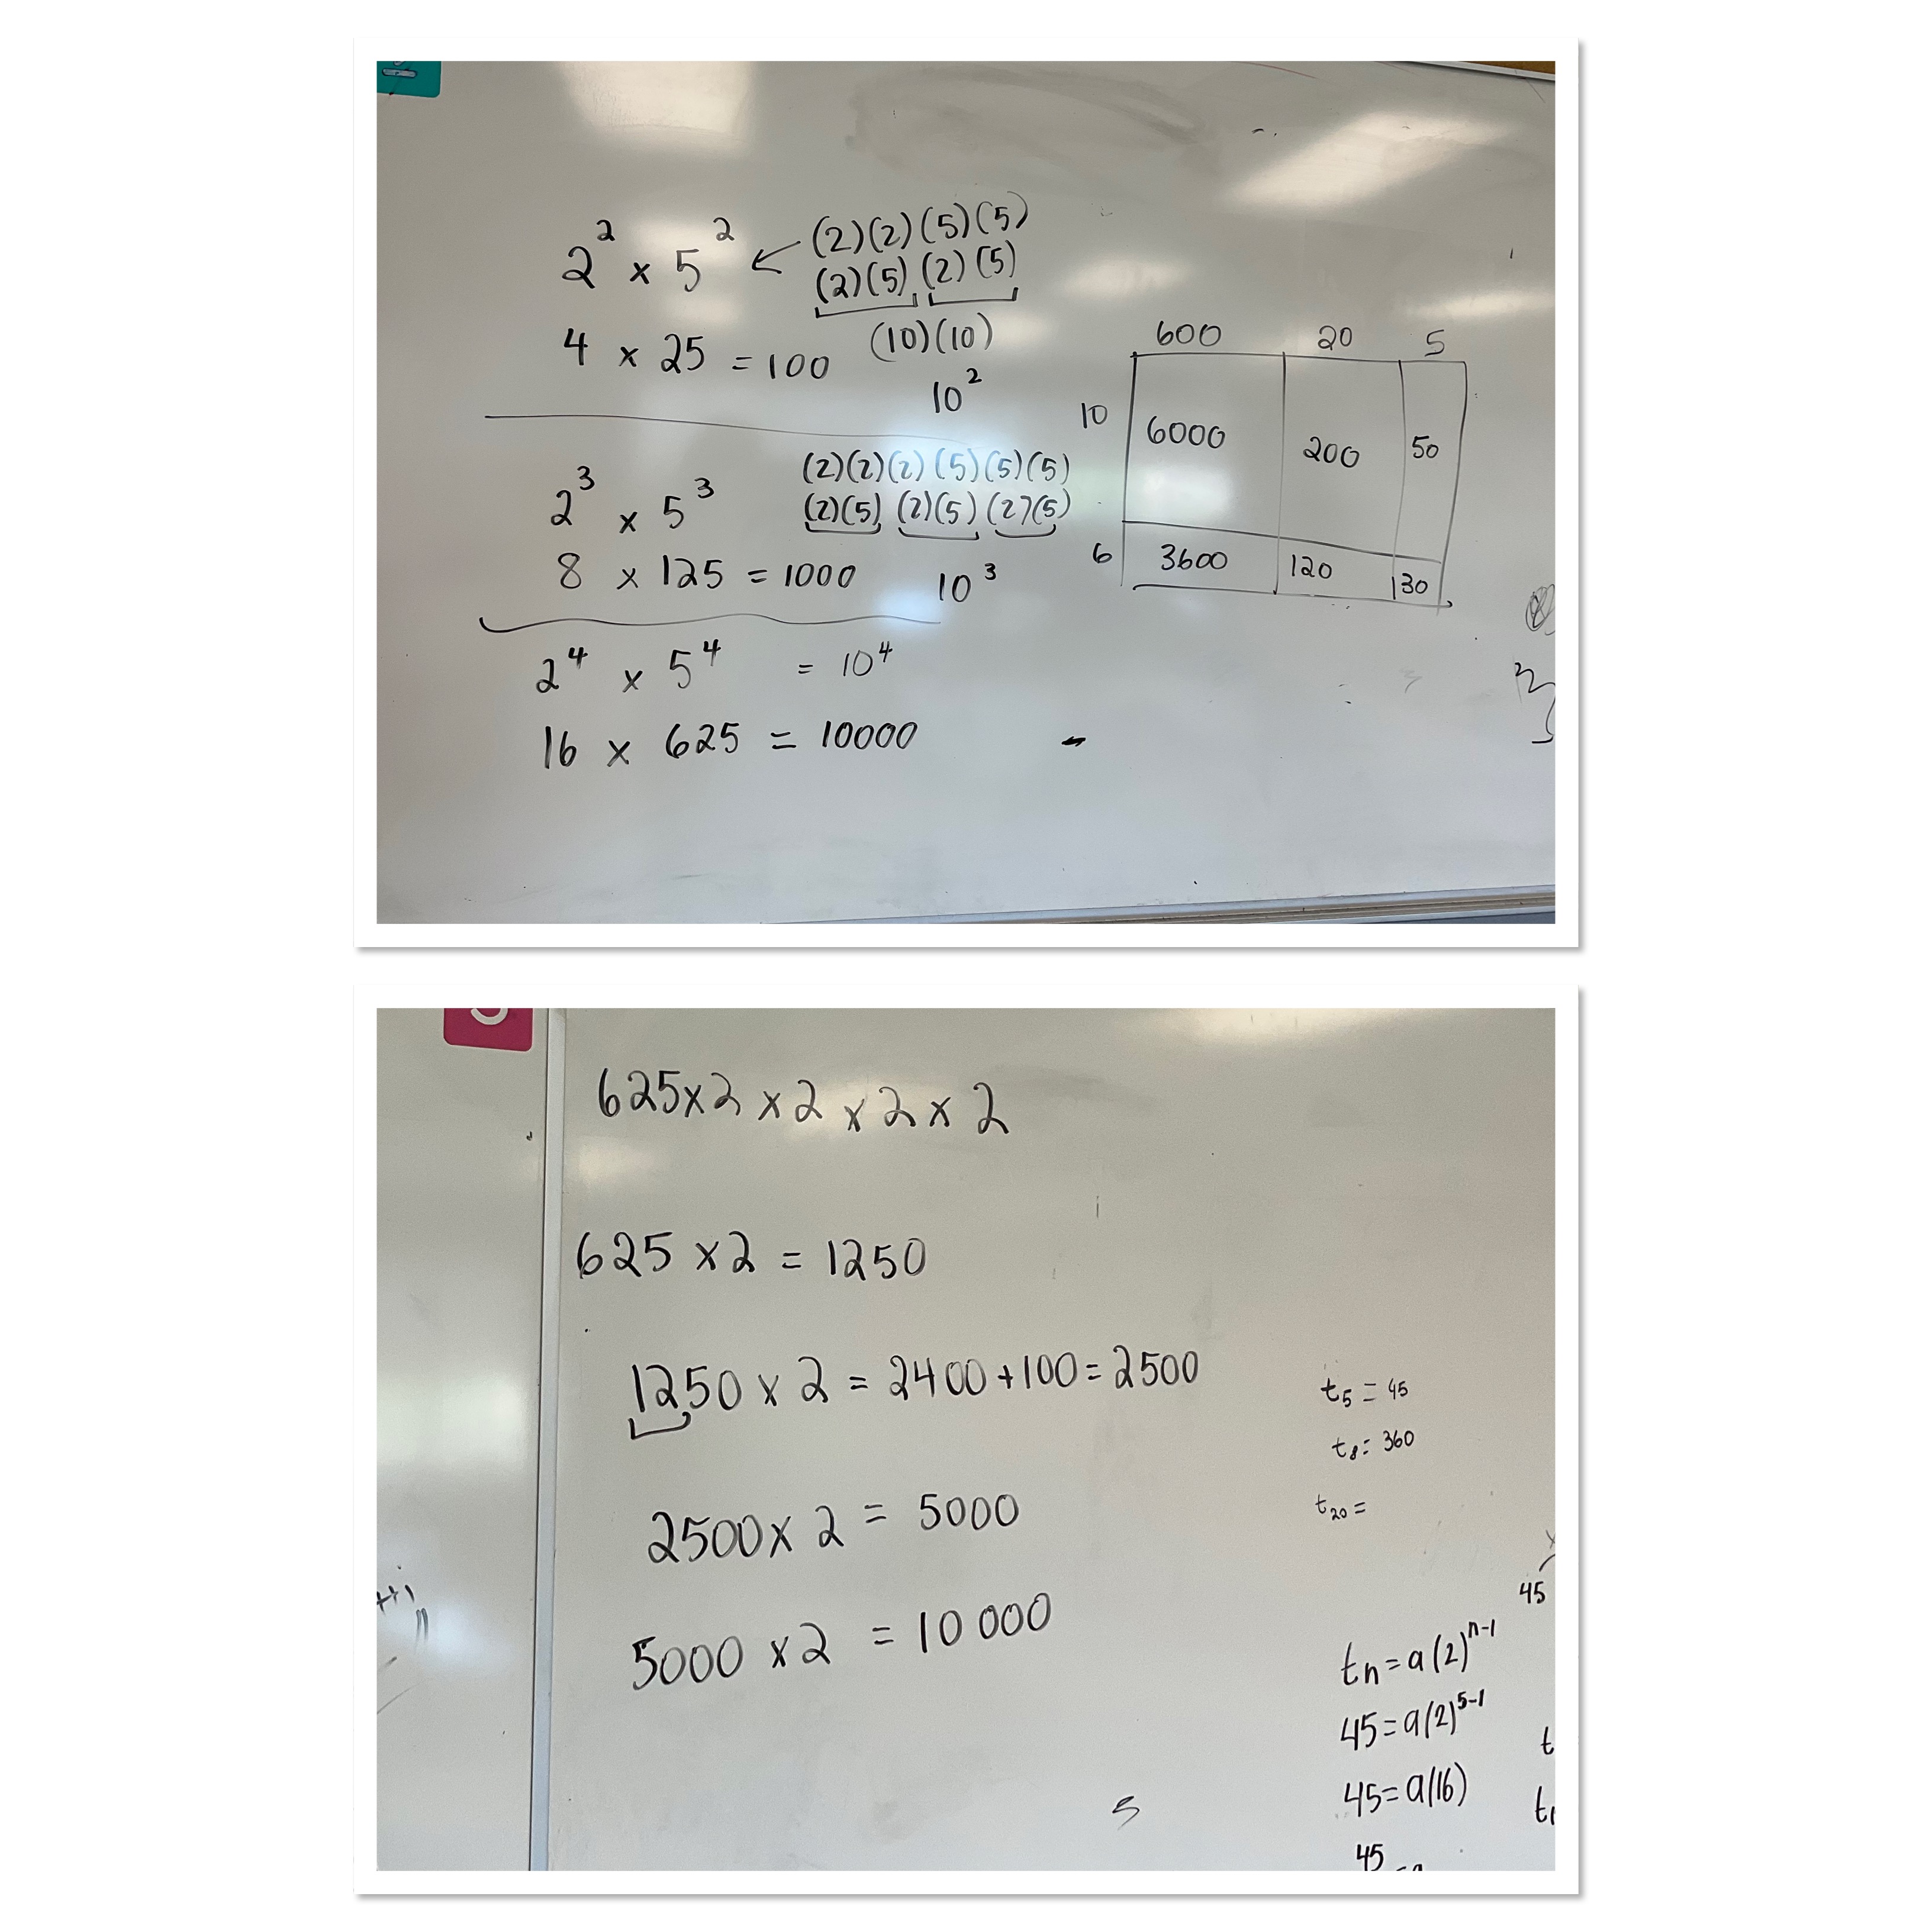
We looked at powers of 10 as well and made the connection to the scientific notation that we’ve practiced.
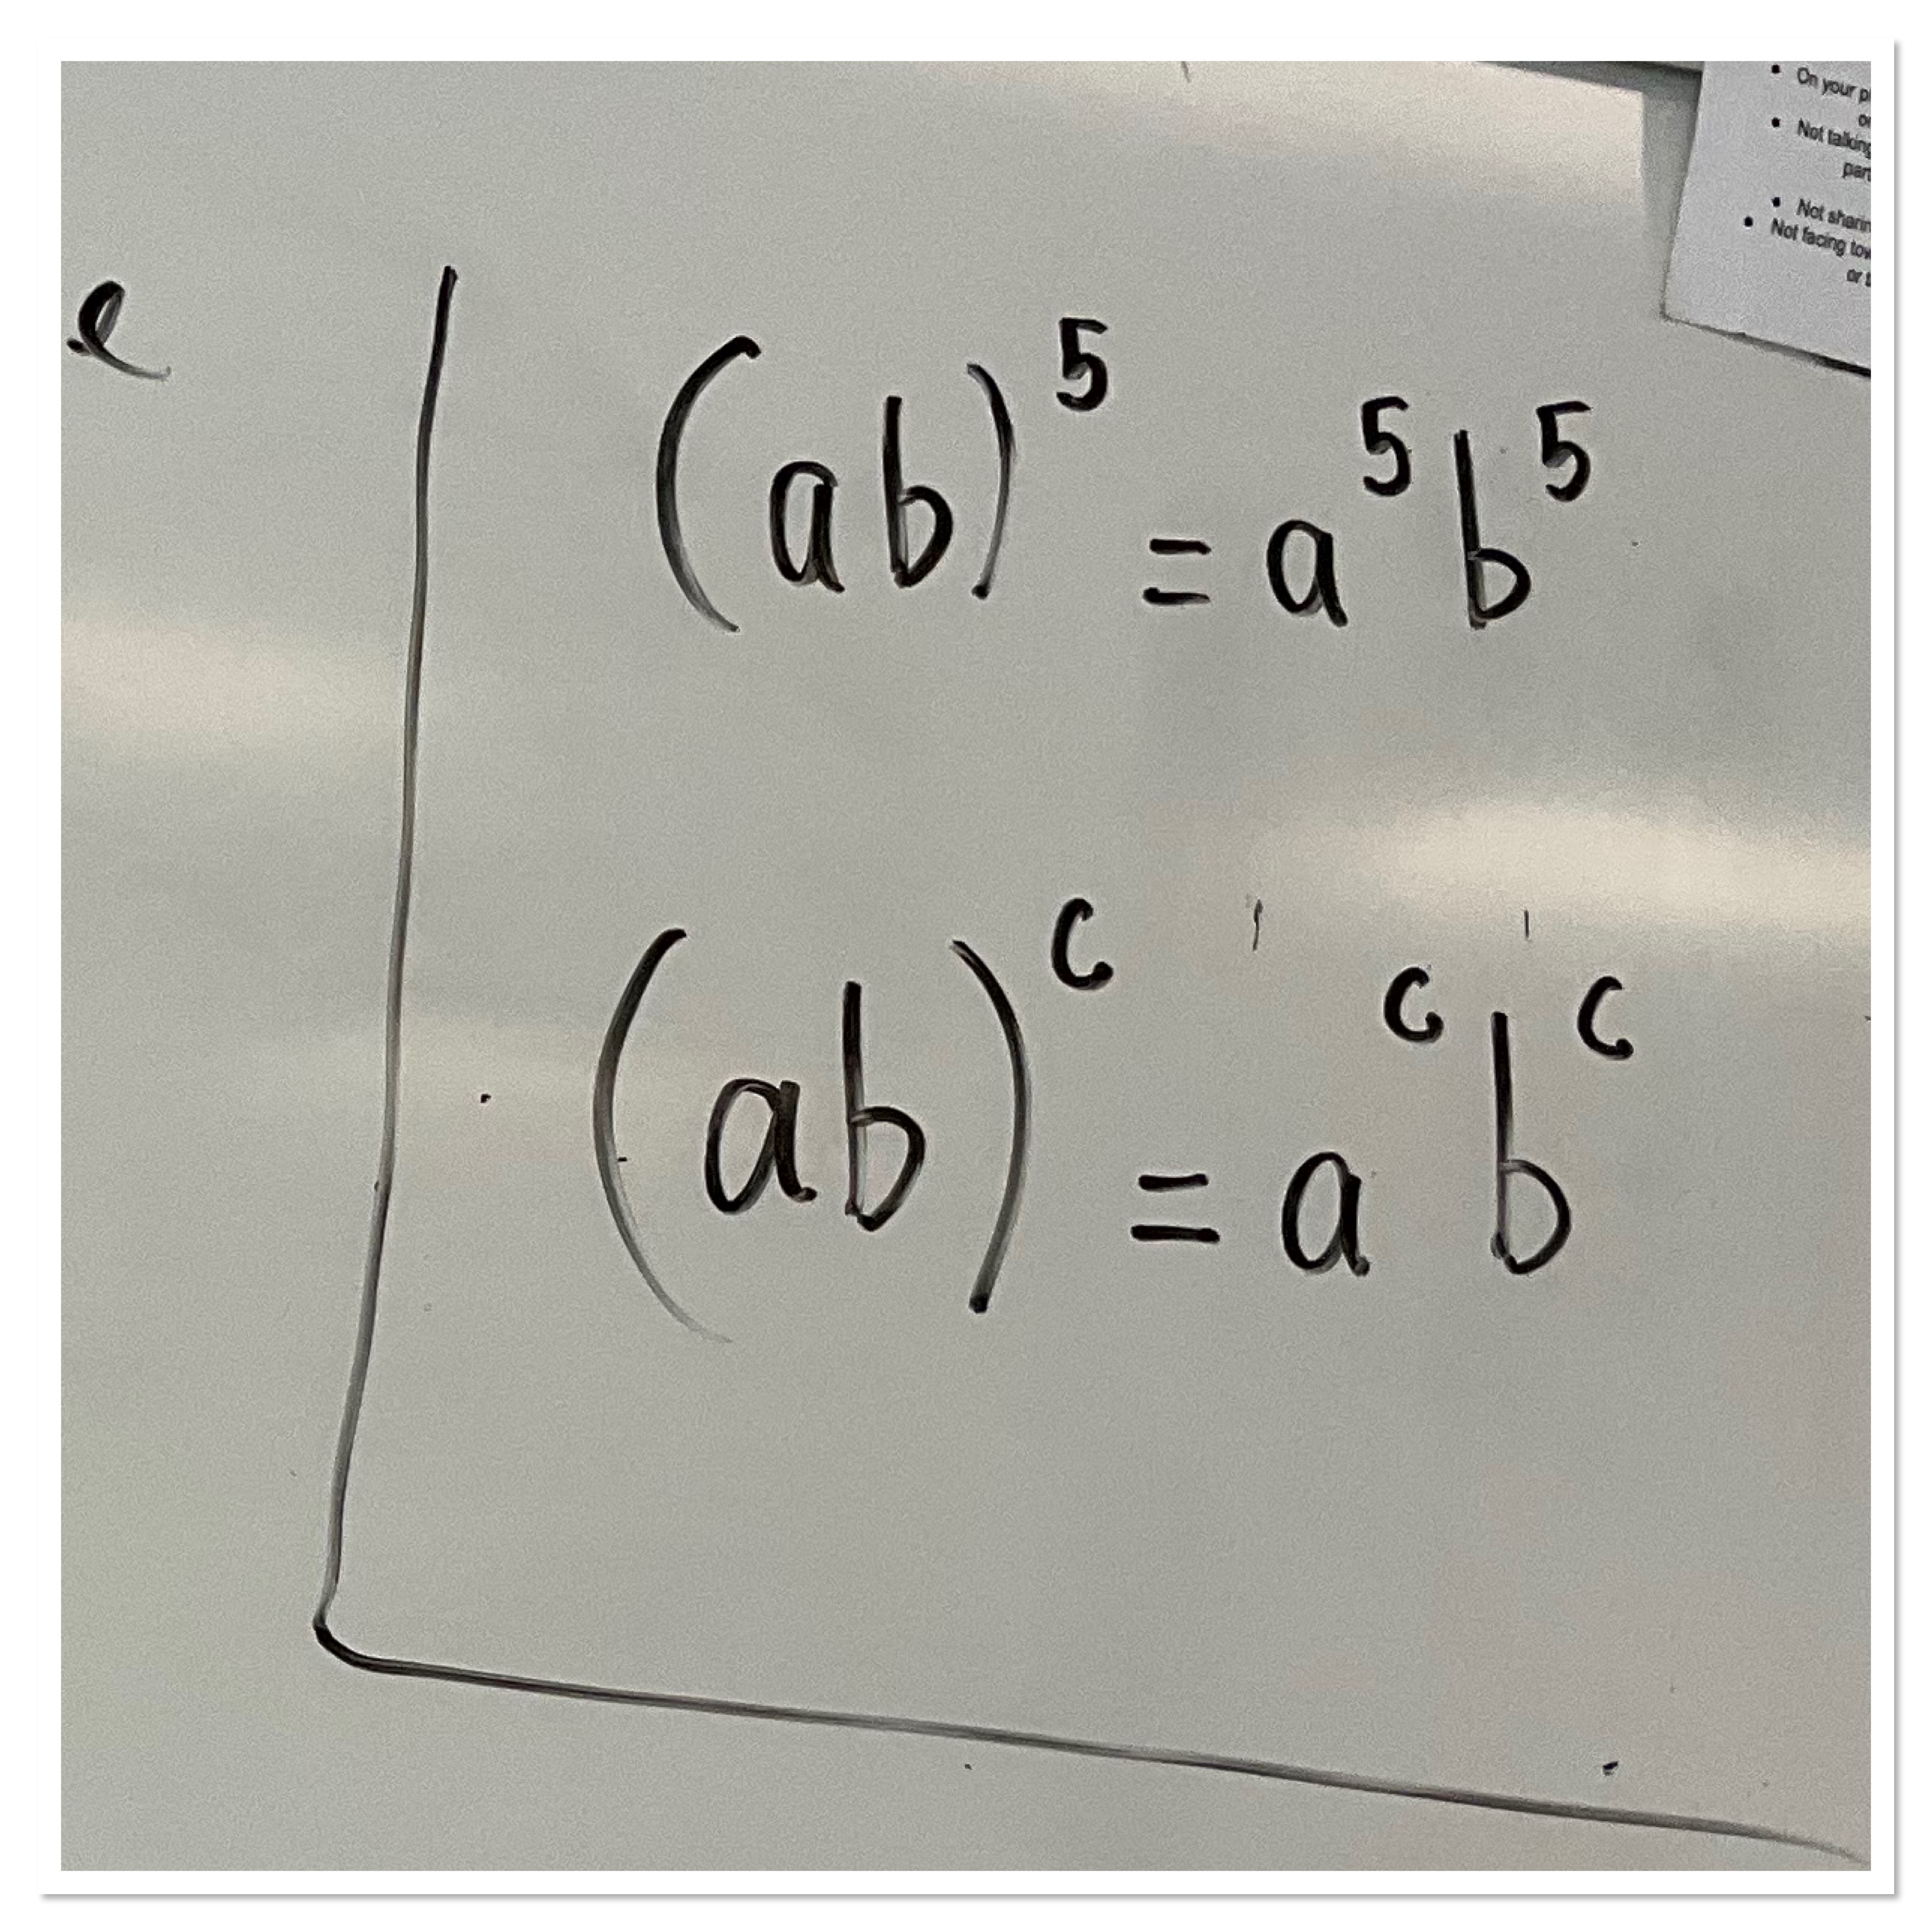
We looked at how a power of a product is the product of the power as well.
All in all we have enjoyed working with this problem in several classes now. It helps to show what skills are solid, and where we need some more practice.
Fractions
I’ve been working with some grade 8 students, supporting their understanding of fractions. We have been using various representations and manipulatives to help. Today I brought Cuisinaire rods, and we used concept circles.
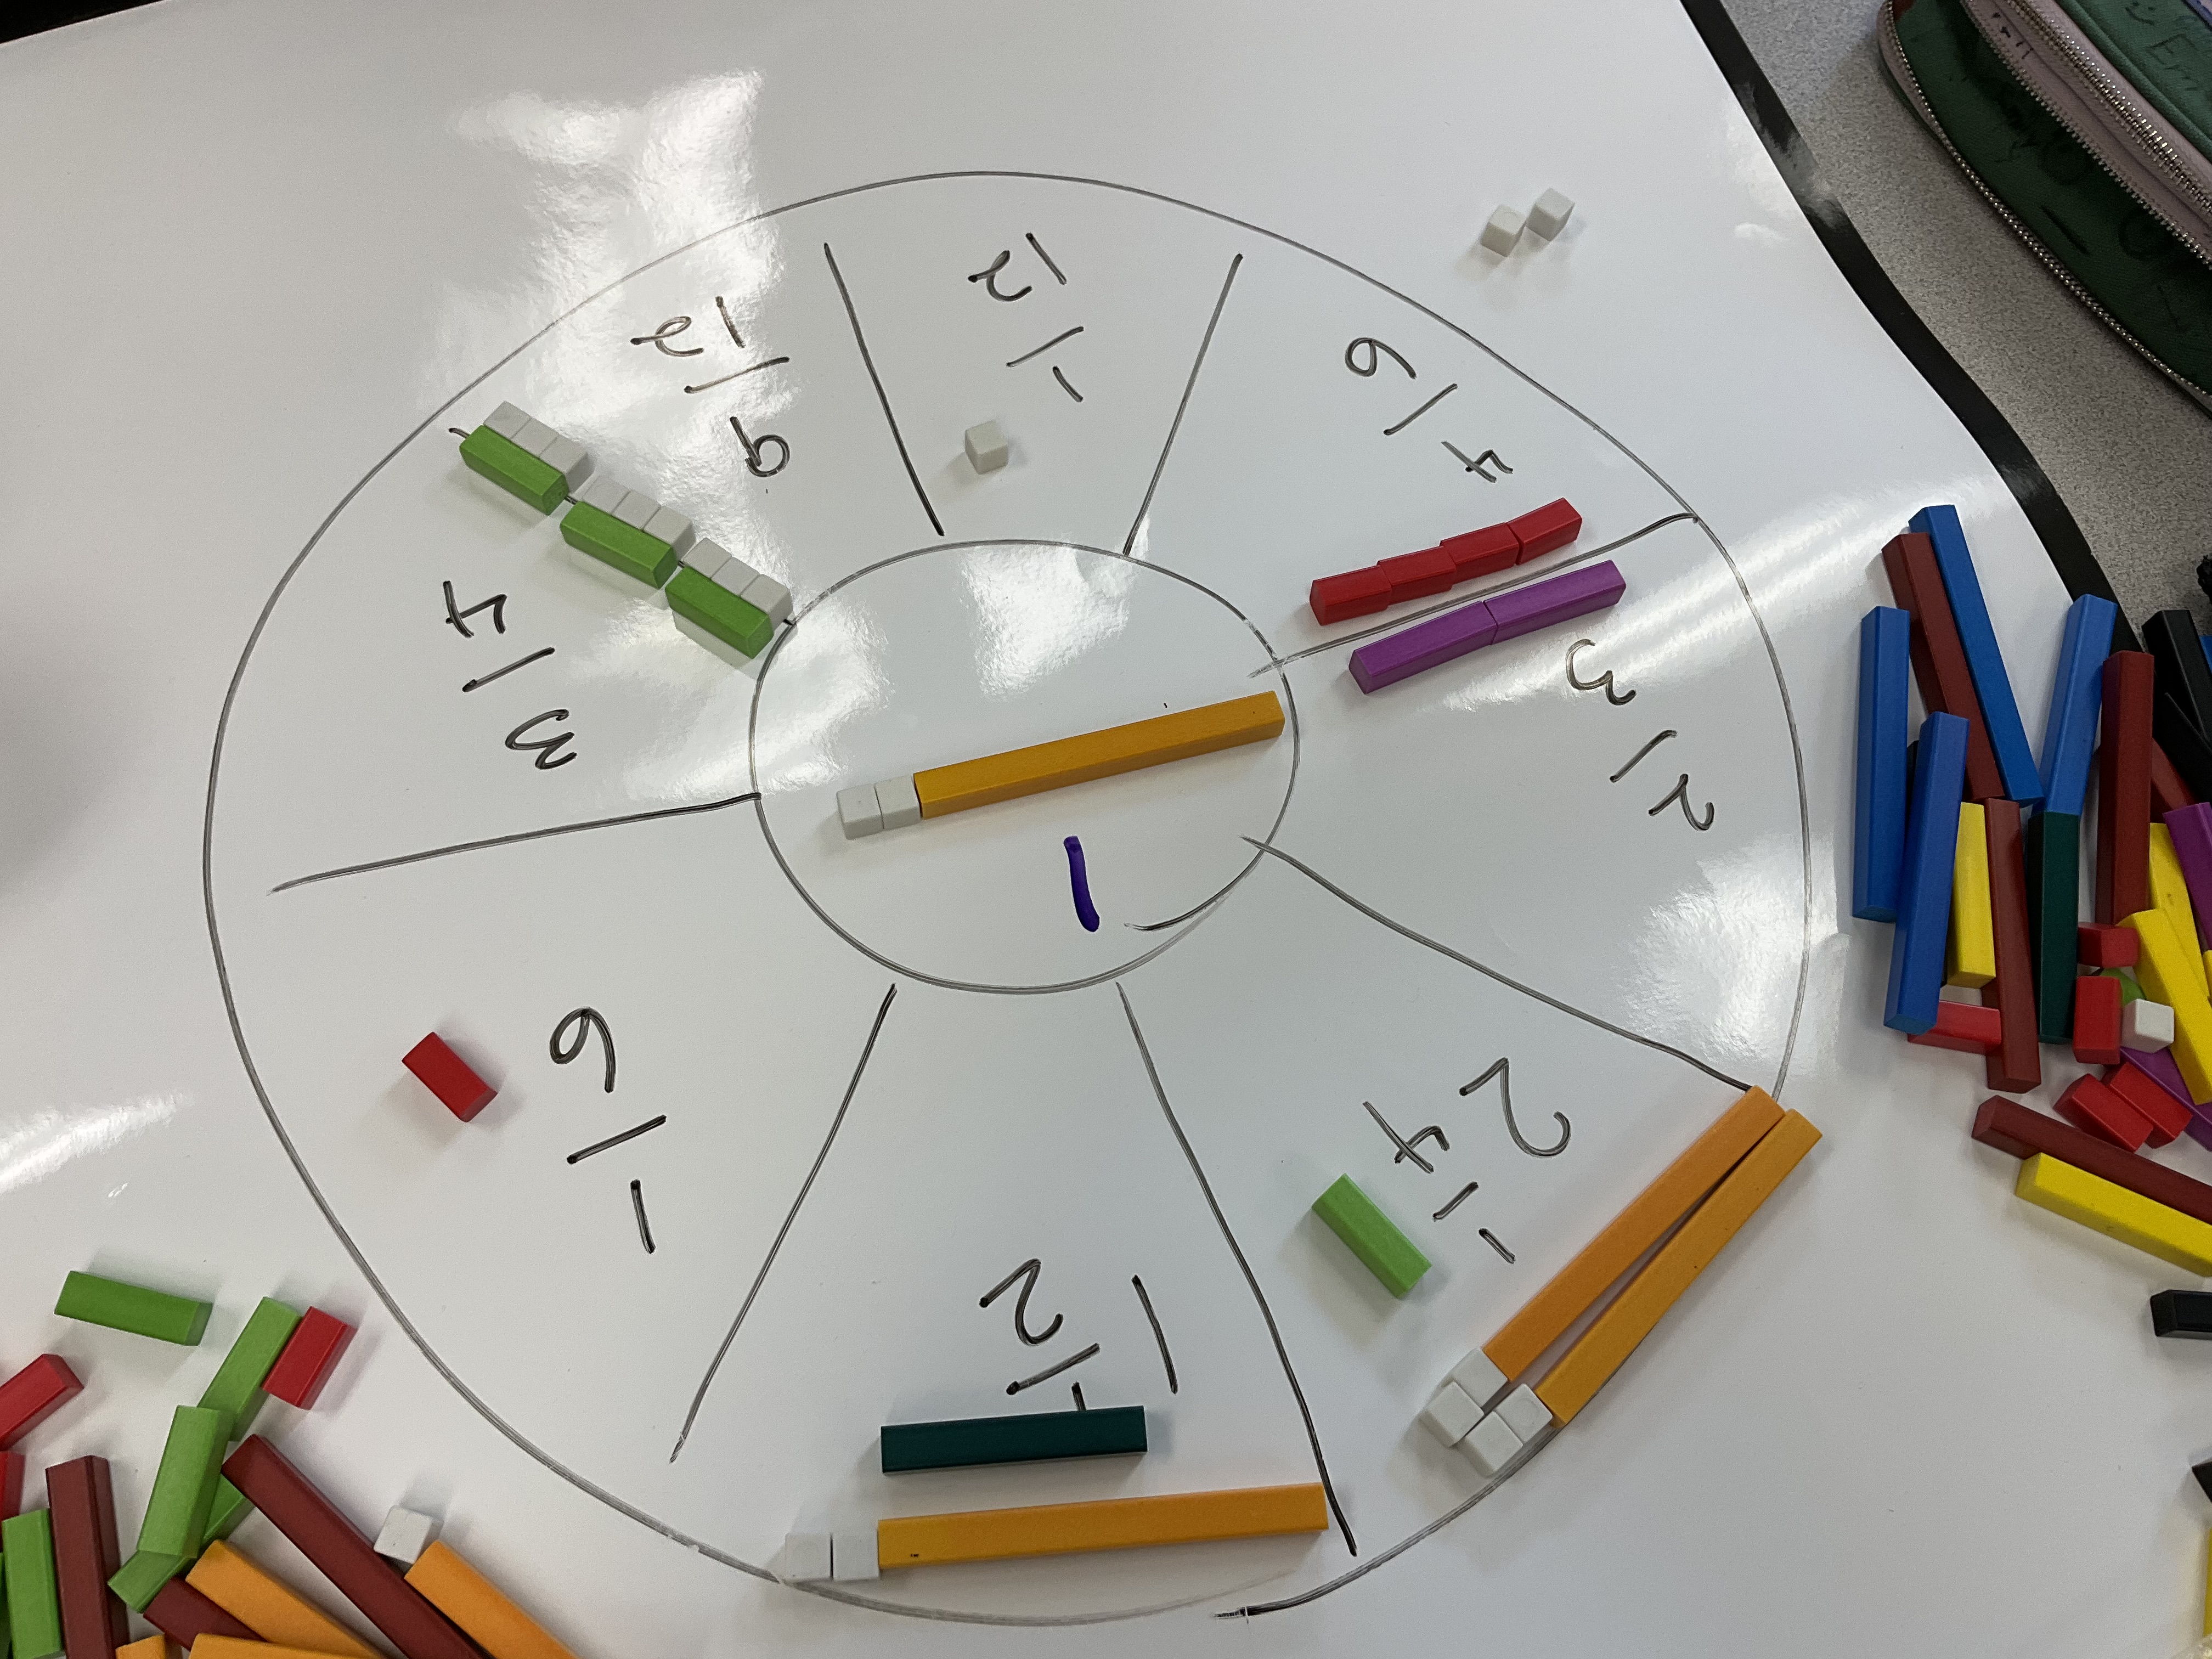
We used 12 as our “1” and represented a variety of fractions based on that. I wrote the fractions and the students needed to place the blocks.
The second time we cleared the values in each segment, put different blocks in each section, and then the students needed to write down the fraction.
Finally we tried it again using the 10 rod as our “1” which pushed their thinking. By changing what the “whole” is, each block takes on a different meaning. When the whole is 12, each white block is 1/12 since it takes 12 white blocks ro build the whole. When the whole is 10 each white block is 1/10, since it takes 10 white blocks to build the whole.
Students are starting to engage more, and respond well to the manipulatives. We are working on conceptual understanding and filling in some gaps in both skills and confidence. It’s been a fun challenge!

