Catapults: Culminating Task in Grade 10
In grade 10 we started working on our culminating task: analysing the trajectory of catapults that we build in class.
Today we started building and testing and collecting data.

Each group gets about 10 tongue depressors or popsicle sticks, a plastic spoon, several elastic bands and some tape. We use painters tape because we are aiming for something that can be disassembled, so the pieces can be used again next term. Each group also gets a target, a pompom, and a package of work to do.
After they have created a catapult (with or without online tutorials) we go into the hallway and collect some data.
We film the pompom being catapulted, then use the app Visual Physics to track it.
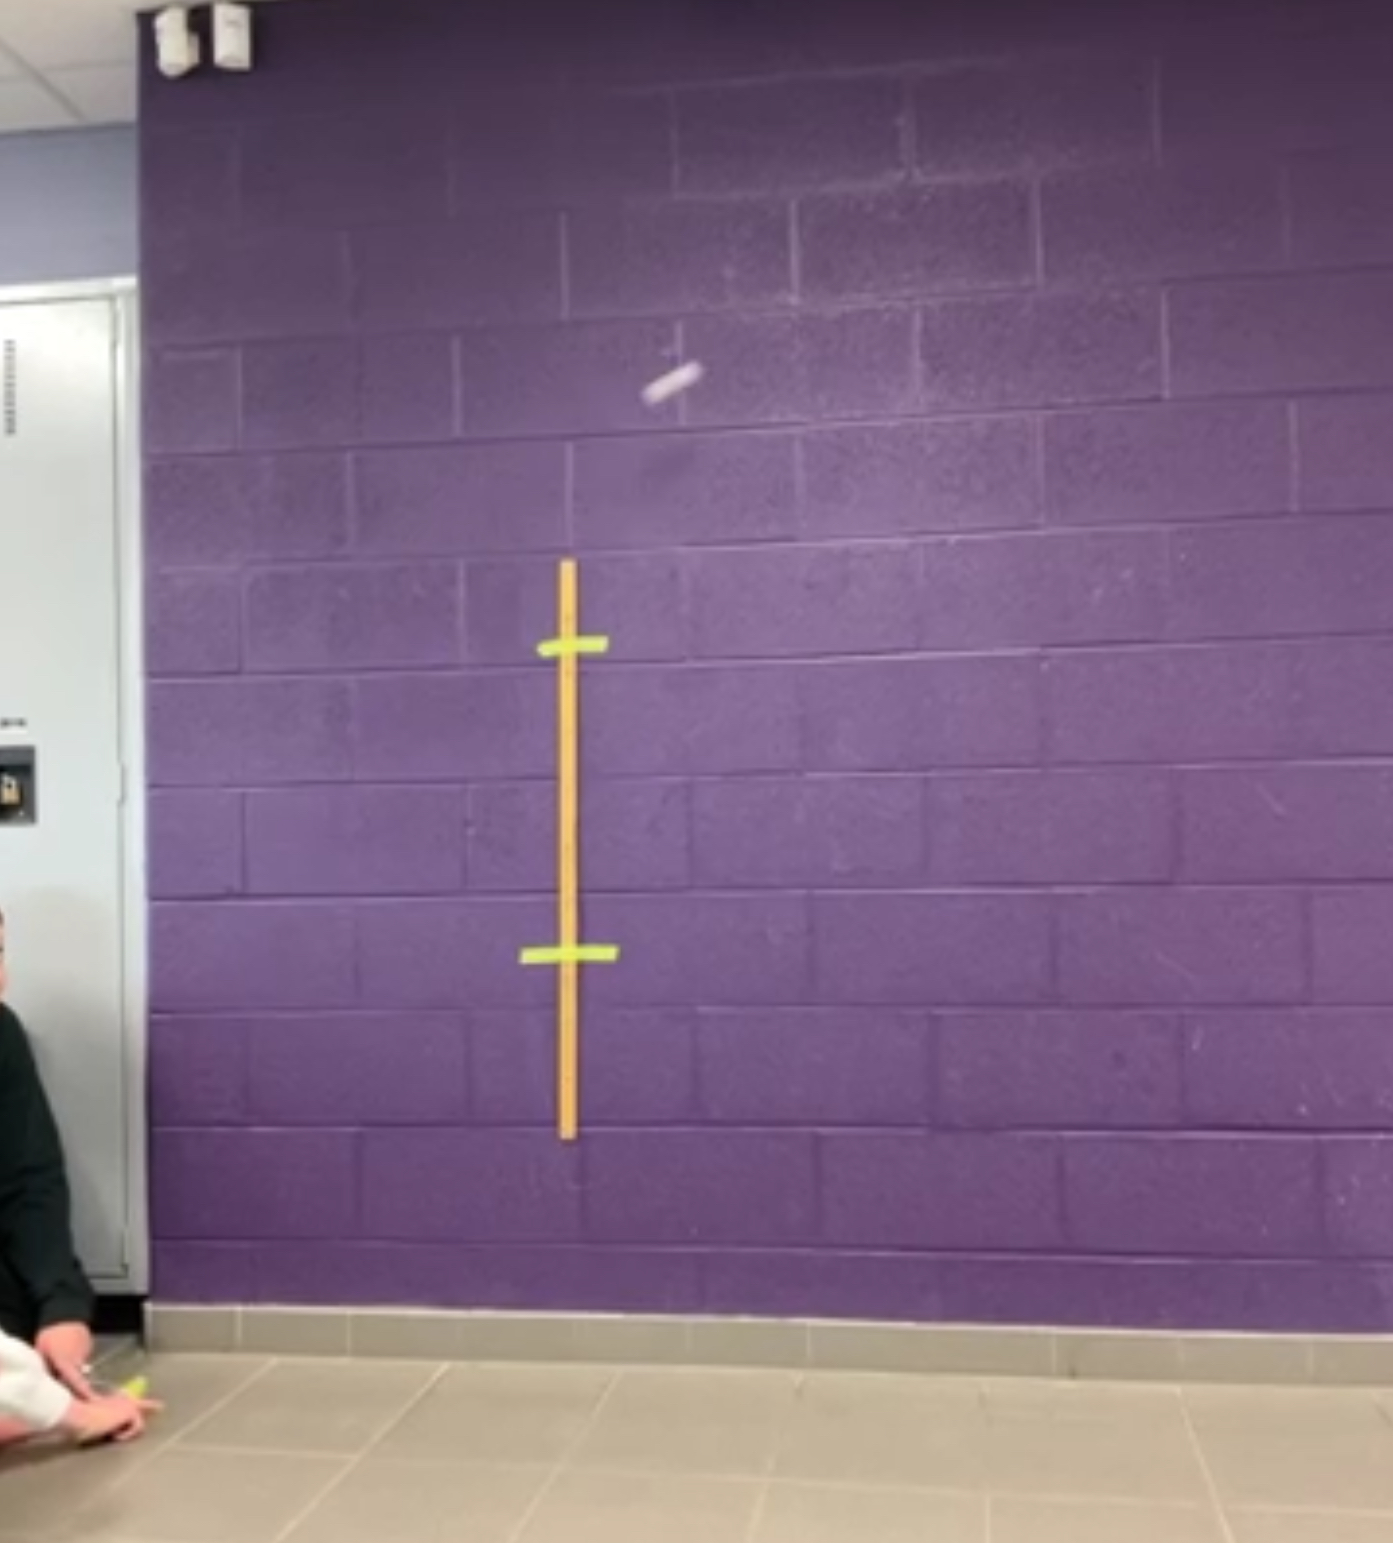
Here’s a different one being tracked. We need to scale the image (that’s why there’s a meter stick on the wall). We need to touch the screen where we see the pompom (we track the leading edge of the blur). The program advances time slowly so we can see the pompom at many points along its trajectory.

Finally we upload the file to a different app where some analysis can be done. In this case we can see a table of values, and a graph with a smoothed quadratic overlayed. The a b c values are given for the quadratic.

The next step for students is to see if they can use the table of values to calculate a similar “a” value to the one the program gives. Also they use both equations to calculate where the pompom lands.
The extensions are questions like: if the catapult was on the floor and trying to hit a target on a chair, determine how far back the chair should be. If the catapult is on a desk, where should the target be on the floor? By adjusting the initial conditions we can play around with how that changes our calculations.
After working in groups for a few days, we will each try to do something similar individually as part of the culminating task.
PD presentation
This morning my colleague and I presented some of our OAME presentation to our staff at our PA Day.
We were tasked with having an ice breaker, and then sharing some of our work on mindset and creating brave spaces for our students.
We started the day with random groups done by team shake, to have everyone mixed up with people they don’t always socialize with.
We had a Cheerio stacking competition, which was pretty fun, and allowed for everyone to do some work.
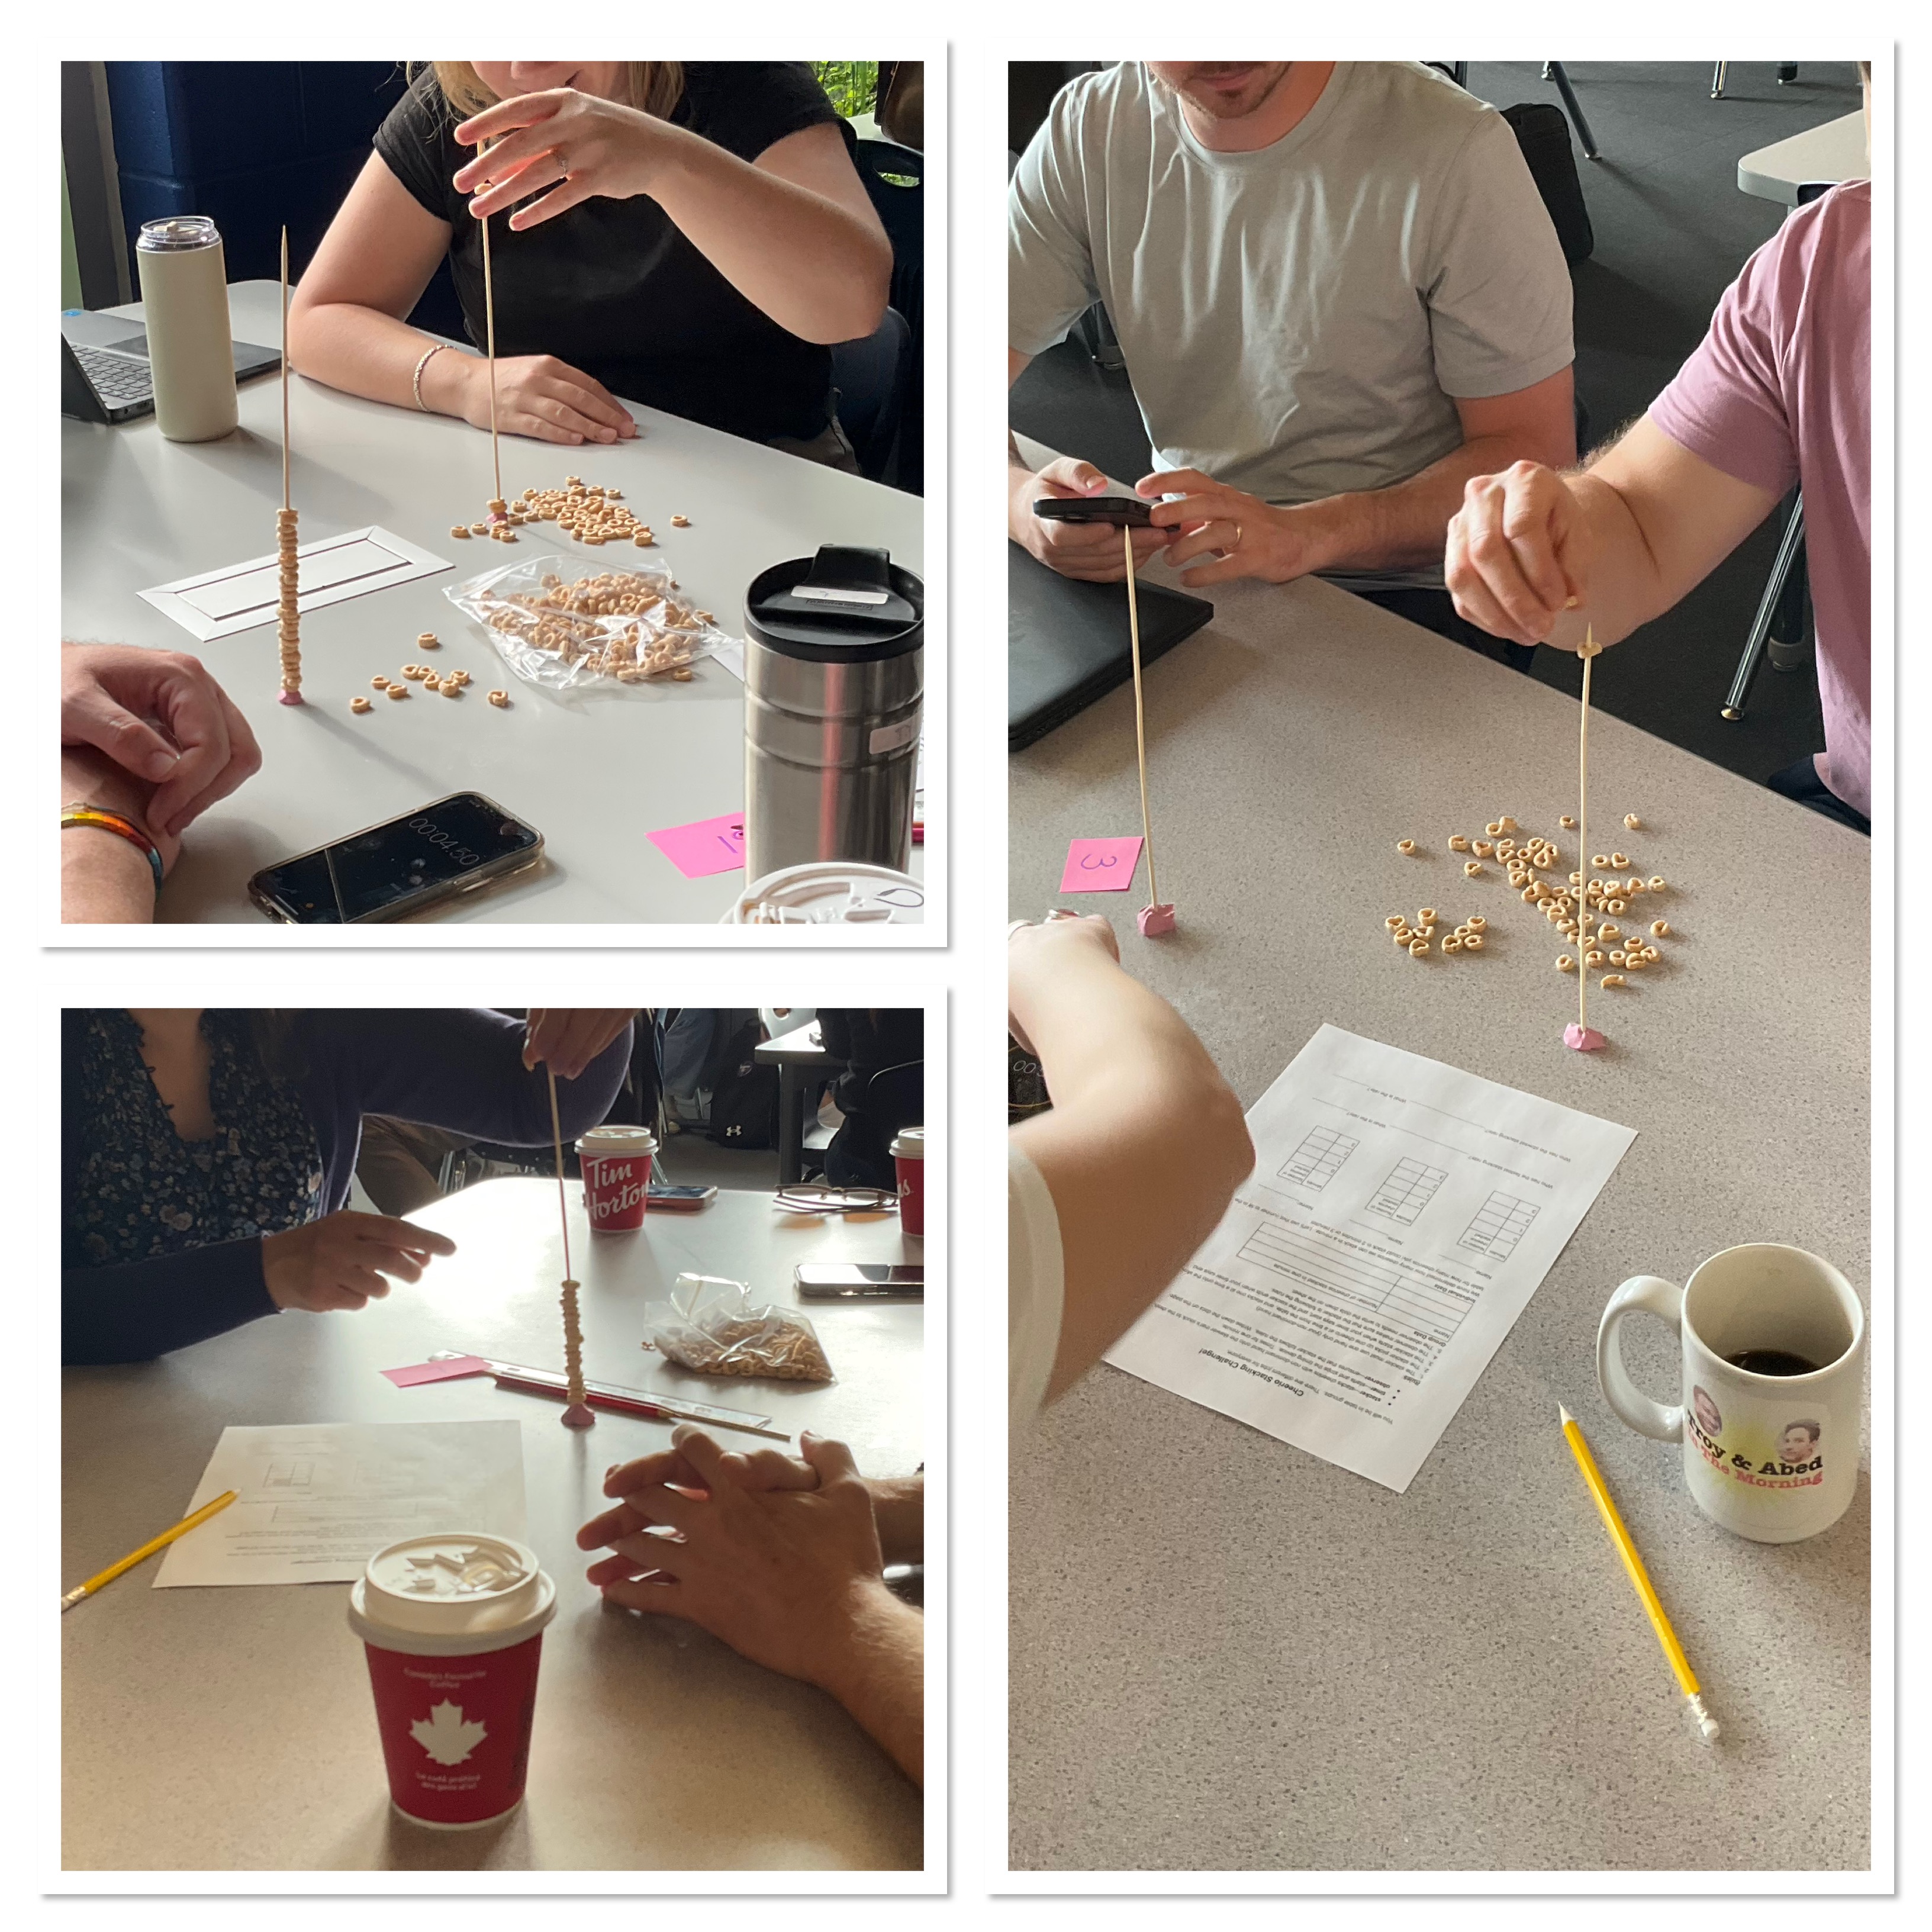
Here’s the document if you want to run the task. I’ve tried it with grade 9 and 10 (both academic and applied)
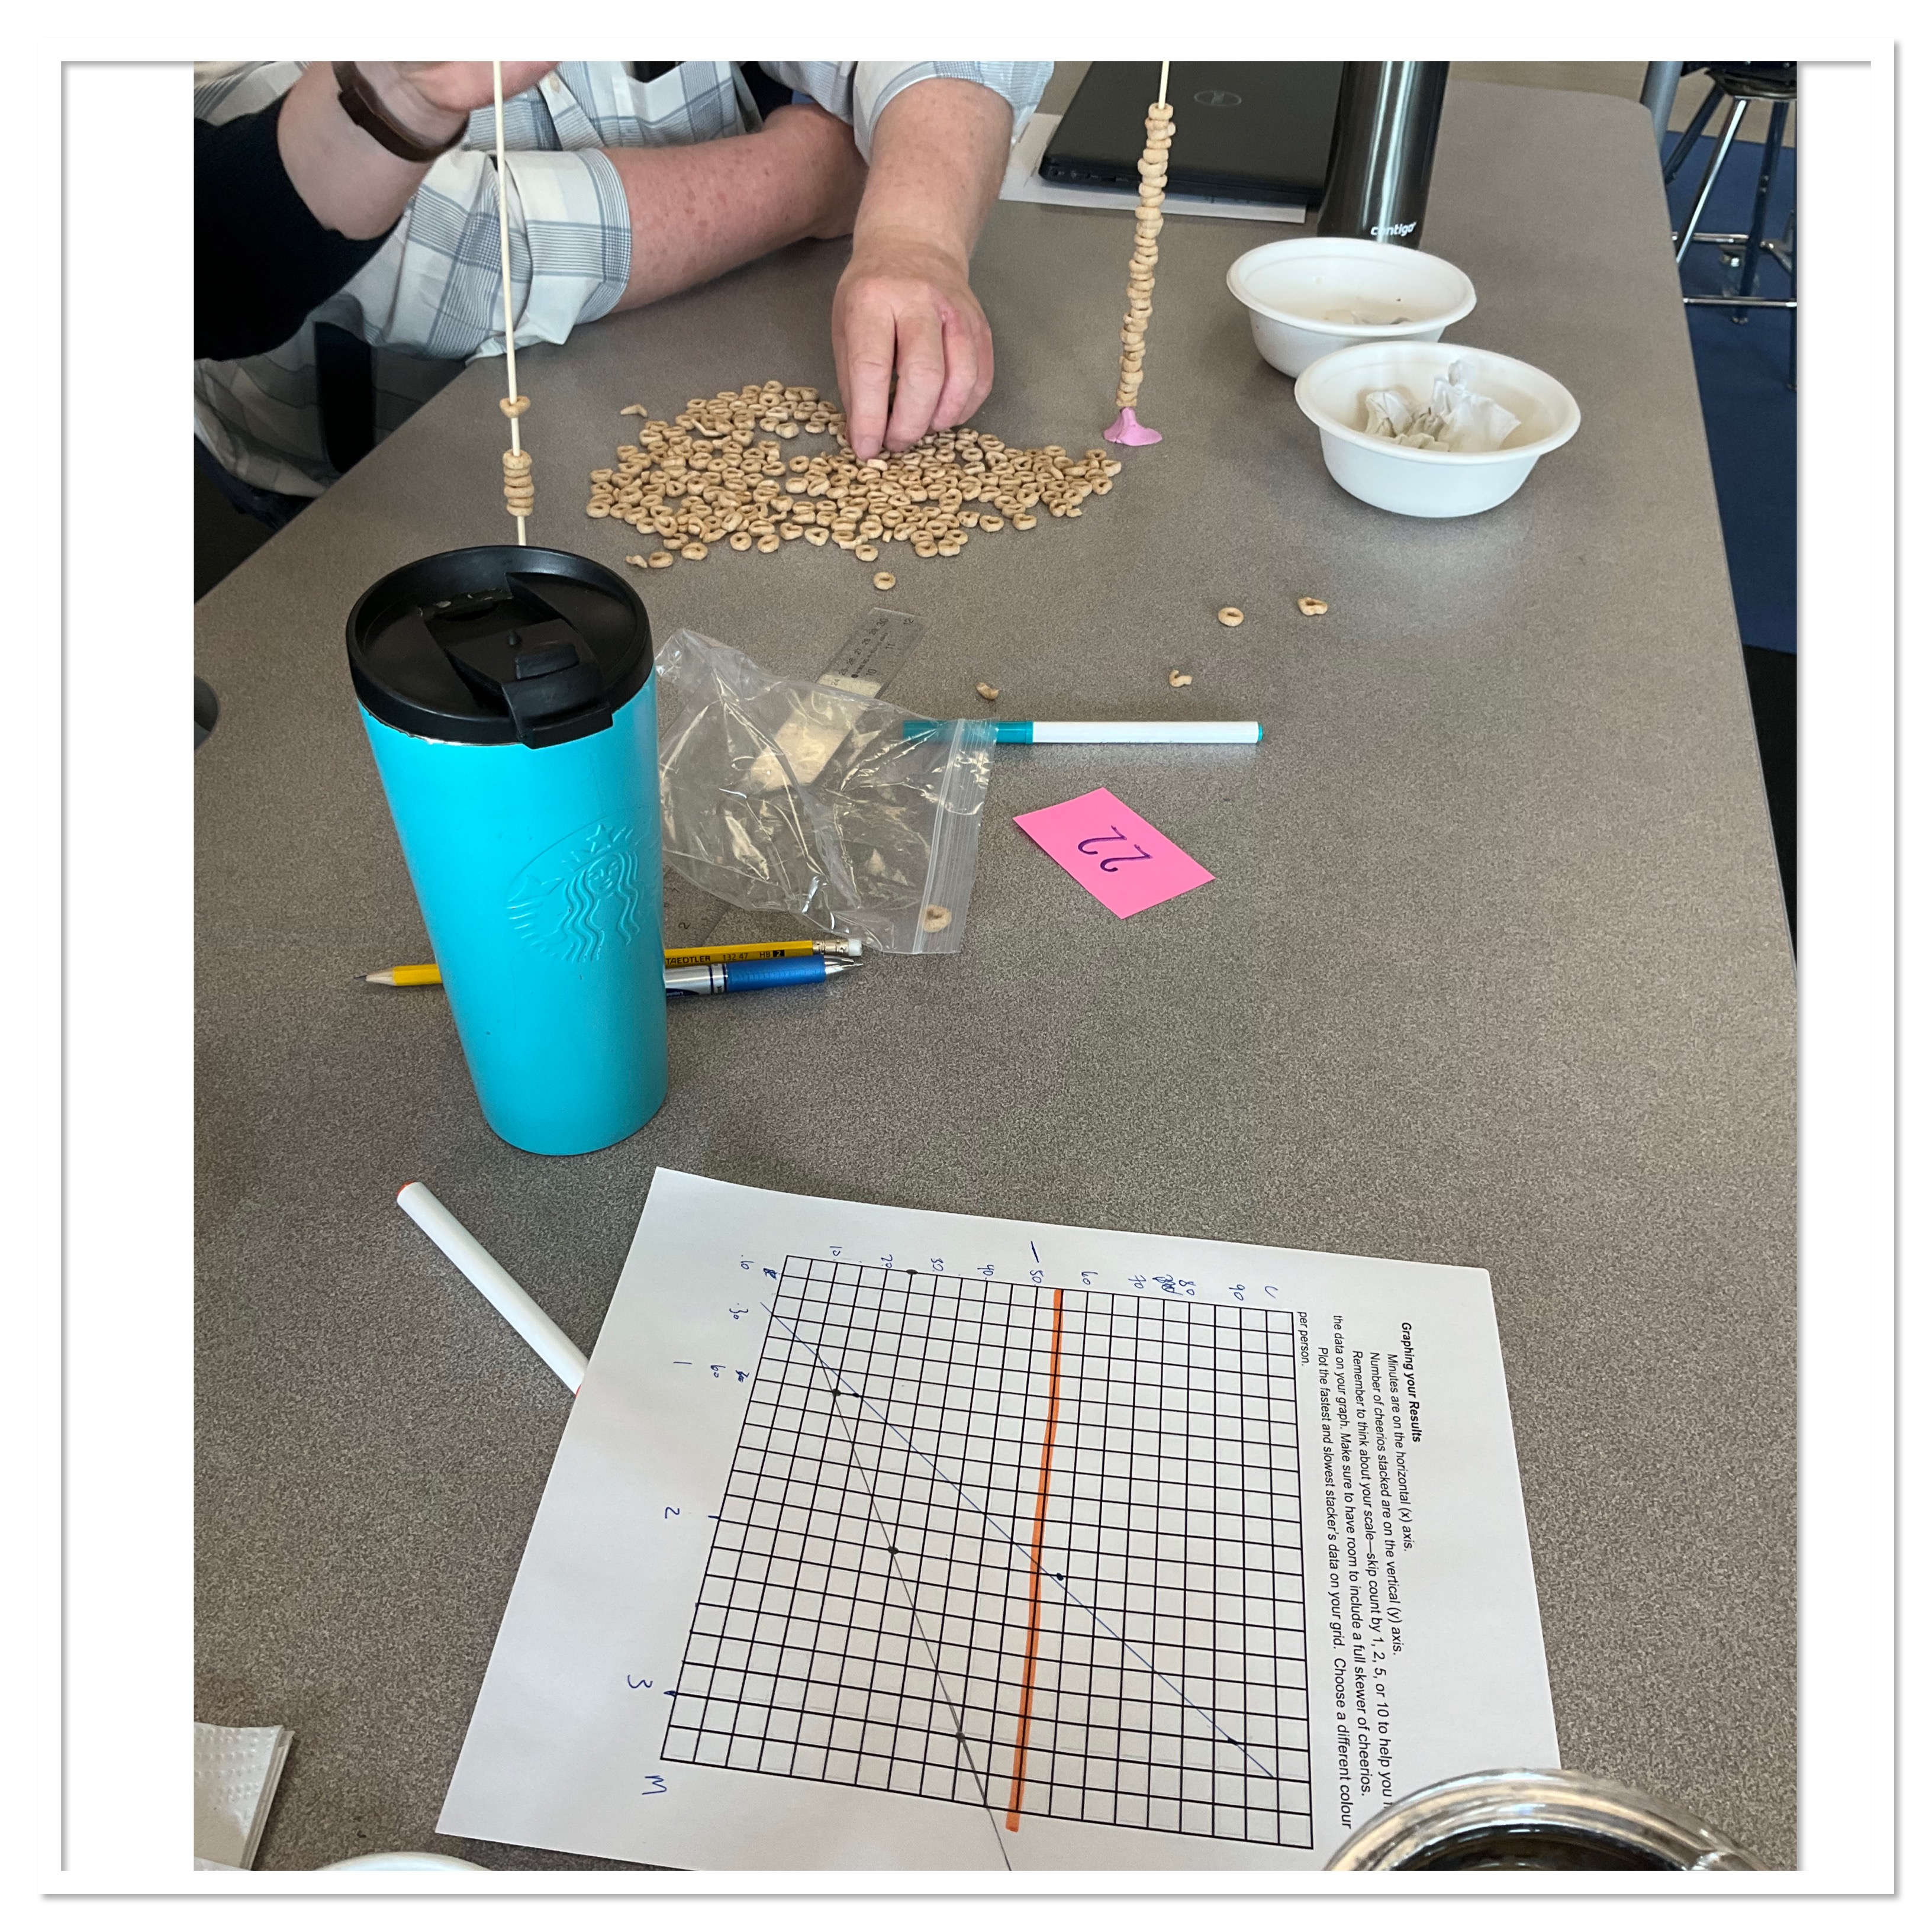
Everyone needed to be timed for a minute of cheerio stacking. Then they predicted how many Cheerios they’d stack for 2 minutes and 3 minutes. Next they graphed the slowest and fastest stackers data.
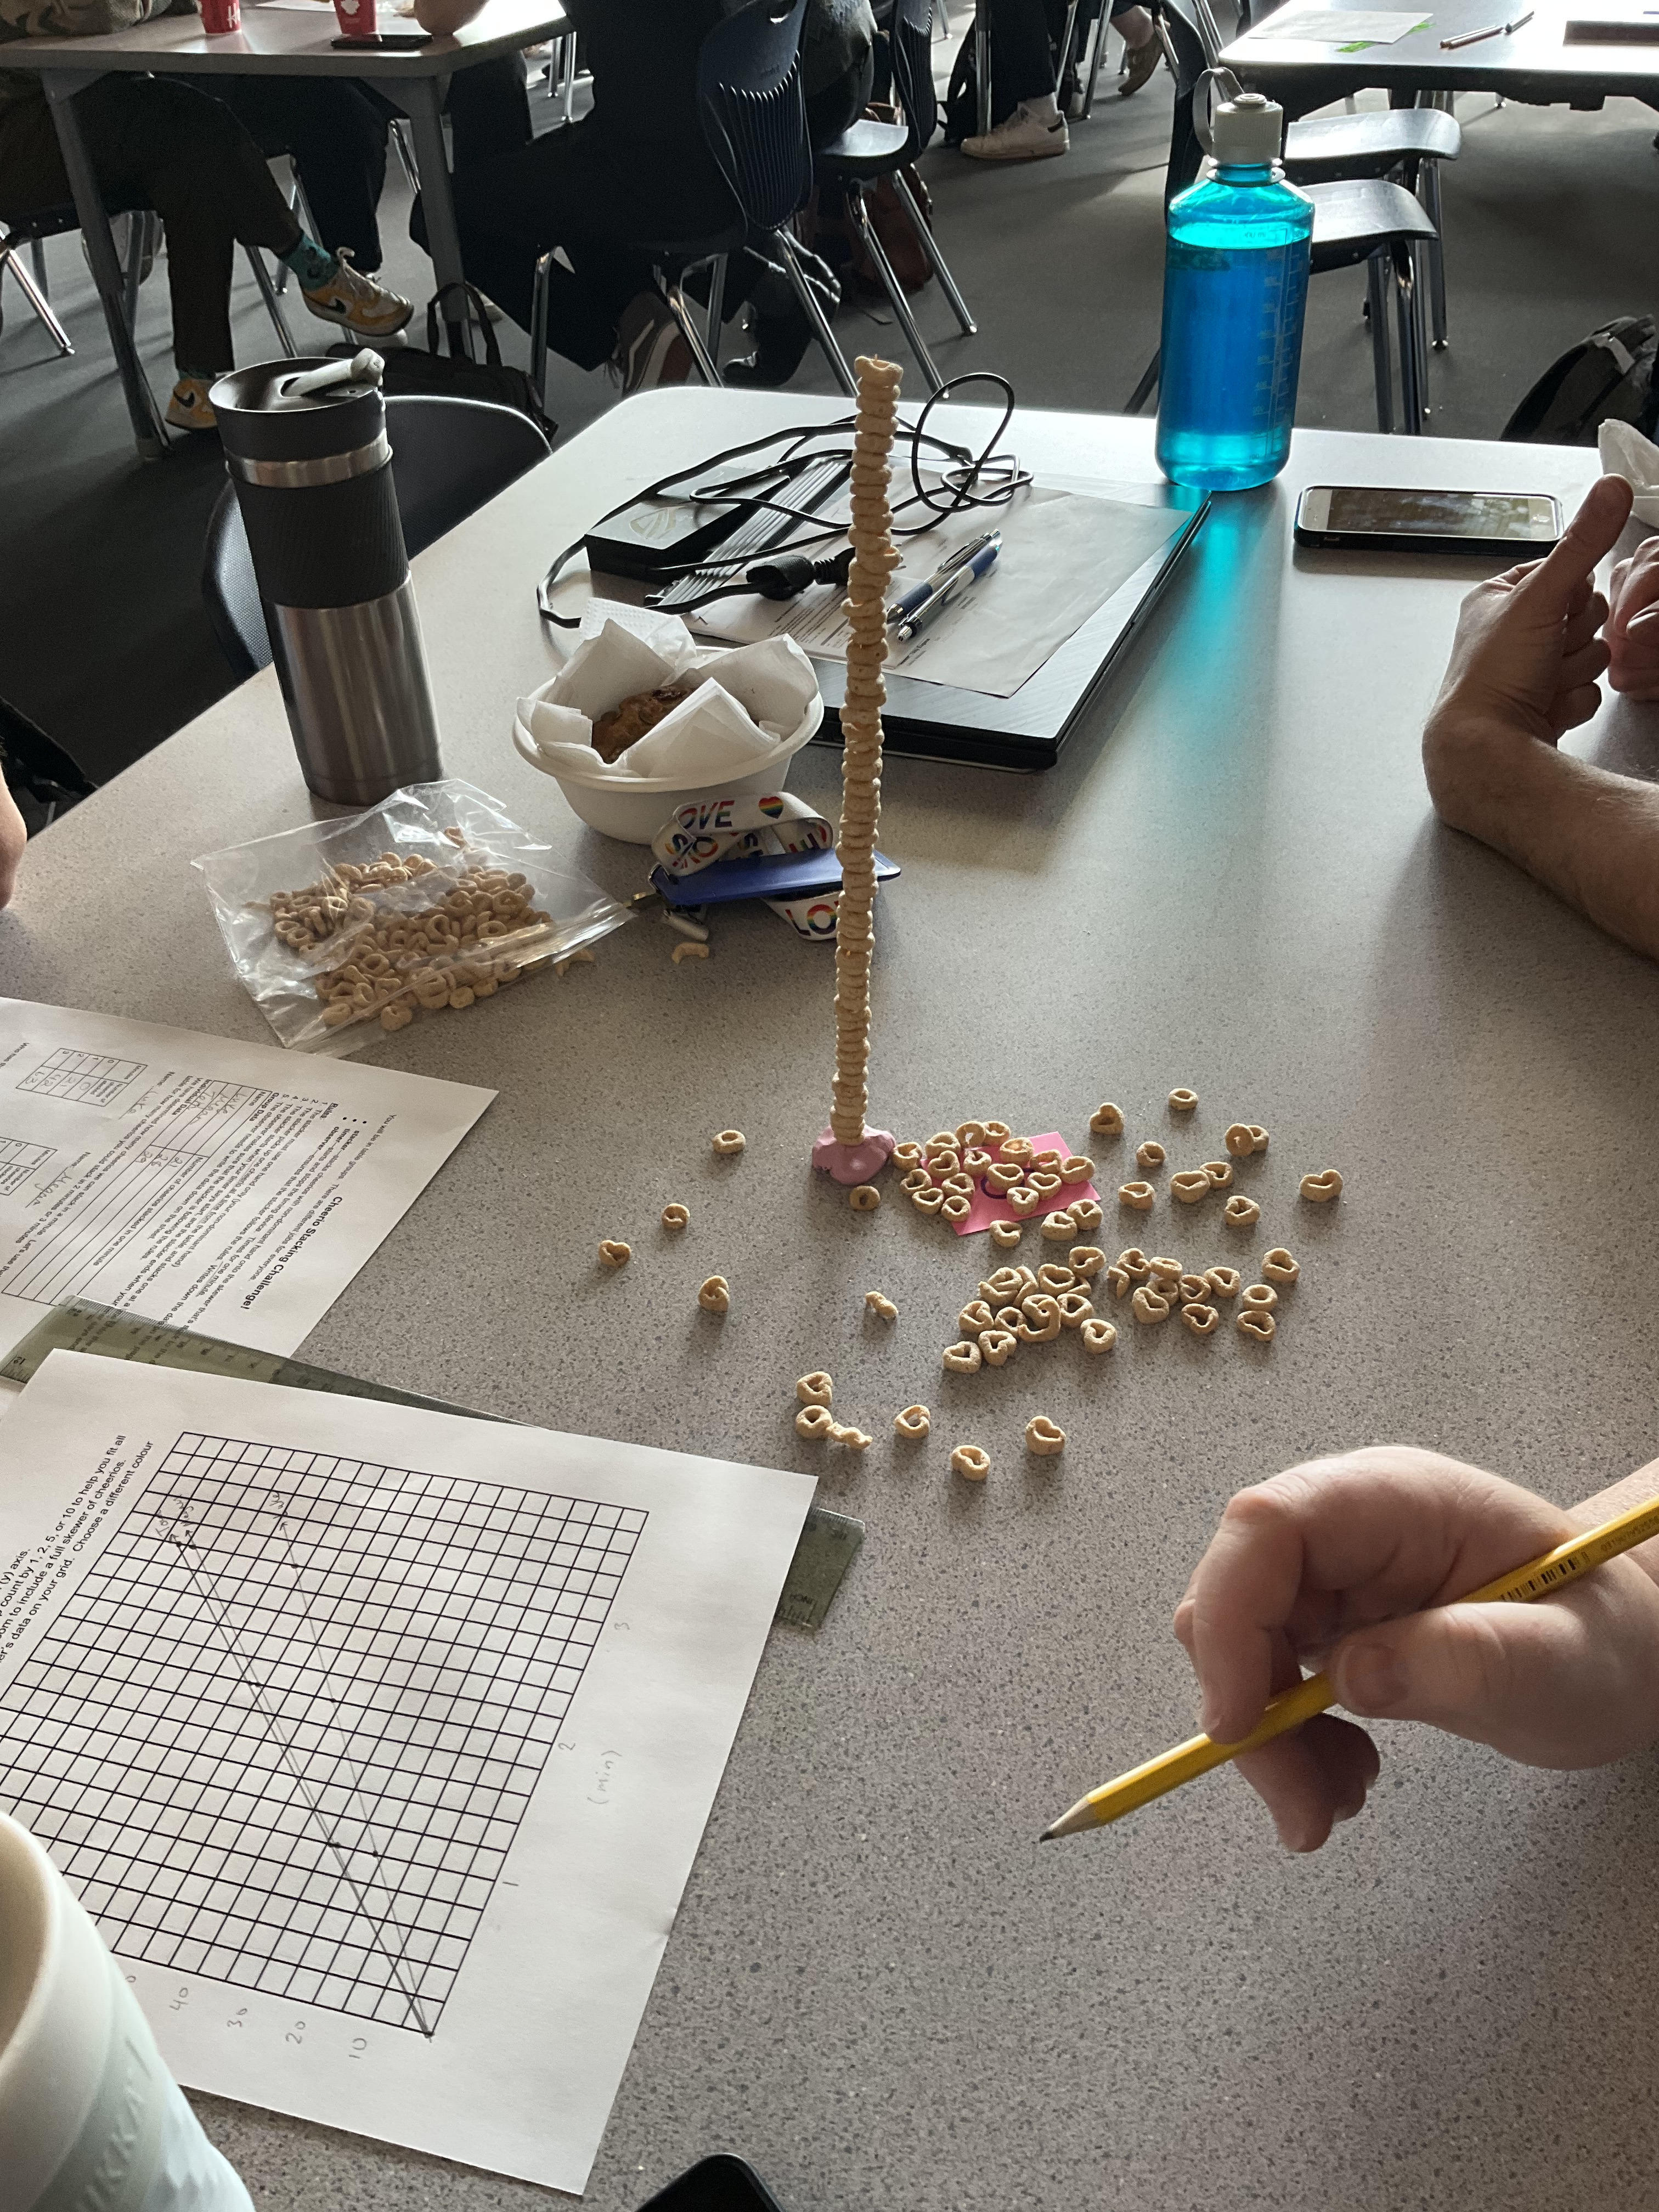
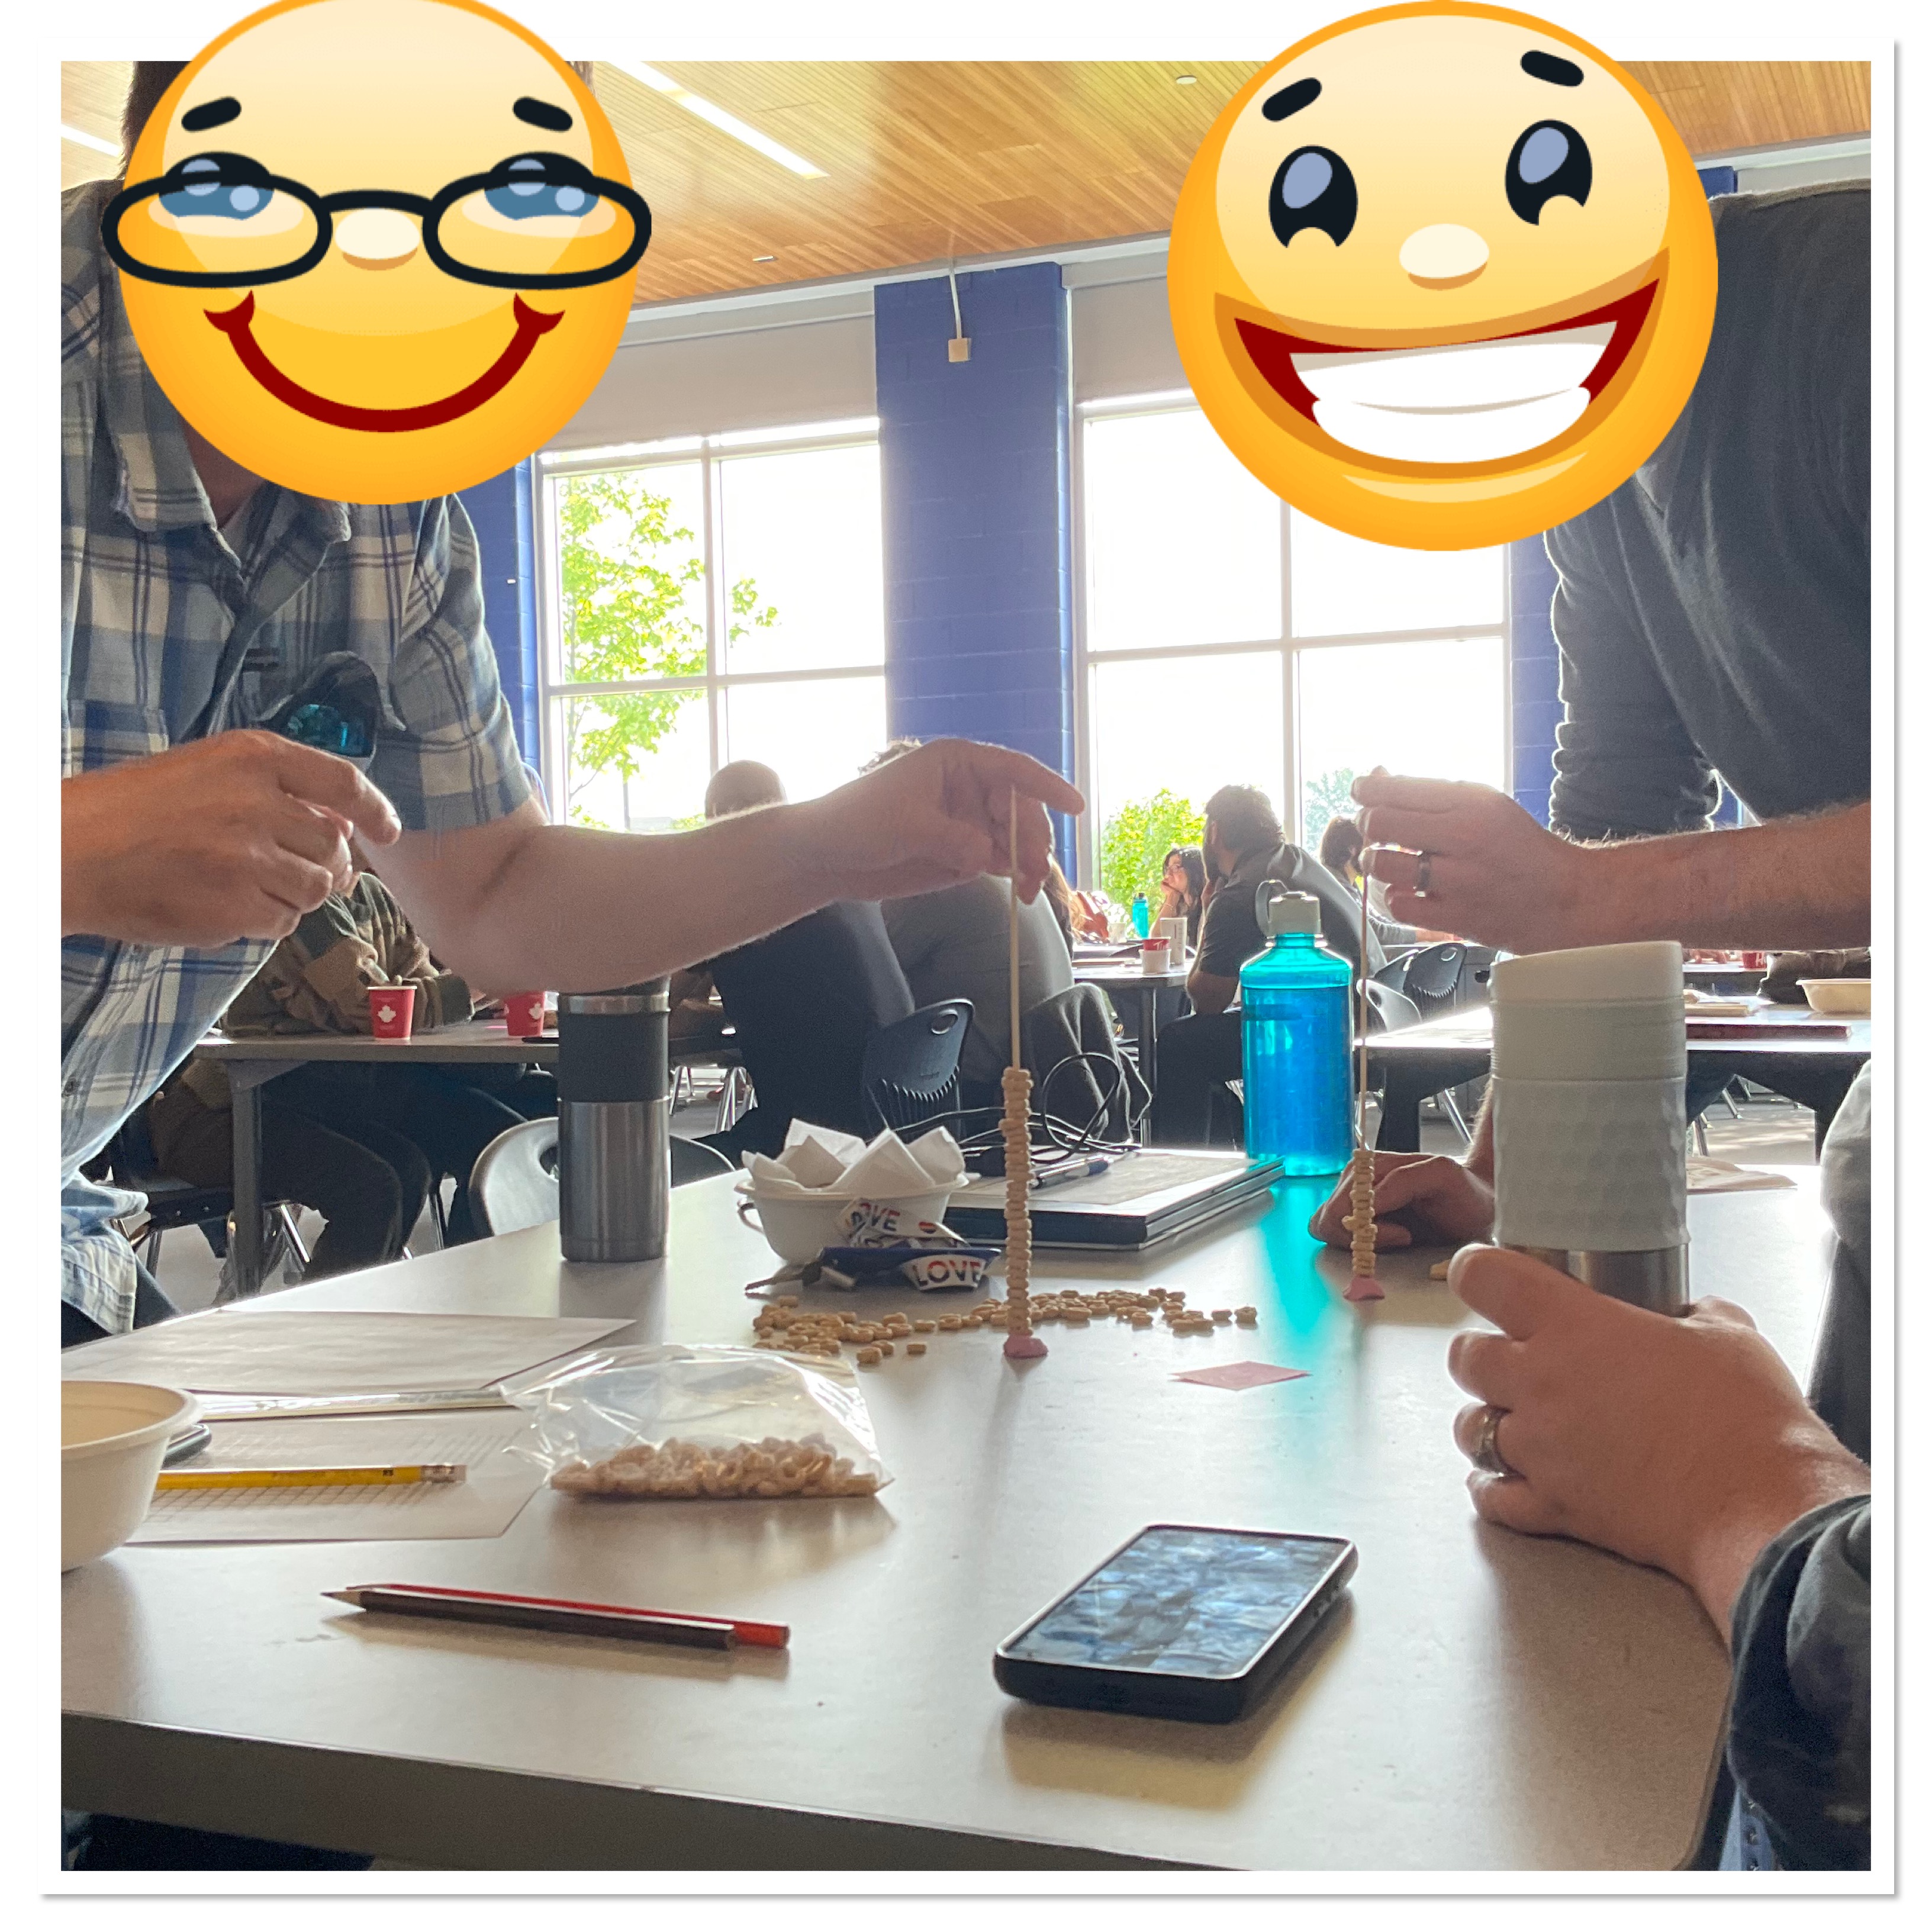
Finally we looked at how to make a photo finish with a full skewer. We looked at how many Cheerios of a head start would be needed to balance the competition, and then we tried to see the photo finish occur.
We had a few epic photo finishes!
Later we spoke to our work to create brave spaces in our classrooms. We gave examples of what we do to create a comfortable space for students to try new things. We showed an example of a dot talk, and had lots of great interaction and participation from our staff.

we talked about our first week in grade 9, and how we introduce thinking routines, and communication structures, and explicit discussion of mindset which will continue through the year.
Here’s the slide deck if you are interested.
How Many High Fives?
Today in grade 10 we explored how many unique high fives there were in the room. We defined a high five as unique when person A high fives with person B. If Person B then high fives person A it doesn’t count.
Some groups got right to making tables. We had 15 people in the room today.
Once the situation was explored and understood, we clarified thar one could not high five themself…that’s called clapping… we kept working on the problem.
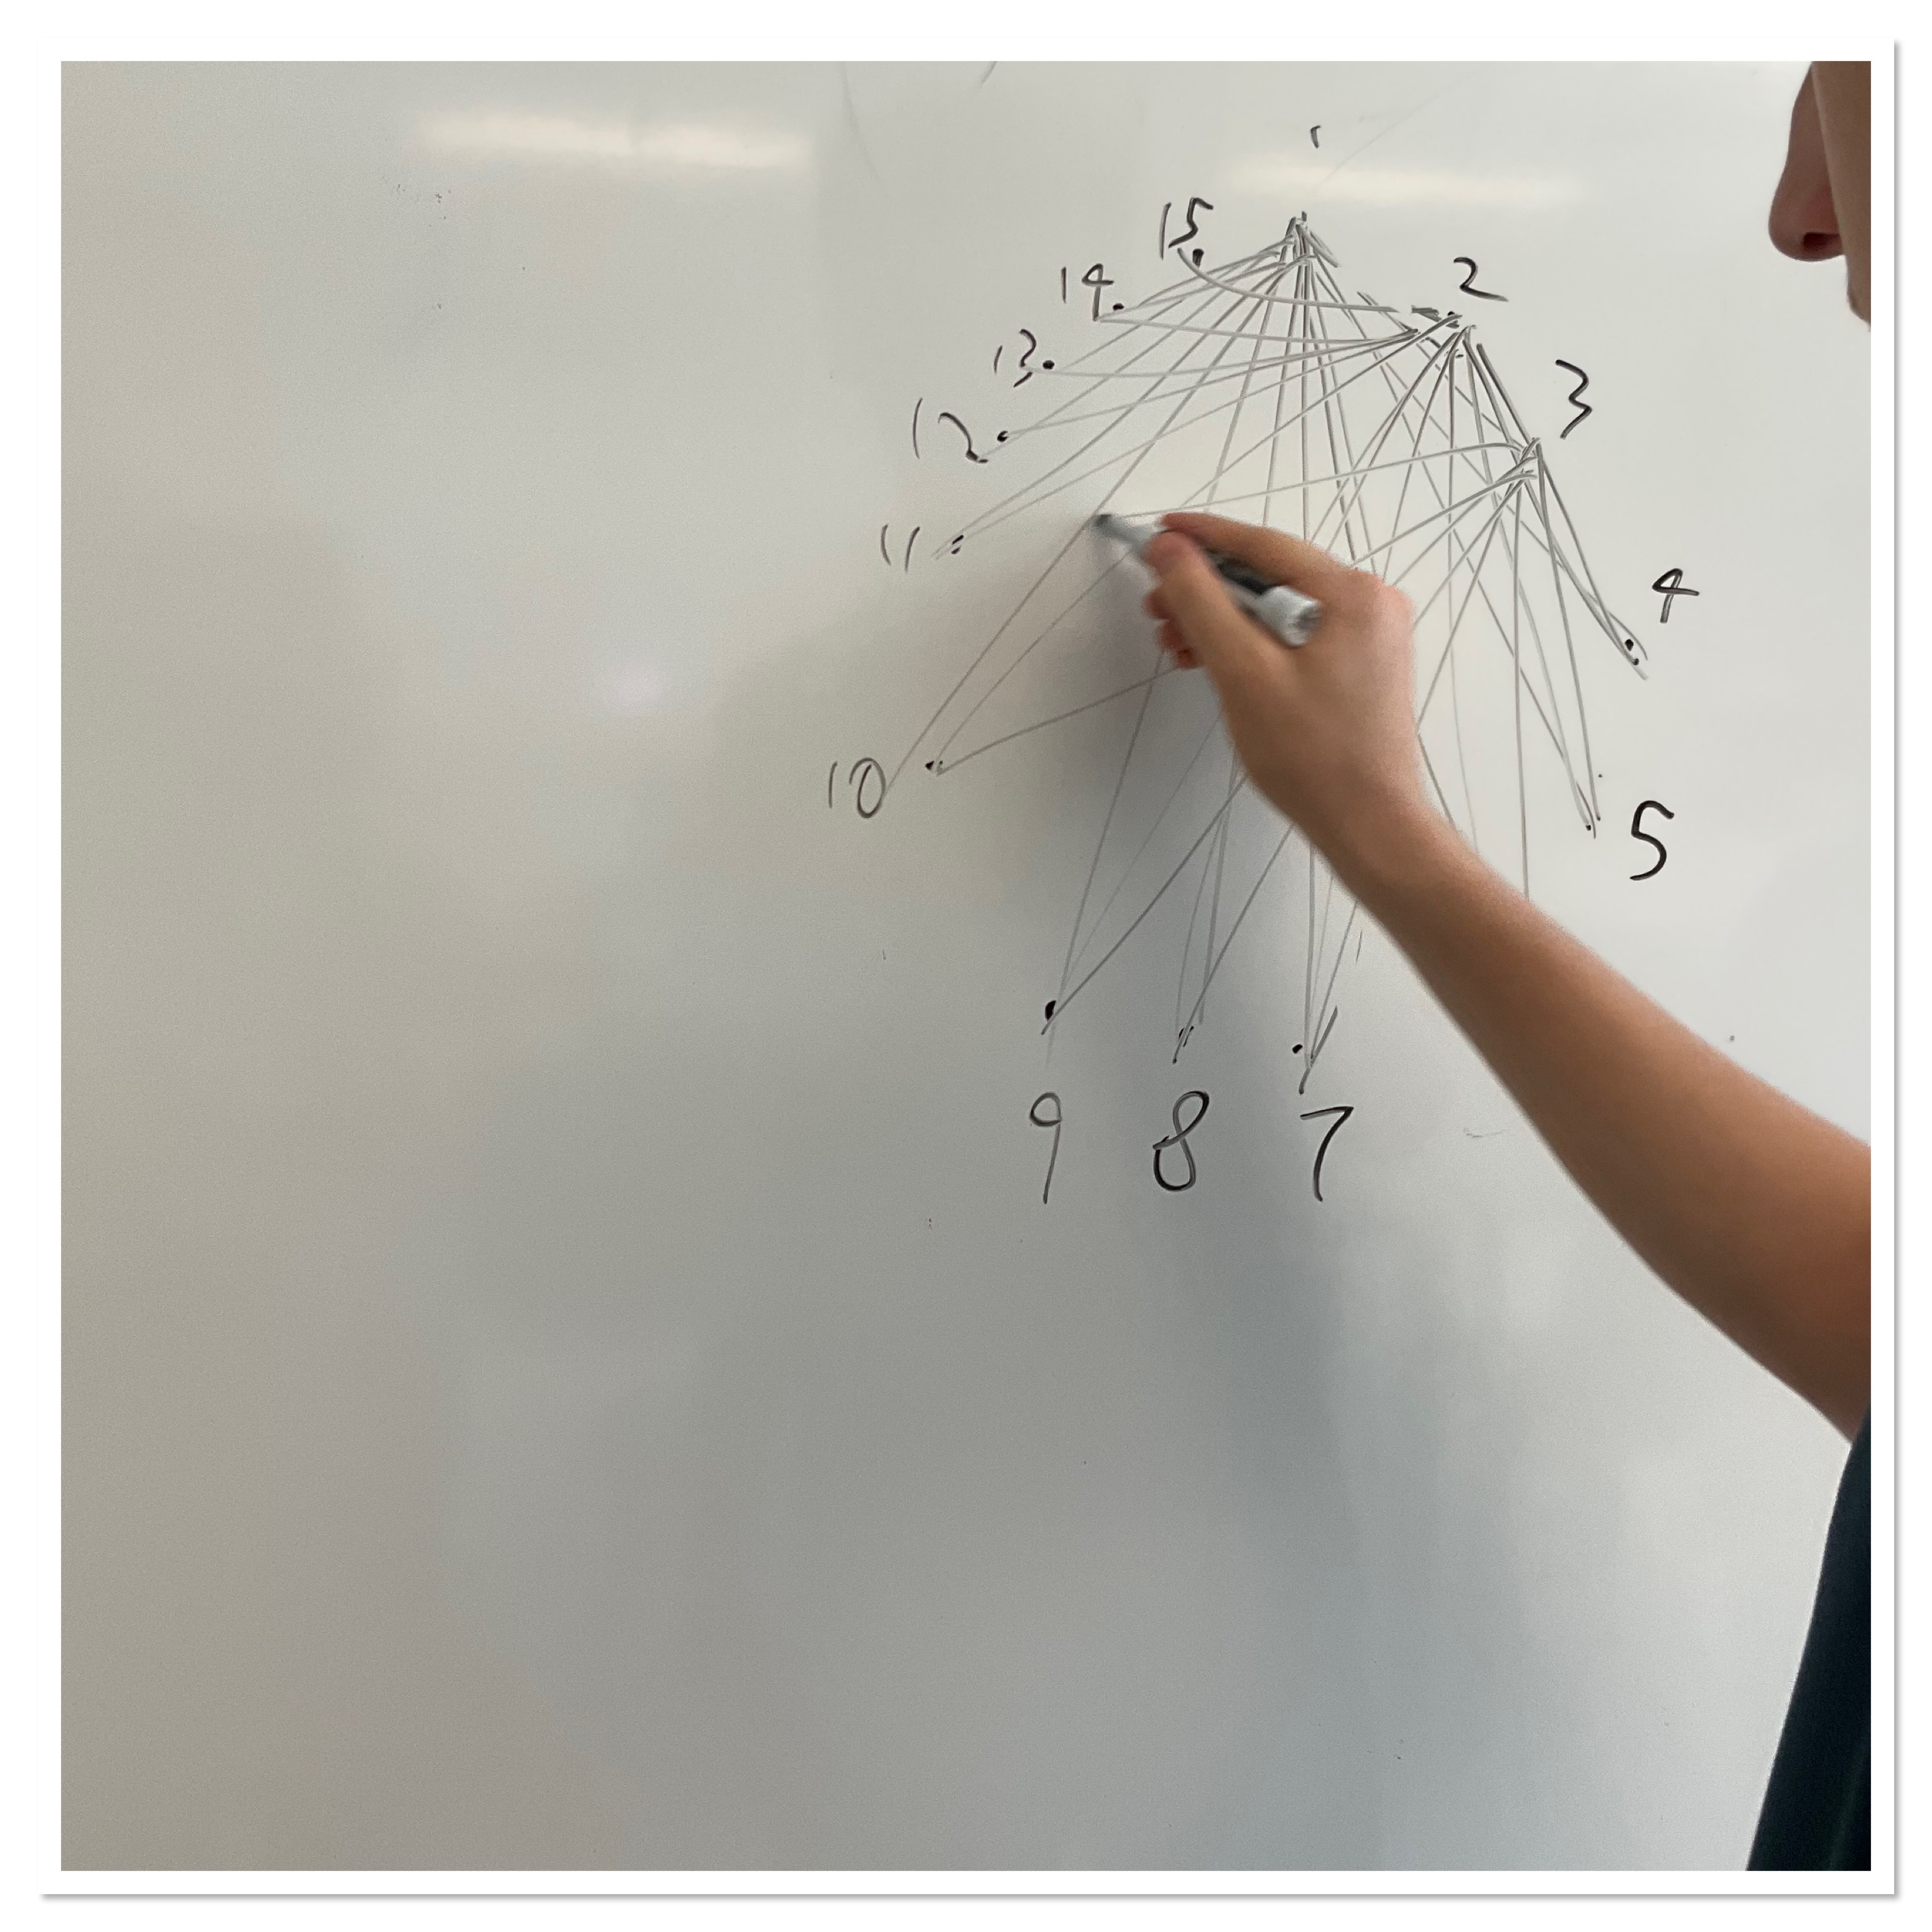
some groups drew it in pictures. Each line represents a high five.
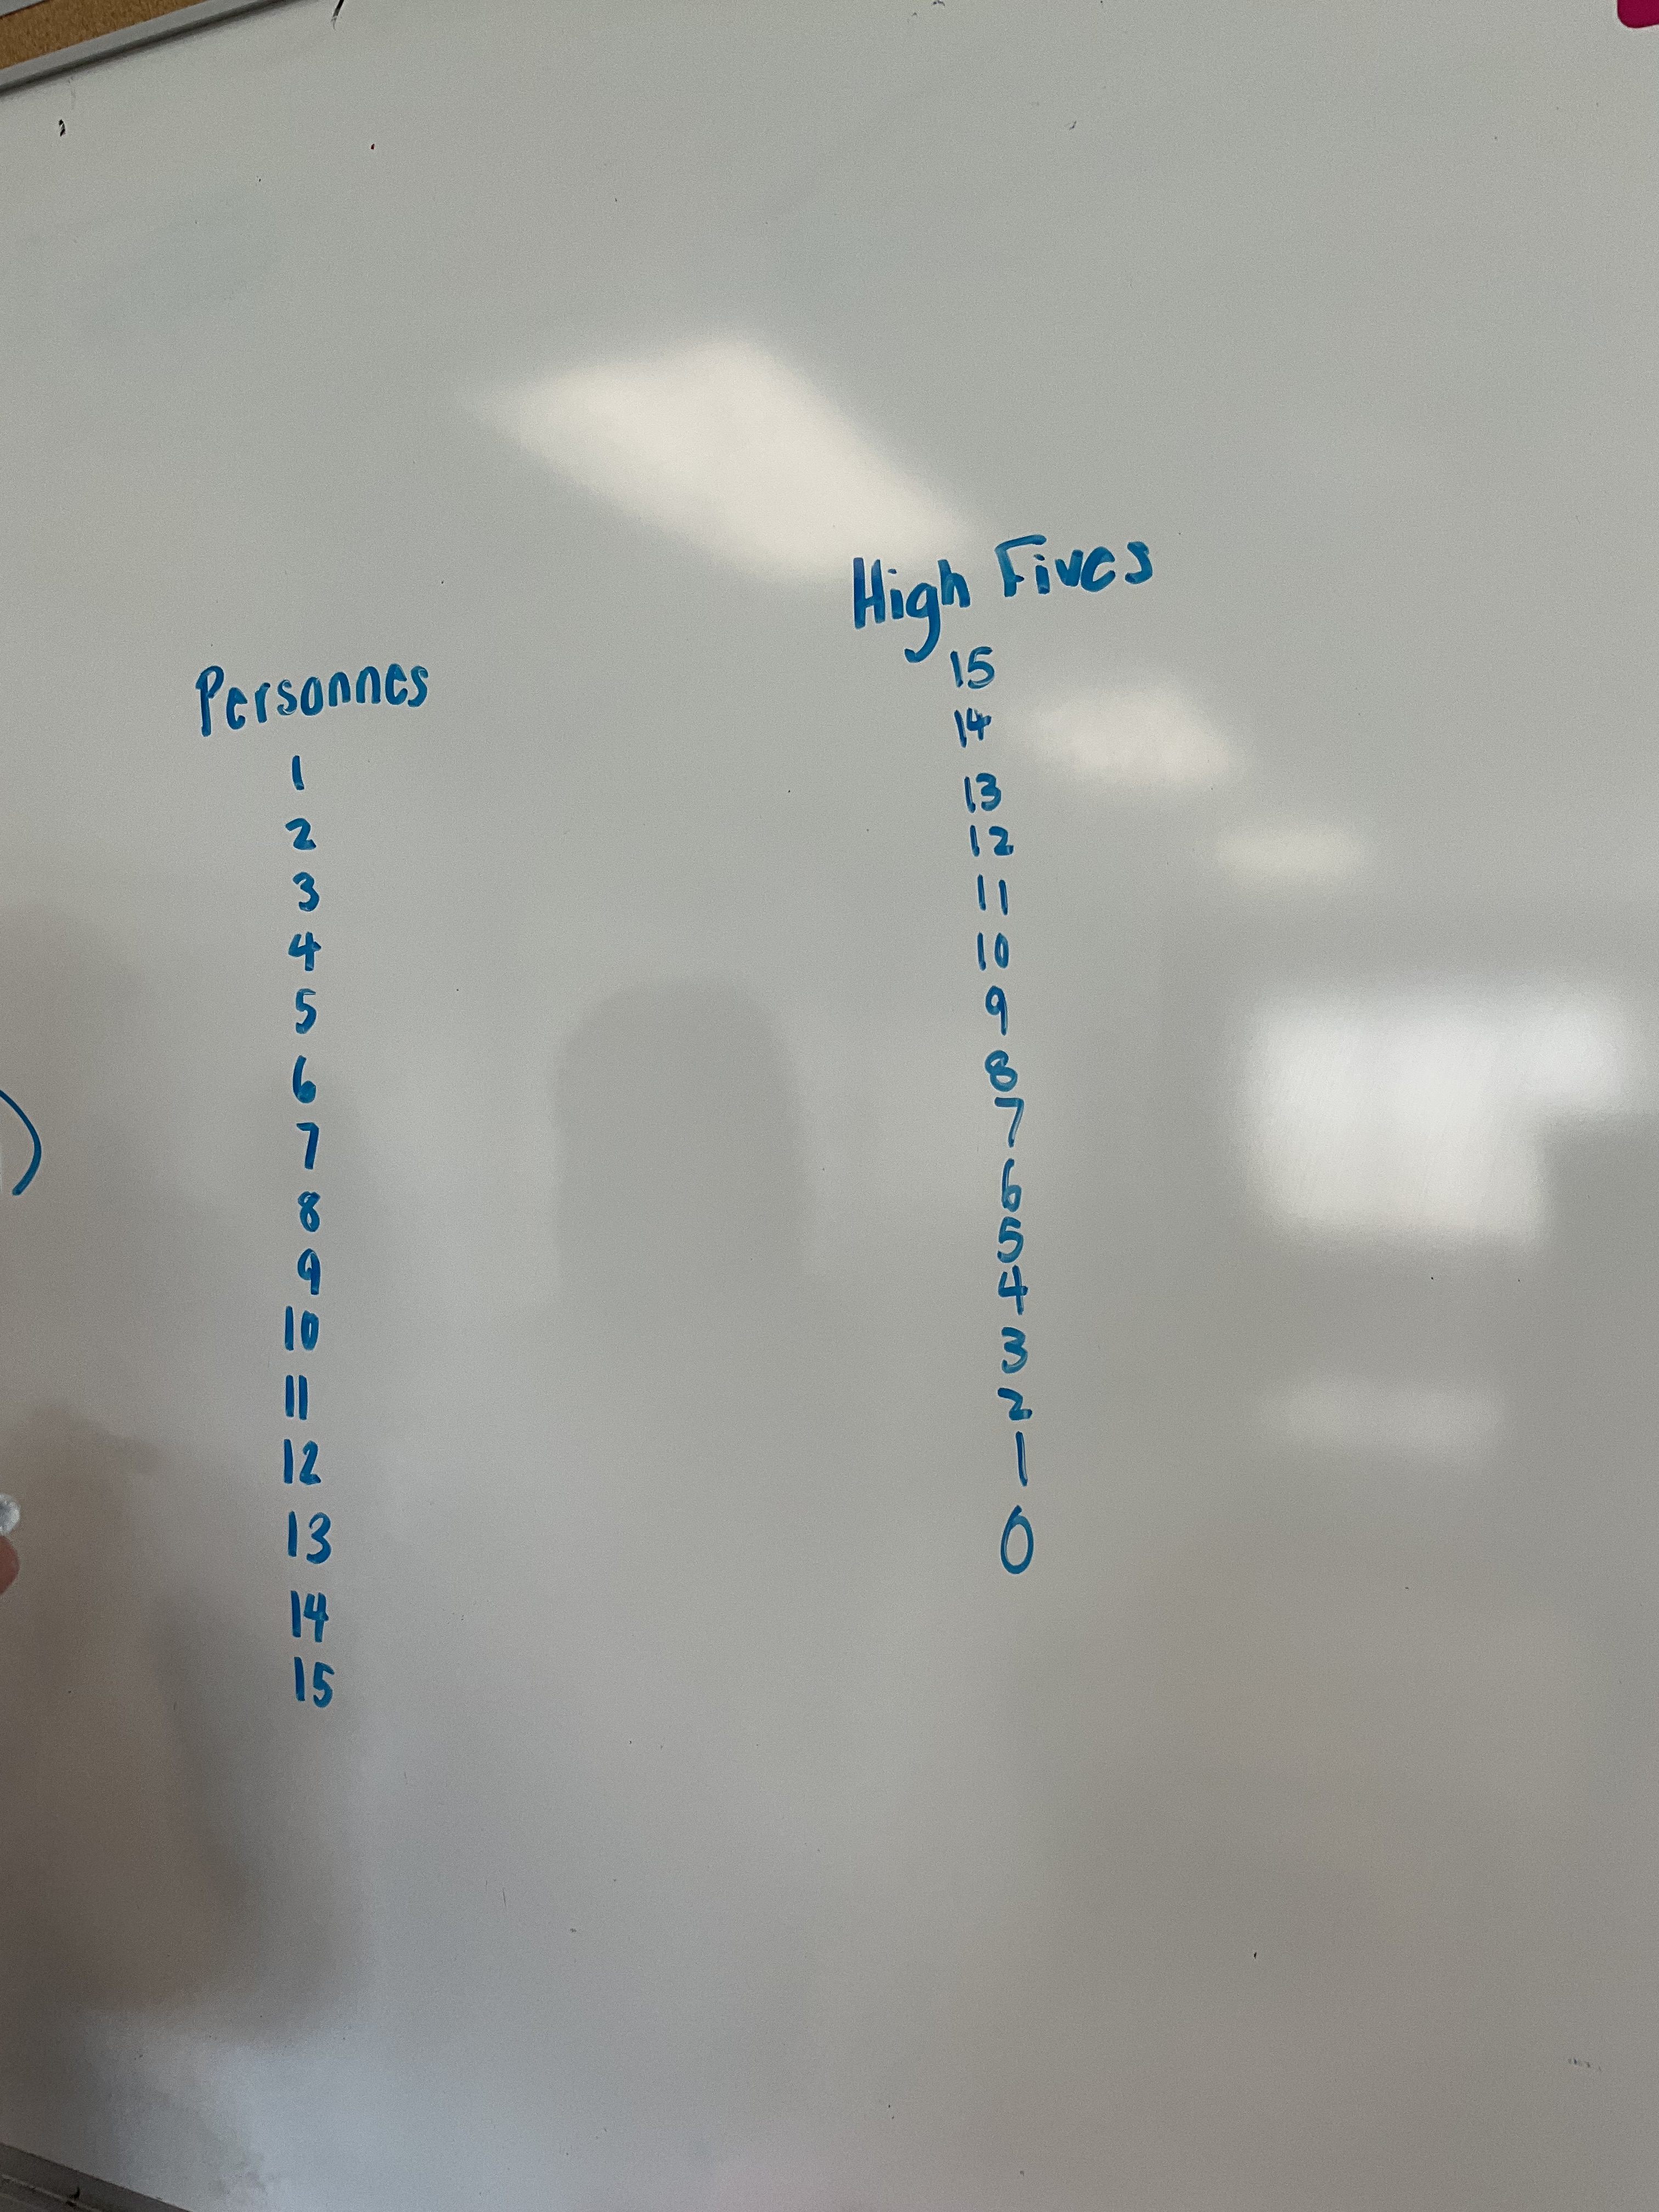
Other groups wrote out all the high fives that would happen in a list, then totalled them up.
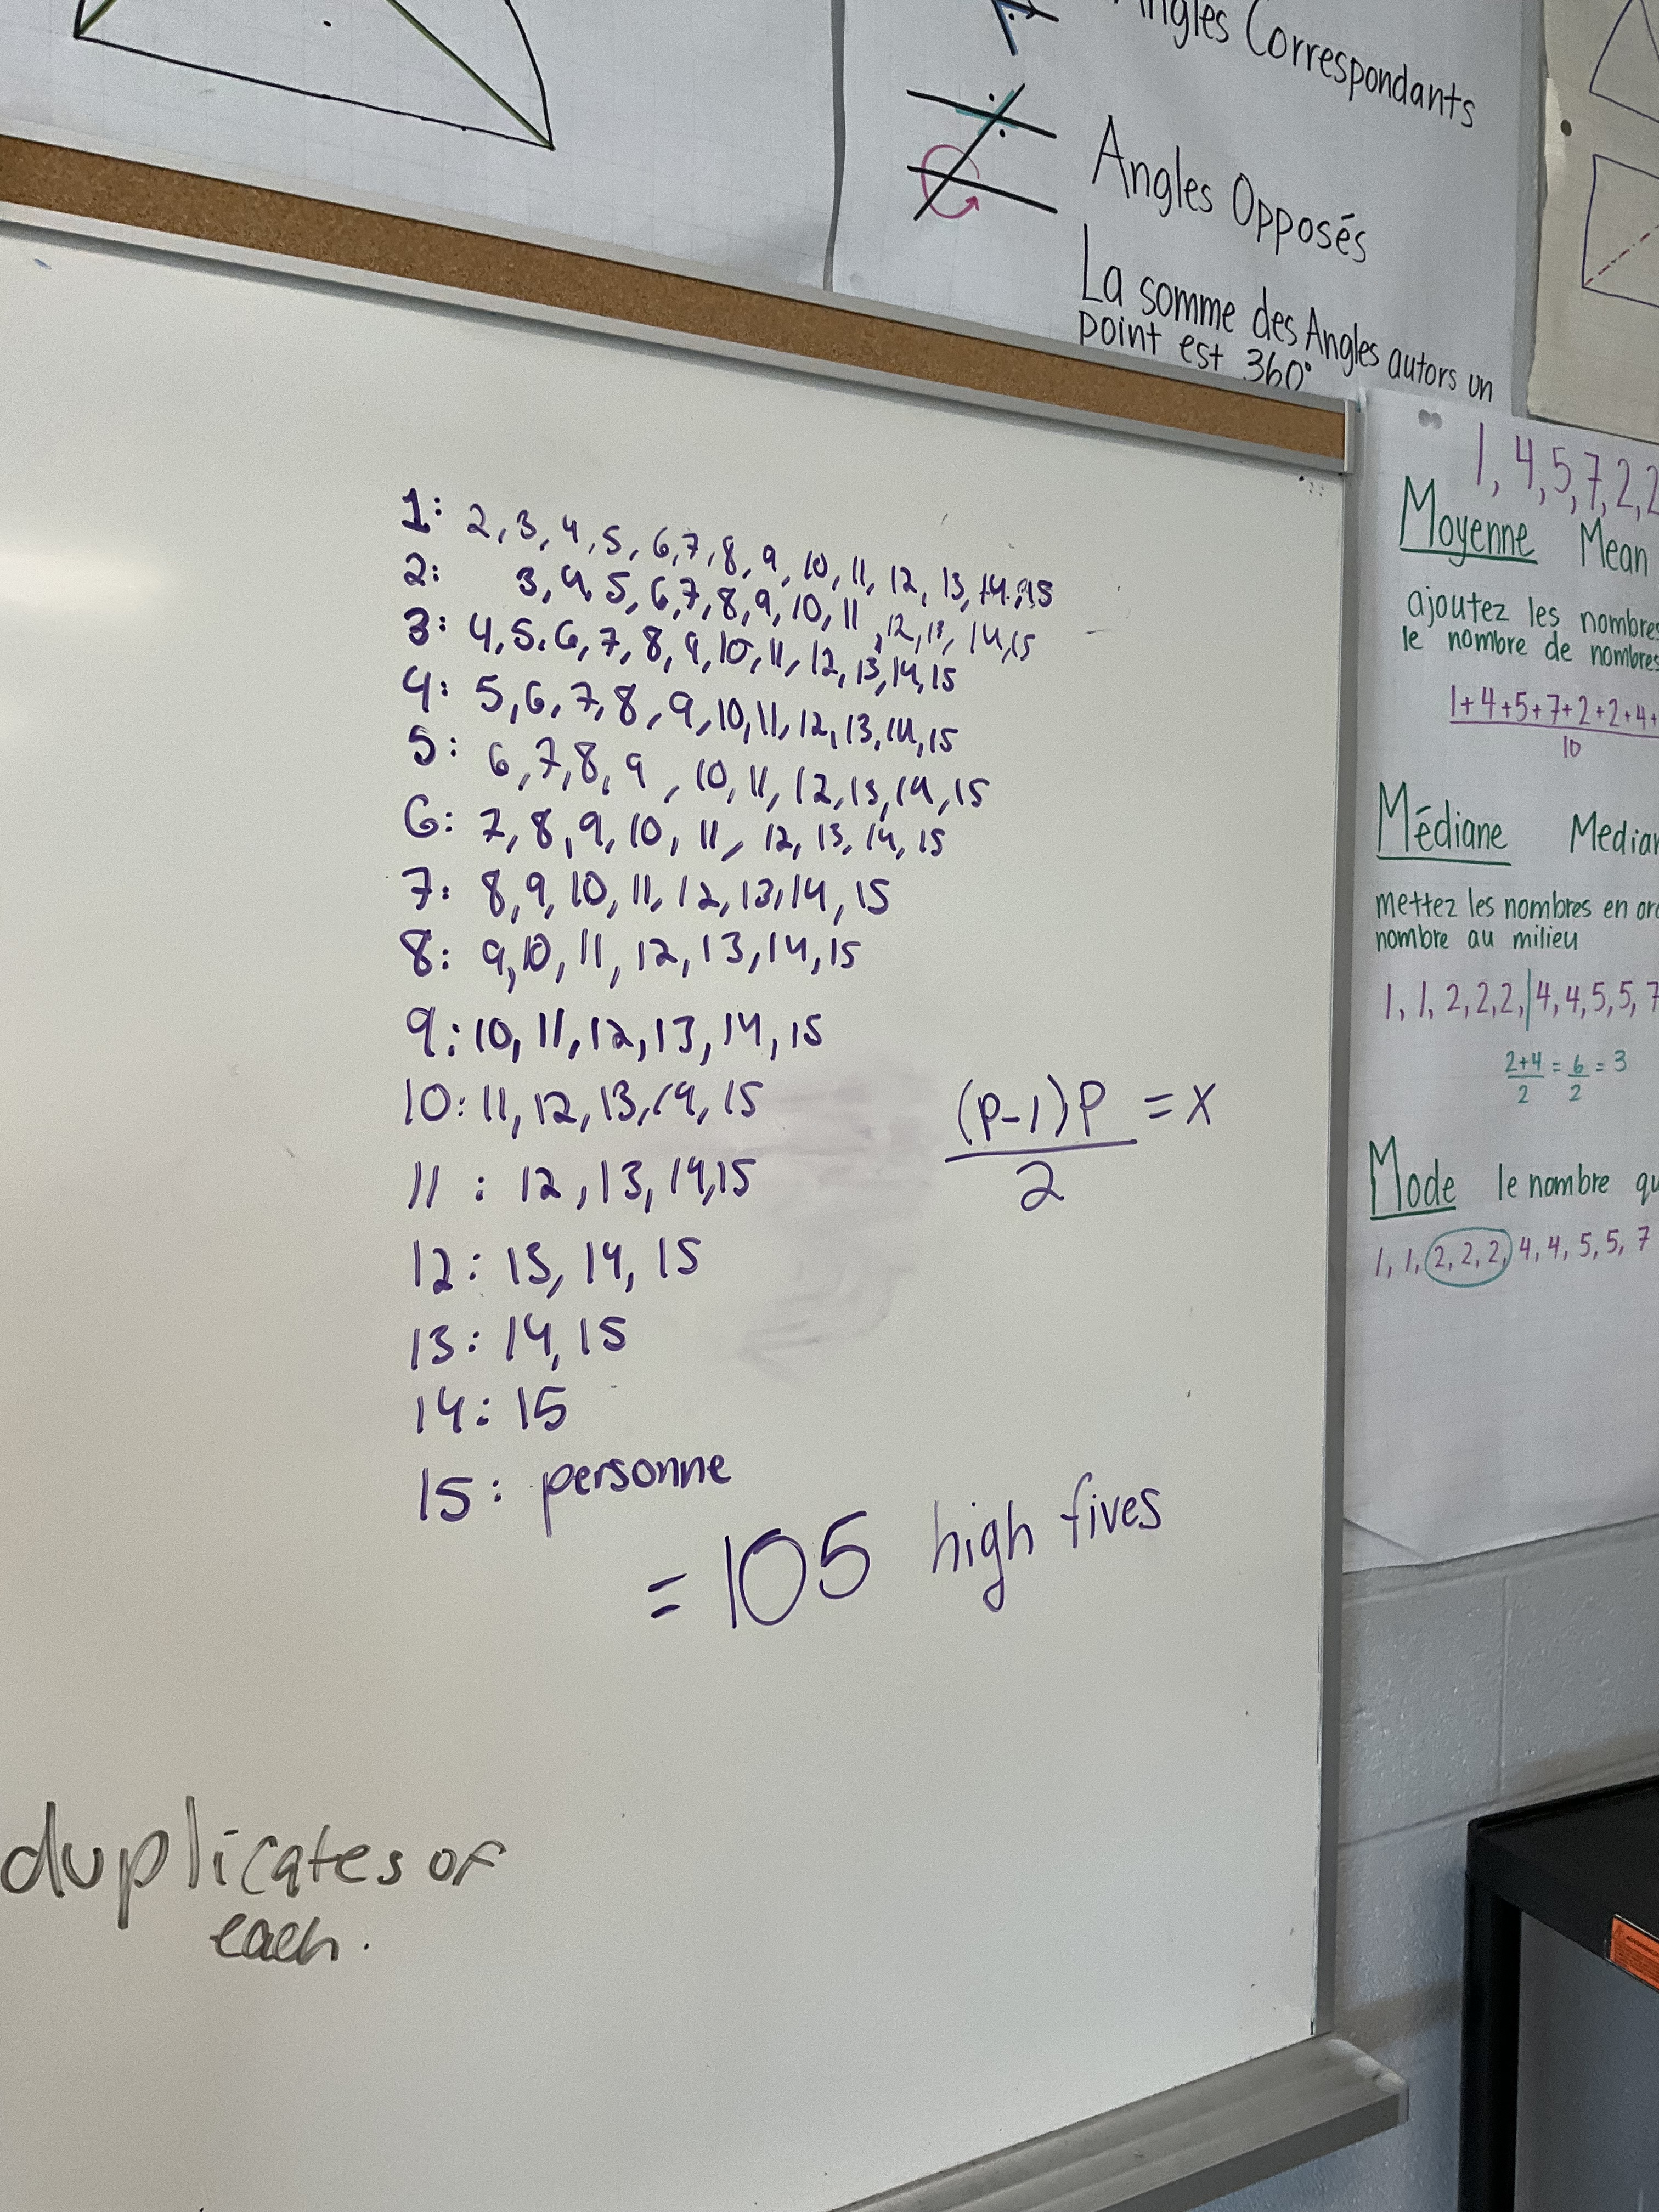
They noticed some patterns, and were able to make an equation for the pattern.
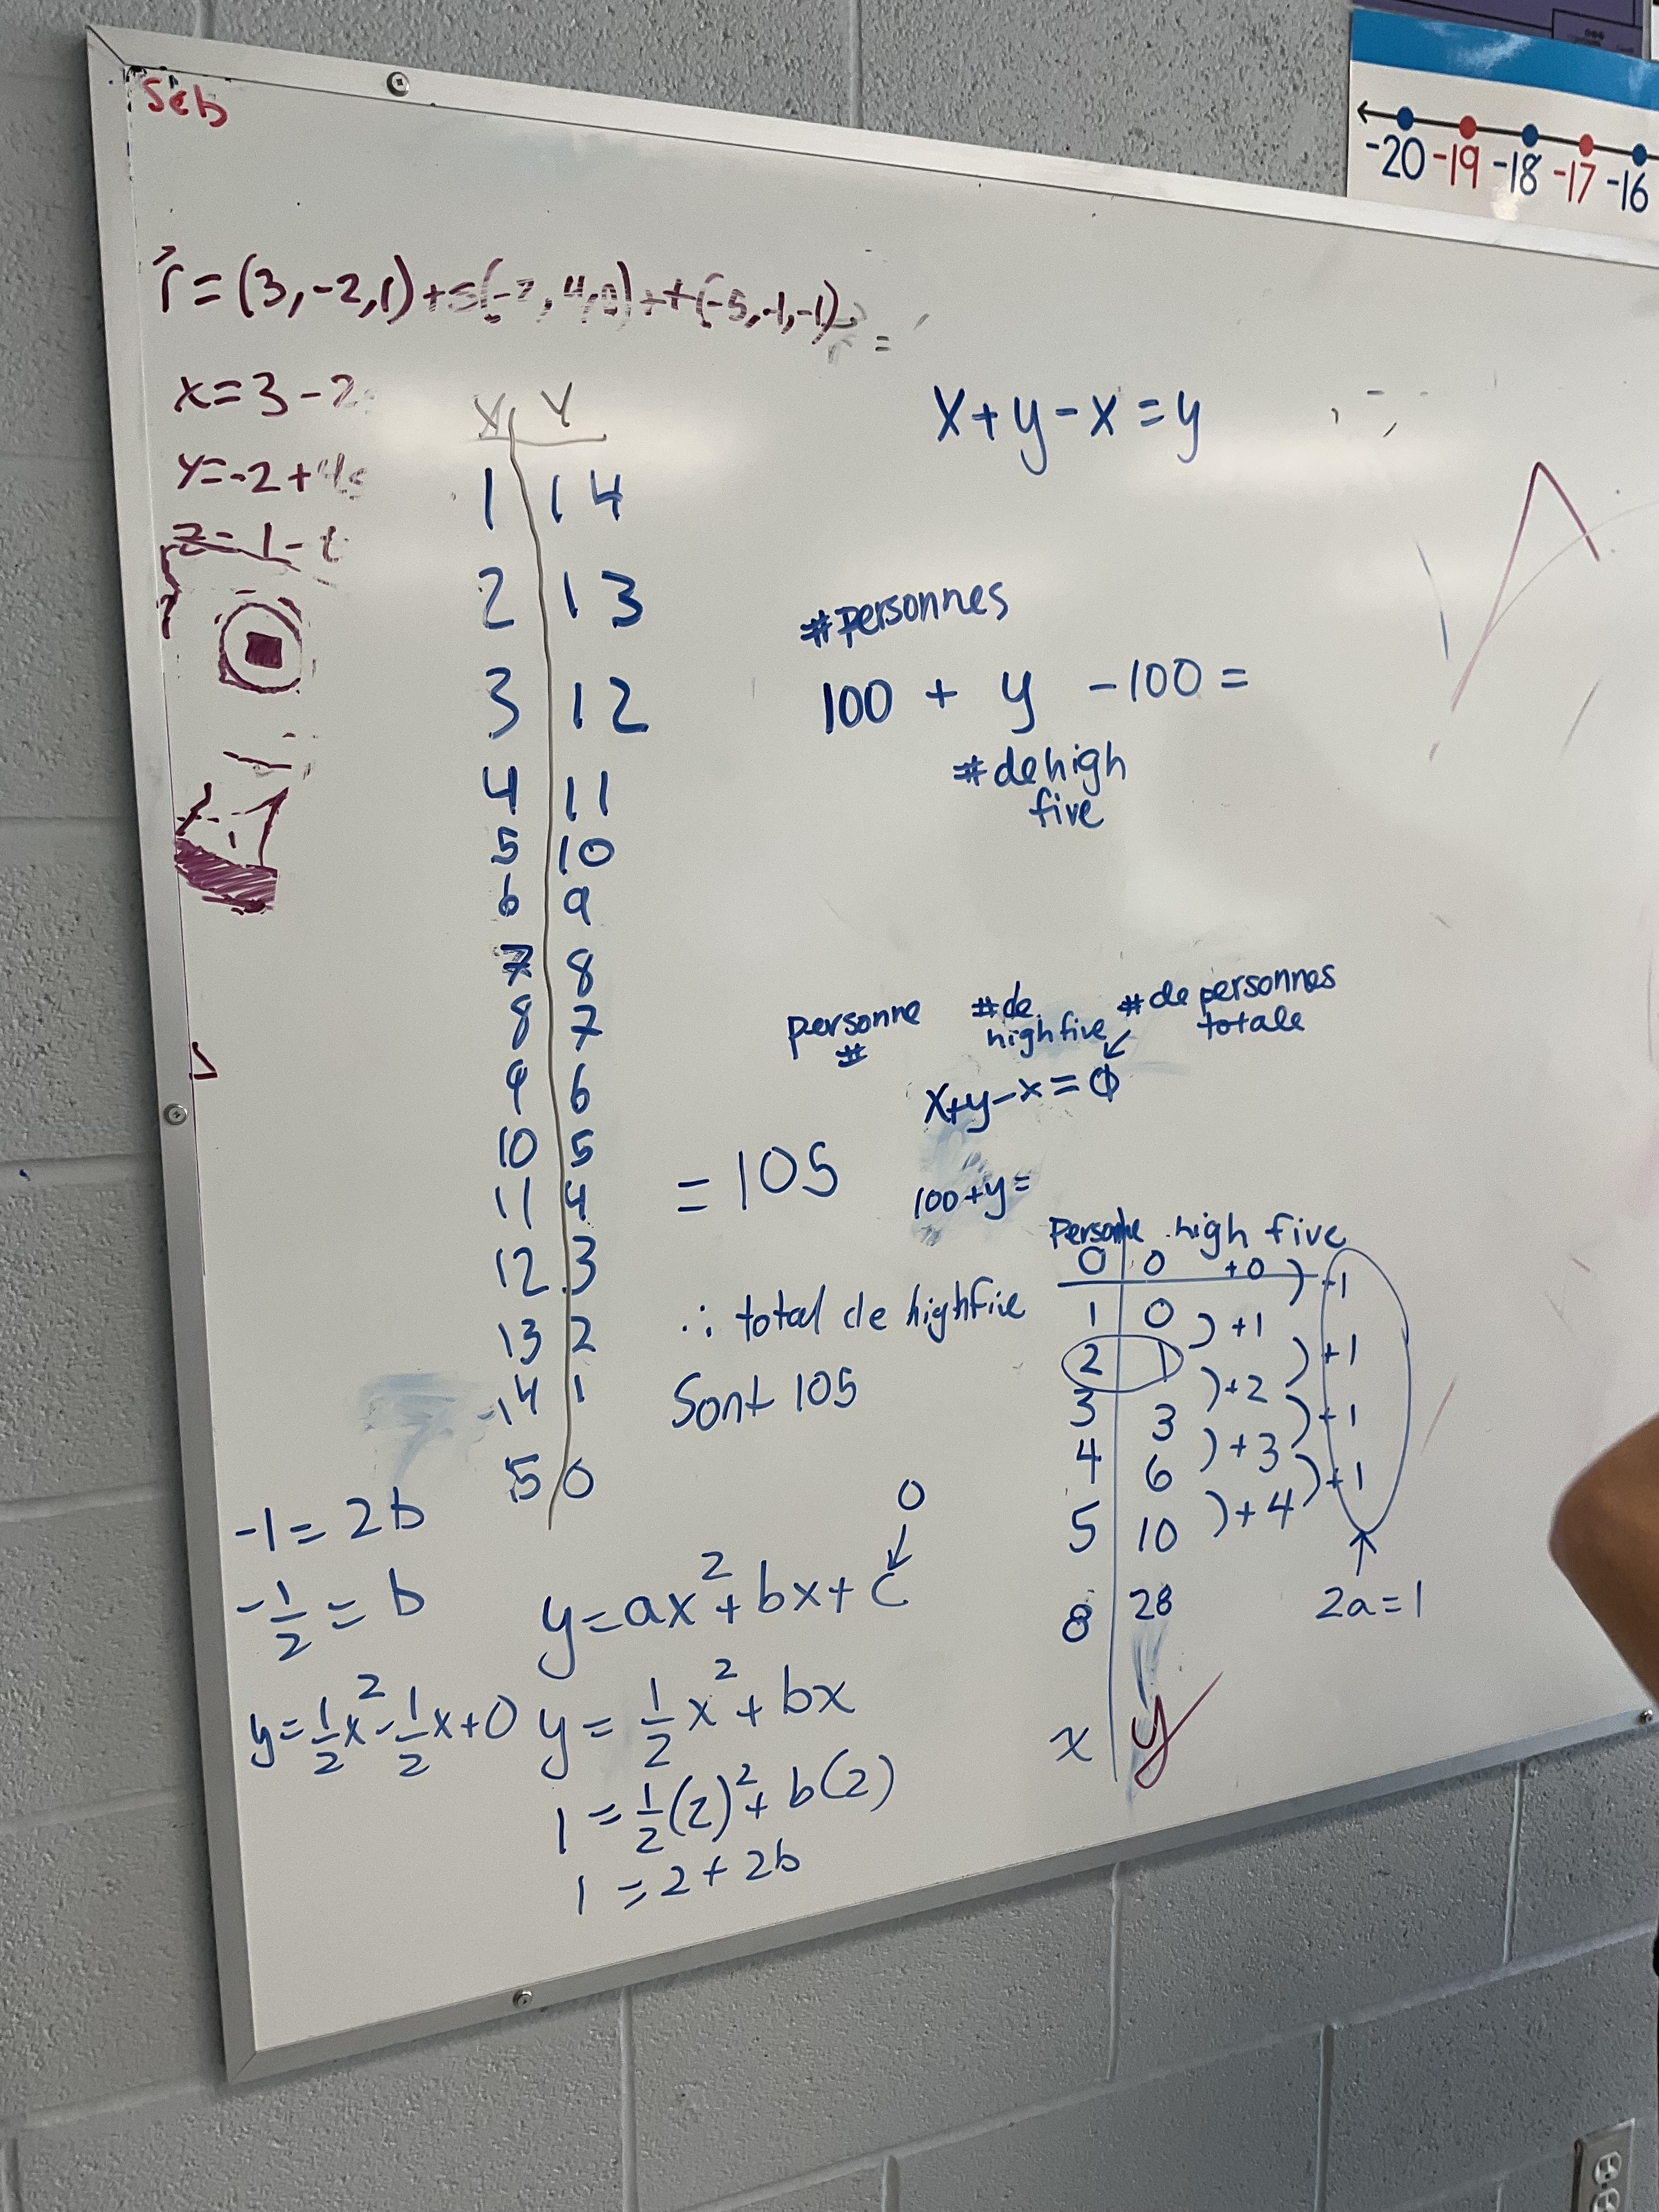
Another group modelled what would happen with a small group. We know that with 1 person there are no high fives, and with 2 people there is 1, and with 3 people there are 3, and with 4 there are 6. We kept adding more people to the group and they did the high fives and counted. Eventually a pattern was noticed, and identified as quadratic since the 2nd differences are all 1.
Some new learning today is that the “a” value is going to be half of the common 2nd difference.
The table could be extended backward to find the constant, c, 0 persons have 0 high fives, so the constant is 0. Next a point was subbed in for x and y and b was calculated.
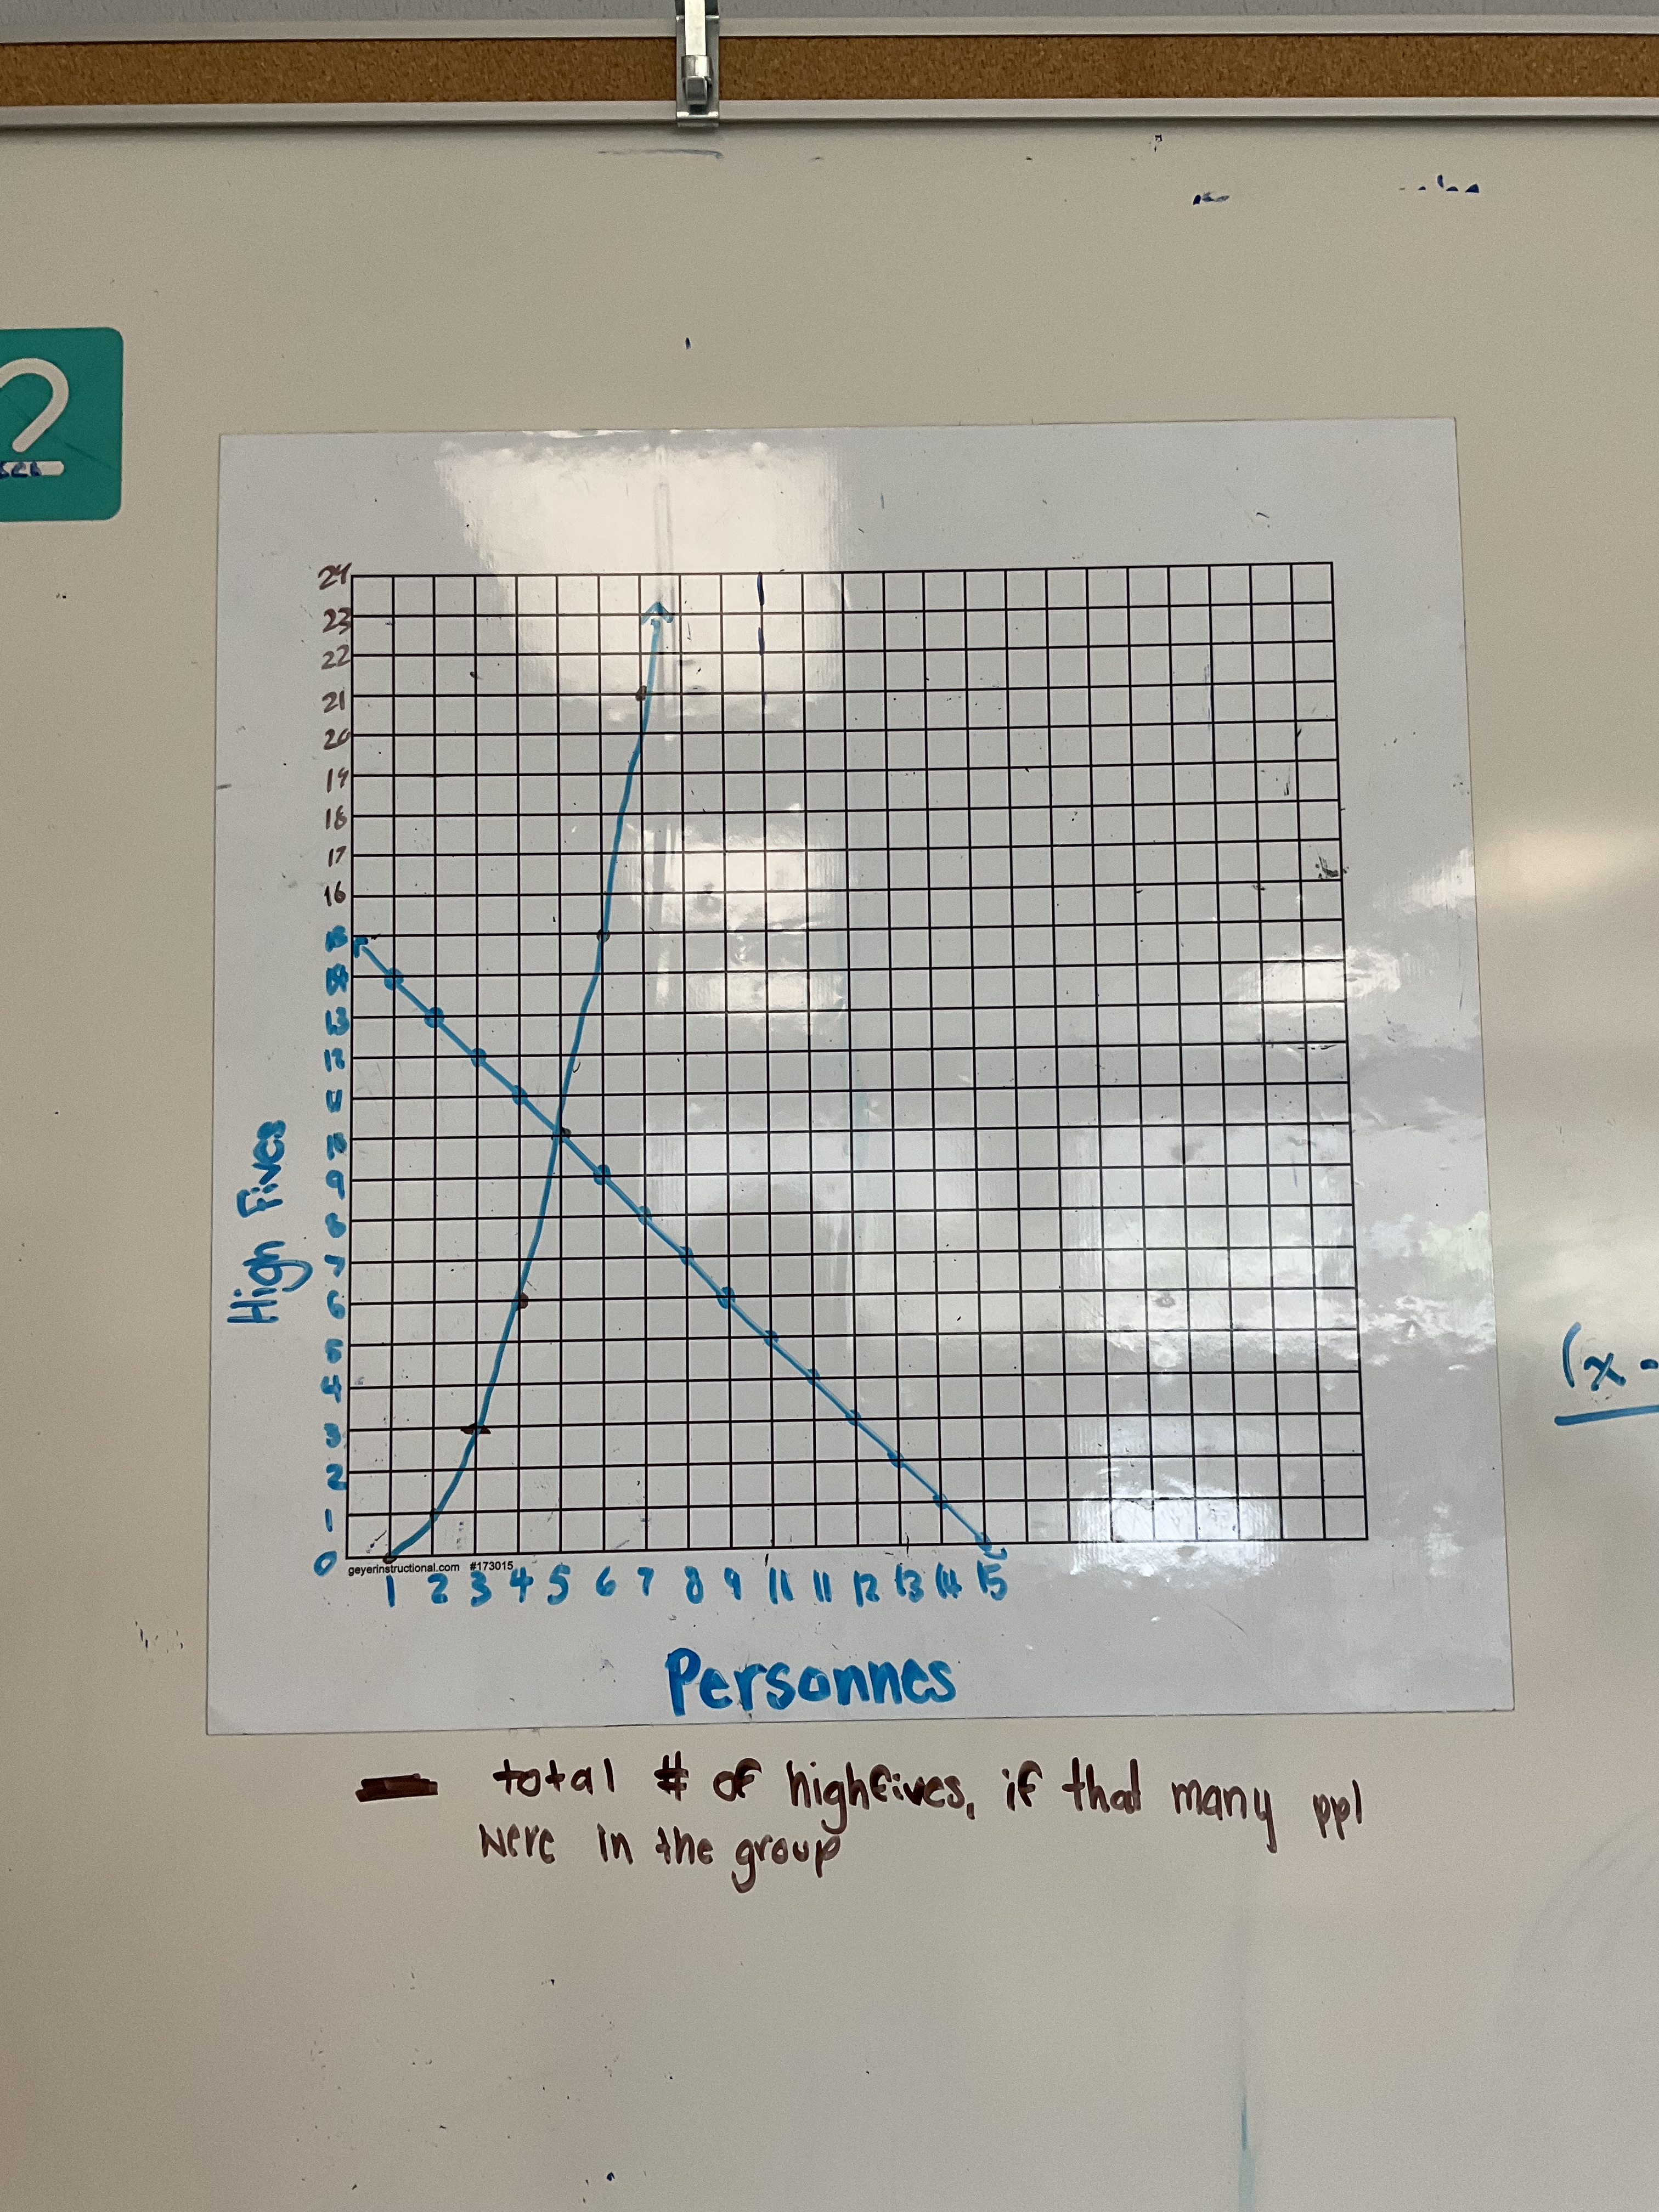
There were some neat graphs that were made. This group showed the number of high fives per person, and total.
Others were looking for different patterns relating the high fives to the square of x.
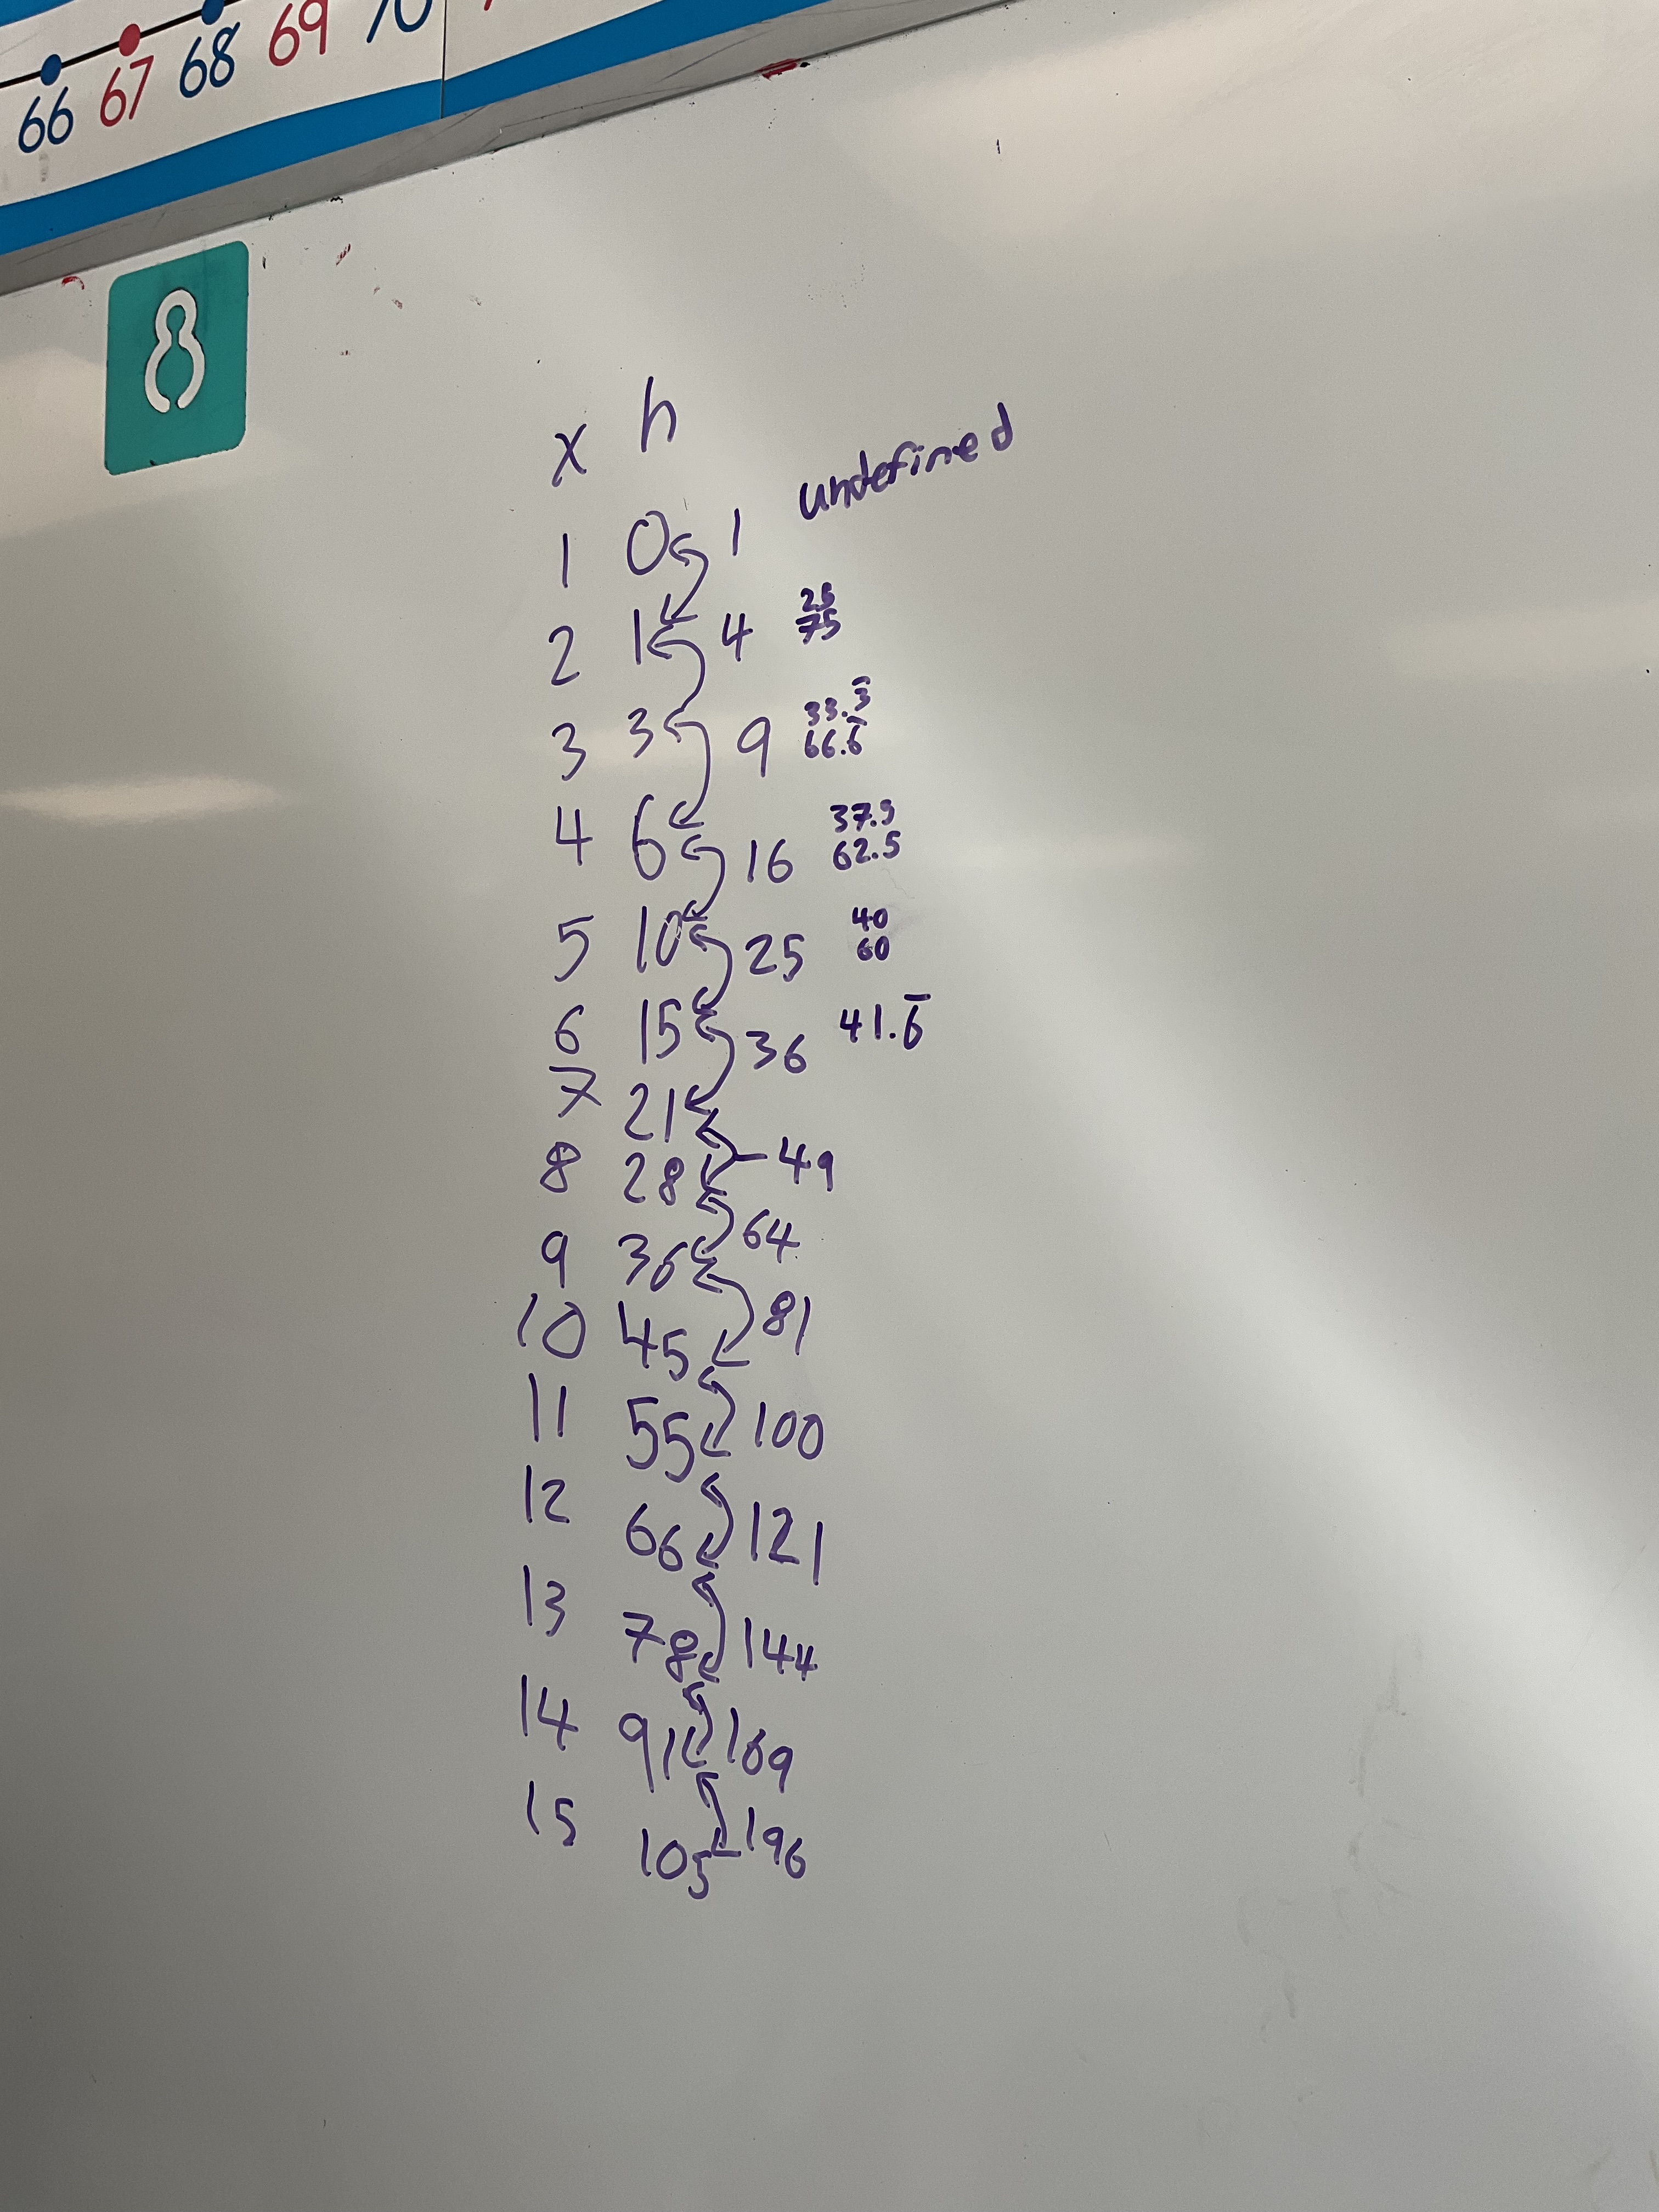
It’s fun to look for and explore patterns, and practice expressing them in multiple ways.
Following this task we practiced a bit of modelling of visual patterns, and a few tables. Here’s one where you can model it in standard form, and again in vertex form, depending on how you view it.
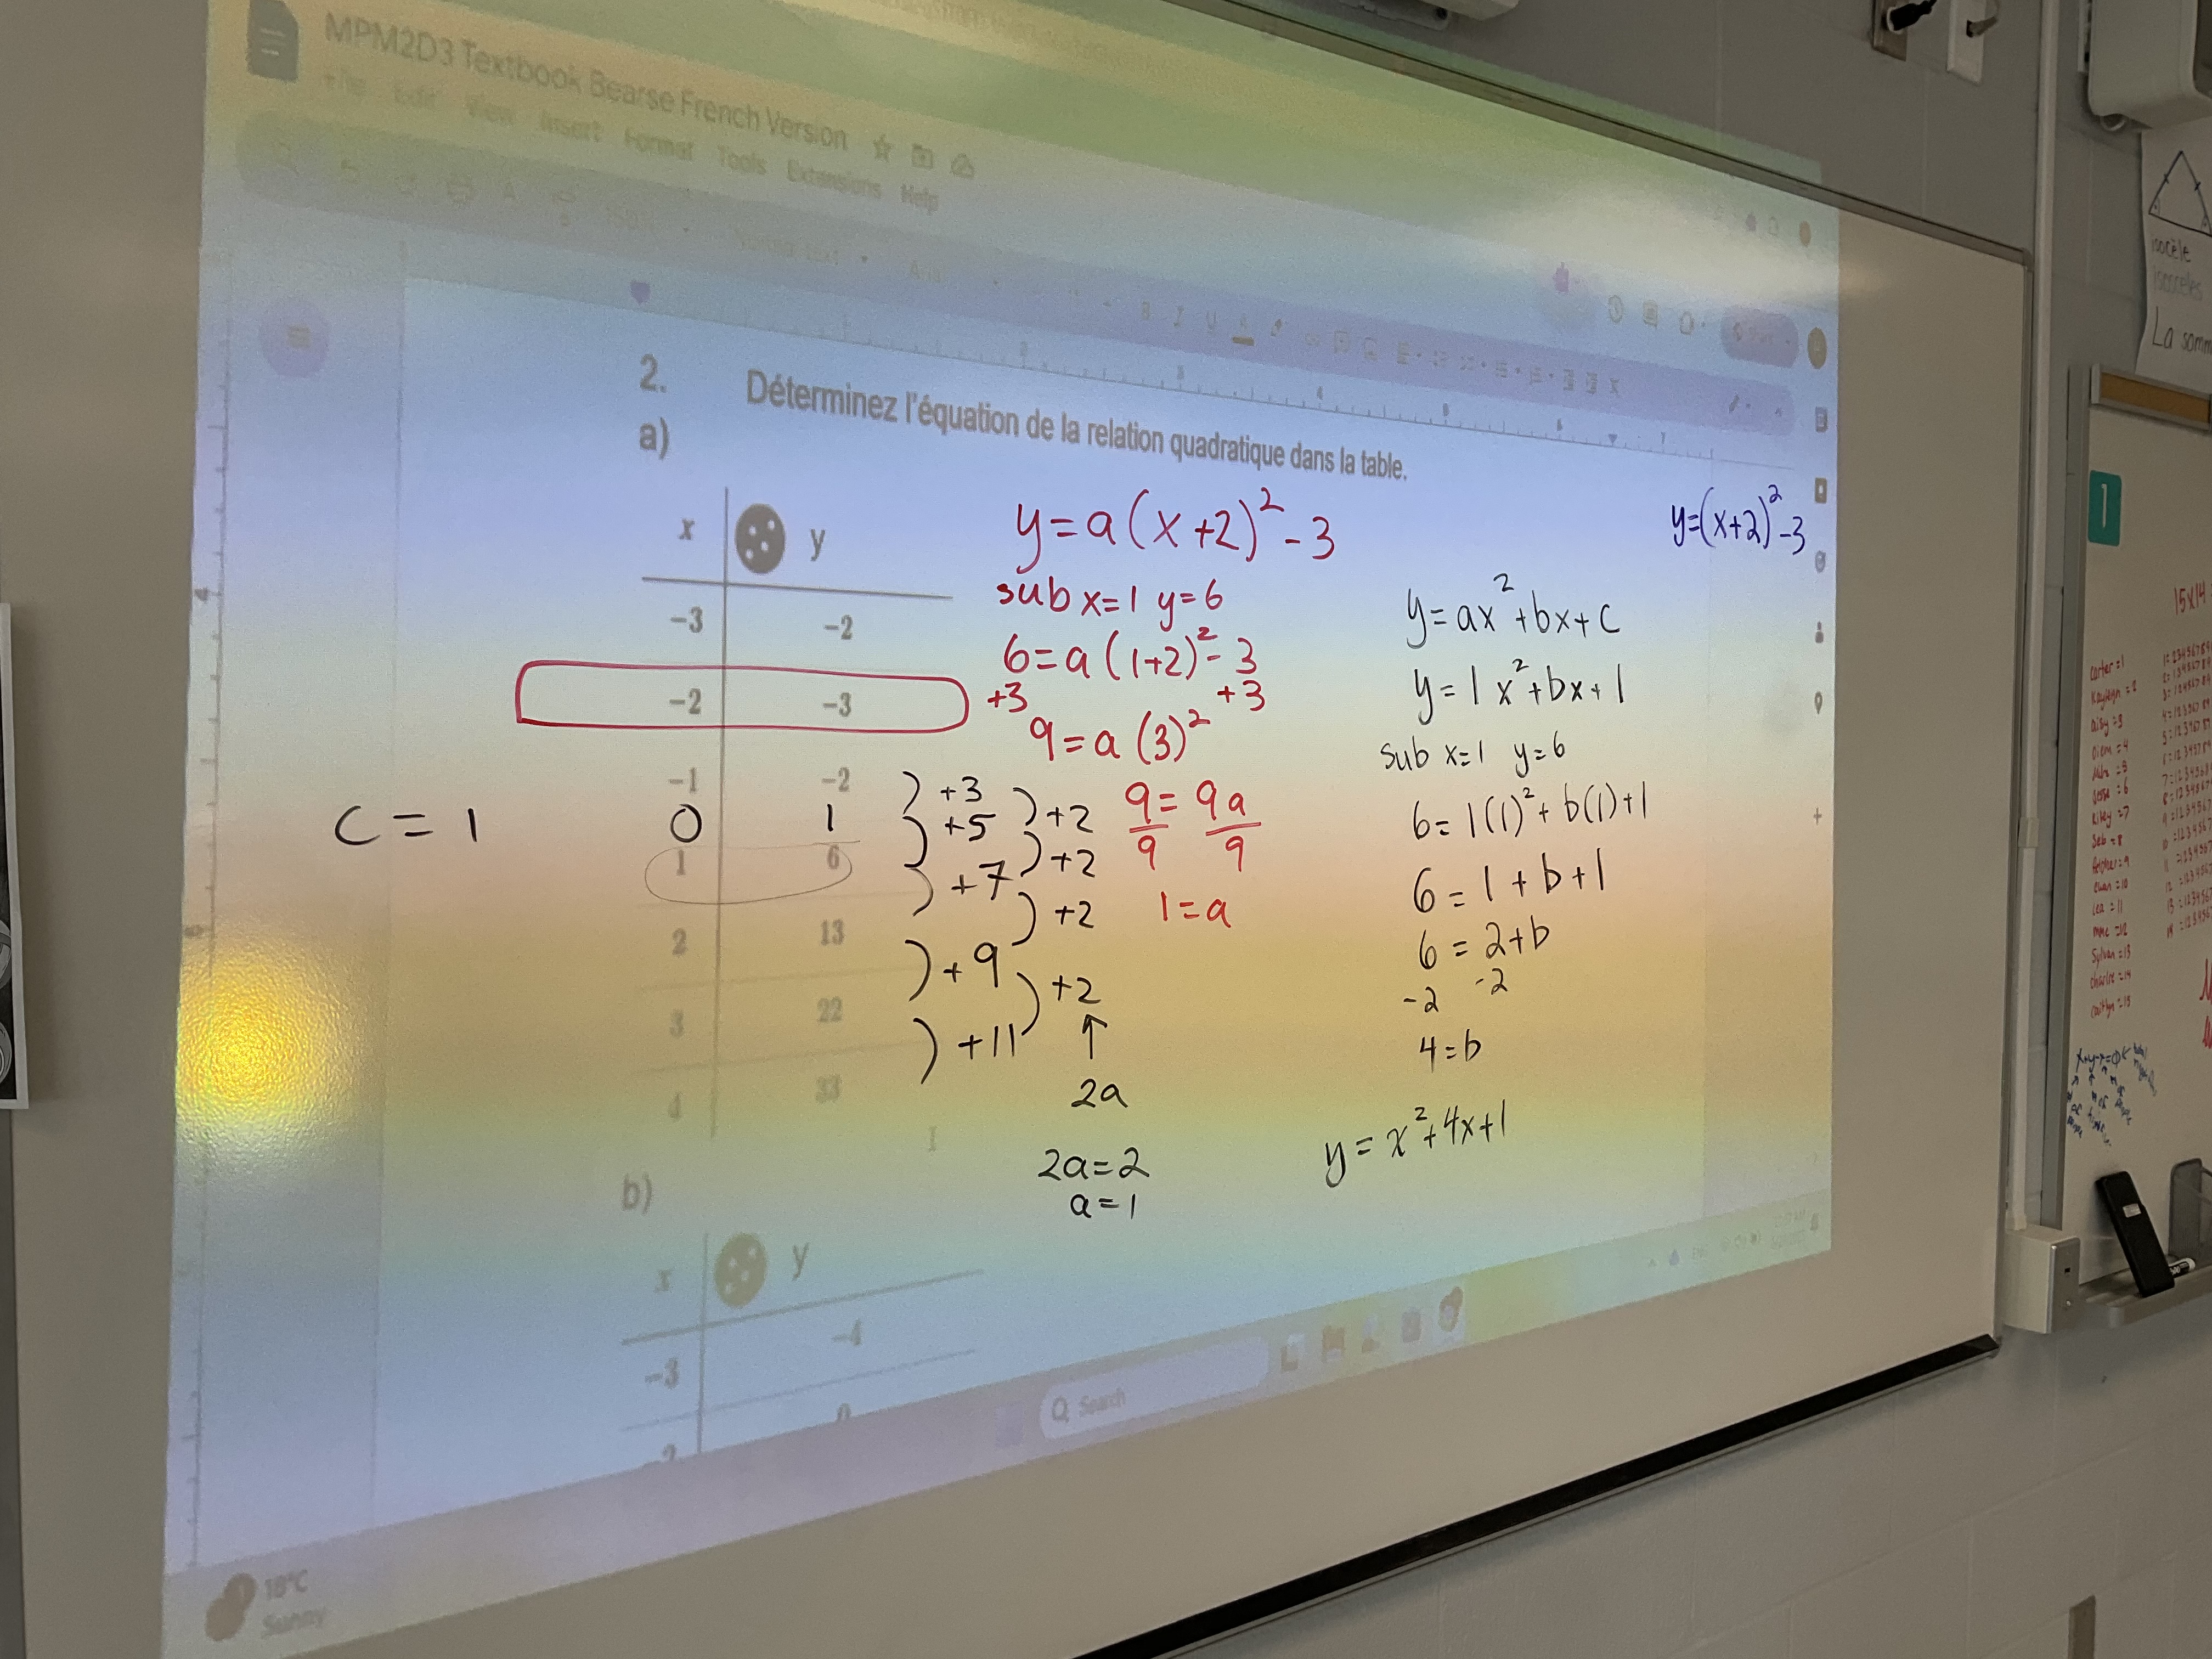
We’re getting ready for our culminating task which uses tables to analyse the trajectory of a catapulted pompom. We’re going to be ready!
Test Talk
Today we tried something new. I’ve been torn for a while about how our learning model values collaboration and verbal communication, but that we are not valuing that on assessments. I was inspired by Howie Hua, a math influencer to try his Test Talk strategy.
We had pencils on the floor, and for 5 minutes students could look at the test, and talk with their peers about the test, and math, and strategies.
It was interesting to feel the tension in the room dissipate when they learned that we were going to try this strategy.
I think with time, students would adapt to reading the test over first, and checking in with themself to see if they know how to do the question, and then communicating with others around them to talk strategy, or ask questions.
It might give students an idea of where to begin, and what questions to leave to the end. It will encourage them to forge bonds with all of their peers so they can ask anyone anything.
It will also encourage students to be present on test day, because it’s hard to replicate this when writing the test alone at a later date.
The tests then happened as normal. Some students needed more time, but many were able to get it all done within a period.
Review
Grade 10s have a test tomorrow. We spent the first half of the period reviewing some trigonometry problems at the walls. It’s so great to see their interaction and helpfulness. We’ve made big growth in our team work since the start of term
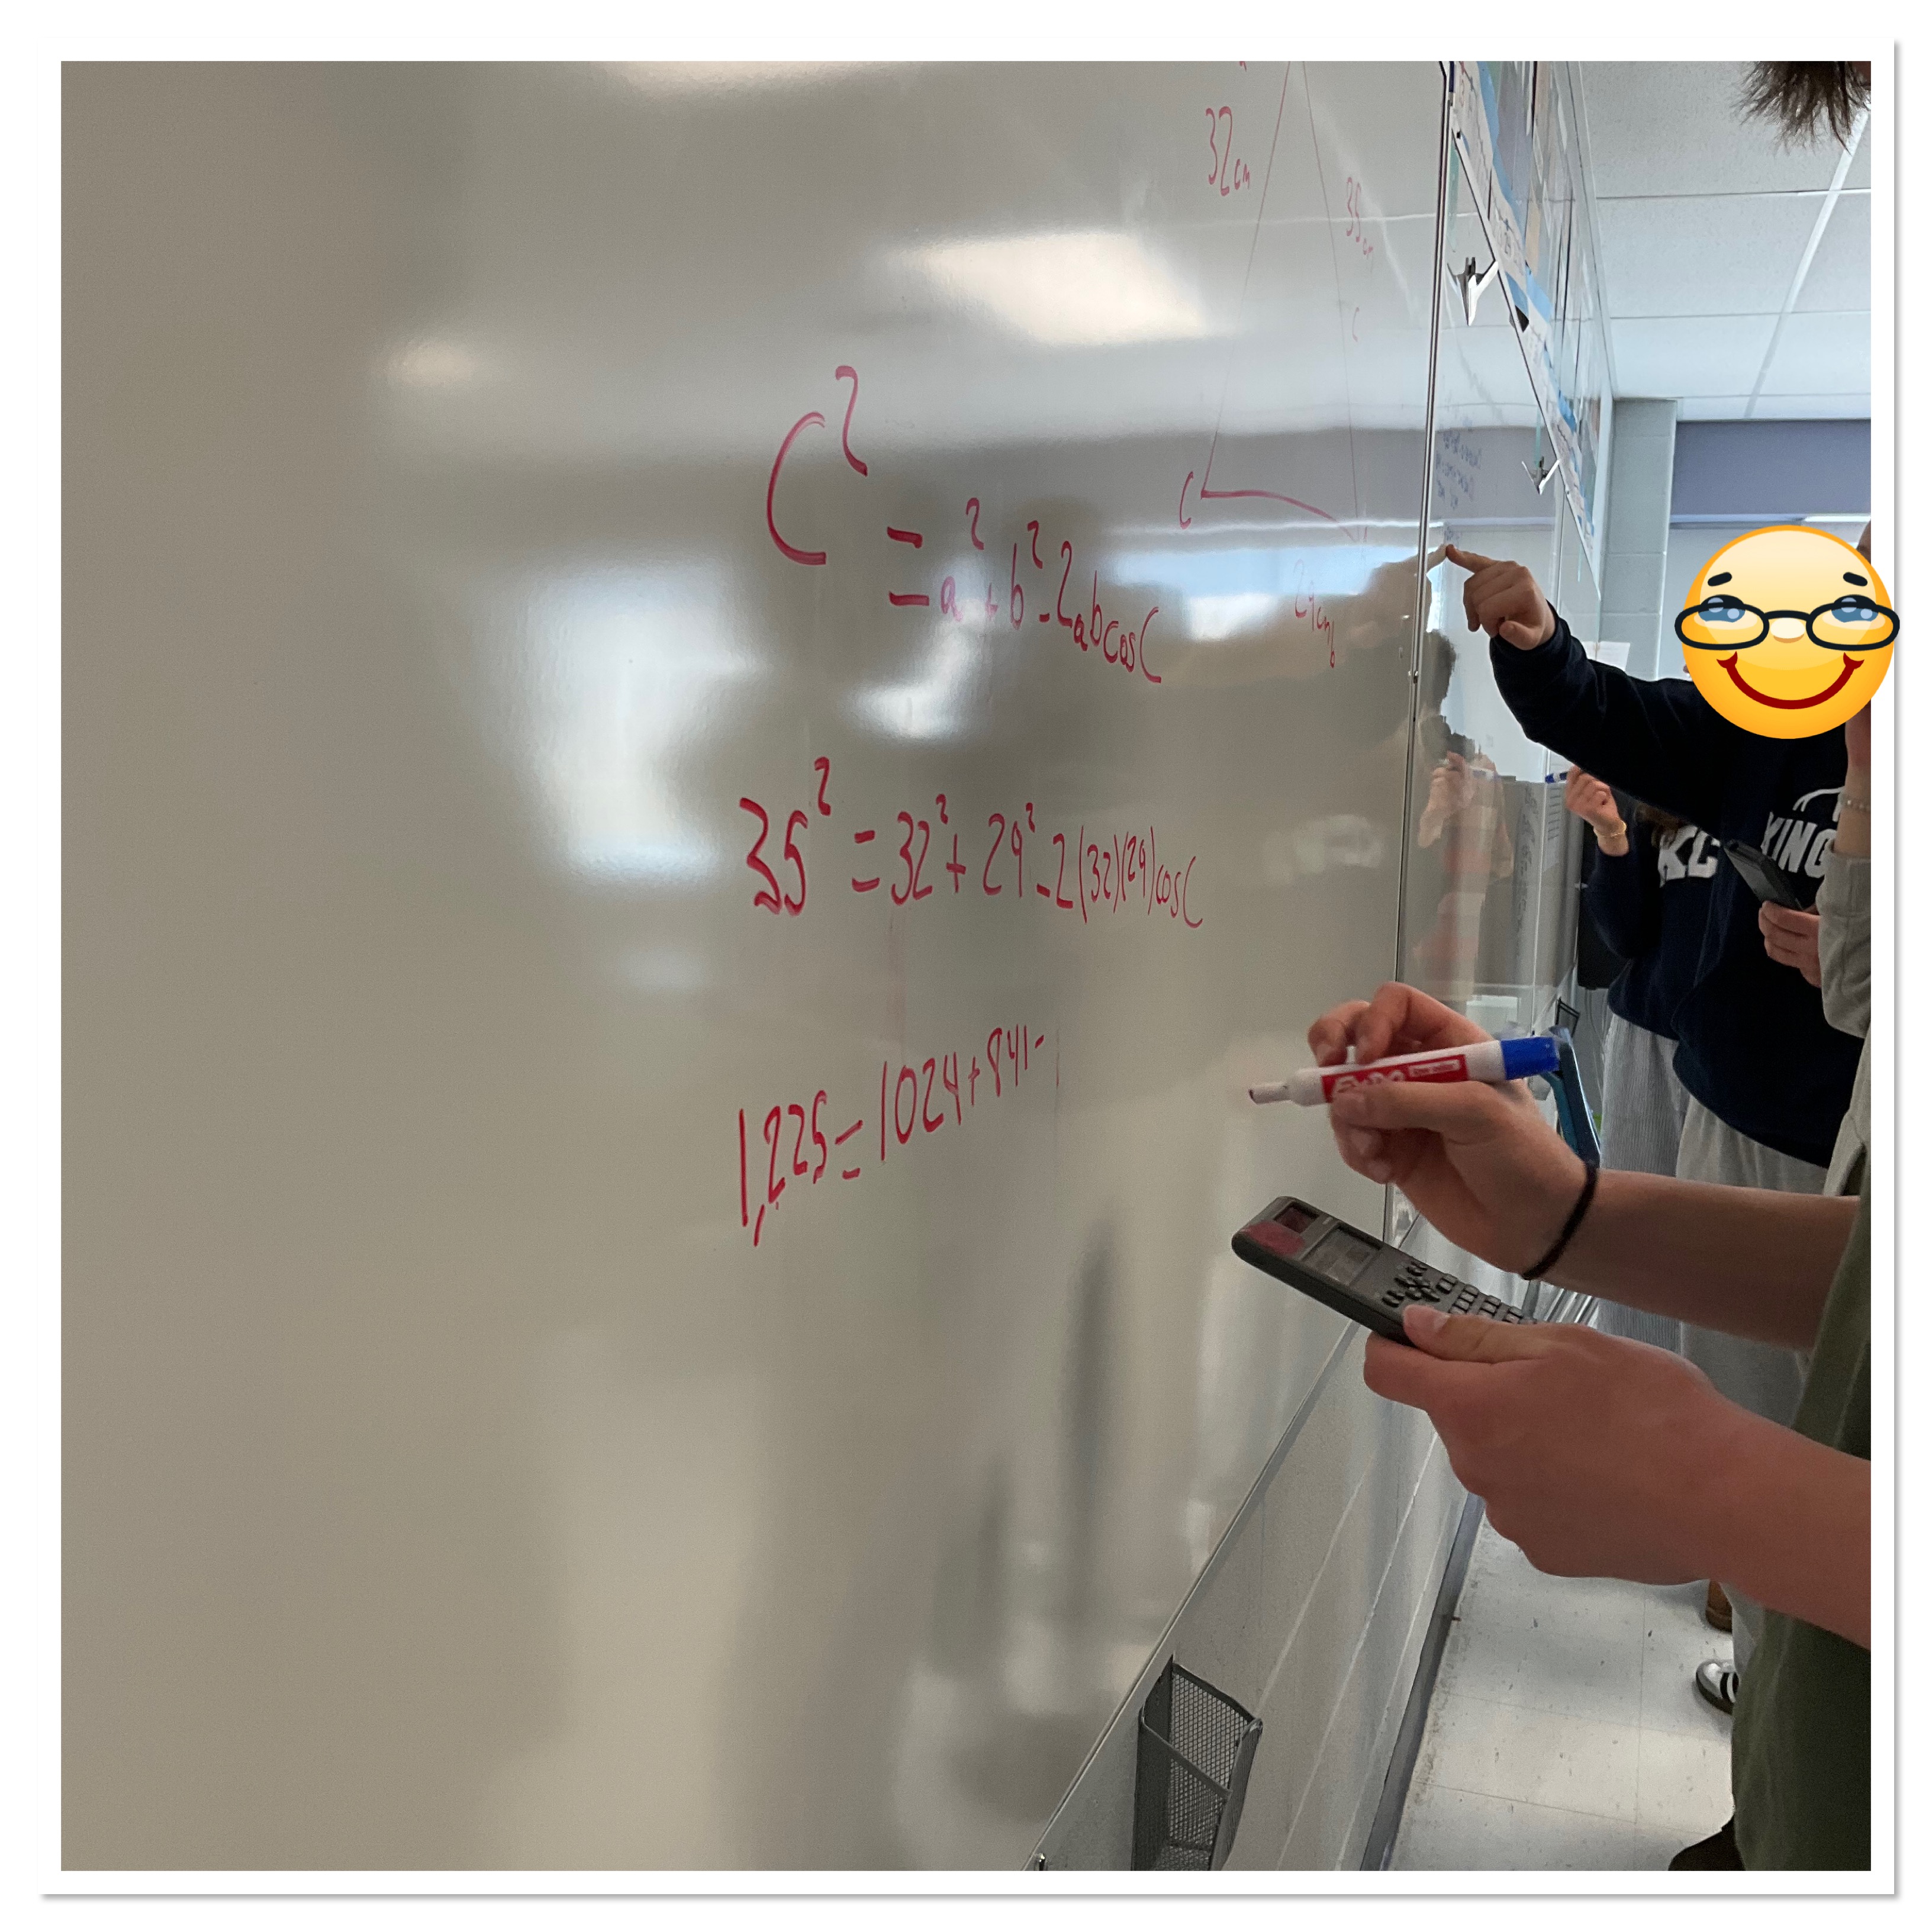
I keep mentioning that my goal for the end of the term is for them to not need me, because they can do it themselves, or they have developed connections in the classroom and can work as a team to figure things out.
Some students are going above and beyond and when asked questions, will not give direct answers, but will ask good prompting questions, to encourage their peers to keep thinking.
It’s lovely for them to recognize the importance of arriving at the answer on one’s own, and not stealing moments of discovery away from their peers.
I’m witnessing students checking their work for reasonableness, inspecting their work for their common mistakes, and reaching out to others to confirm what they are doing.
The second half of the class students were working on their package of review problems. Doing work that is a bit more independent, because tomorrow’s test will be their big independent moment.
I’m very proud of this group! Looking forward to a good test day tomorrow.
Multiple Strategies
Quadratic word problems are my favourite kind of problem because there are so many strategies to solve them. Here’s an example of one we solved today.
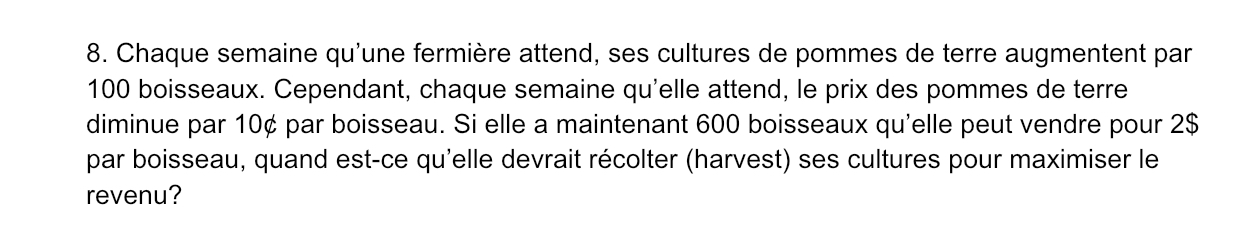
It’s a question about when a farmer should harvest her potato crops to maximize revenue. There are initially 100 bushels that can be sold for $2/bushel. For each week she waits the price per bushel drops by $0.10, and the number of bushels grows by 100.
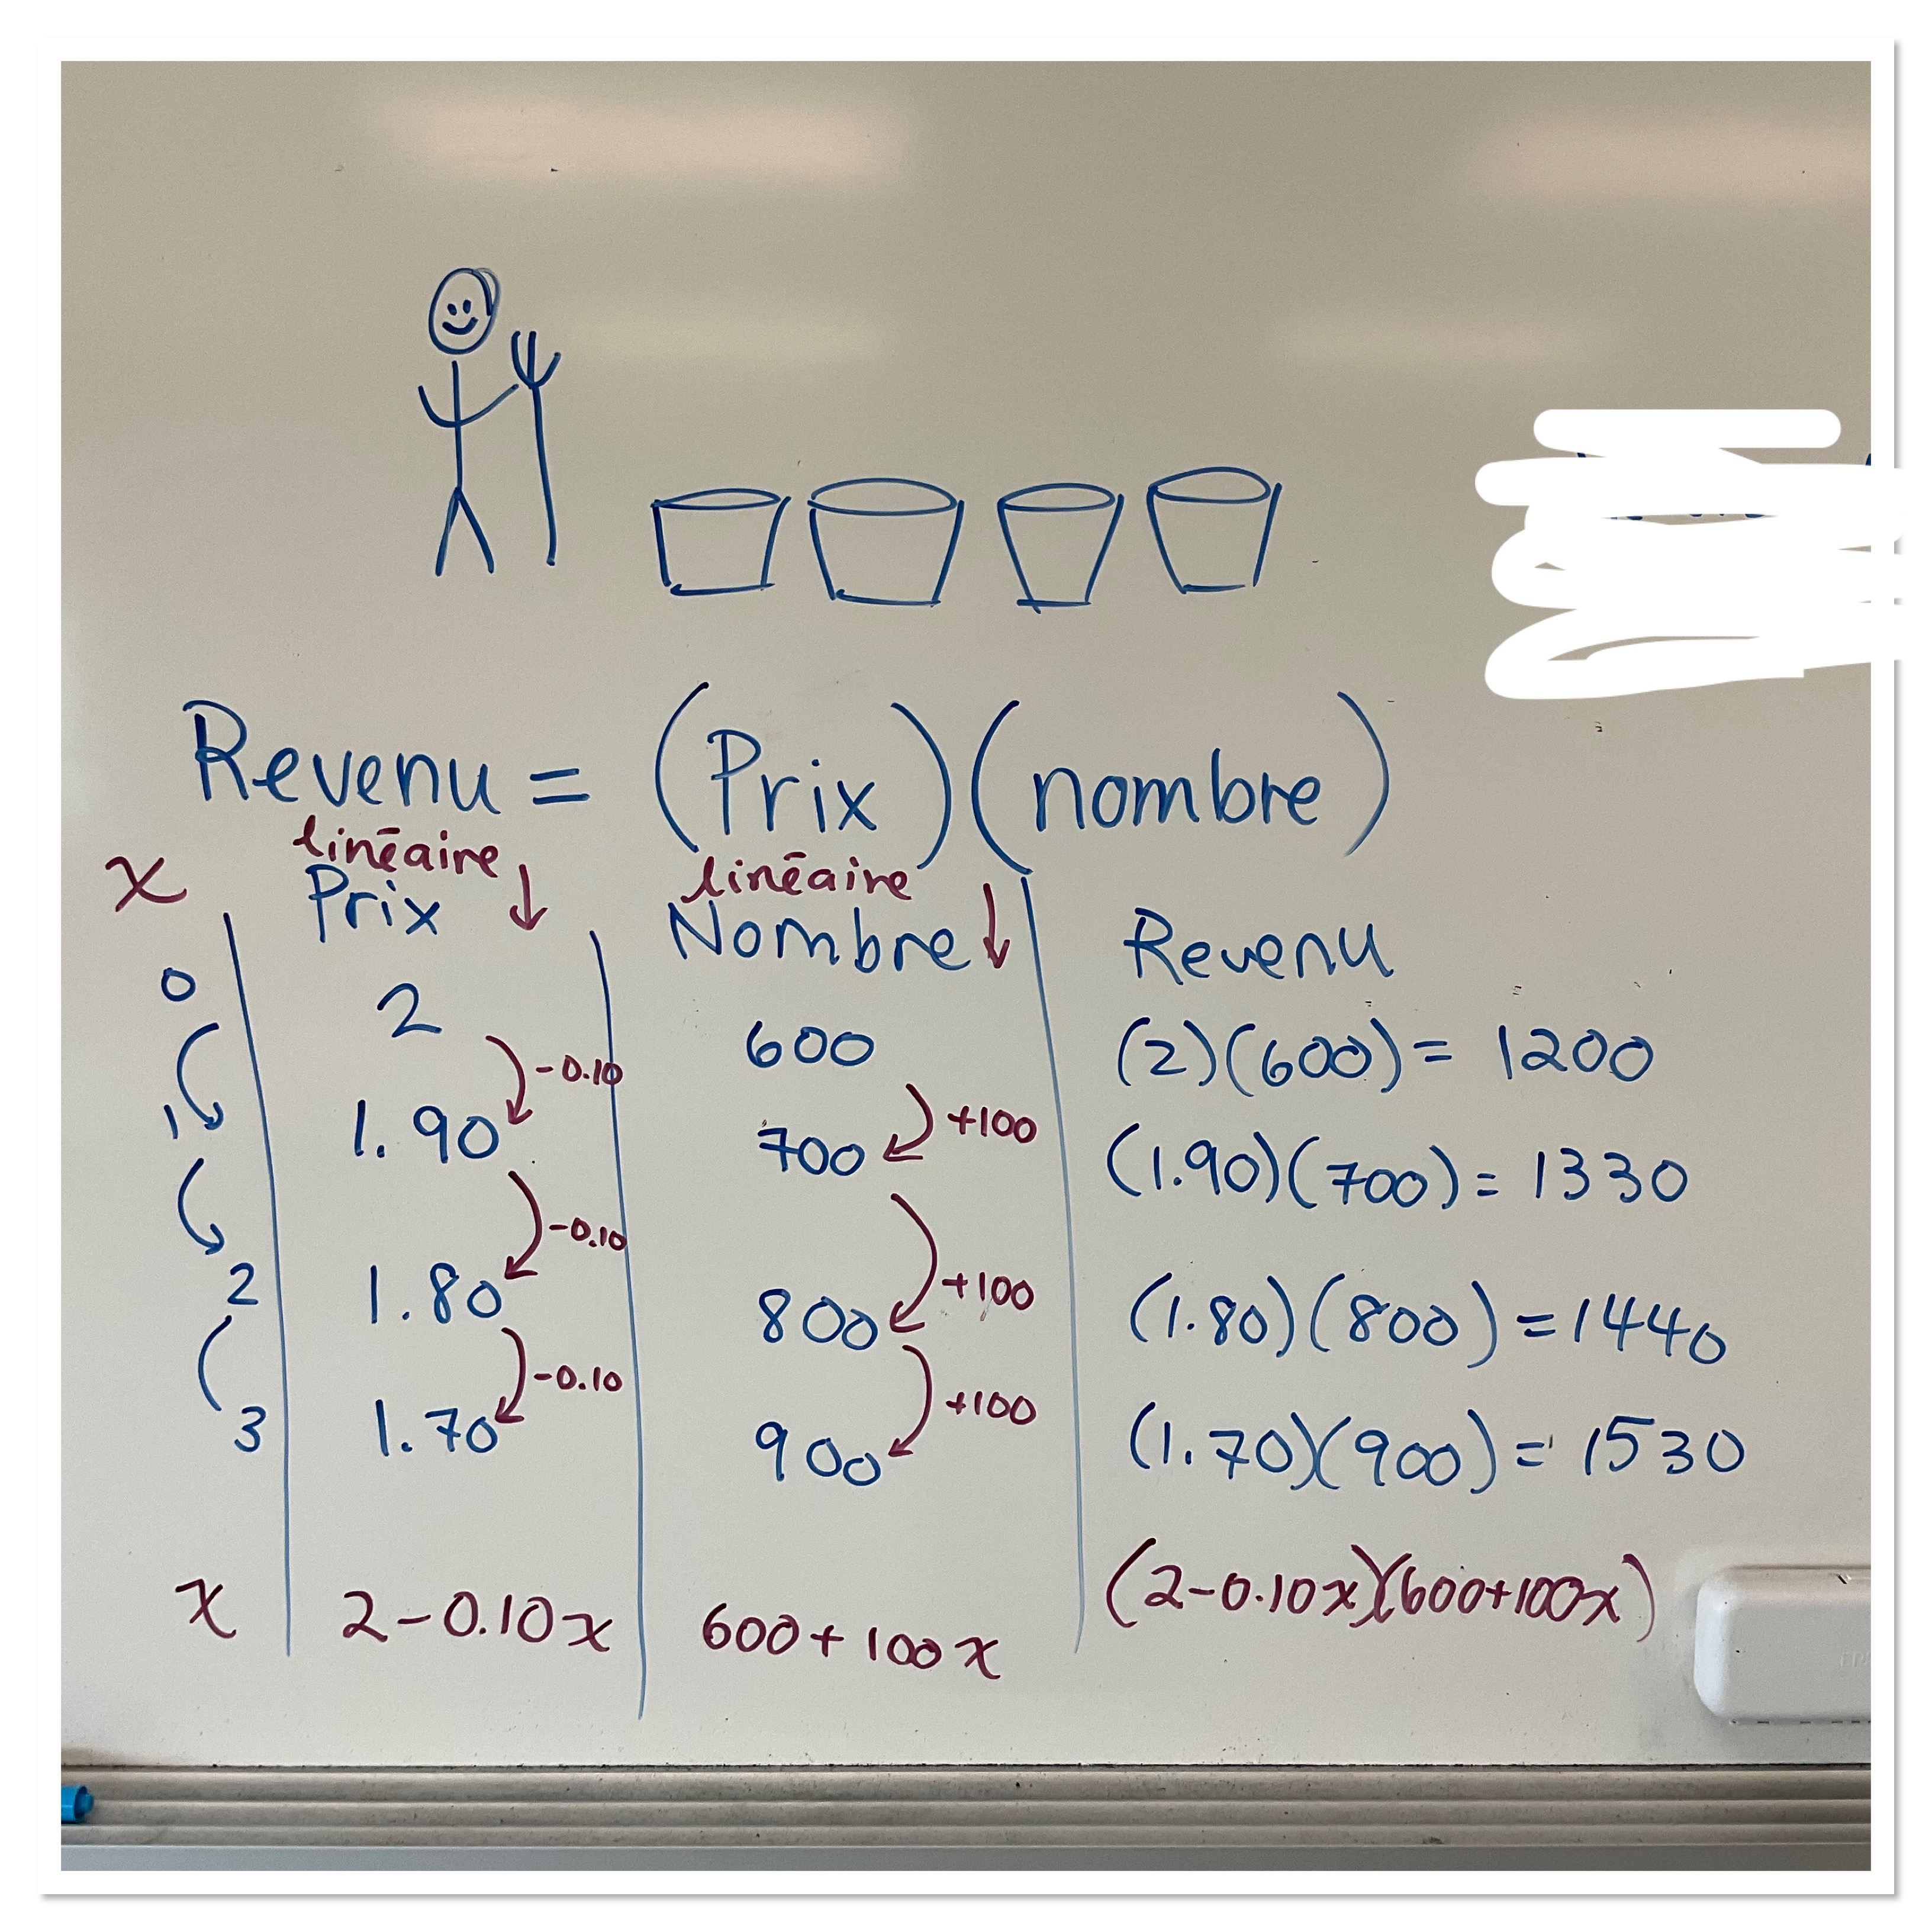
My students were unsure of how to start the analysis, so we looked at a strategy of making a table to help us organize our thoughts and generalize patterns. Some students really like making a table as a solution method. It’s time consuming, but would work eventually. We talked about how to make the solution more efficient by making an equation for revenue using x as the number of weeks that the farmer waits.
Once we modelled the situation with an equation we split into groups to try to solve for the number of weeks x to wait to have a maximum revenue.

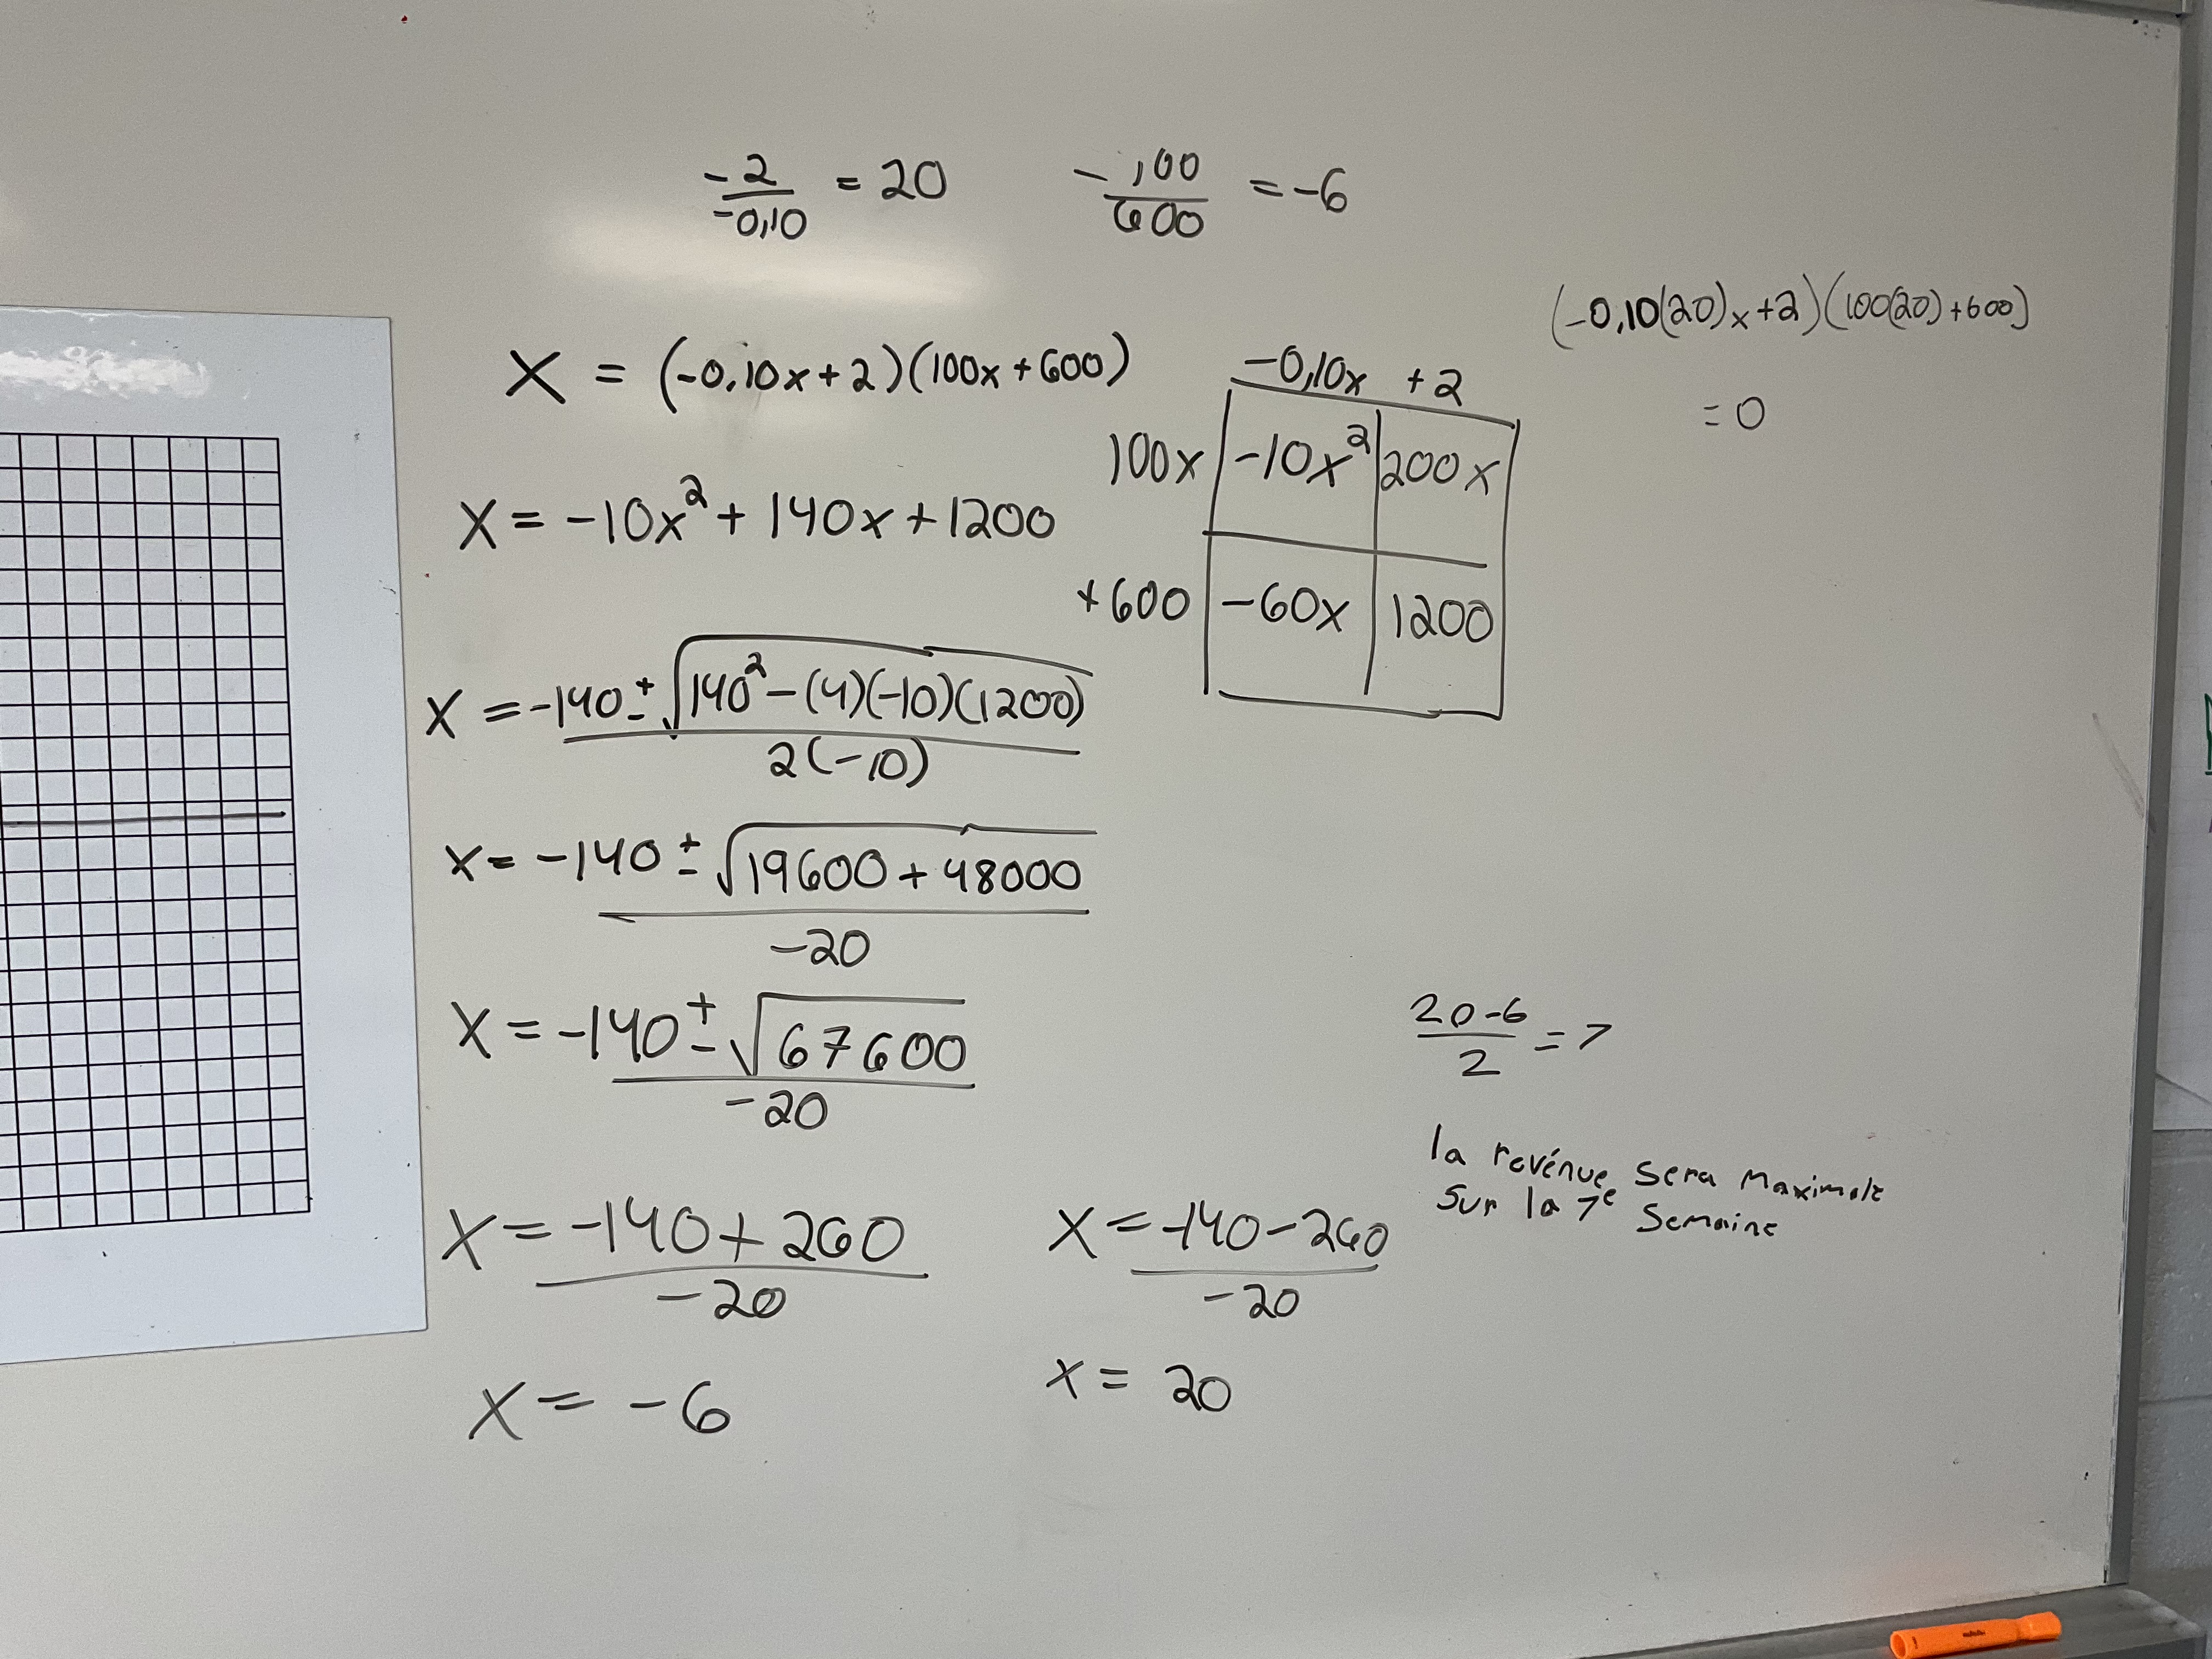
some groups decided to multiply the binomials to start, and then did the quadratic formula to solve for the x intercepts. Most got bogged down after doing all this math and forgot that they were looking for the vertex (which falls always between the 2 x intercepts). Sometimes our solutions are looking for x intercepts, some for the vertex, we’re looking at interpreting word problems correctly and looking for words like maximum, maximize, minimum, minimize to hint at when we need to find the vertex.
Once we noticed (by looking around the room) that some groups concluded that the farmer should wait 20 weeks and others got a different, smaller, answer I prompted them to substitute in their weeks number for x and to calculate the revenue. When groups noticed that when they subbed in 20 the revenue was zero, they realized they needed to rethink some things.
Some groups noticed we had started with a quadratic in factored form, and that we could solve for the x intercepts by looking at the cases that give revenue=0
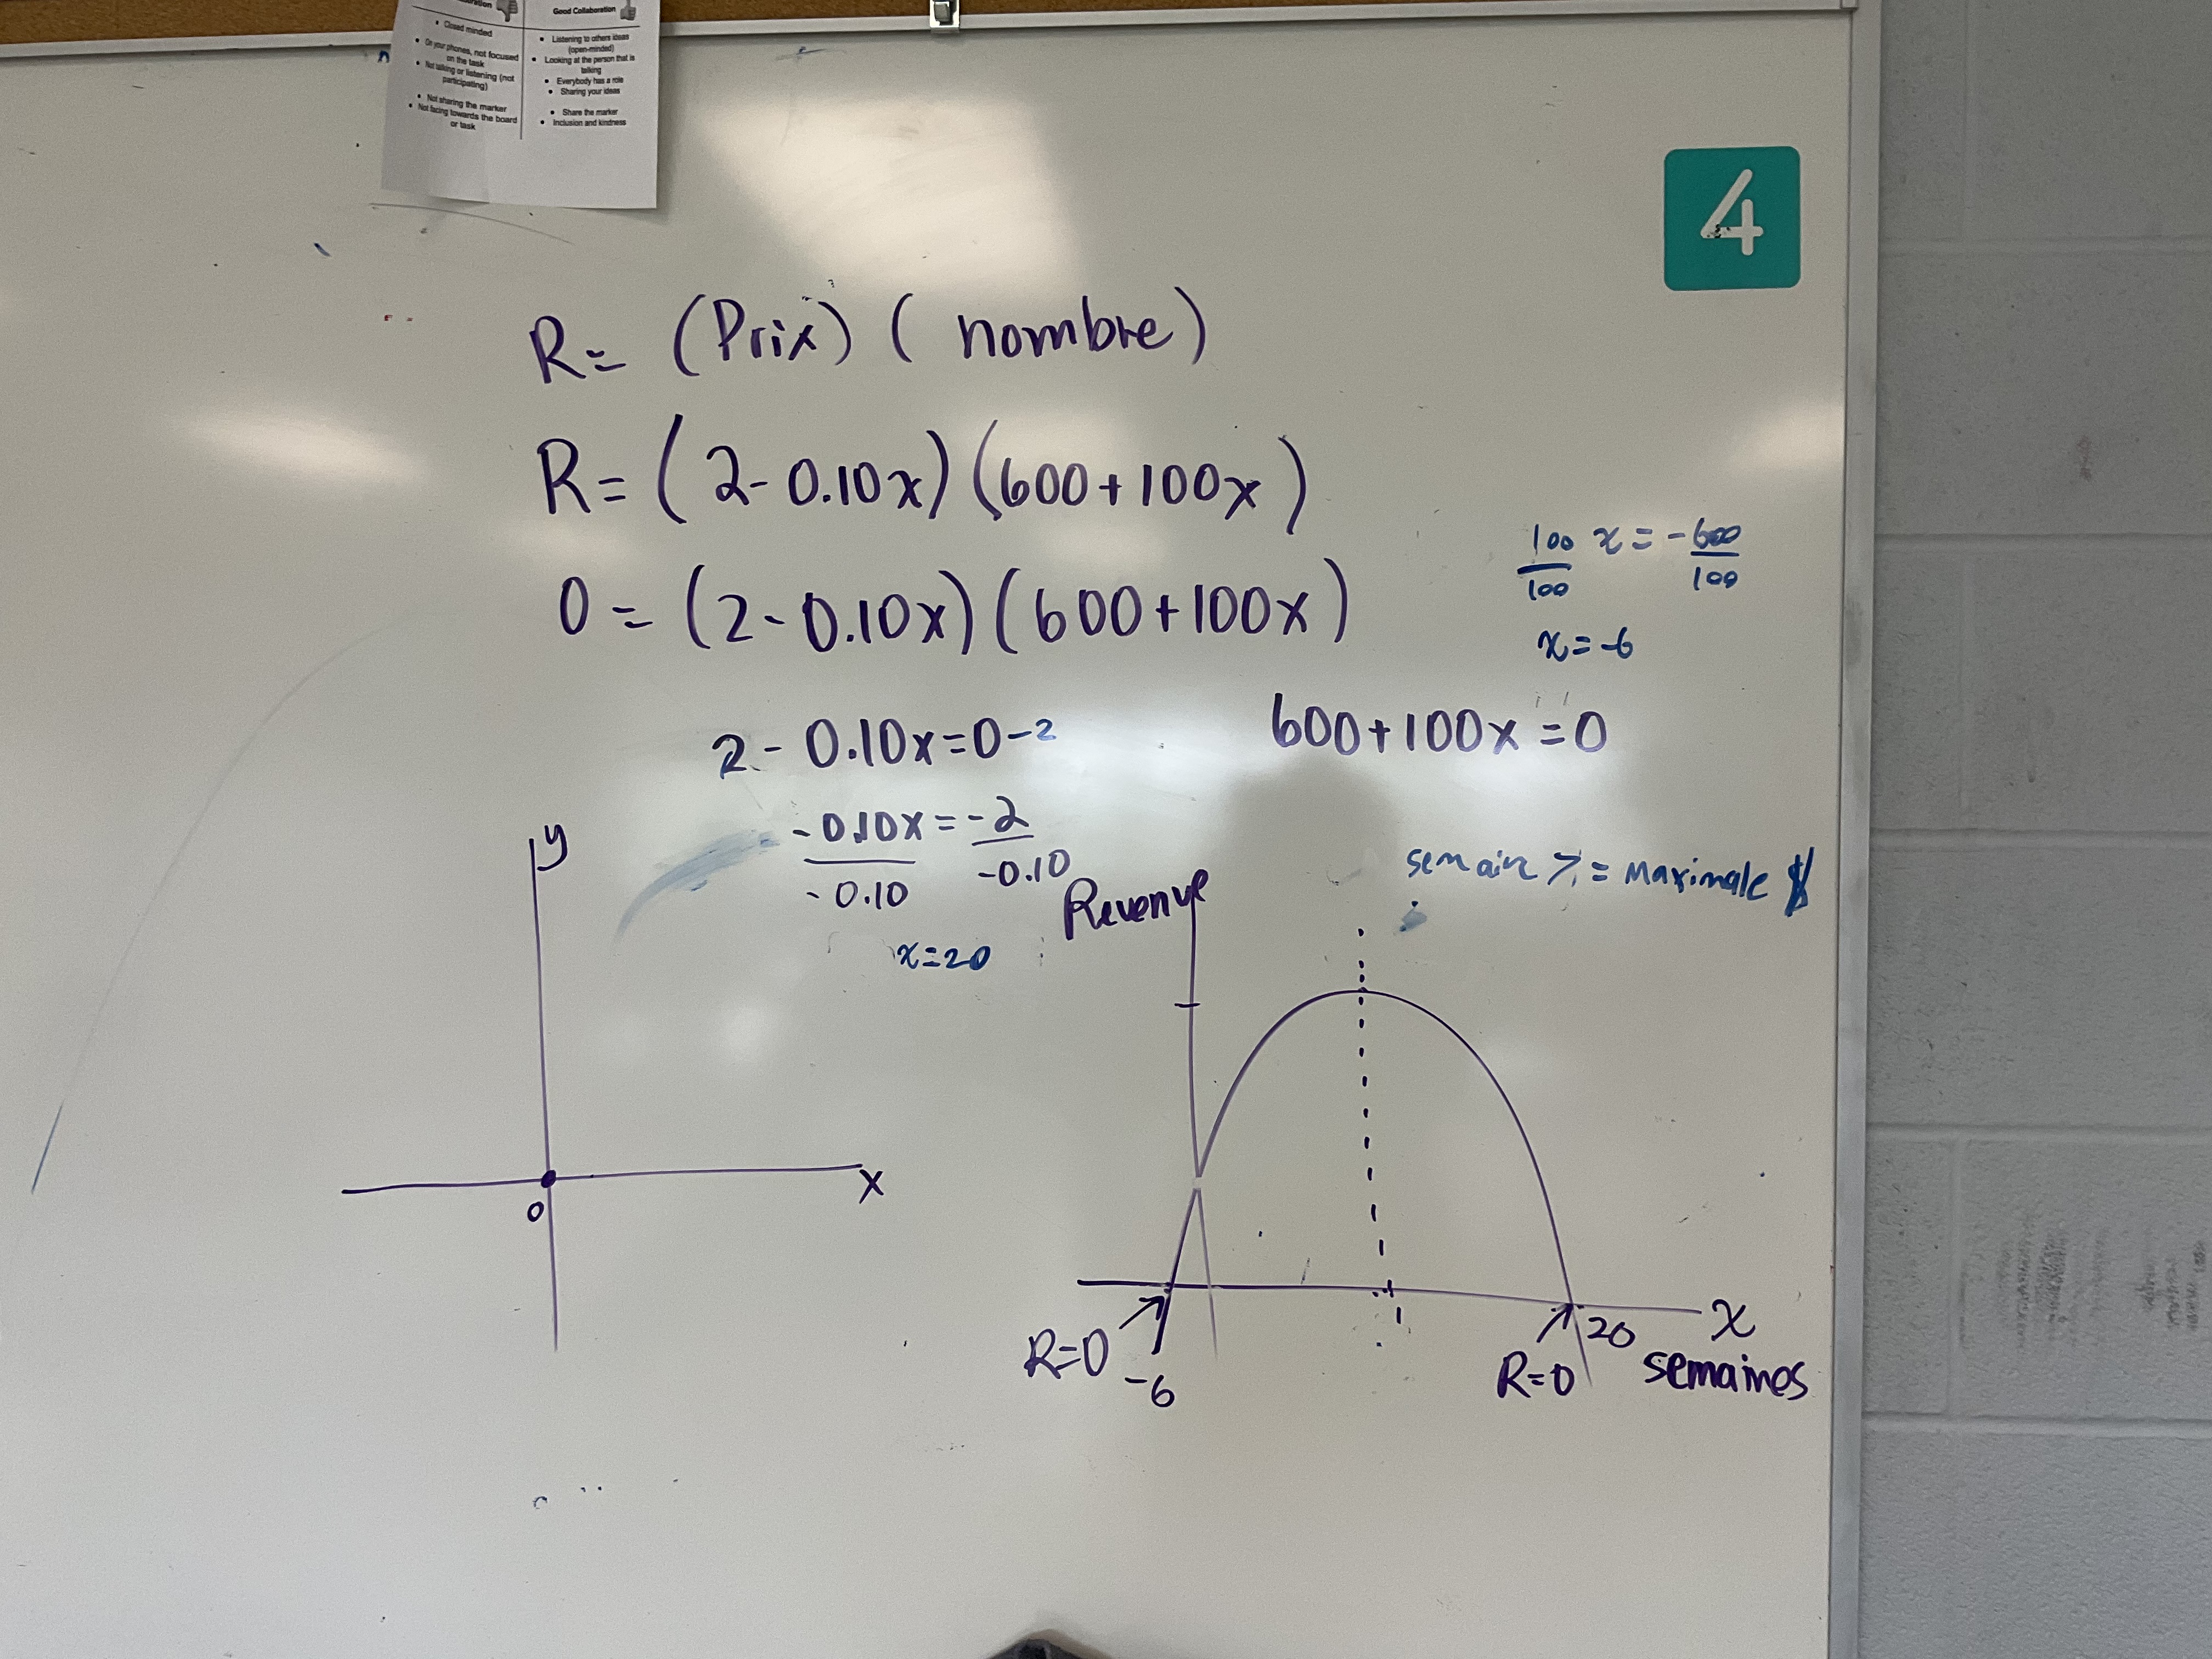
Prompting the groups to do a little sketch was helpful for them to start to find the vertex.
Groups around the room started to realize that they could get to the x intercepts in 2 ways, by solving for what makes the brackets=0 from factored form, or from the quadratic formula. Both methods require a quick calculation to find the axis of symmetry.
While these methods were percolating and spreading around the room, another group headed down the road of completing the square to locate the vertex (before getting side tracked).
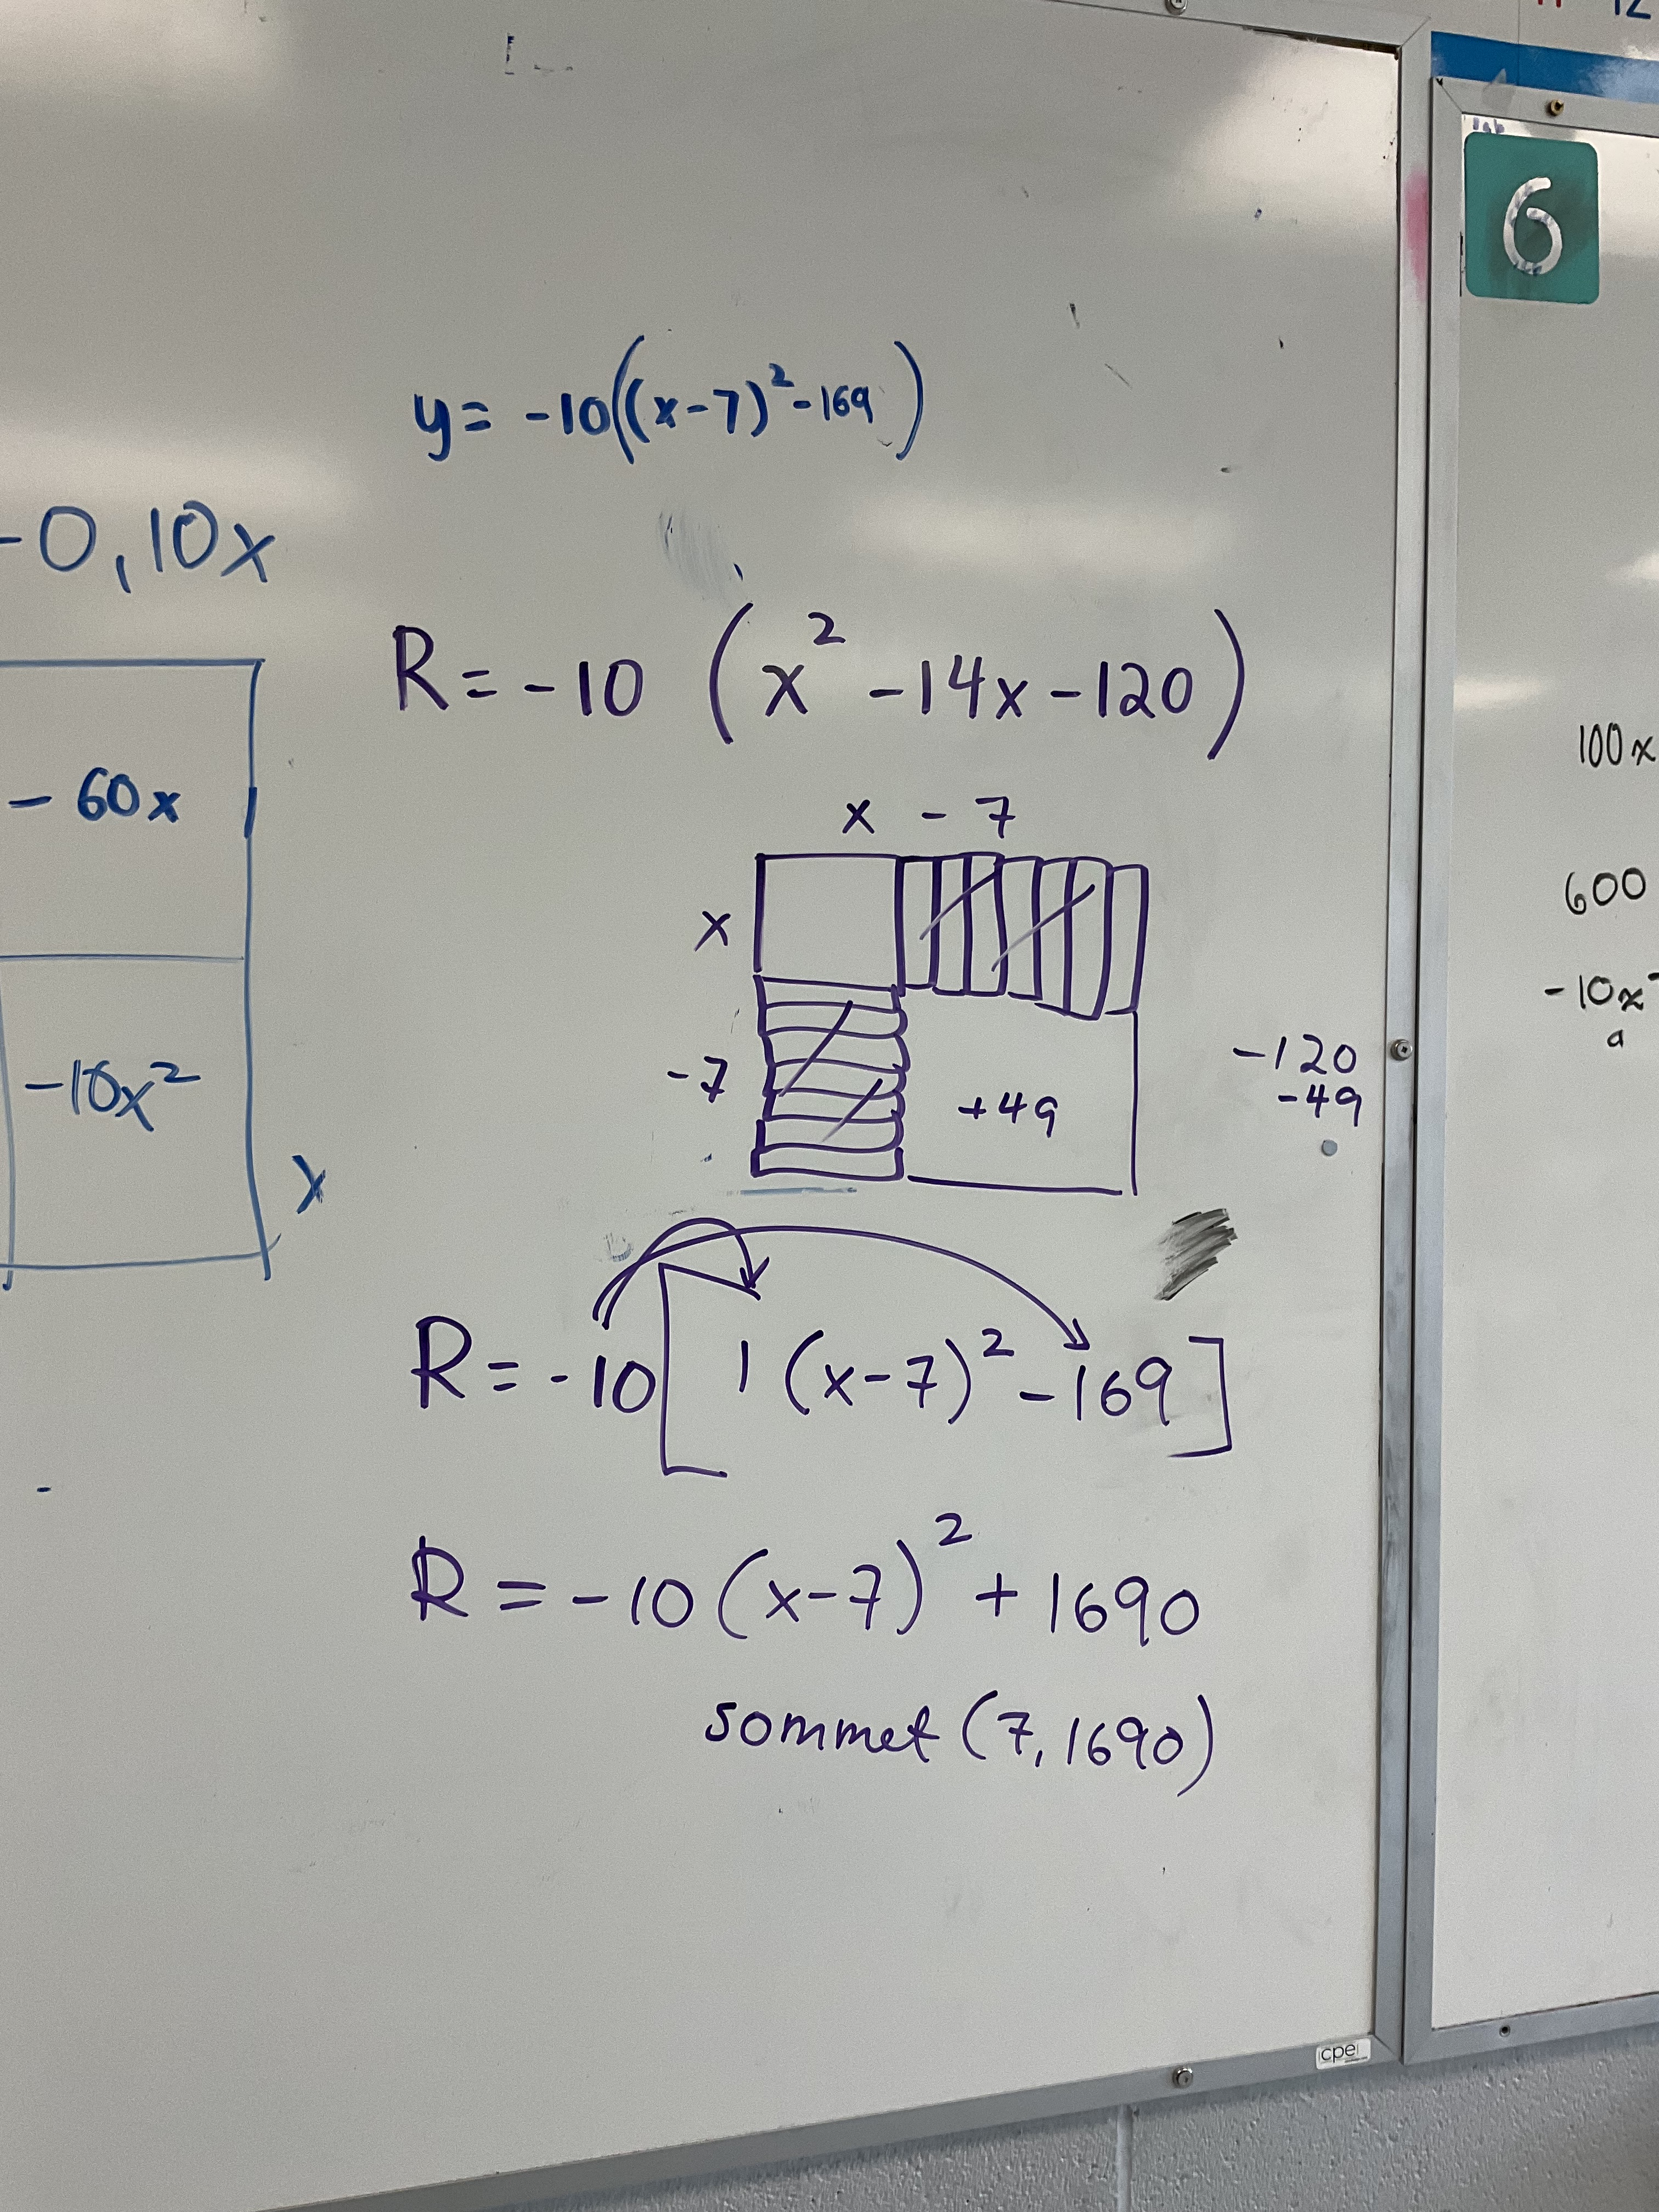
While consolidating we looked at how this strategy also would work nicely. As long as we correctly managed the negative sign at the start.
In this example we can factor out -10 and the numbers are still nice to work with, so we factored -10 then completed the remaining single square, and then multiplied the -10 back in the end. This method directly finds the vertex, which allows us to find the number of weeks the farmer should wait AND the maximum revenue she’d earn.
We had a nice chance to debrief and talk about choosing efficient strategies to solve. Based on what we are given and what we are asked for it might make more sense to use one method over another, so it’s great to have many strategies in your back pocket.
Parallelepiped
Today we explored applications of the cross product, including in areas of triangles, parallelograms and volumes of parallelepipeds.
Here’s a neat desmos 3D graph that I made to demonstrate a parallelepiped. I like that you can view the graph from various perspectives, and rotate it to get a sense of the 3D nature of the form.

It’s amazing how far technology has come!
Vector Fun
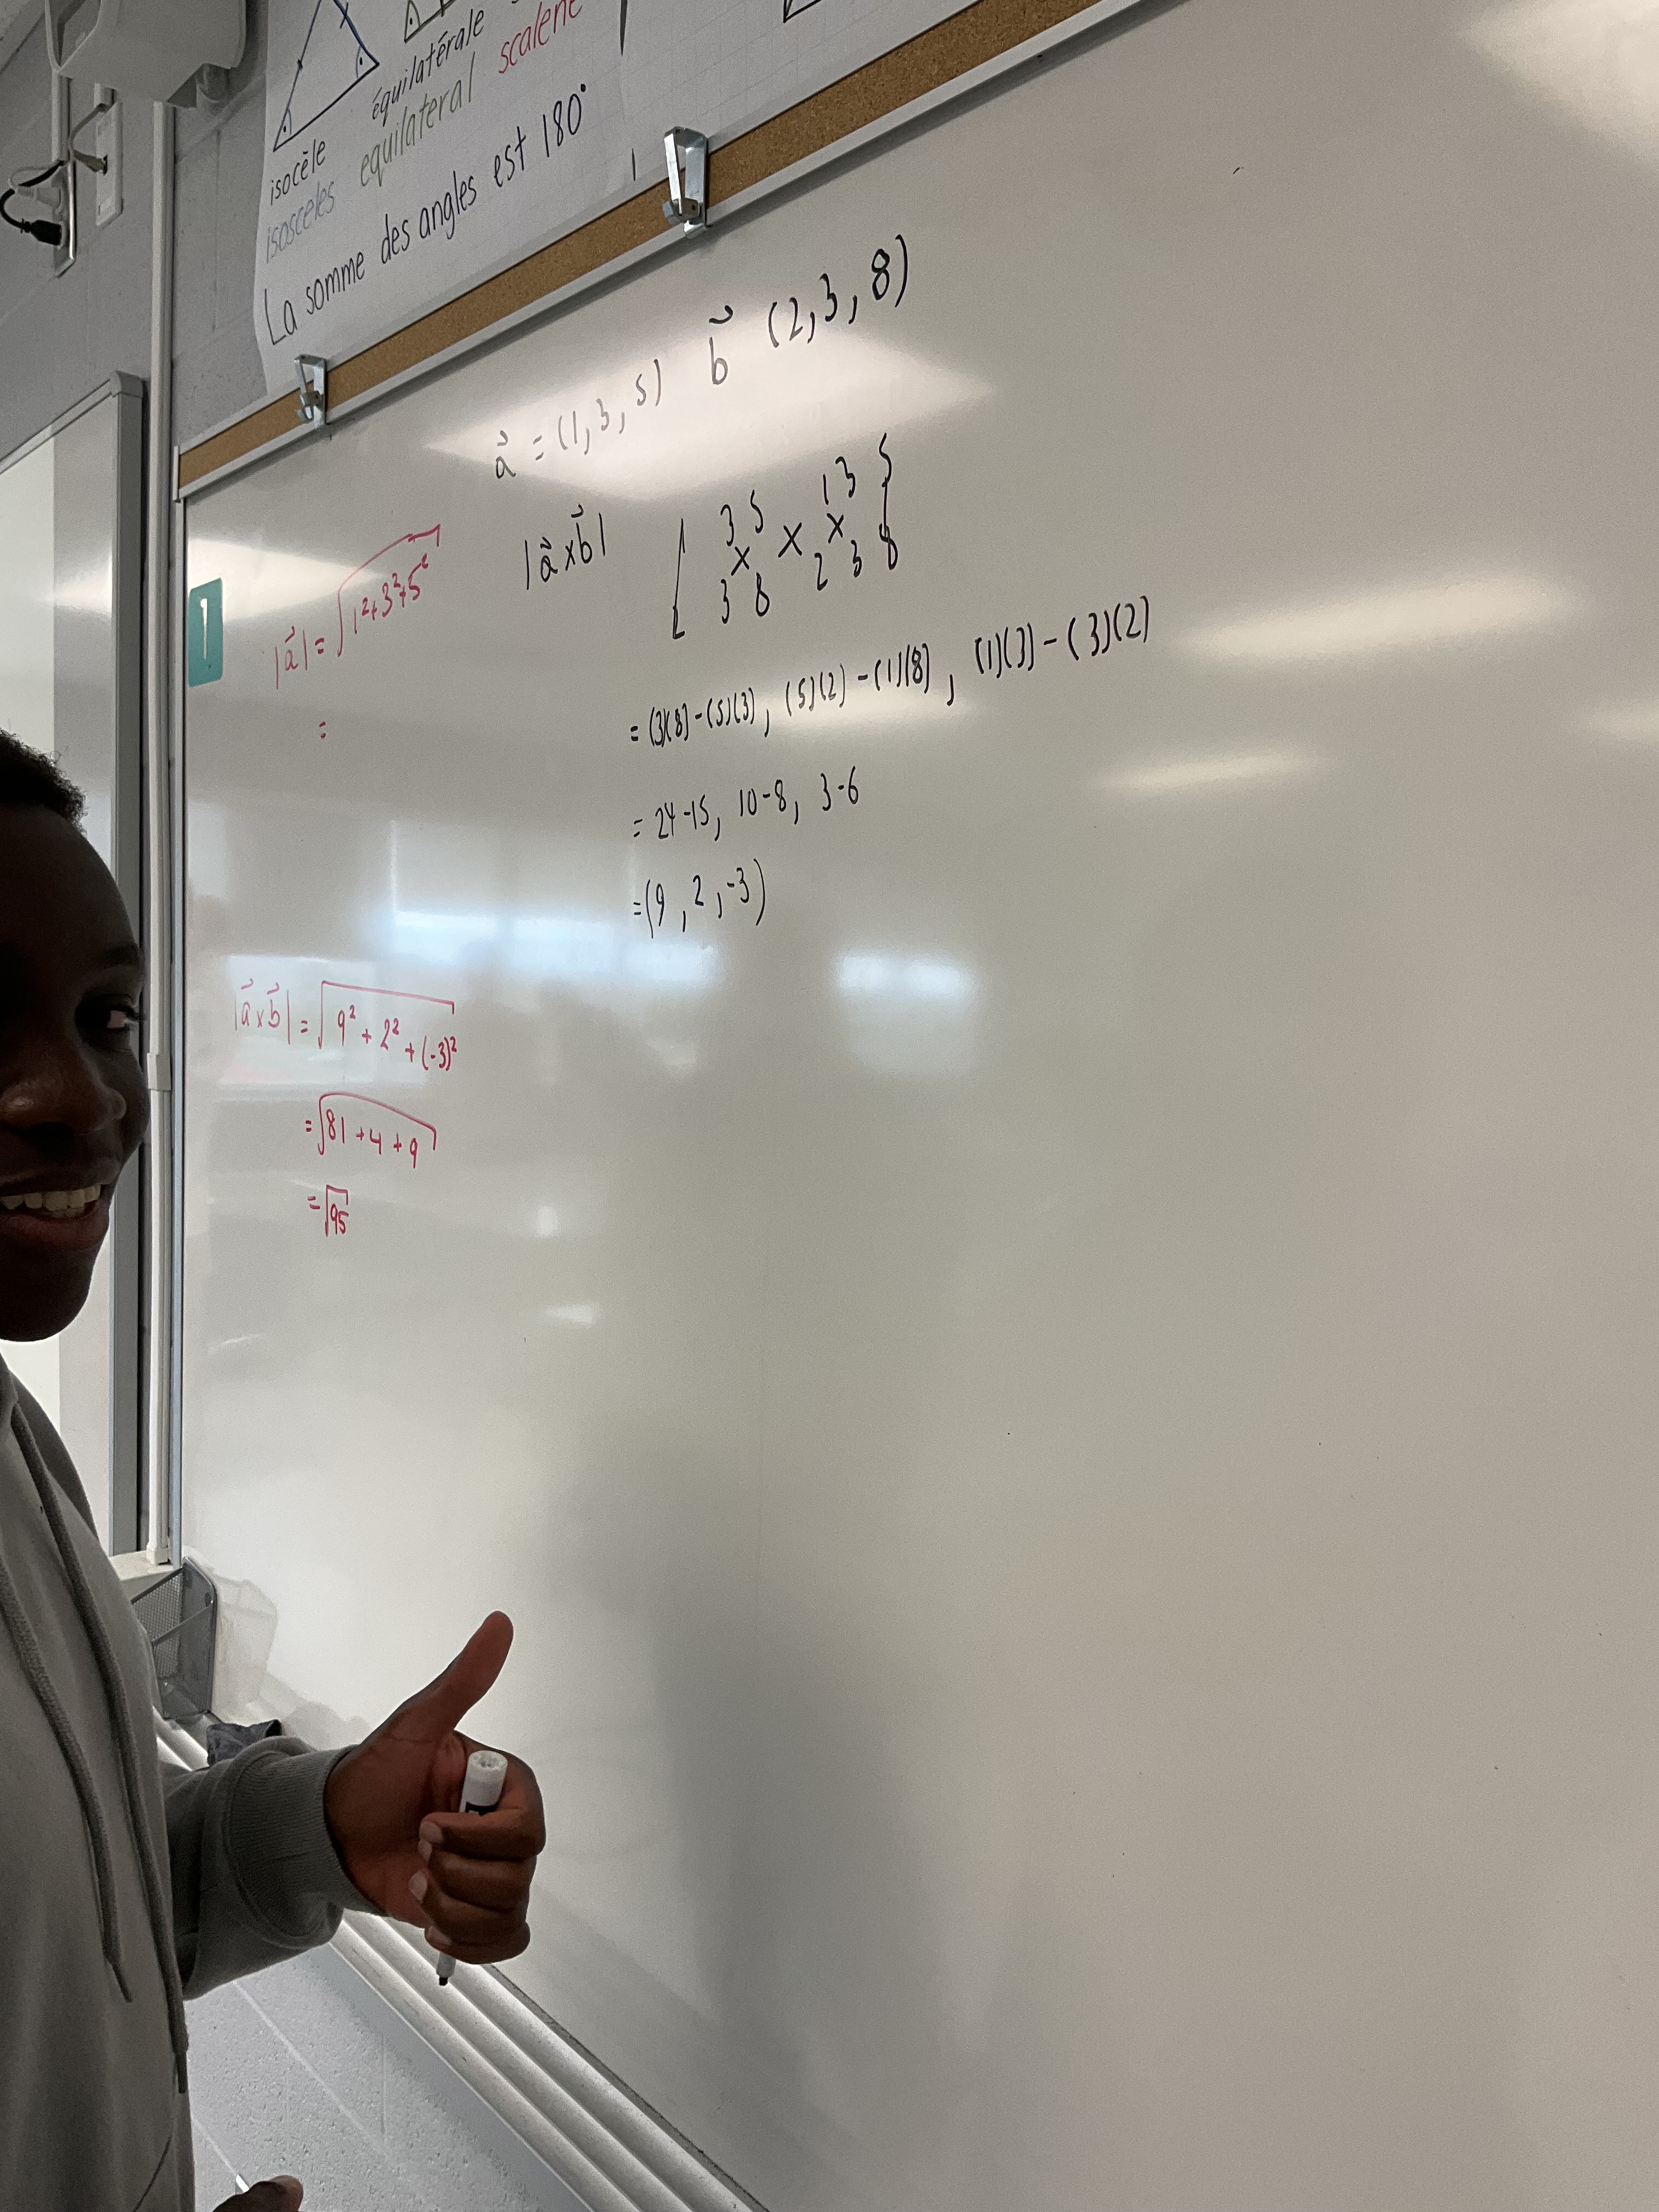
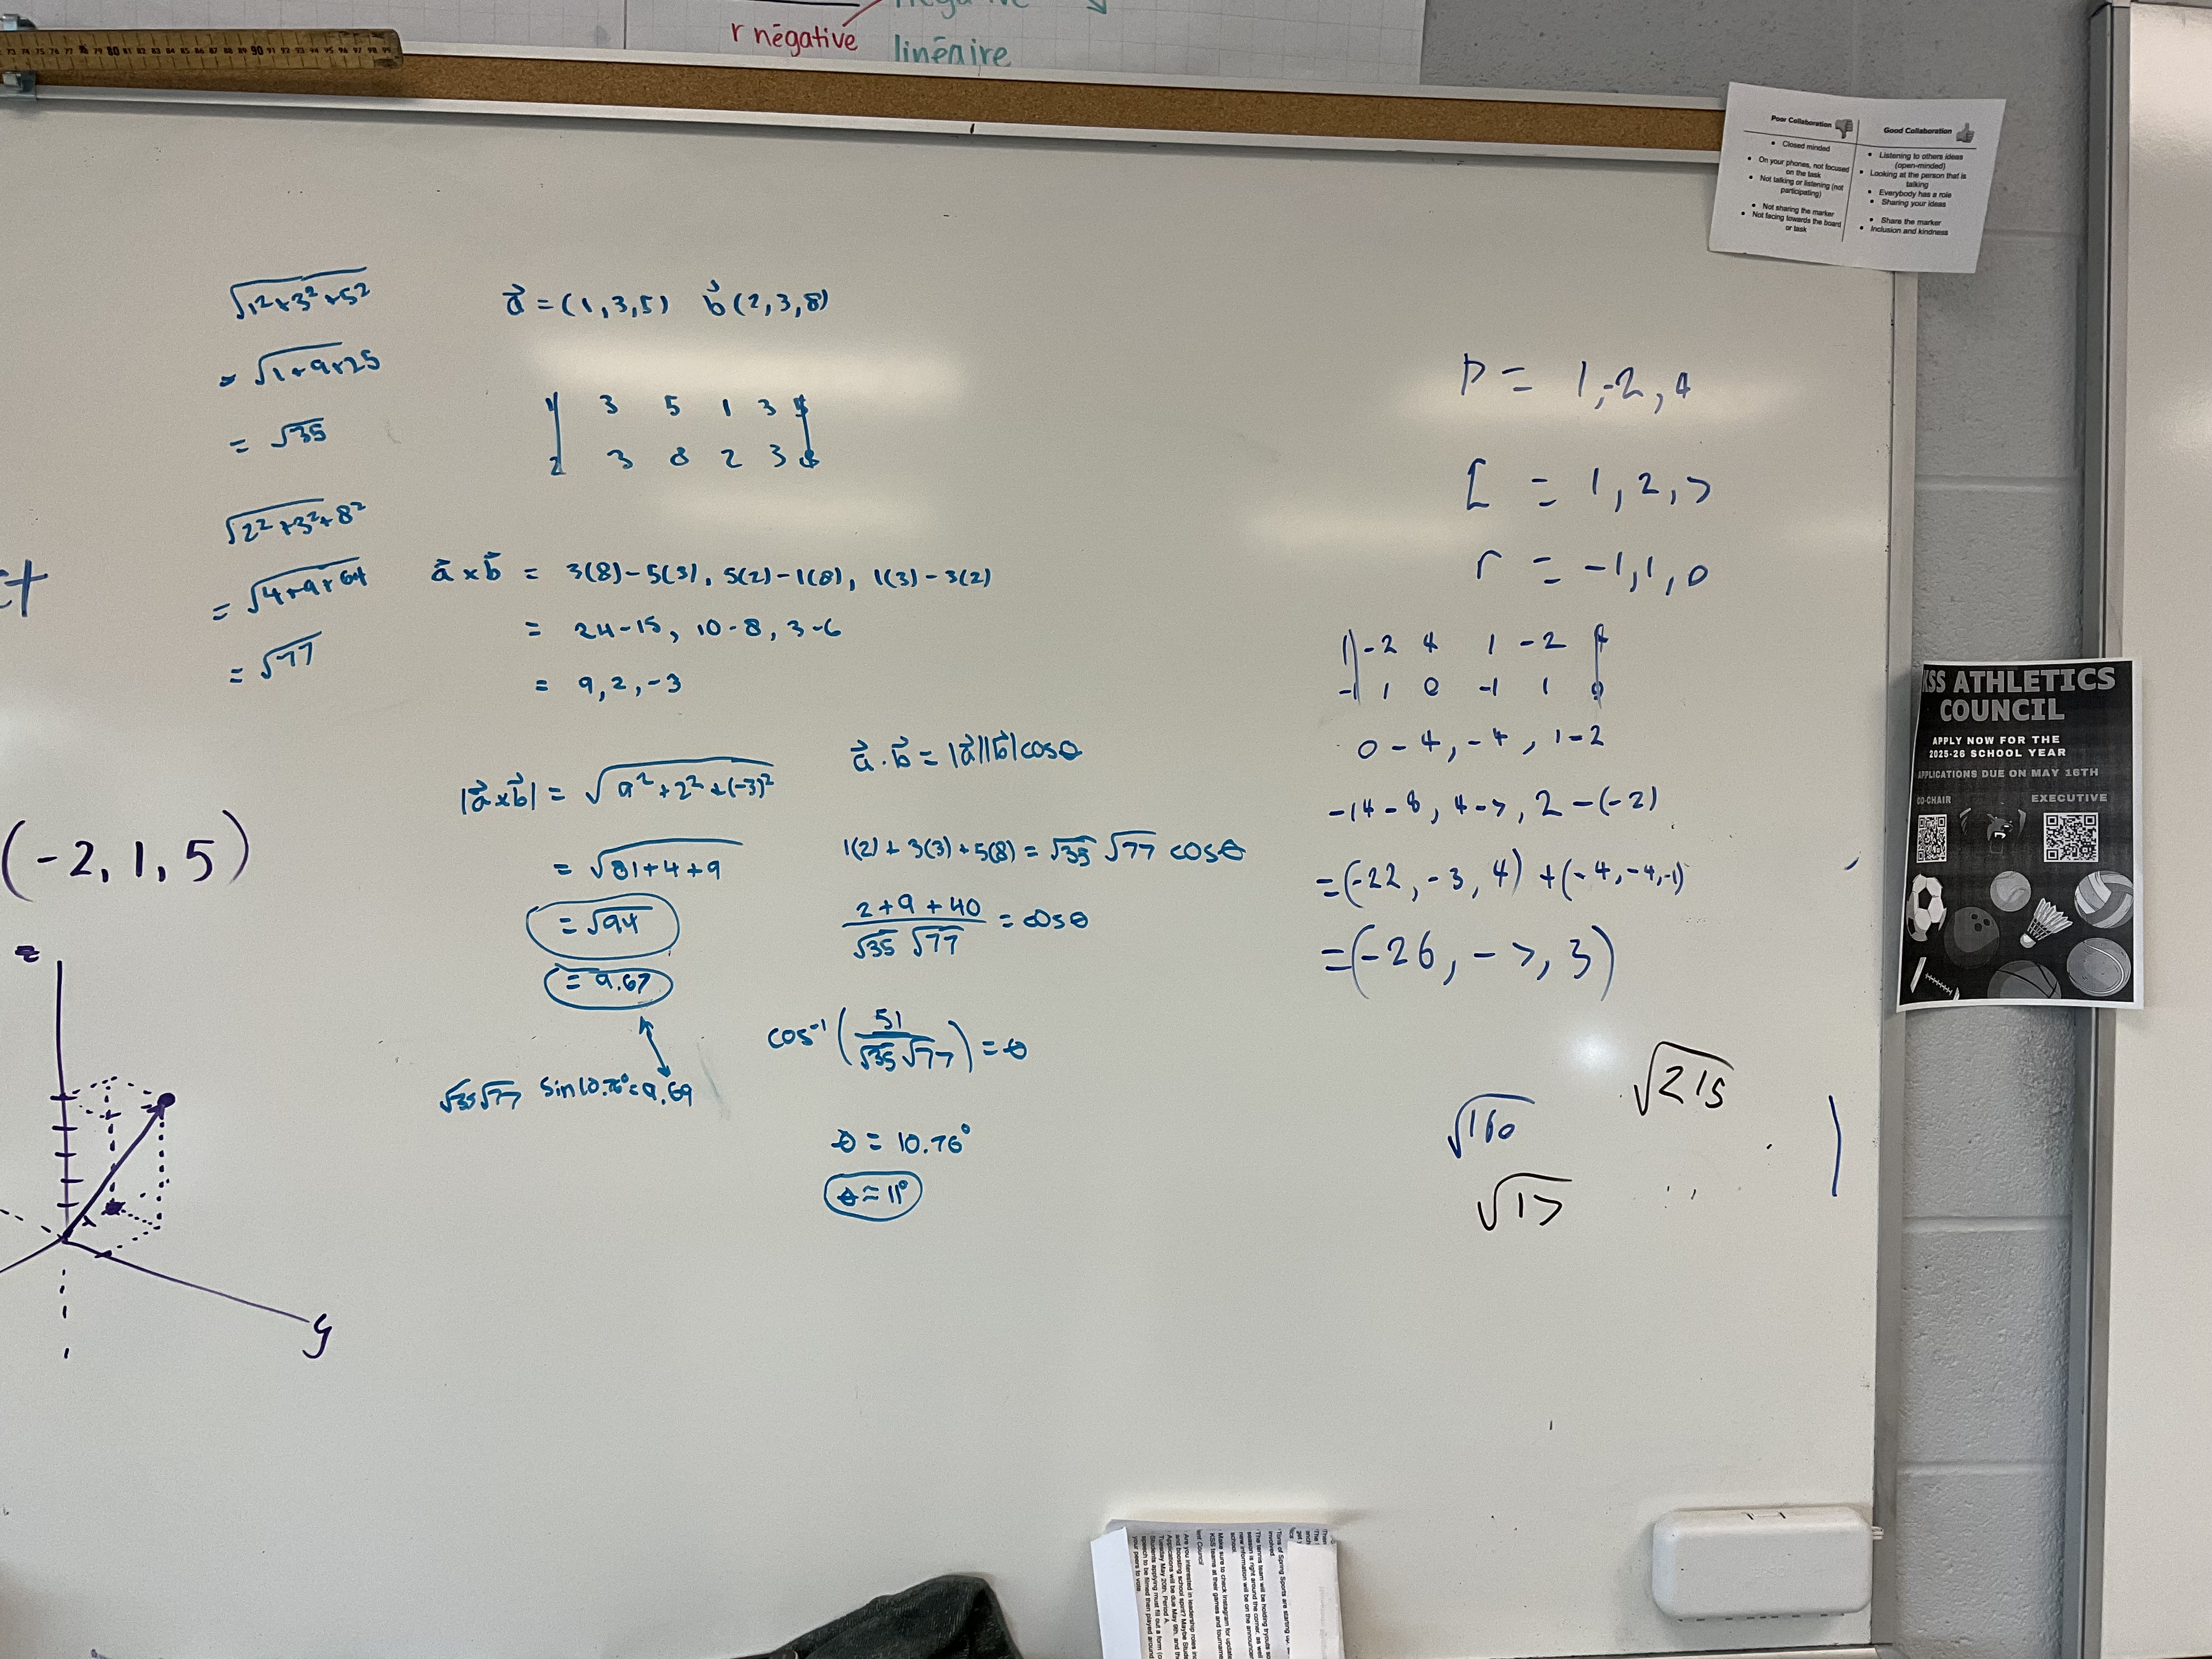
Grade 12s are getting into some fun vectors problems these days. We have learned how to do the dot product and the cross product now

We’ve now seen how to calculate angles between vectors, and we were able to show that the magnitude of the cross product of a and b is equivalent to the magnitudes of a and b times sine of the angle between them.
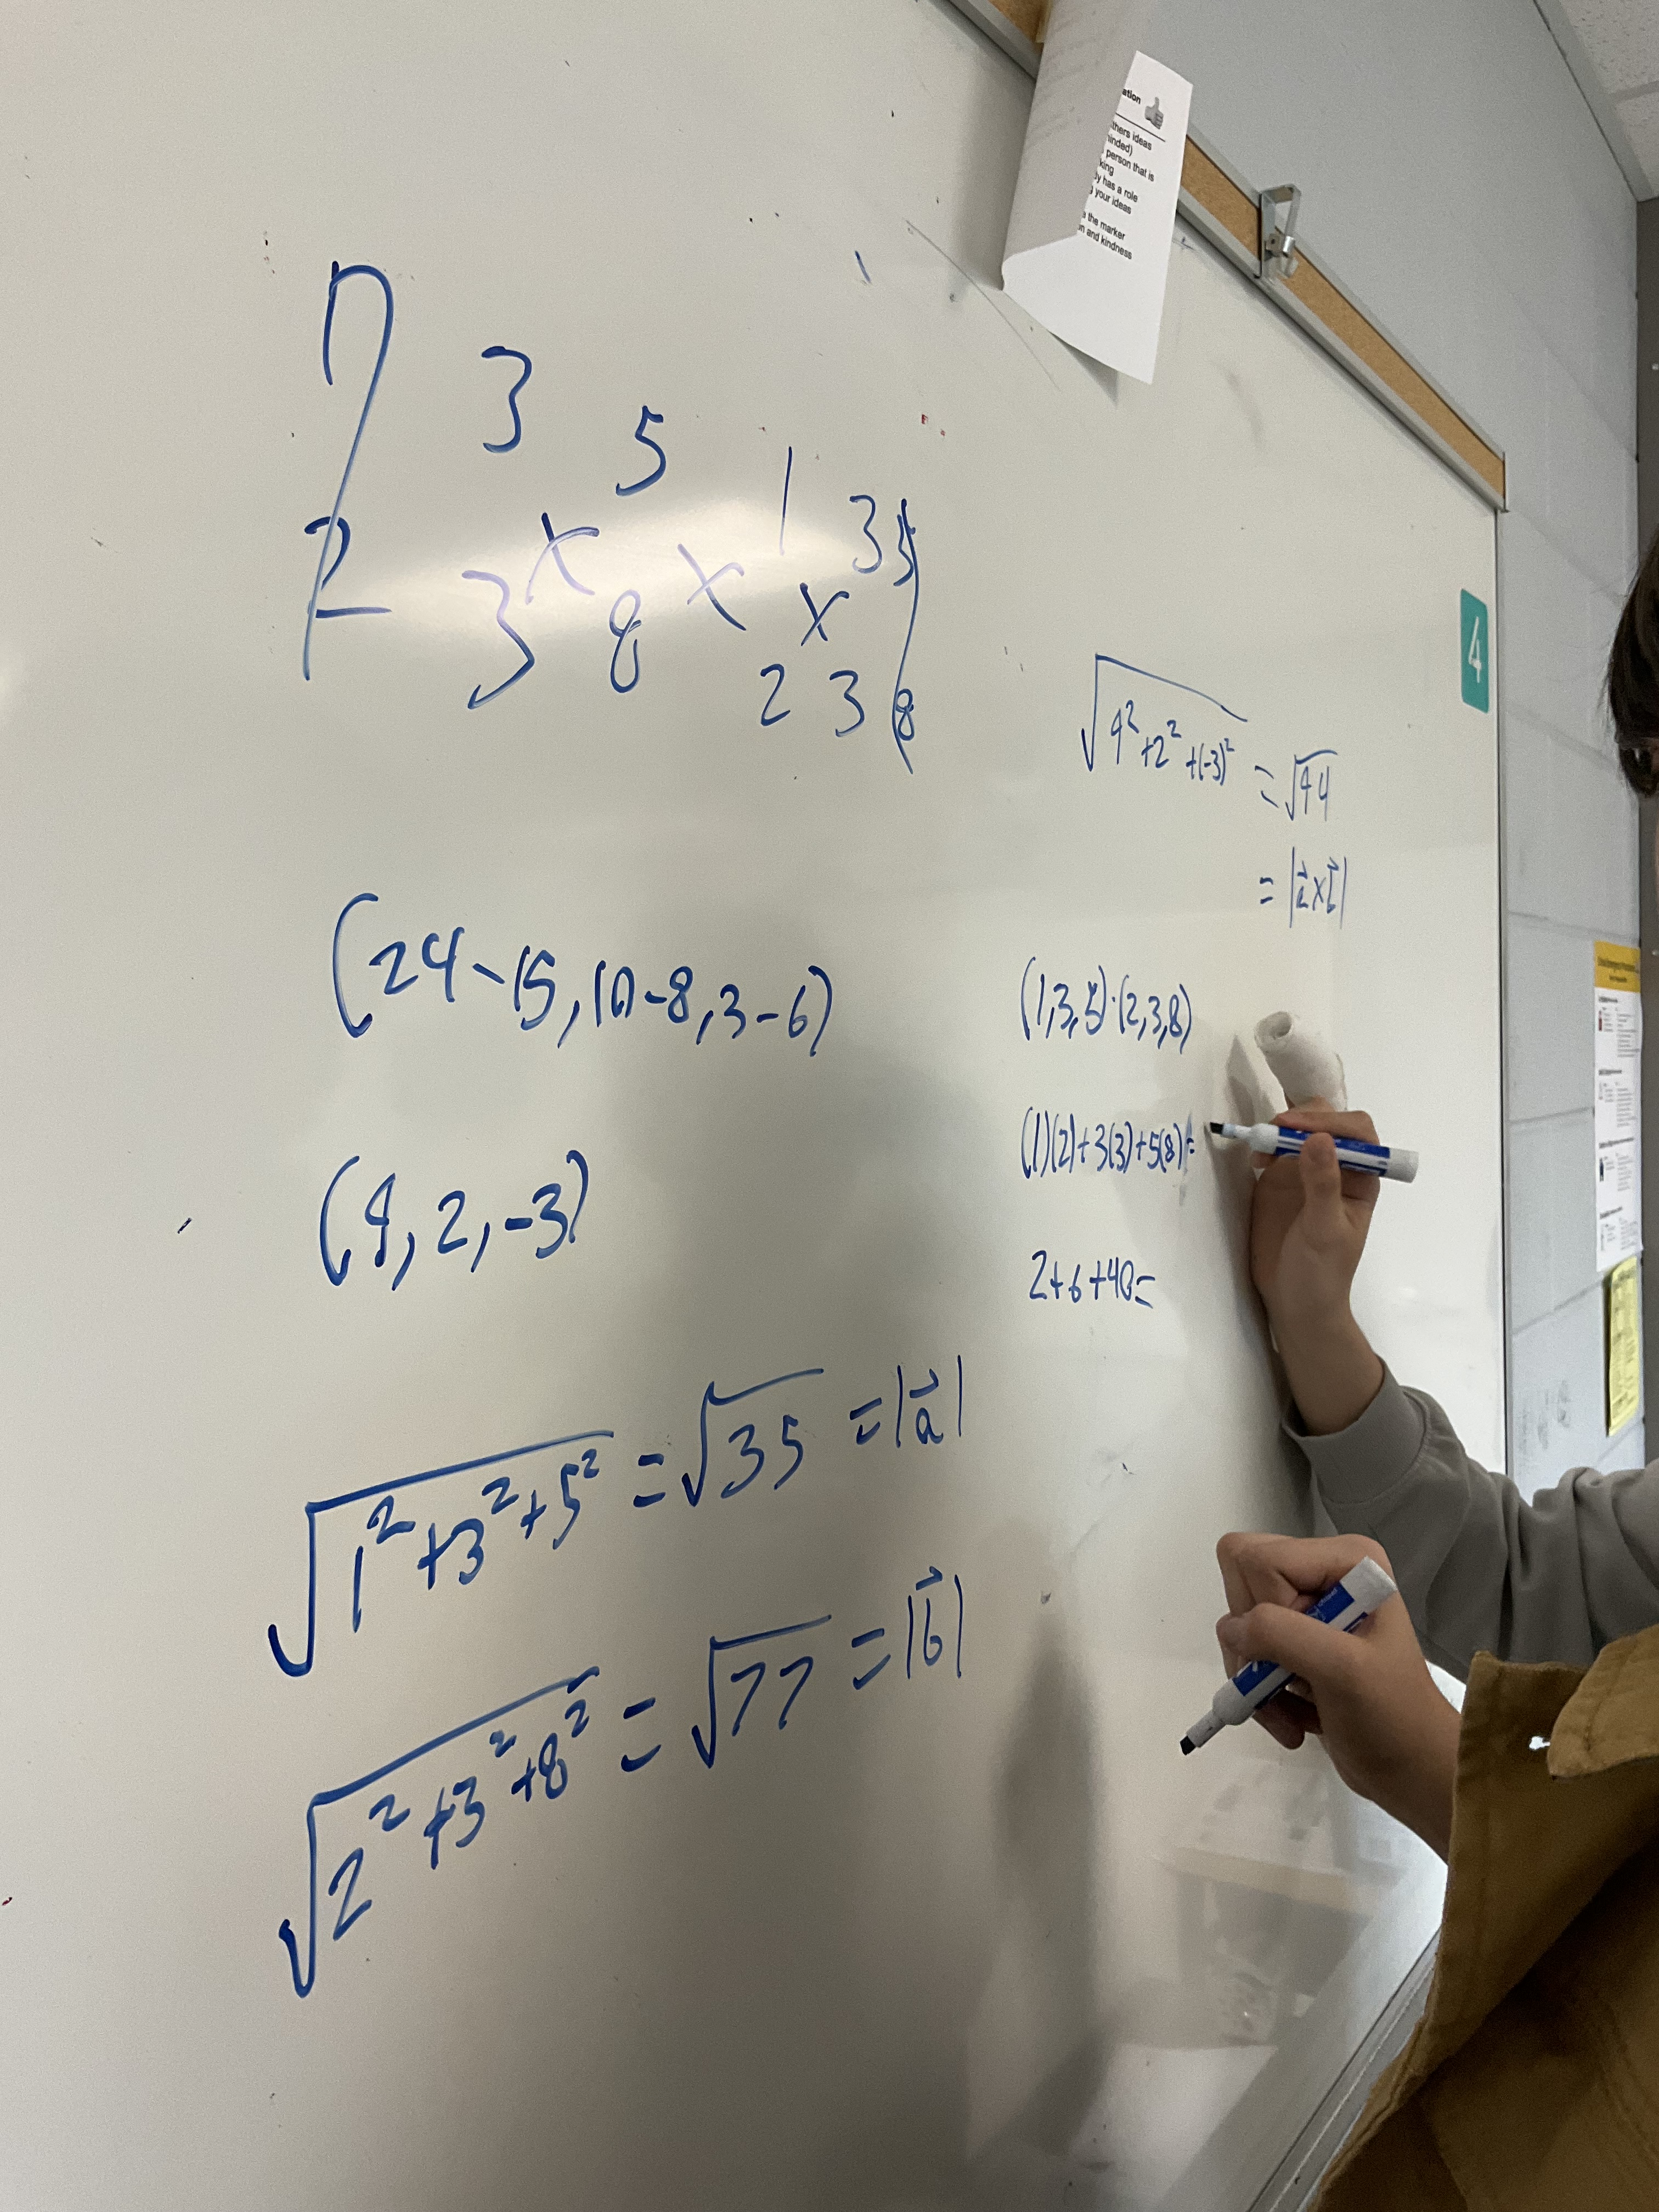
it’s fun to see people proud of their work!
We had a fun time figuring out how to use our hands to do the right hand rule today as well
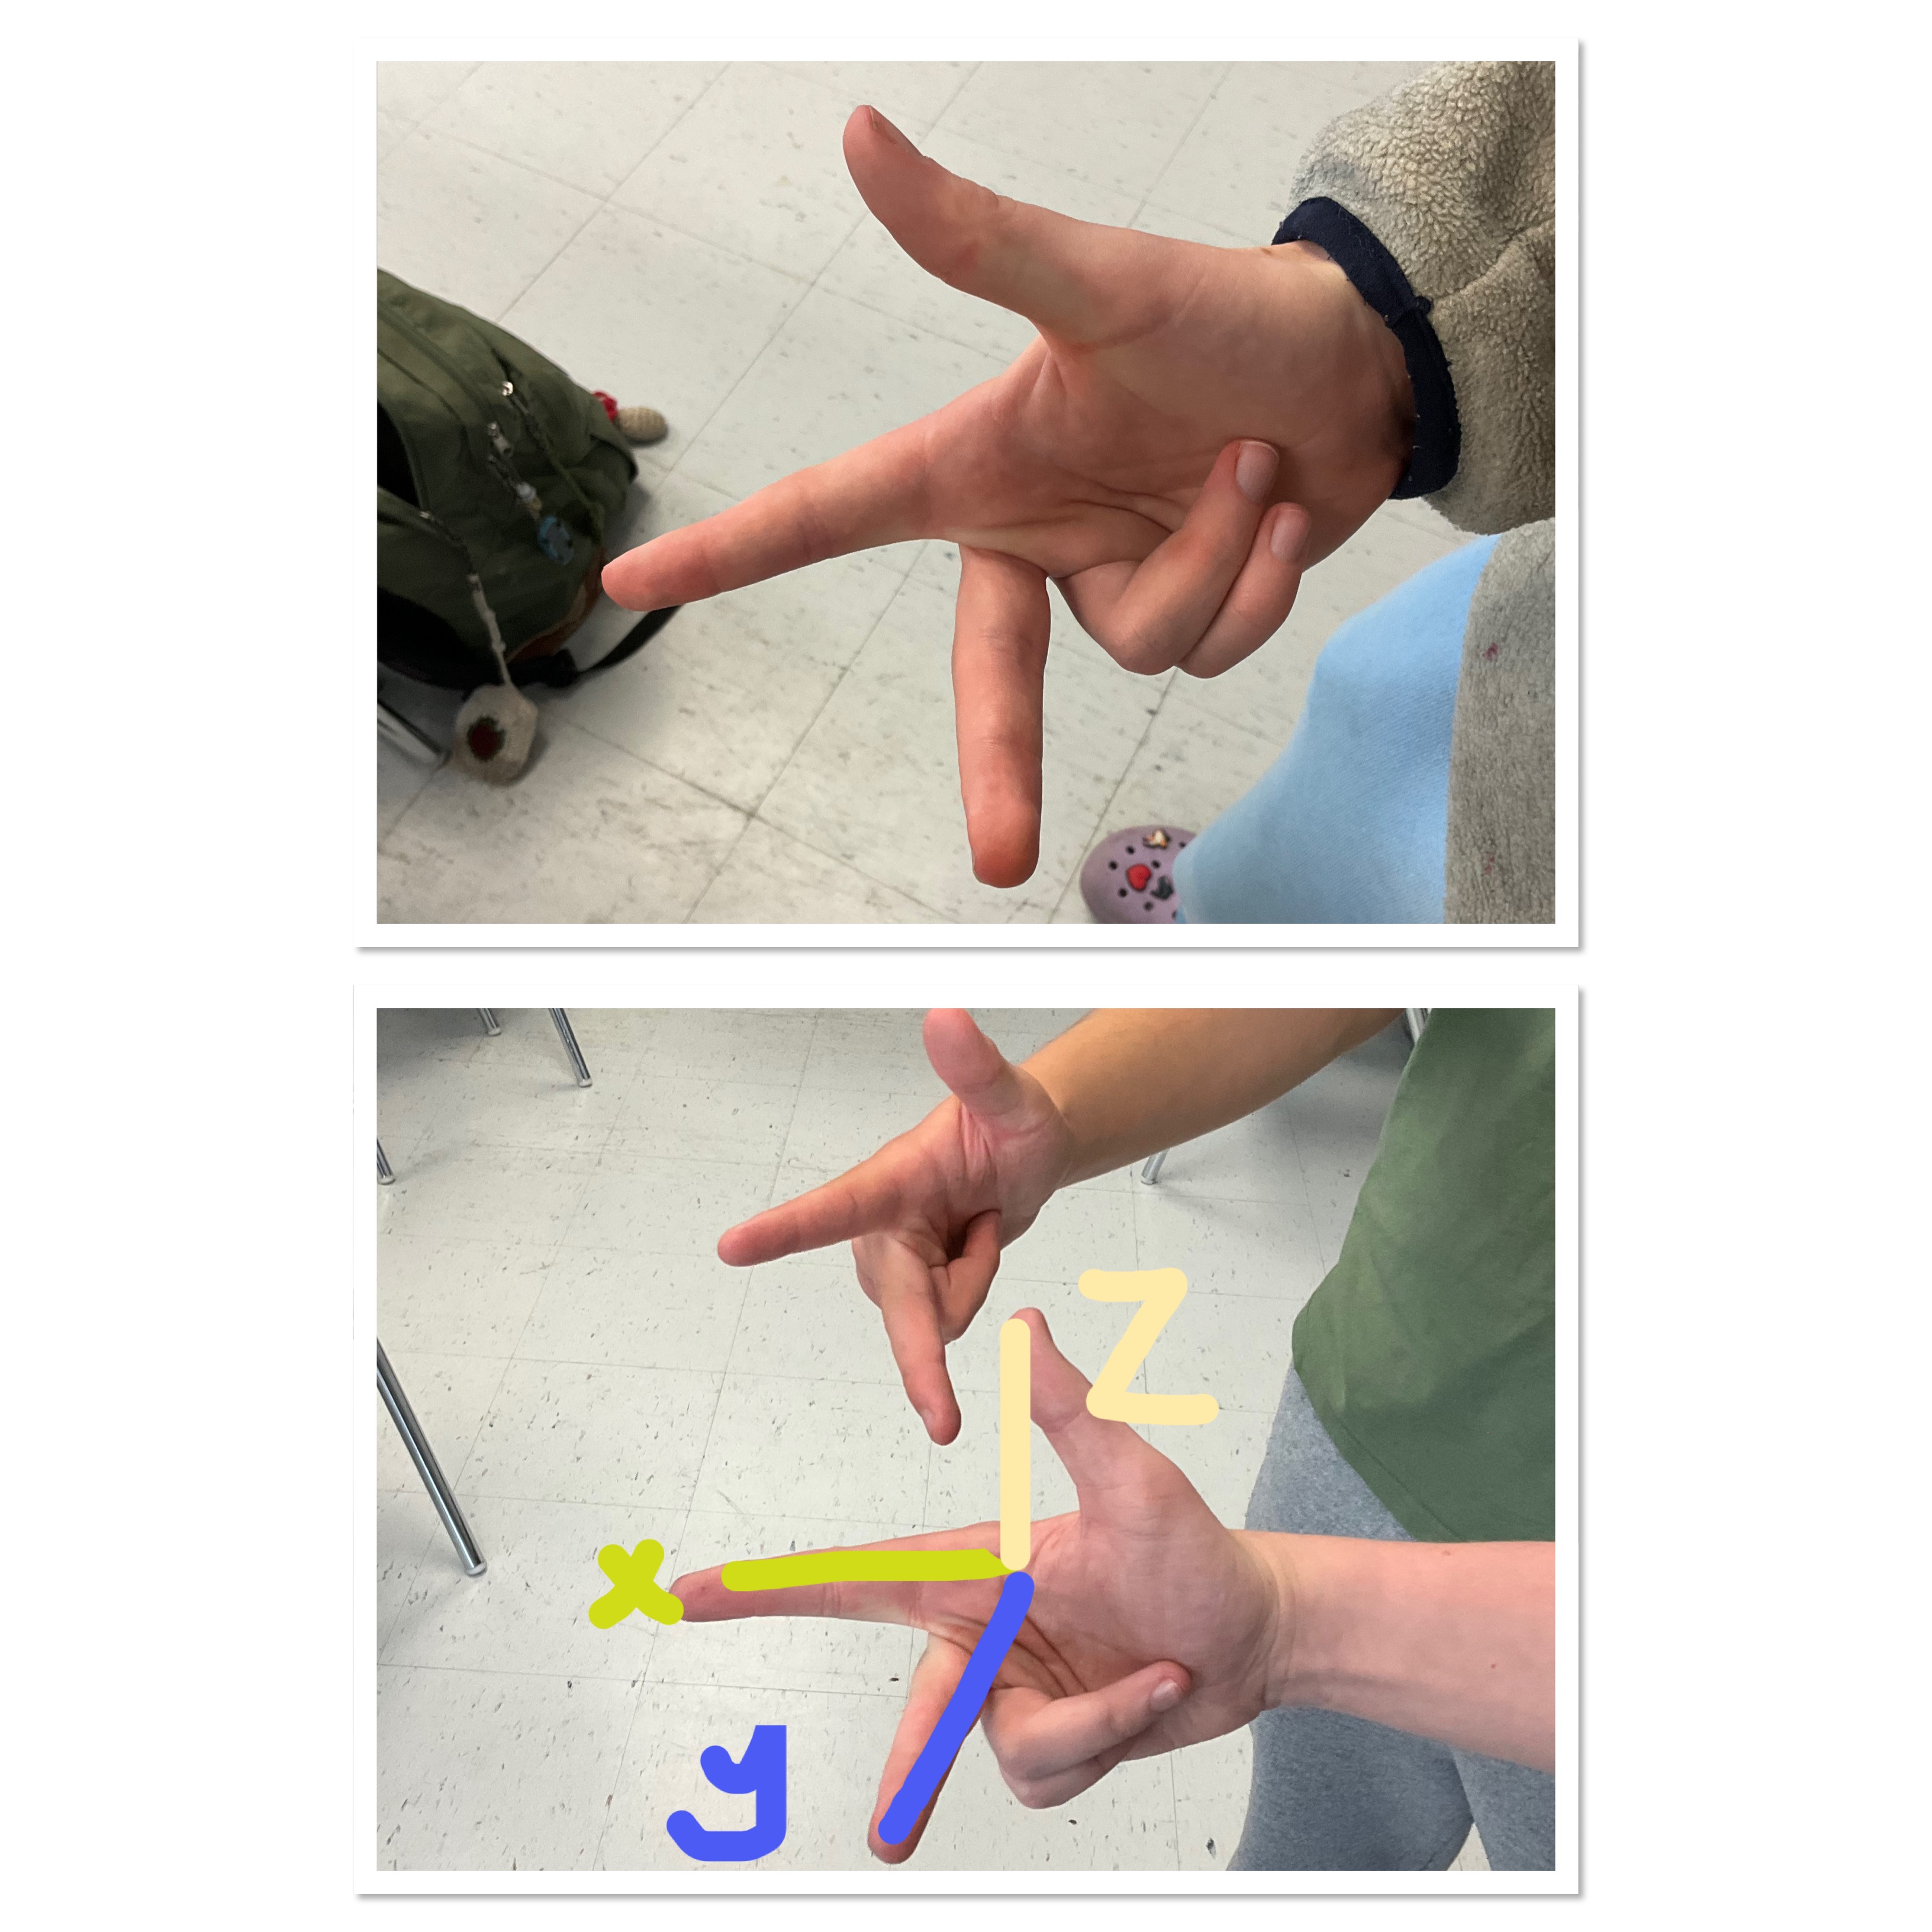
We’re keeping our motivation into the last month of school!
keep it up!
Productive Struggle
In grade 10 today we were working on solving quadratic word problems. We also were working on thriving through productive struggle.
Here’s an example of one of the questions. We know the sidewalk area equals the garden area, and we’re solving for the value of x, the uniform width of the sidewalk.

Groups worked together at the walls. We reflected a bit about how we all know each other’s names and we can all work together reasonably well. It’s been a semester of growth in teamwork!
Many groups used area model approaches to divide the sidewalk into sections. There was some struggle about making equations for area vs perimeter. We worked through that struggle for quite a while! Groups helped groups, we tried several approaches.
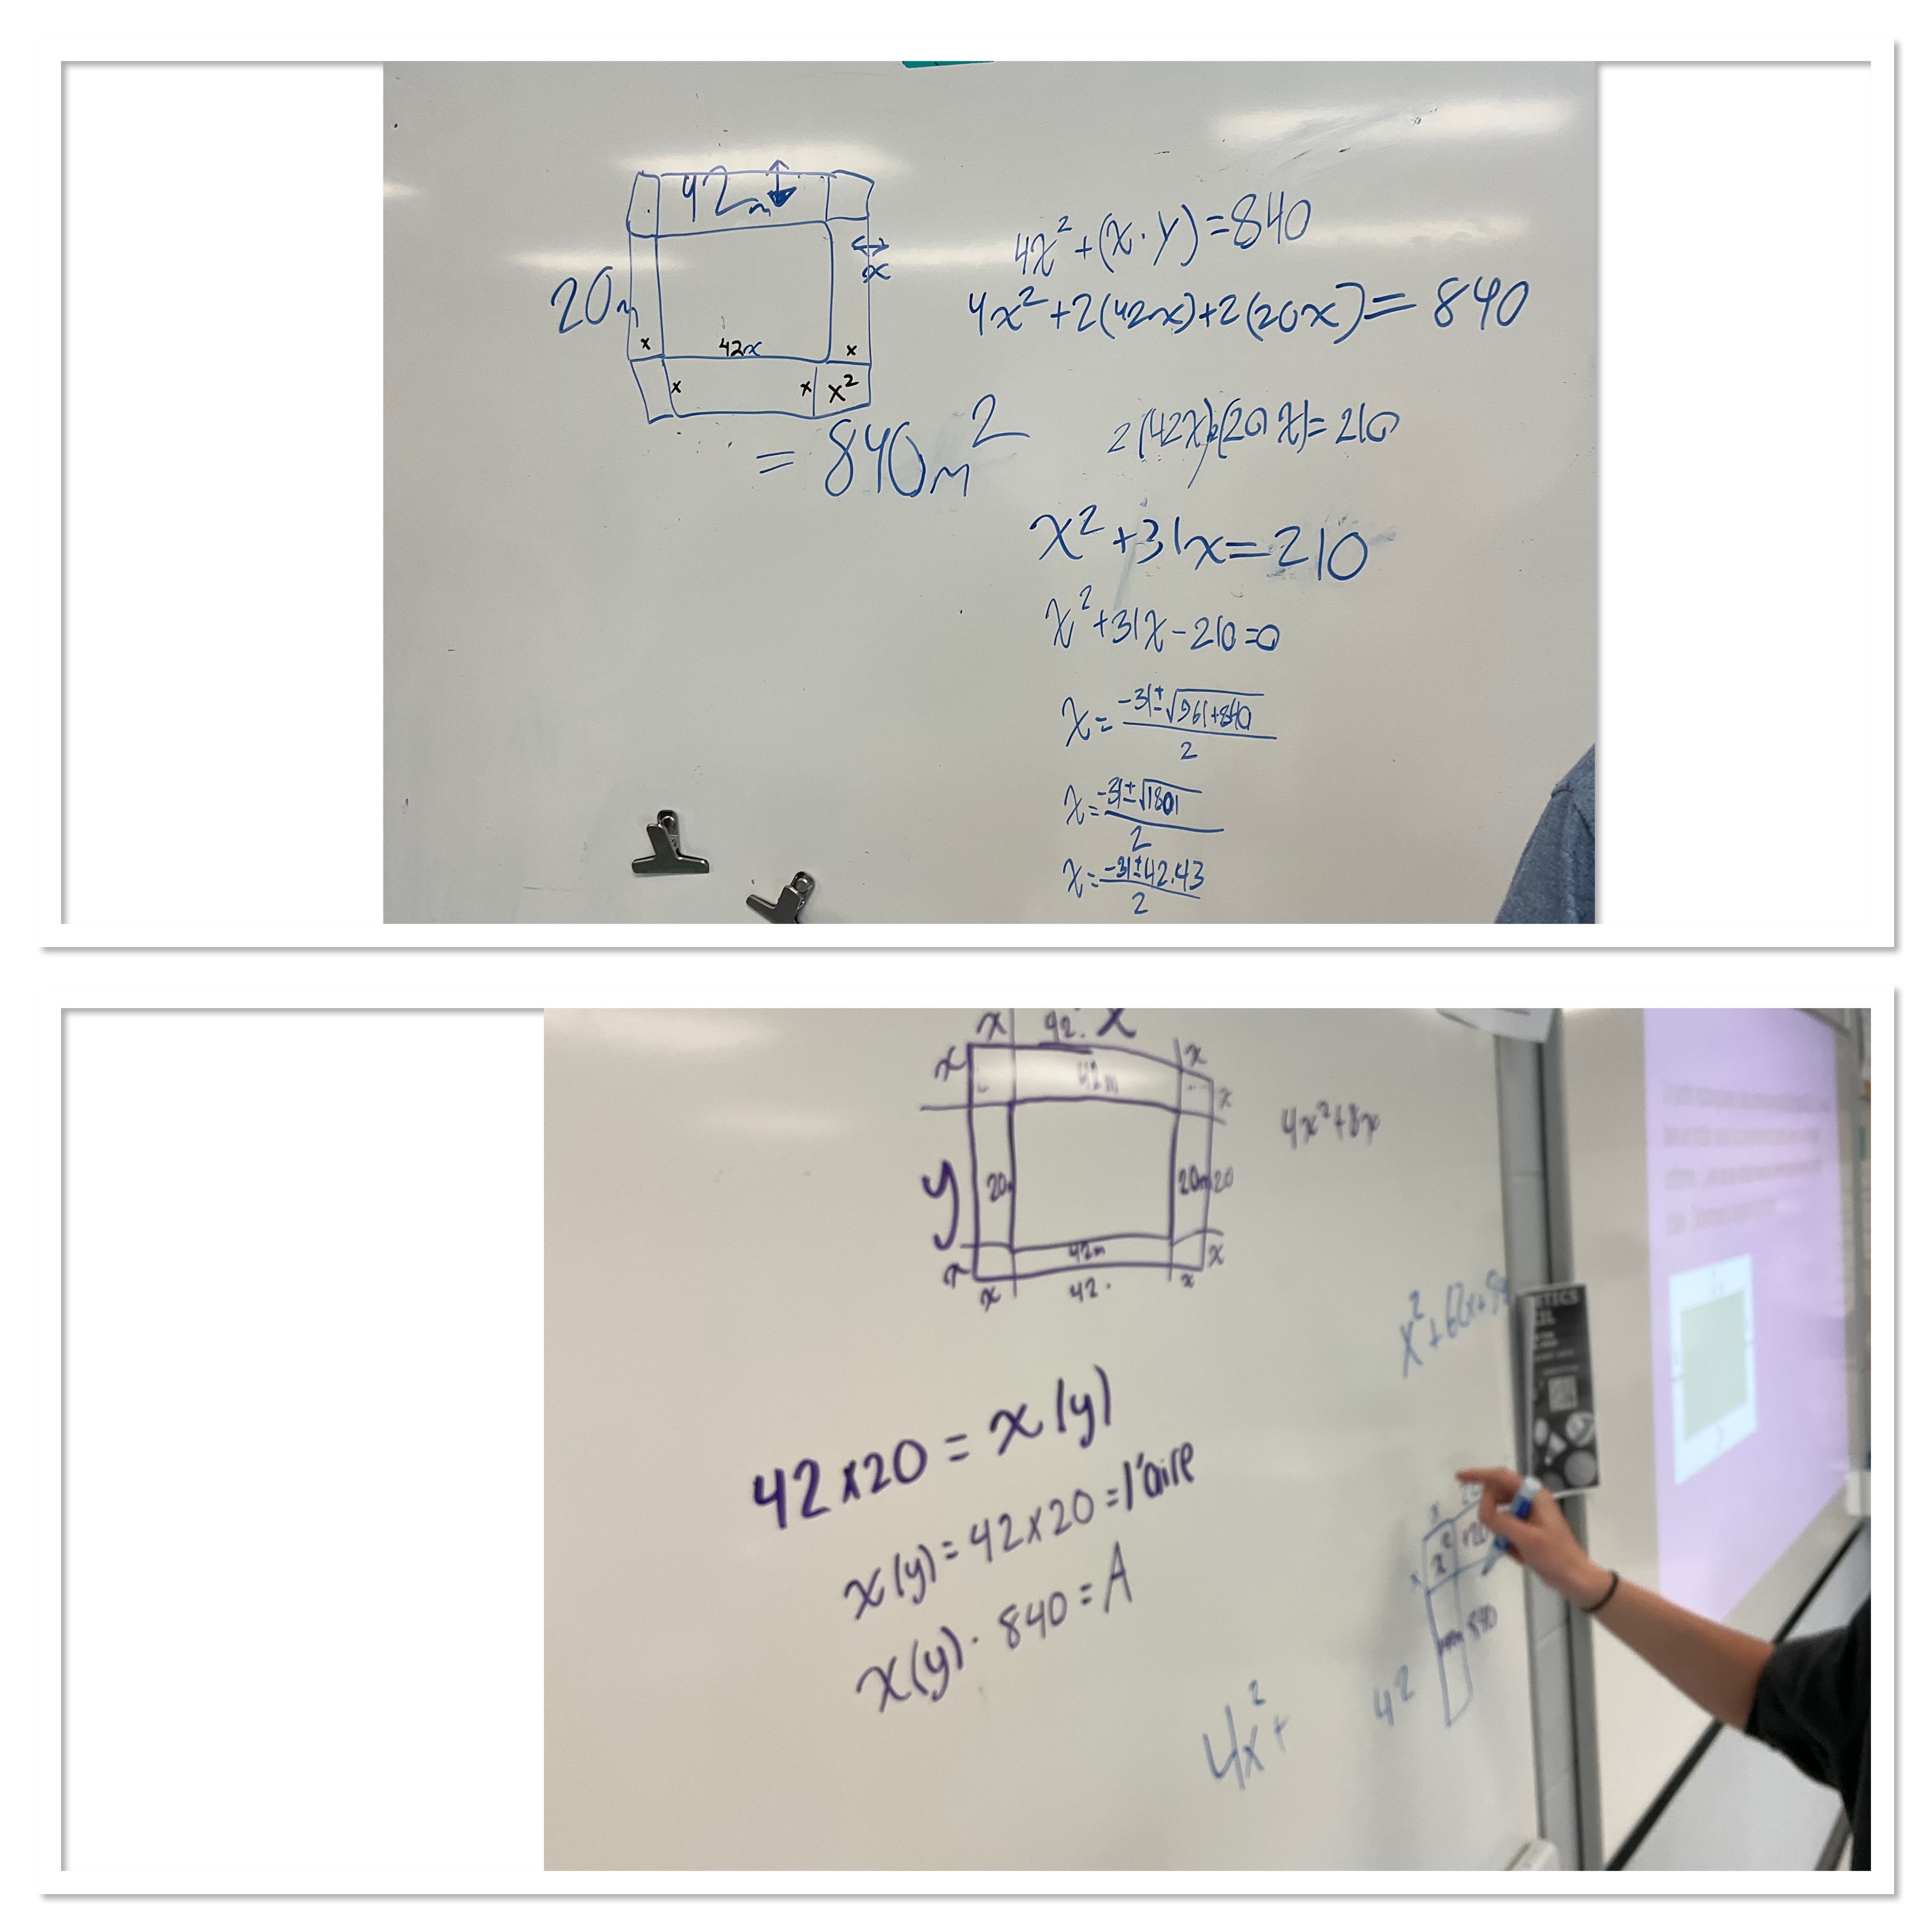
This group landed on an approach where they found outside dimensions of (42+2x) and (20+2x). They knew they needed to subtract the garden area, and then that equals the same as the garden area. Once we get to a trinomial=0 we can sig the quadratic formula and solve.

This group kept with the area model, and had the 4 corner x squares, and added 2 rectangles that were 20x, and 2 rectangles that were 42x. The total would be 840. This led to the same trinomial in the end.

We did a few more problems after this one. It’s important to practice a lot of different types of problems so that we get confidence in thinking through the process.
Math Buddies
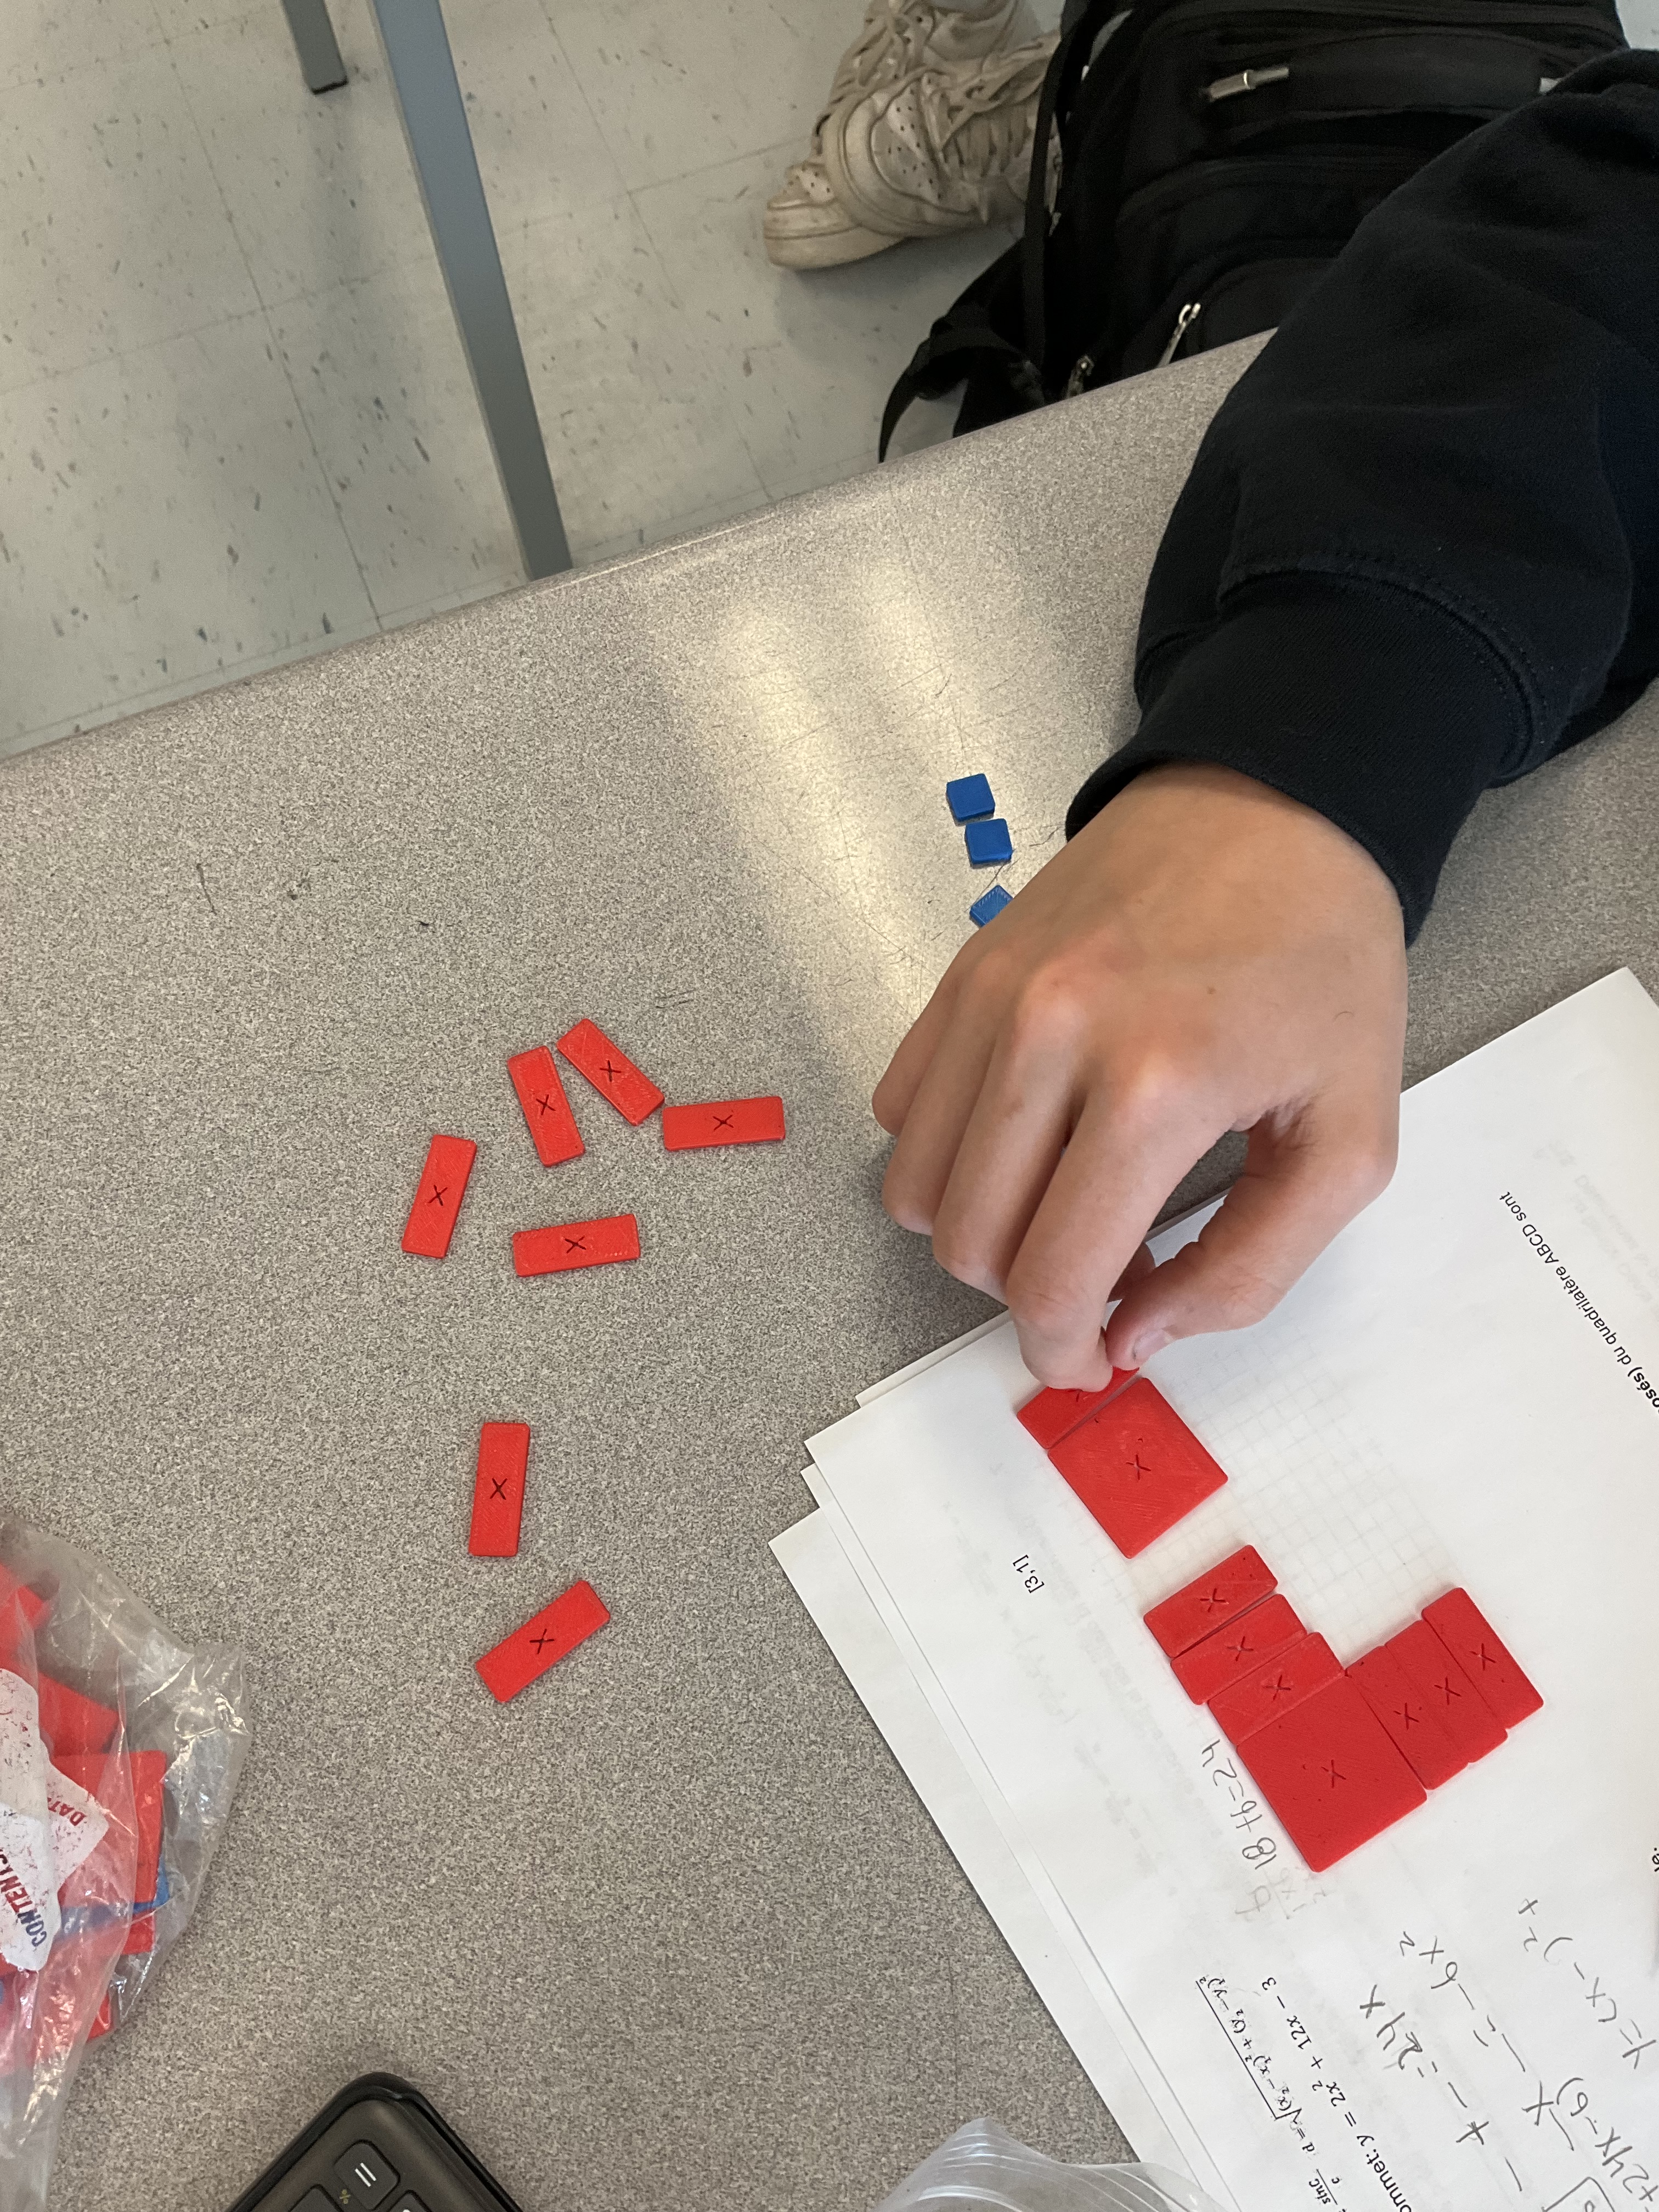
Today in grade 12 we invited the grade 11s from across the hall to join us to solve a problem. We worked together in random groups of 3, decided by drawing playing cards. The question we were working on was determining how many ways there were to “win” a game of 3D tic tac toe.

The representations used were pretty neat to see. We have been working on 3D vectors lately, and talking about the x,y,z axis and various planes, so grade 12s were jumping in to represent in pictures, and have good conversations with grade 11s to understand the problem and come up with a plan to represent their thinking.

Having blocks to hold and manipulate helped ground the conversations, and were useful when justifying conclusions. Groups saw and organized the “wins” in several different ways, which was neat to see. Some groups after doing a 3x3x3 case, were asked about a 4x4x4 or 5x5x5, and one group dove in and tried to model a general case of a cube of length w.
After coming up with models, they were asked to graph them, look for features of the graph, explore the domain, and talk about what set of numbers made sense for this task. One group even wrote a piecewise function as a model.
Grade 12s were great collaborators, bringing some additional knowledge from advanced functions, and vectors, while grade 11s had some knowledge about functions, domain and range at the top of their minds. It was a successful collaboration and the room was buzzing for the last period on a Friday before a long weekend. Way to end the week on a high note. Thanks to all for participating. Thanks to Al Overwijk for the inspiration of this problem.
