Citrus Week (Day 1 and 2)
In MAT1L this week students have been investigating citrus fruits. There are 5 teams, each with a different fruit to explore.
On Day 1 students did a lot of work with estimating and measuring the whole fruit. Groups named their fruit, and drew faces so we know how to orient them when we take measurements.

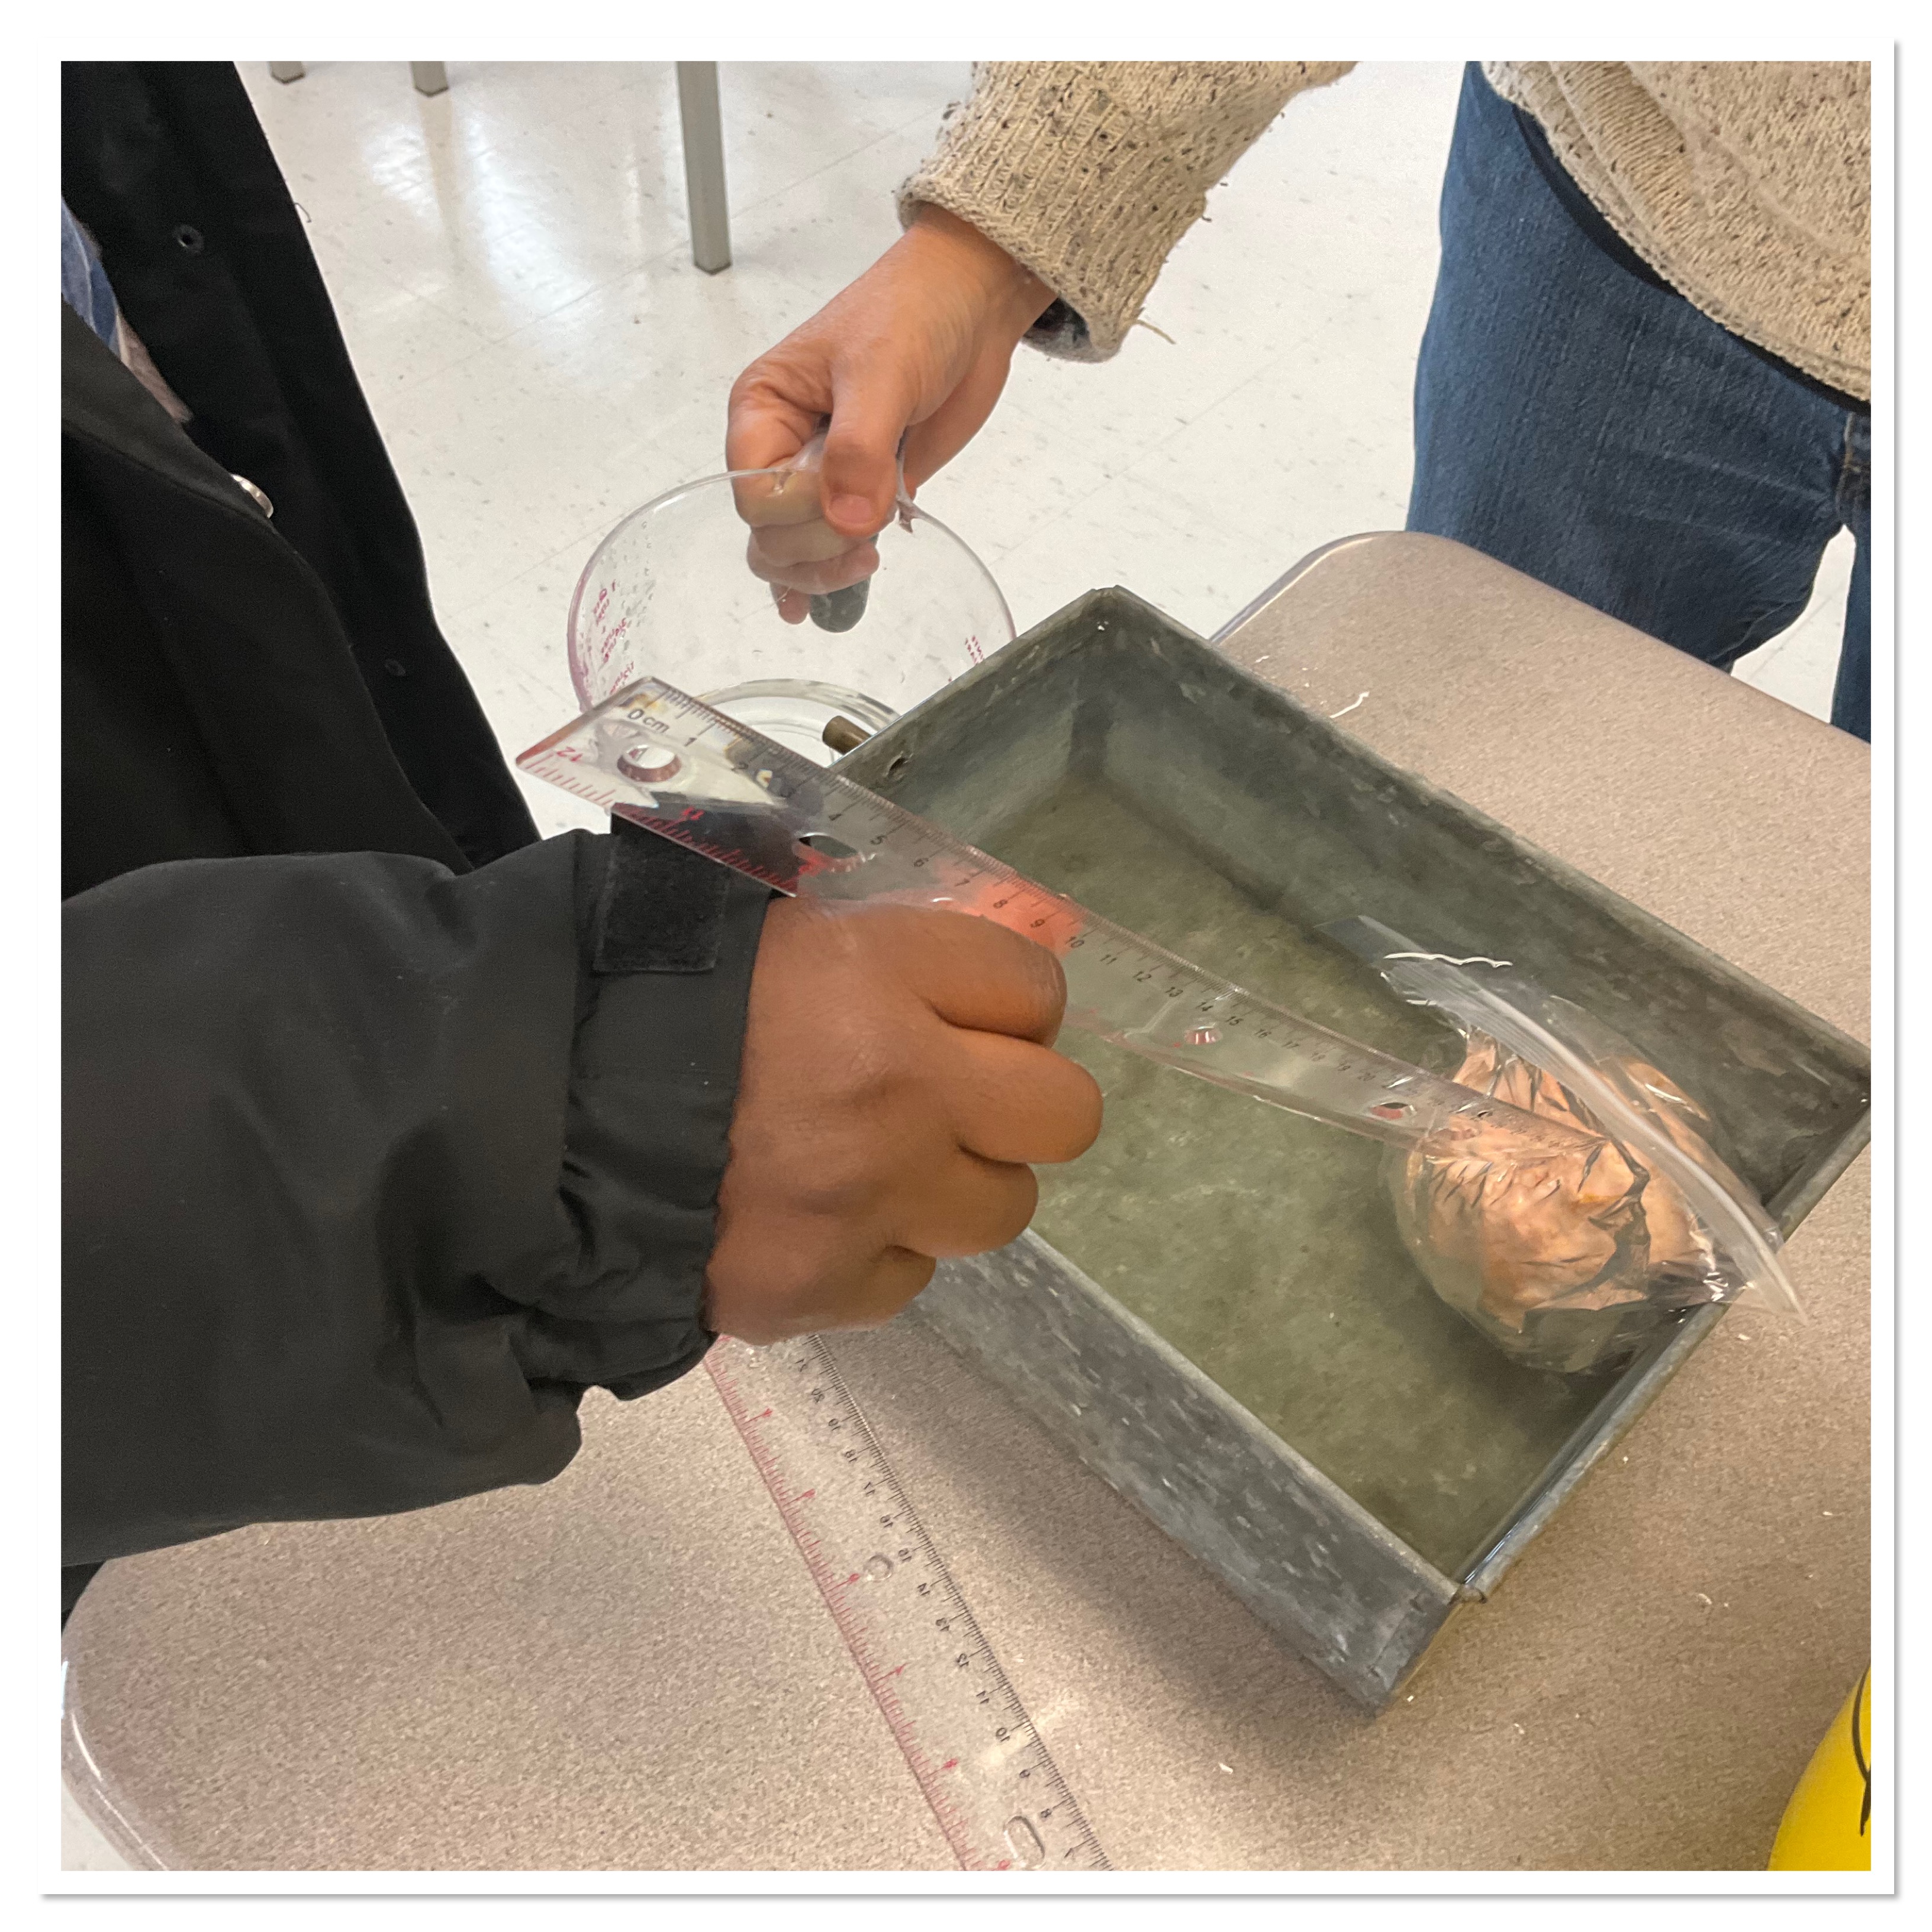
We estimated and measured dimensions (length, width and height) in inches and cm, we estimated and measured the weight. We estimated and measured the volume in cups and in mL. We used a displacement tank to find out the volume. Here is Gerold the orange having a bath in the displacement tank.

Next we peeled the fruit, and looked at how many circles the peel would fill in. We made circles the same size as the original fruit. It’s pretty cool that the peel will fill 4 circles. The surface area of a sphere is 4(pi)(r^2) which is 4 times the area of a circle with the same radius.

We estimated and measured the thickness of the skin, and the dimensions of the peeled fruit. Then we measured the volume of the peeled fruit.
We will continue exploring as citrus week proceeds! We’ll be looking at the number of segments, and seeds, and then finally juicing the fruit.
Building Pyramids
Today in grade 9 we were looking at the volume of pyramids and cones, compared to their prisms of the same height.
We used water to see that a pyramid can be filled and poured 3 times into a prism, just like the video shows.
We then had the challenge of building square based pyramids with a volume of 300 cubic centimetres.
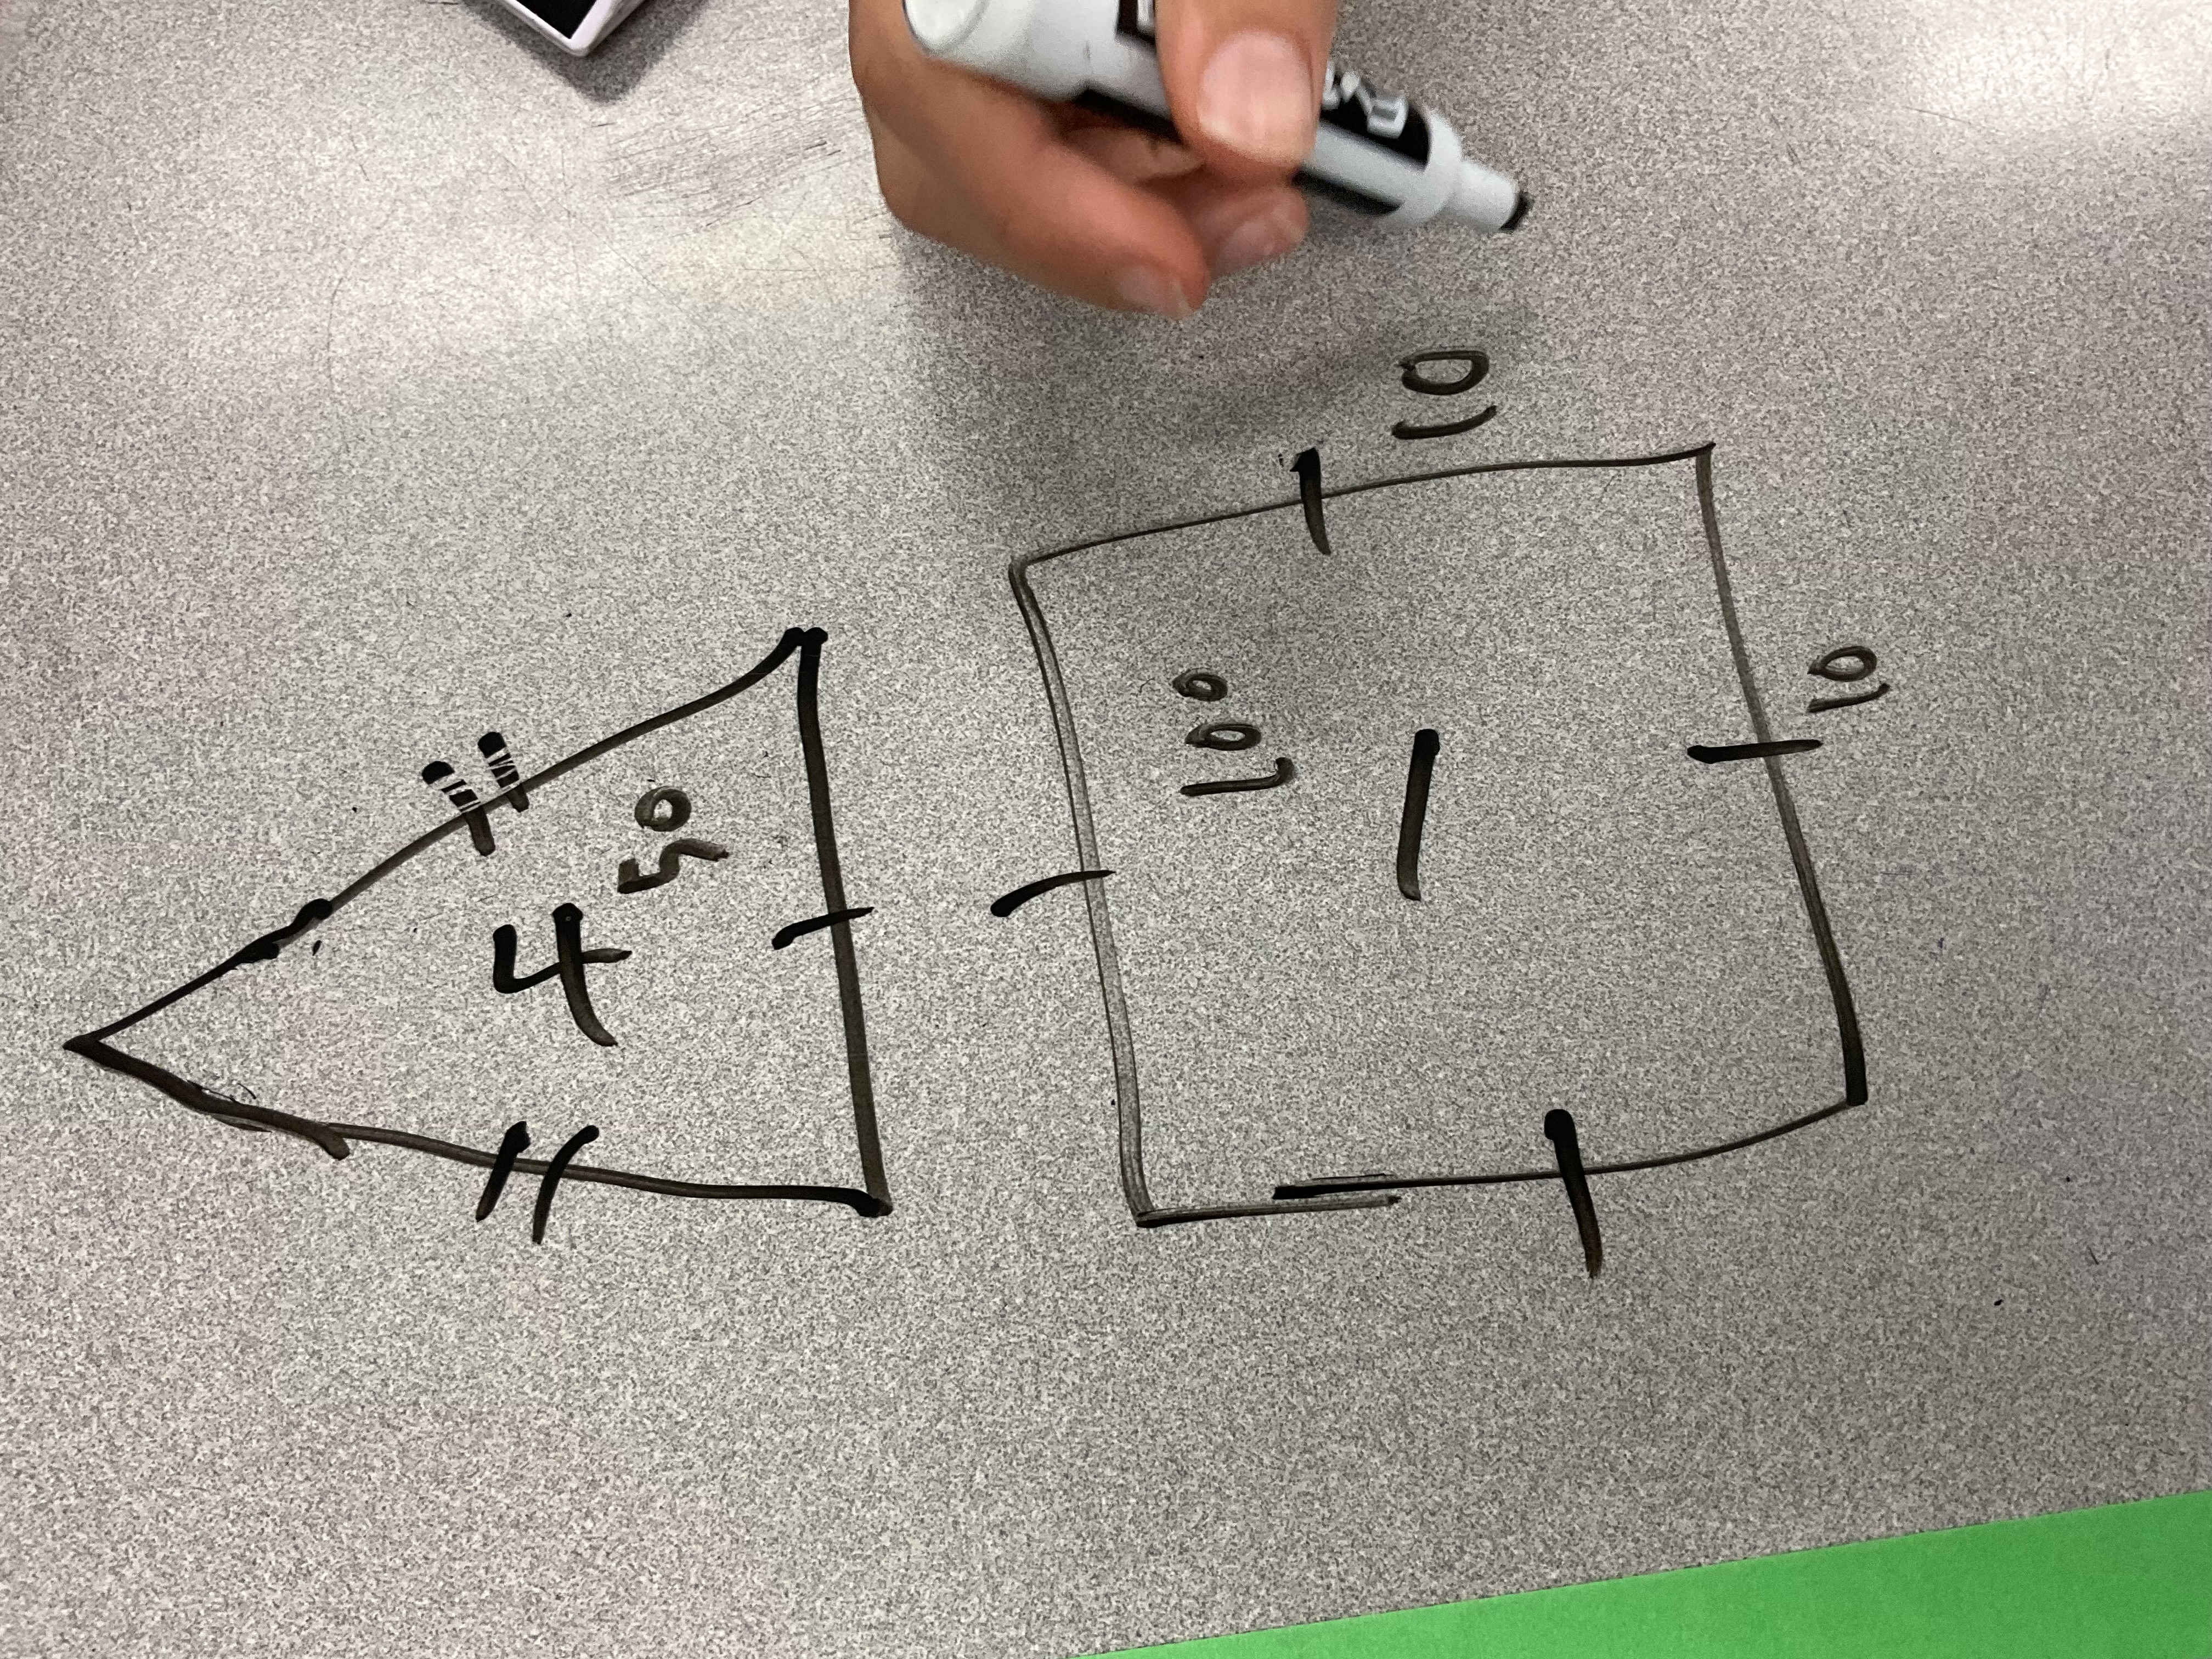
We know that the volume of the prism with same length, width and height as the pyramid would be 900 cubic centimetres.

We noticed that many groups made pyramids that were shorter than they had planned.
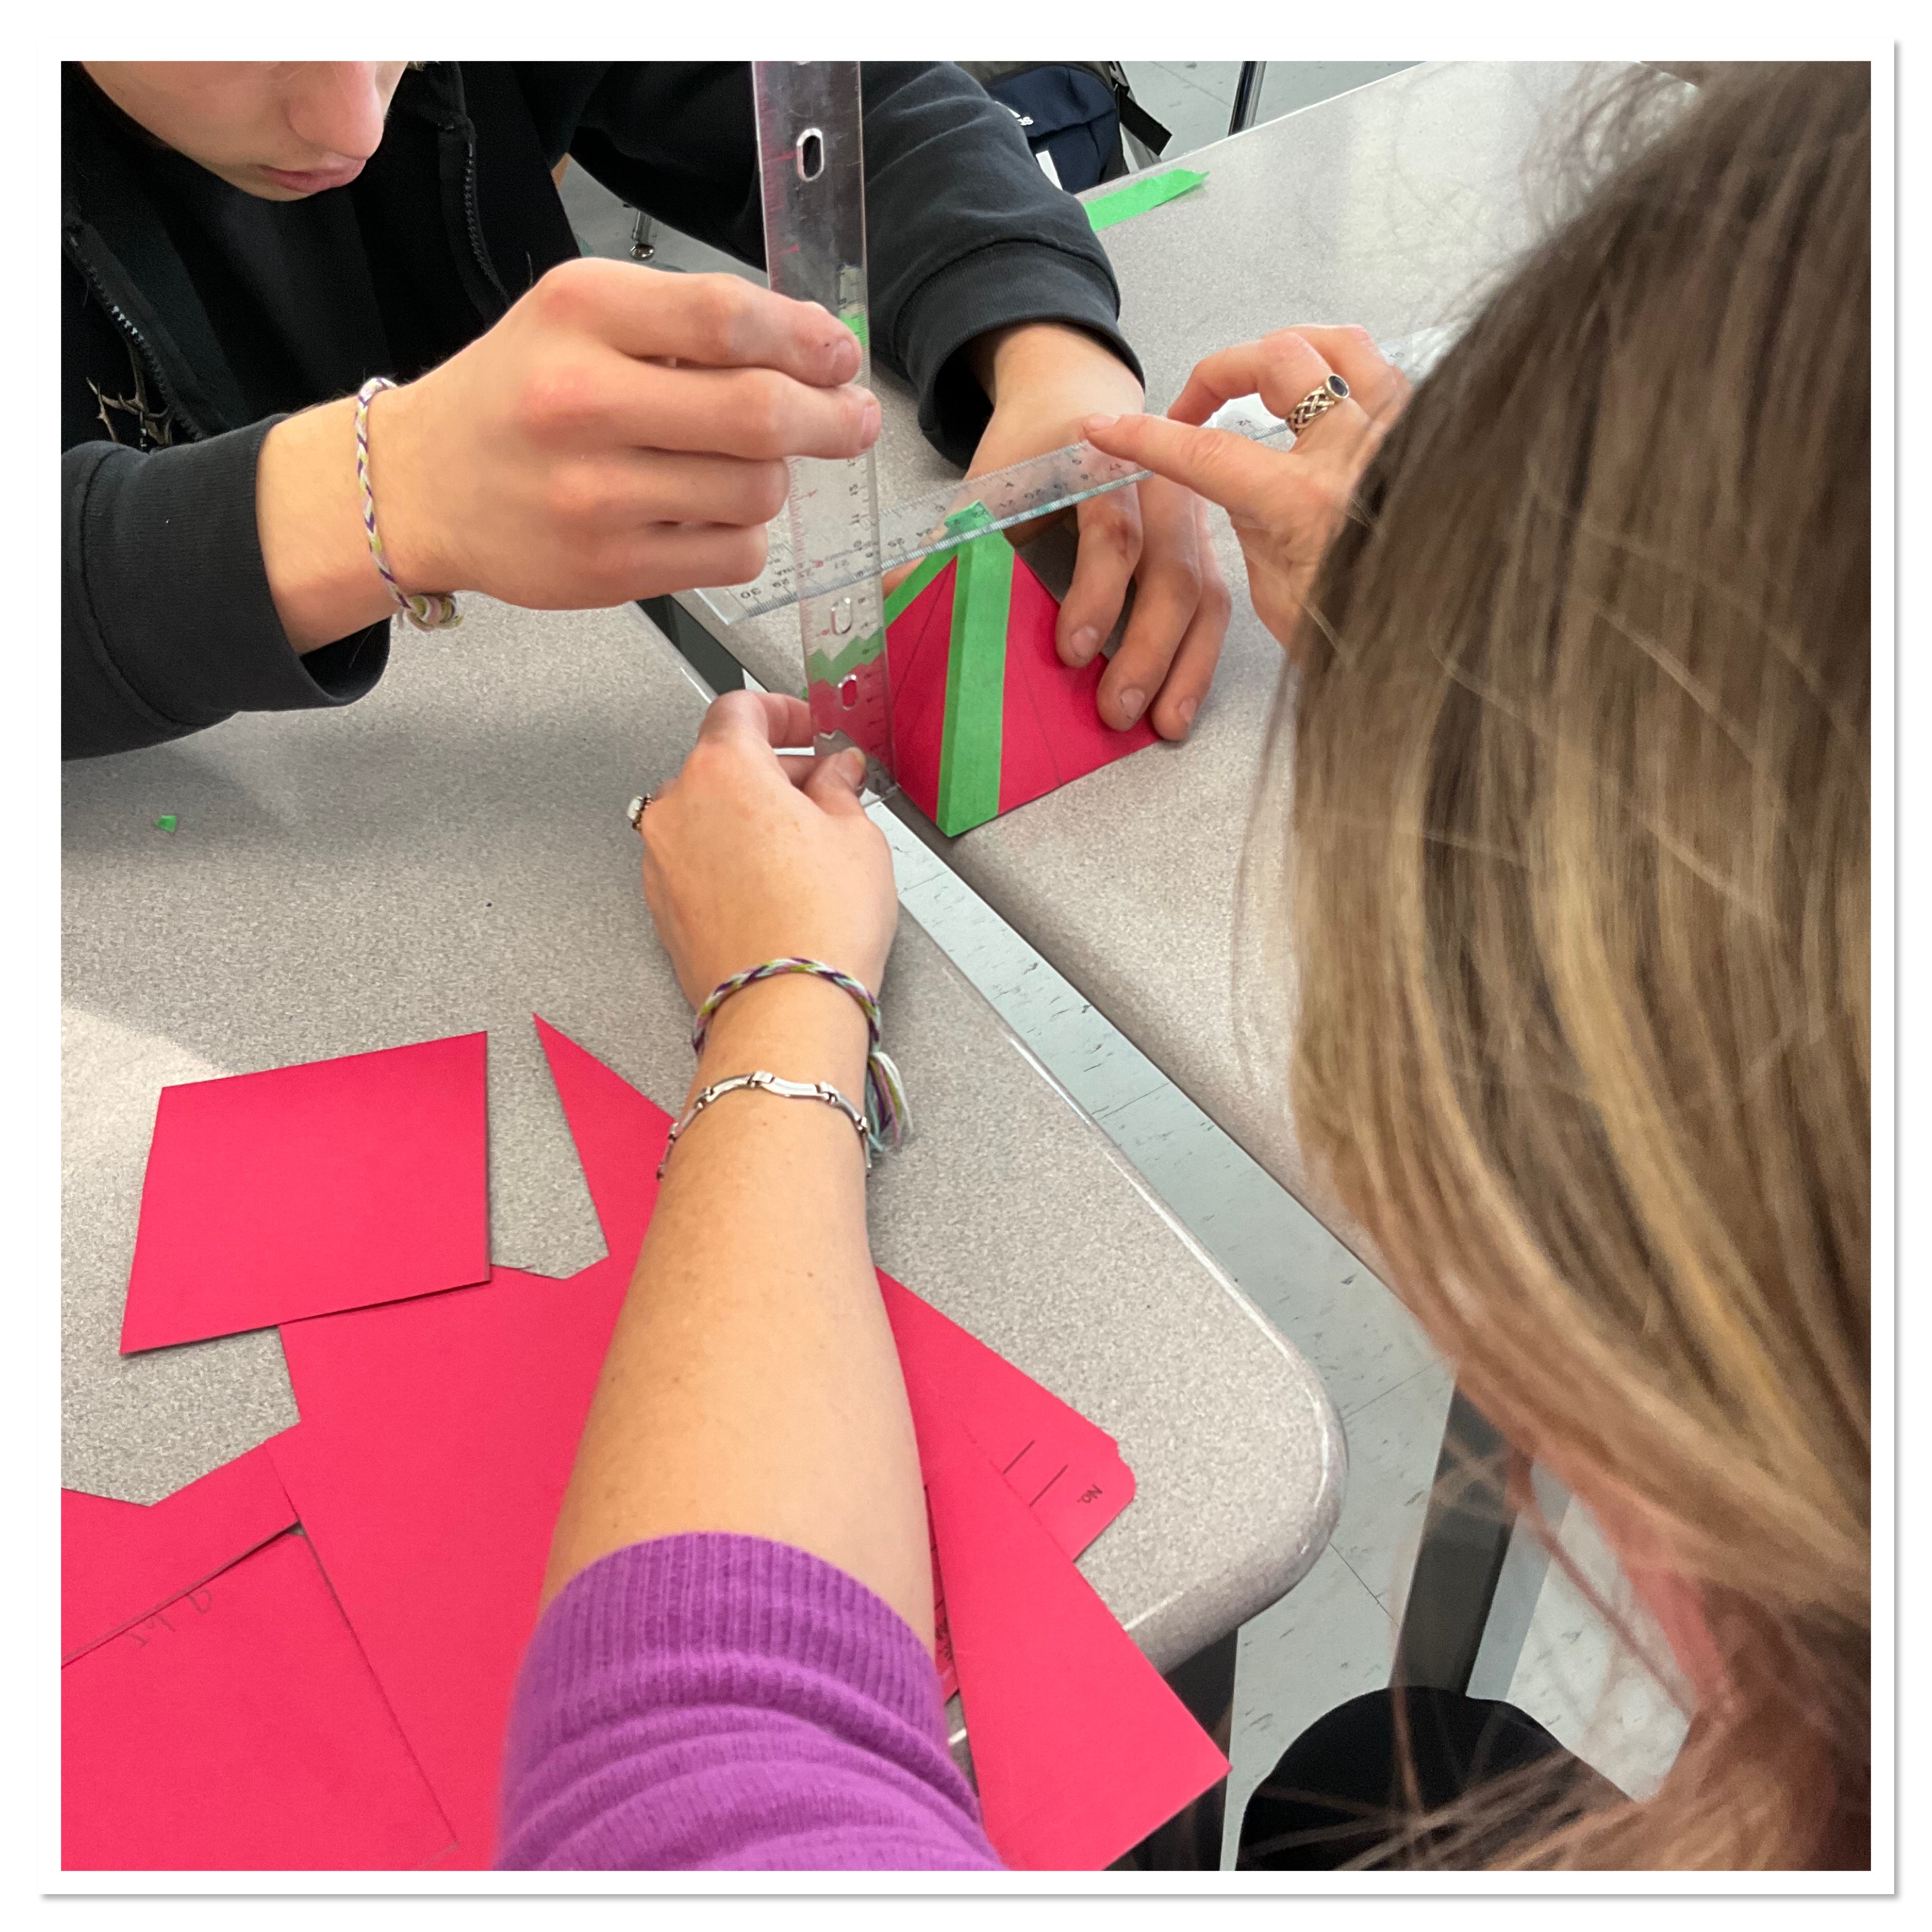
Many groups had not considered that the slant height is different from the pyramid height, and we need to use the pythagorean theorem.
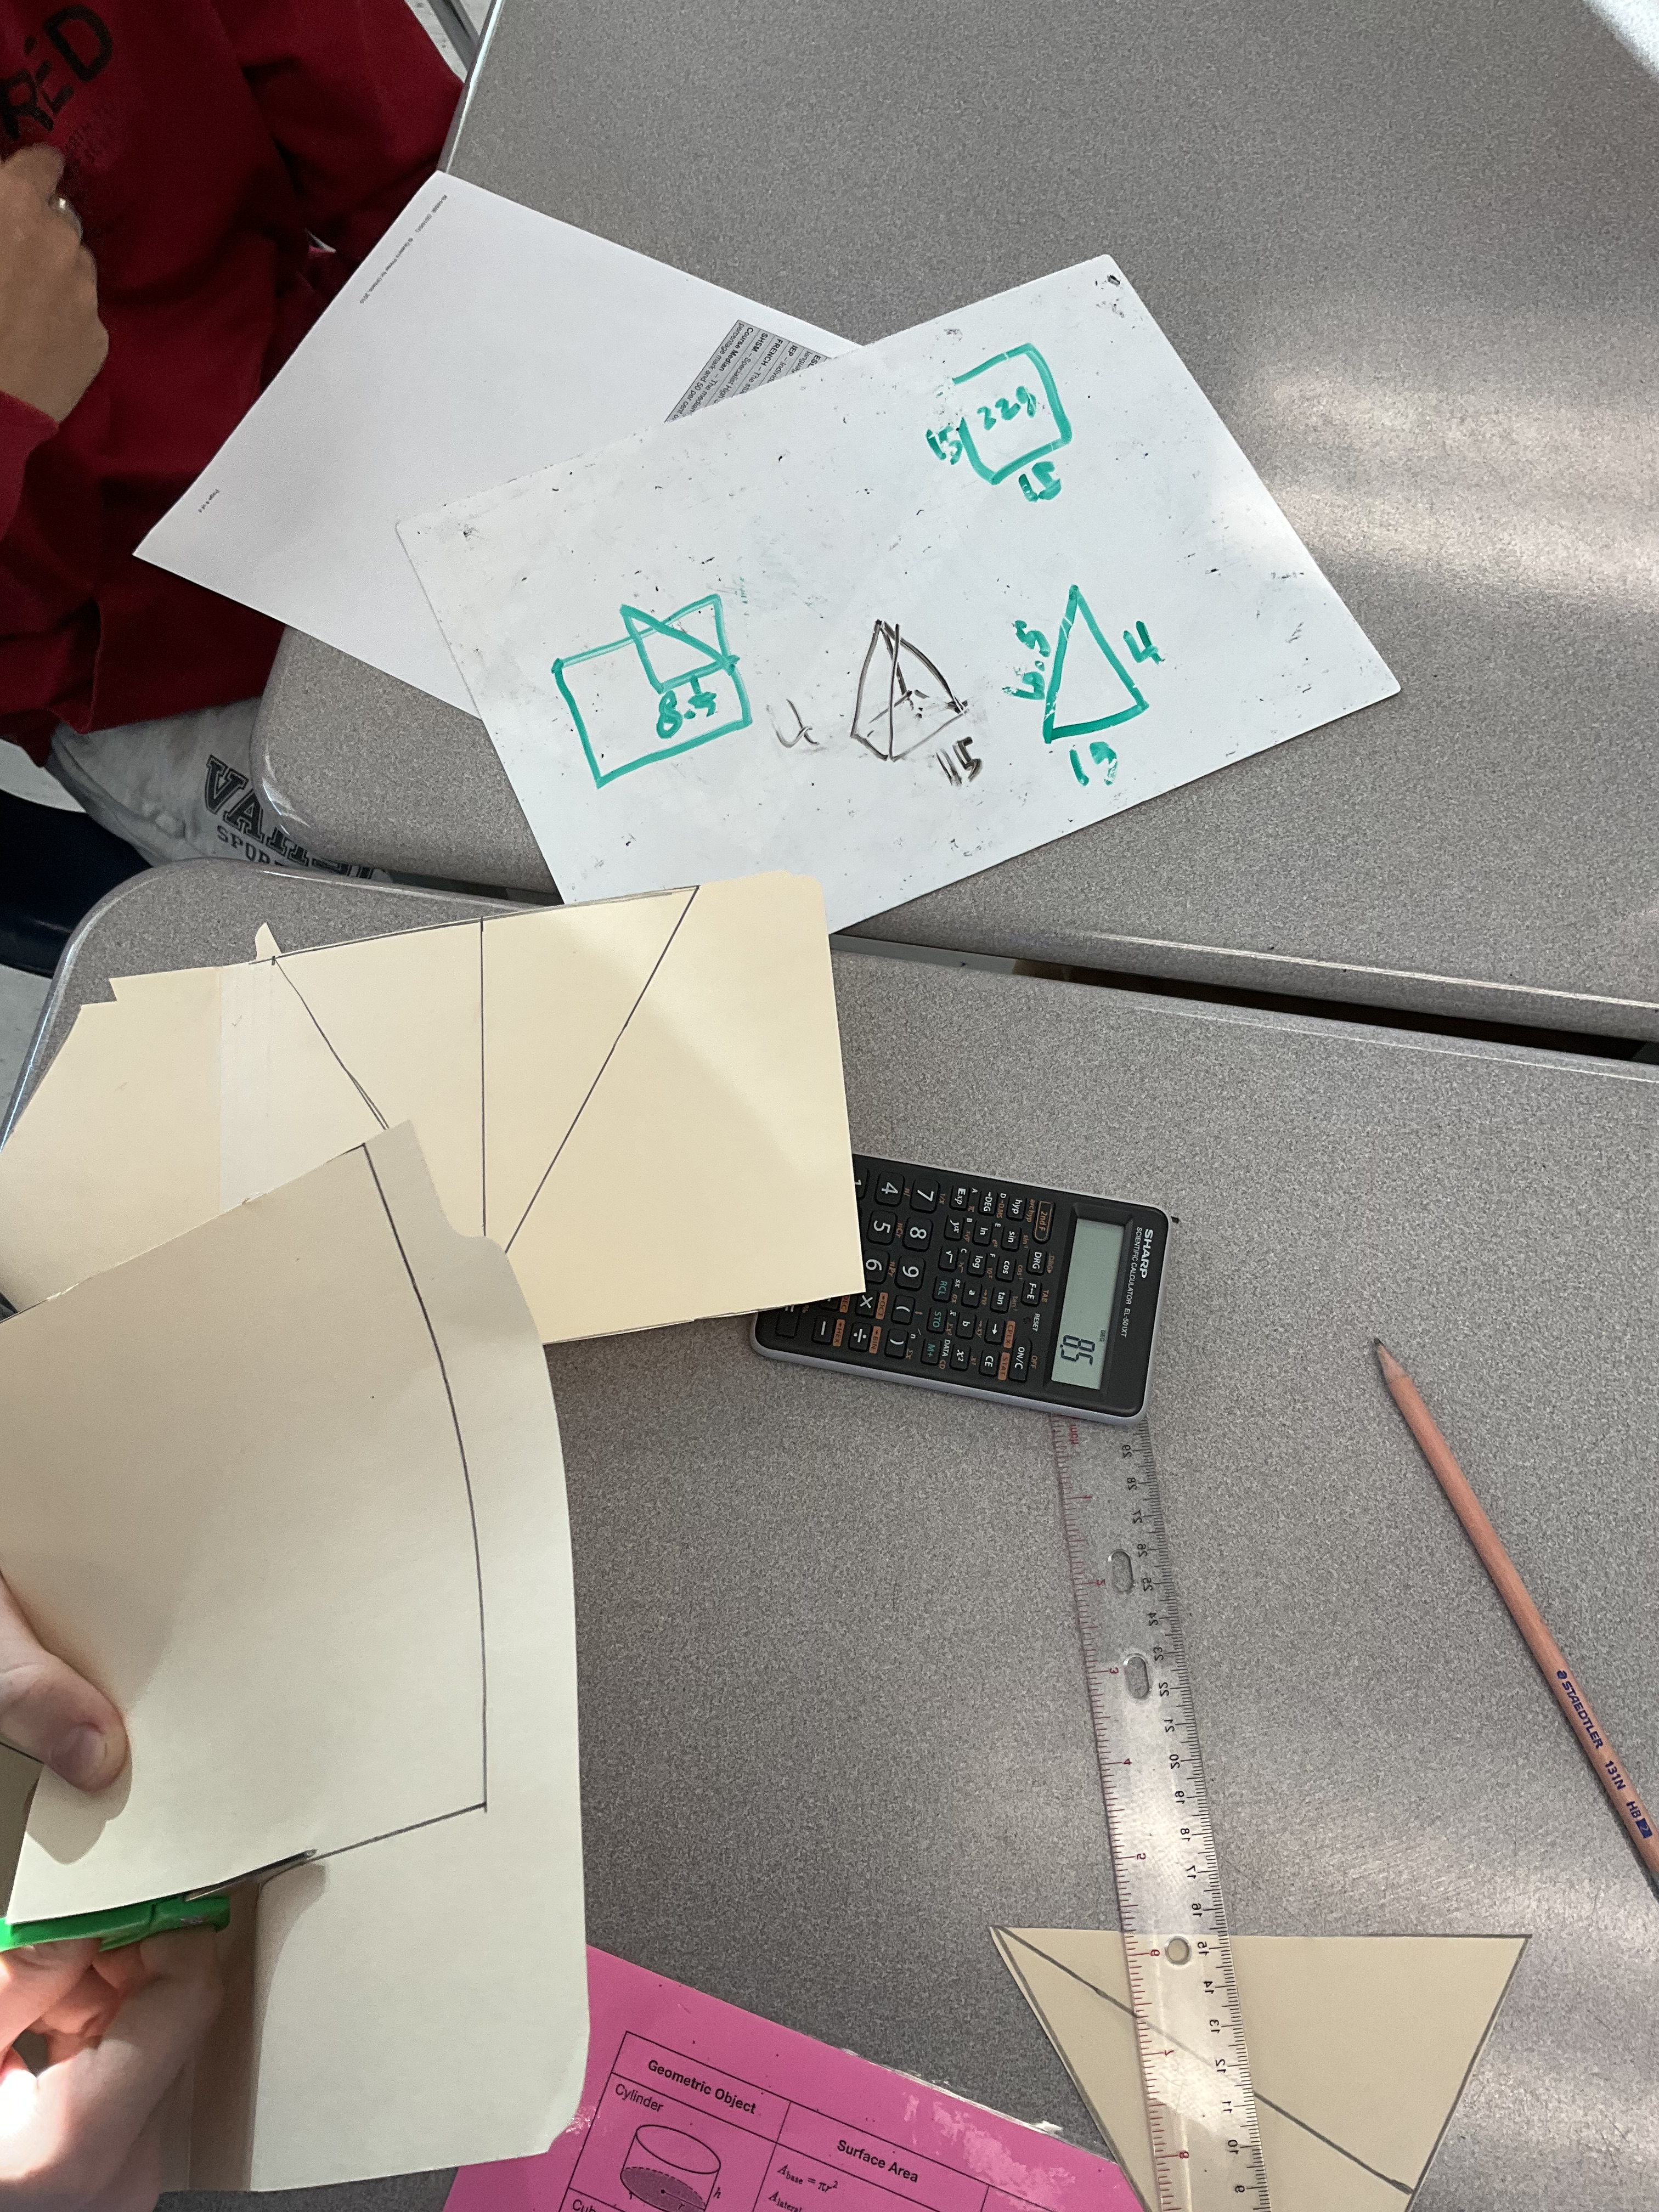
There was a good amount of productive struggle in each group as we needed to readjust our triangles a few times to achieve the correct height for the pyramids.
Surface Area and Volume of Rectangular Prisms
Today in grade 9 we built rectangular prisms with a volume of 300 cubic centimetres. There was a lot of freedom of choice. Students could choose the dimensions that they wanted to, as long as the volume worked out.

They then used cardboard to create their prism.

Some groups had interesting strategies for coming up with their dimensions. One used the box that they had, because it was already a rectangular prism, and they just needed to determine the height, and cut it to size.

It was 19.5cm by 16cm, which already is bigger than 300 when multiplied.
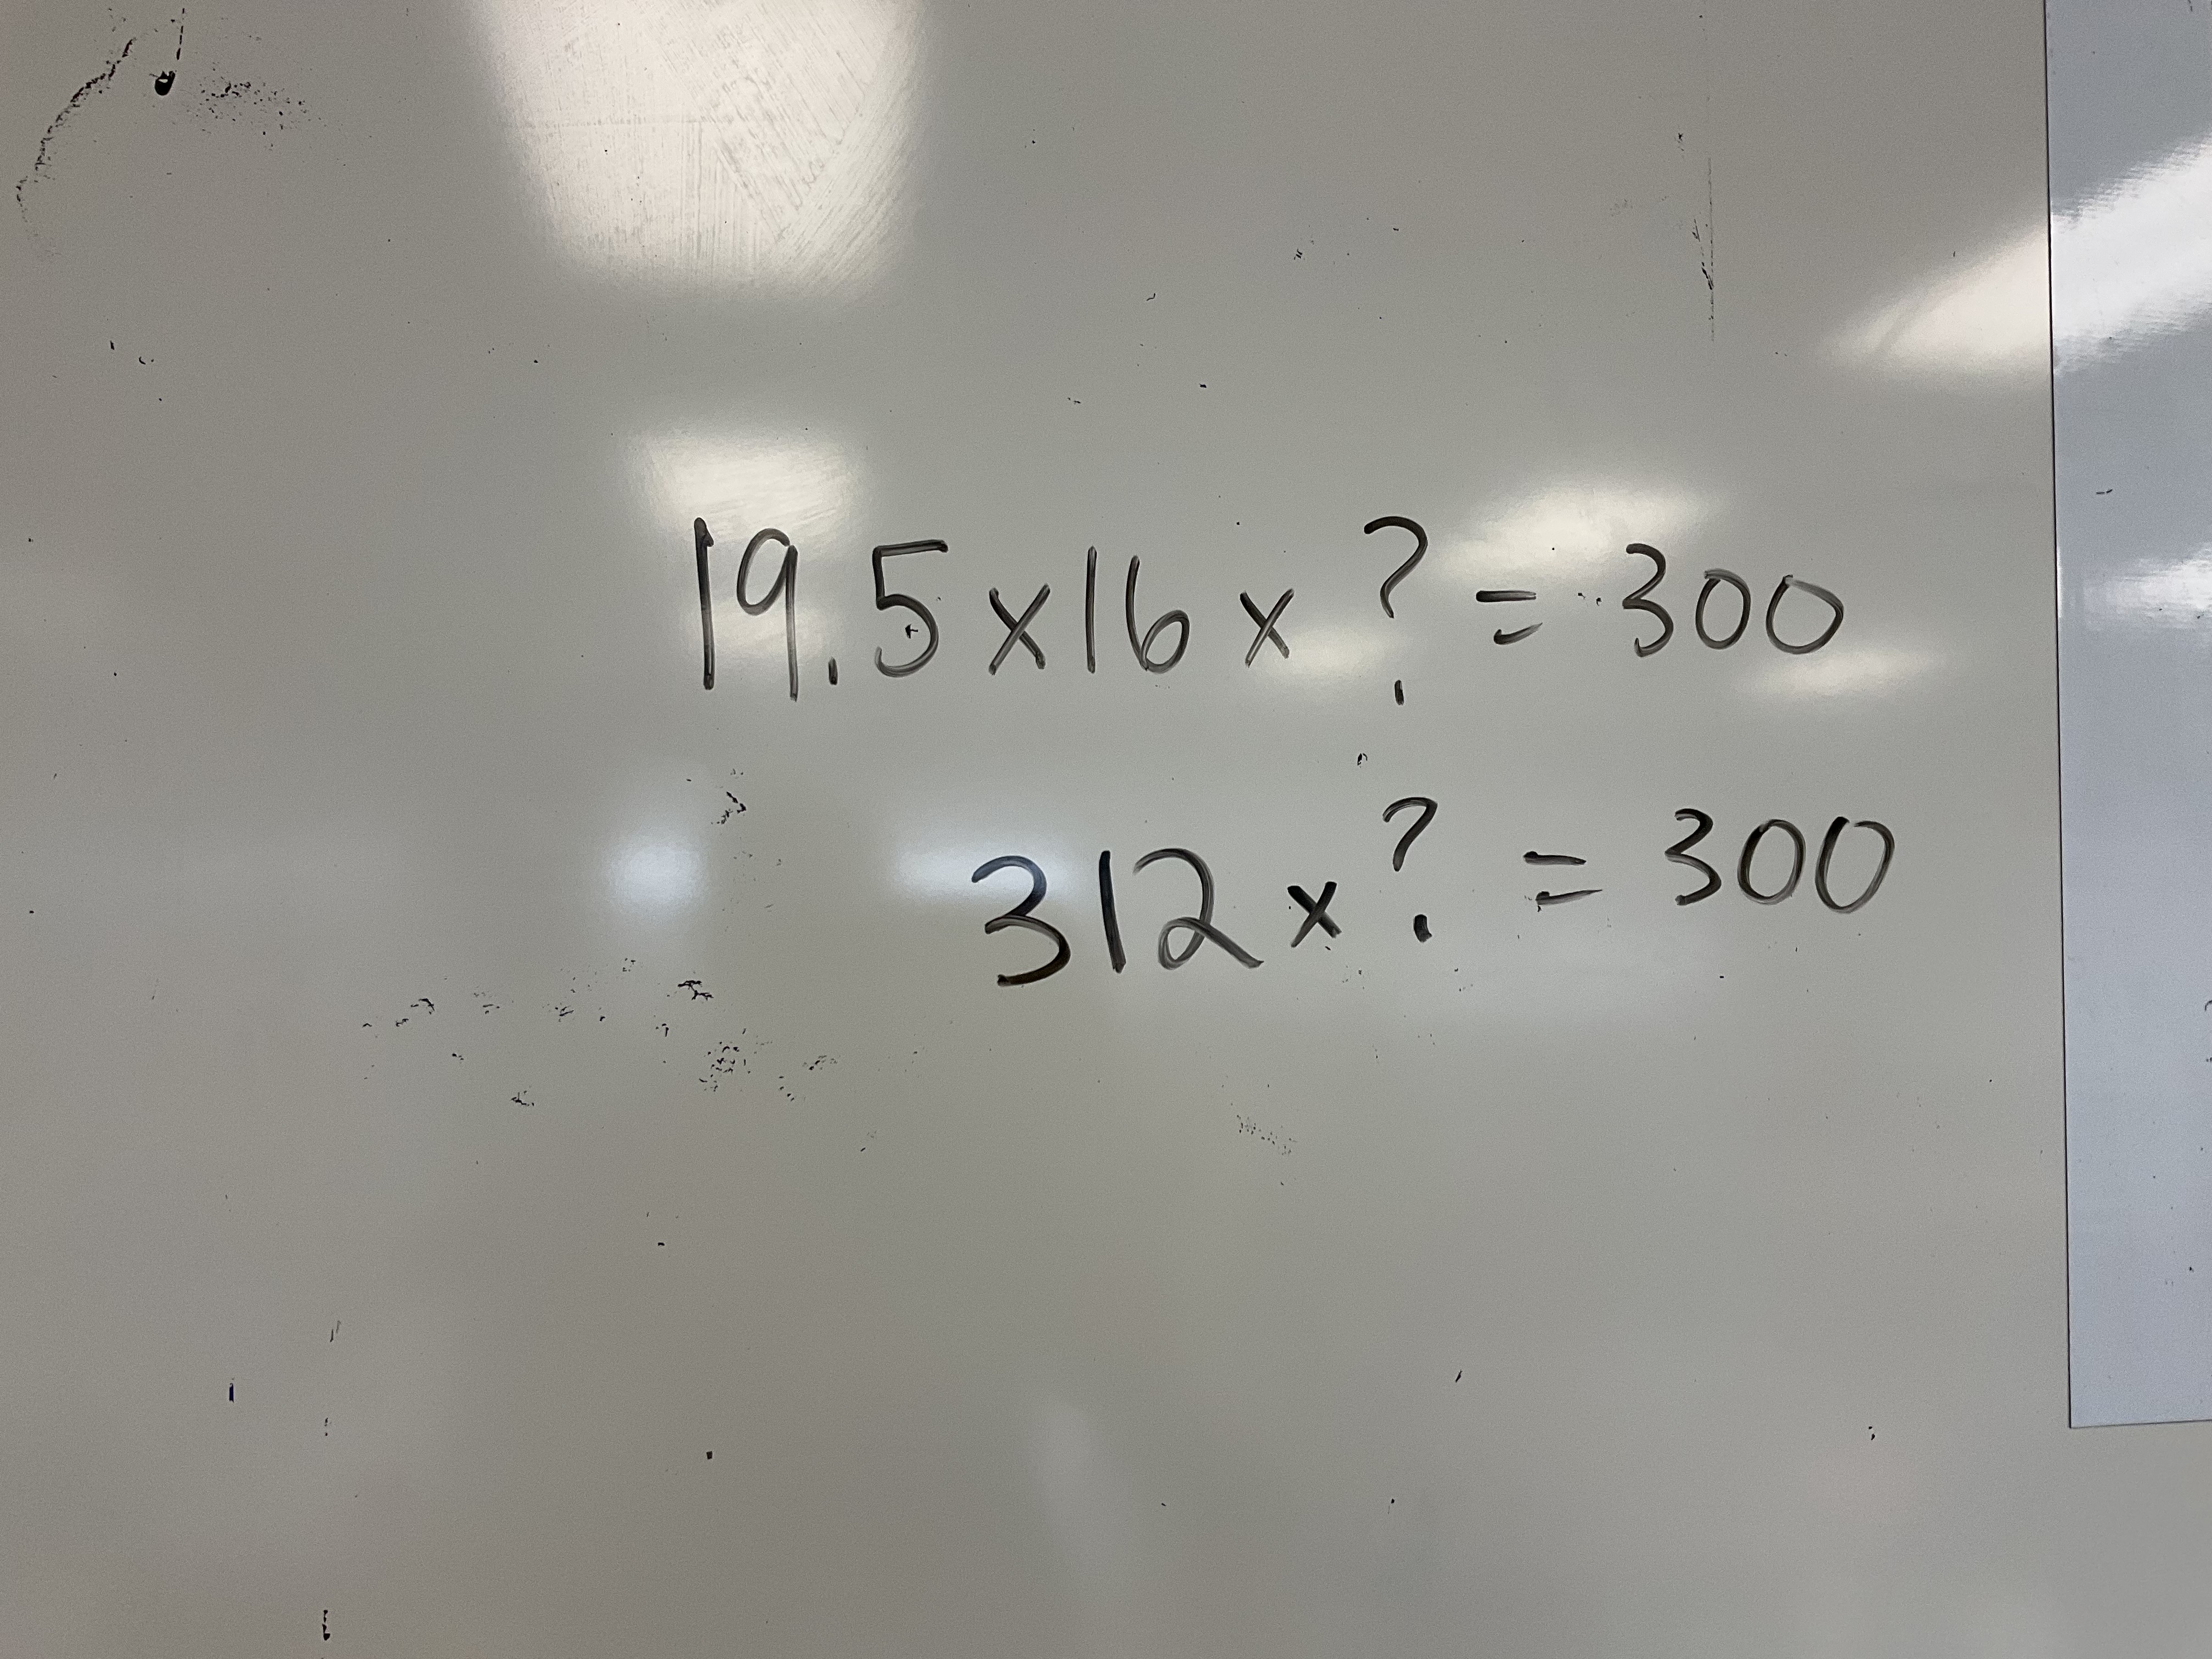
there was some excellent trial and error involved in calculating the height of the prism, and that it needed to be between 0 and 1.
Groups worked on building their prisms, and then calculating the surface area when they were finished. Some groups who were up for a little extra push got the challenge of building a cube, or building a second prism with a larger or smaller surface area.

This was our time to review what prisms are, and how to use the formulas to calculate volume and surface area, and also to introduce the idea that an object with a specific volume can have a different surface area depending on the dimensions.

Students have already done these calculations in elementary school, but they may not have seen that there is such a variety of possible prisms for the same volume, nor how different the surface area can be.
We took all the finished prisms and put them in order by surface area.

Cubes have the smallest surface area, and the more worm-like, or plate-like prisms had the largest surface areas.
We connected the idea of surface area and volume to packaging problems, where you could spend less money on packaging if you use a cube as a box. We also talked about how cells divide when they get too large, to maintain the optimal surface area to volume ratio, how worms can breathe through their skin because they have a big surface area compared to their volume, and how we have a large surface area in our lungs for gas exchange.
We also talked about how you can find the dimensions of the cube with volume 300 cubic centimetres, by using the cube root on a calculator.
We will build on our prism knowledge and next week tackle the fun challenge of building a square based pyramid with the same volume.
Popcorn Pandemonium 3 act Task
In MFM2P today we were looking at solving a system of equations. Rather than starting with words today we used the popcorn pandemonium videos.
We noticed and wondered lots of things as we watched the video. Many groups noticed the timer, and how they each ate popcorn differently.
When watching act 2 it took a bit of time, but we eventually could piece together that they were eating in a pattern.
Groups had some productive struggle as they created tables of values, and then put the information onto a graph.
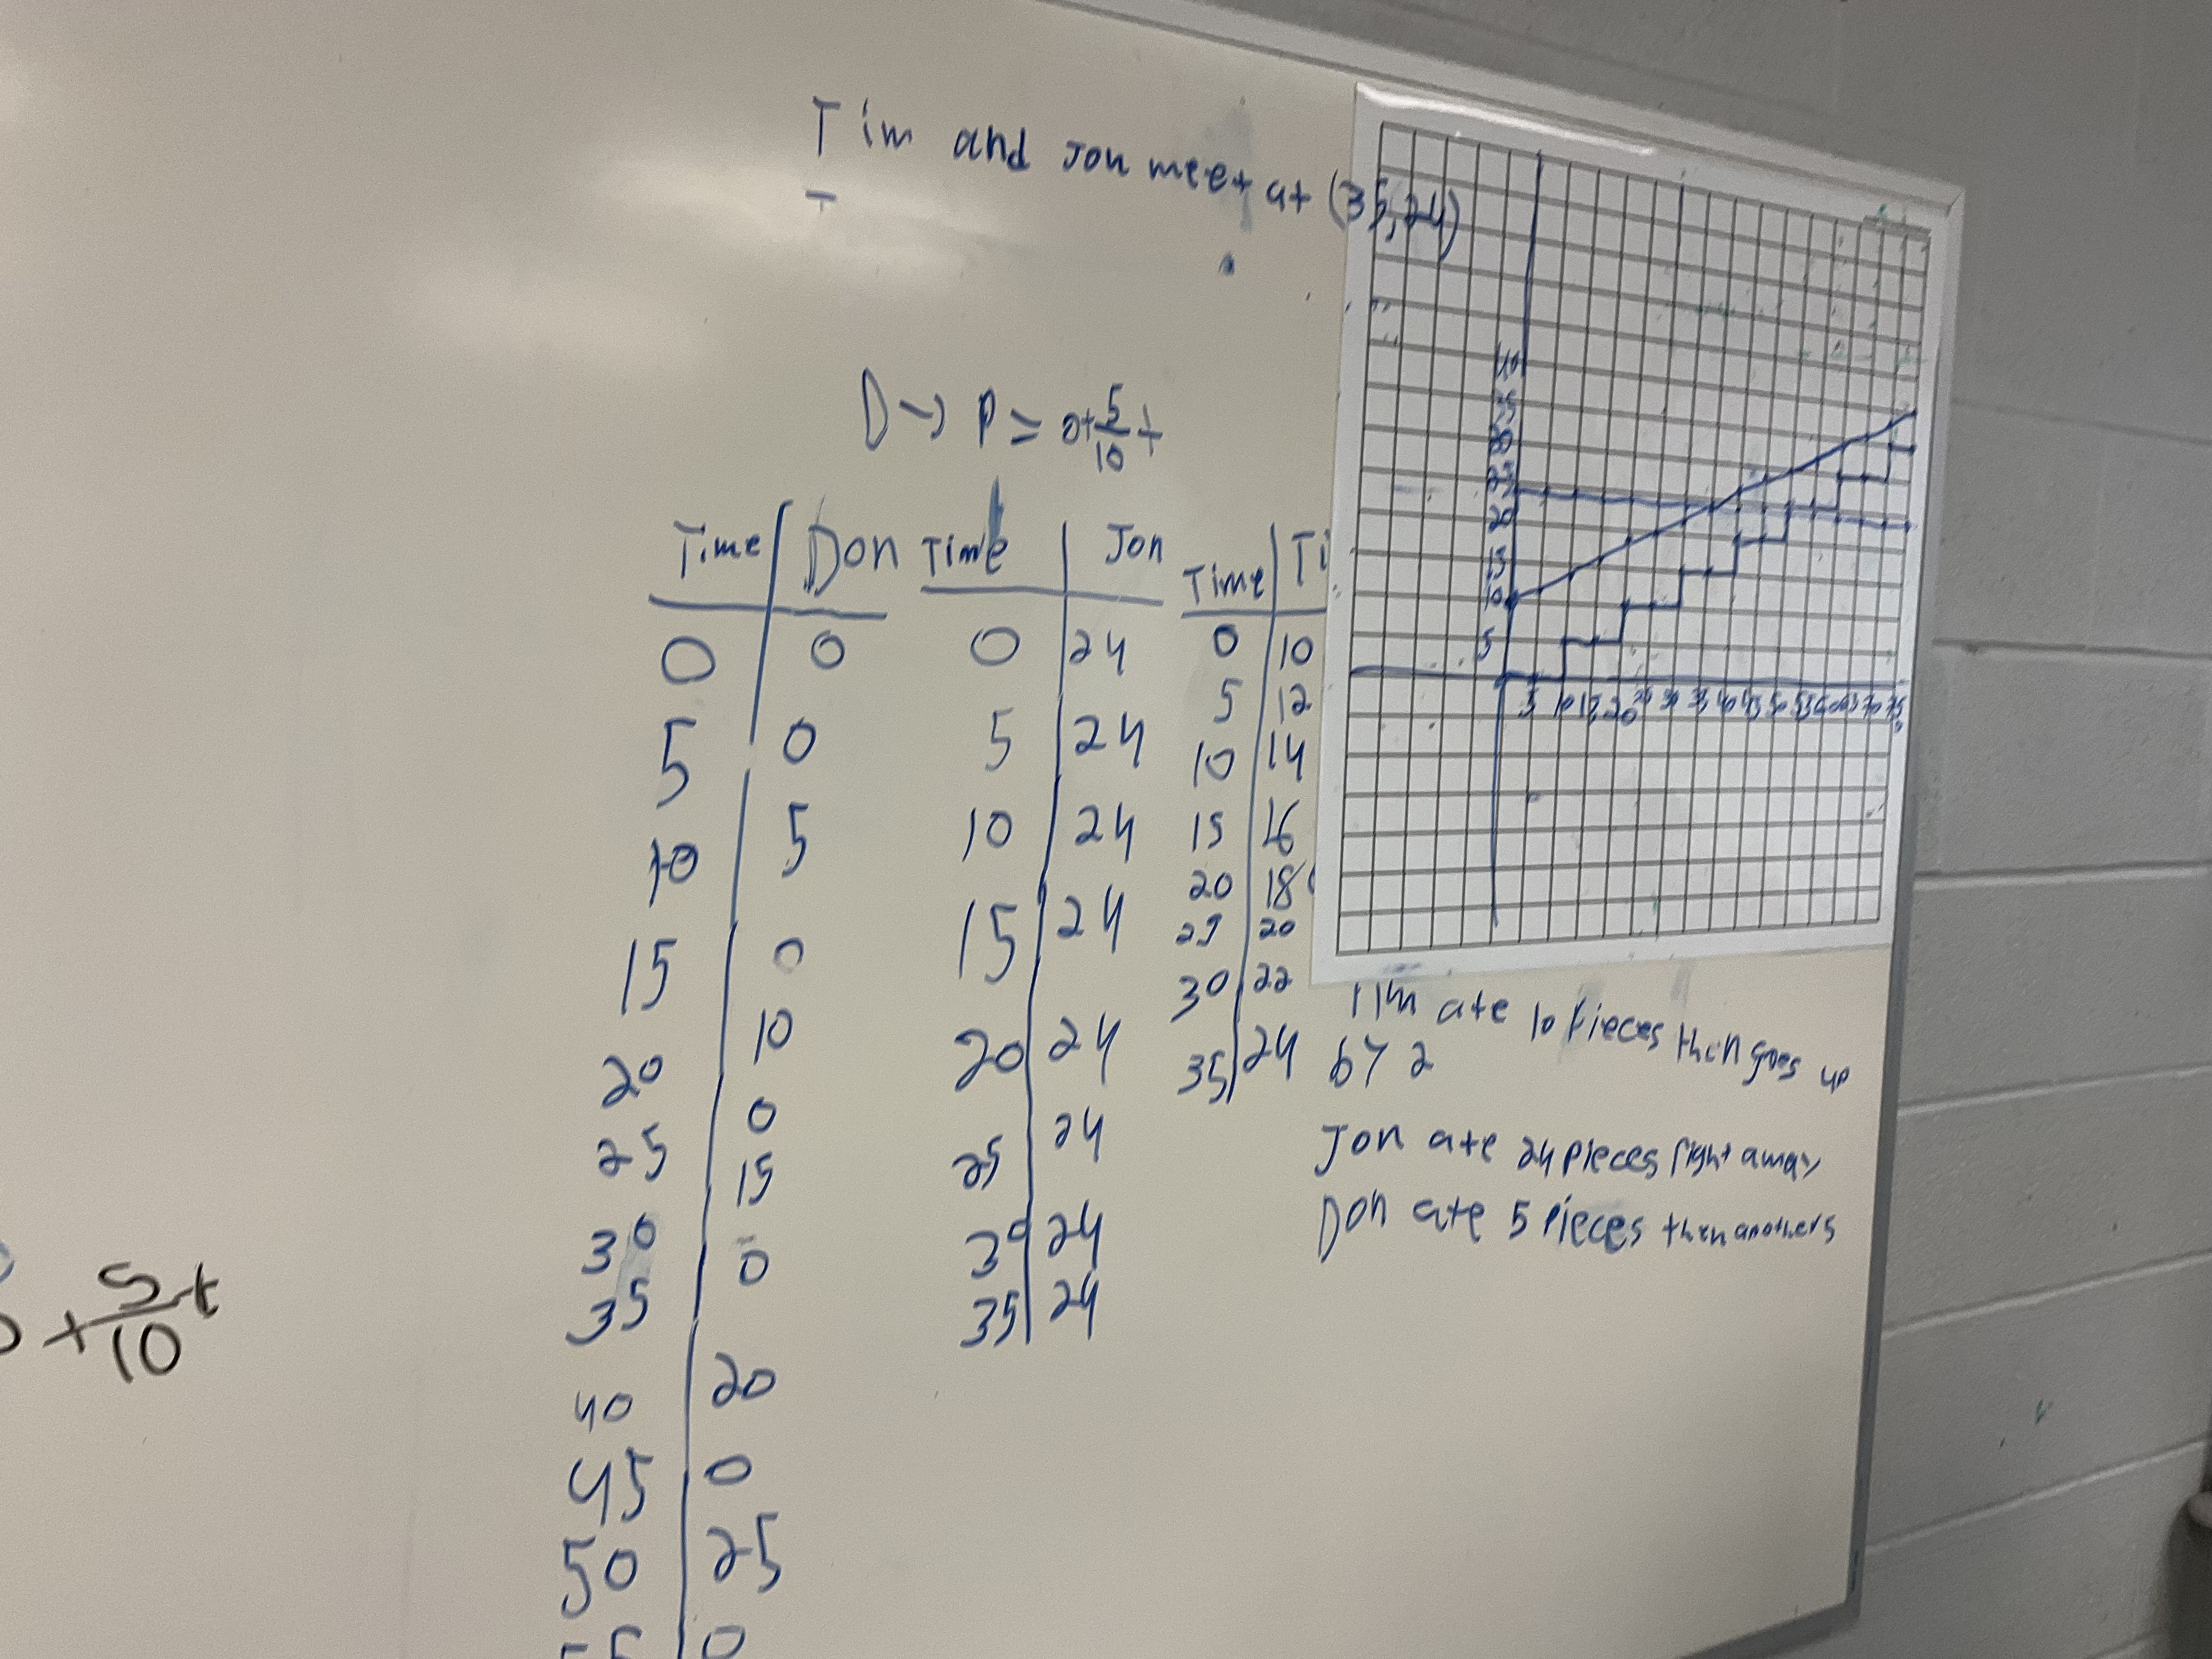
We consolidated and noticed how we could have made equations to show the same information, and used them to calculate intersection points that may occur off the graph.
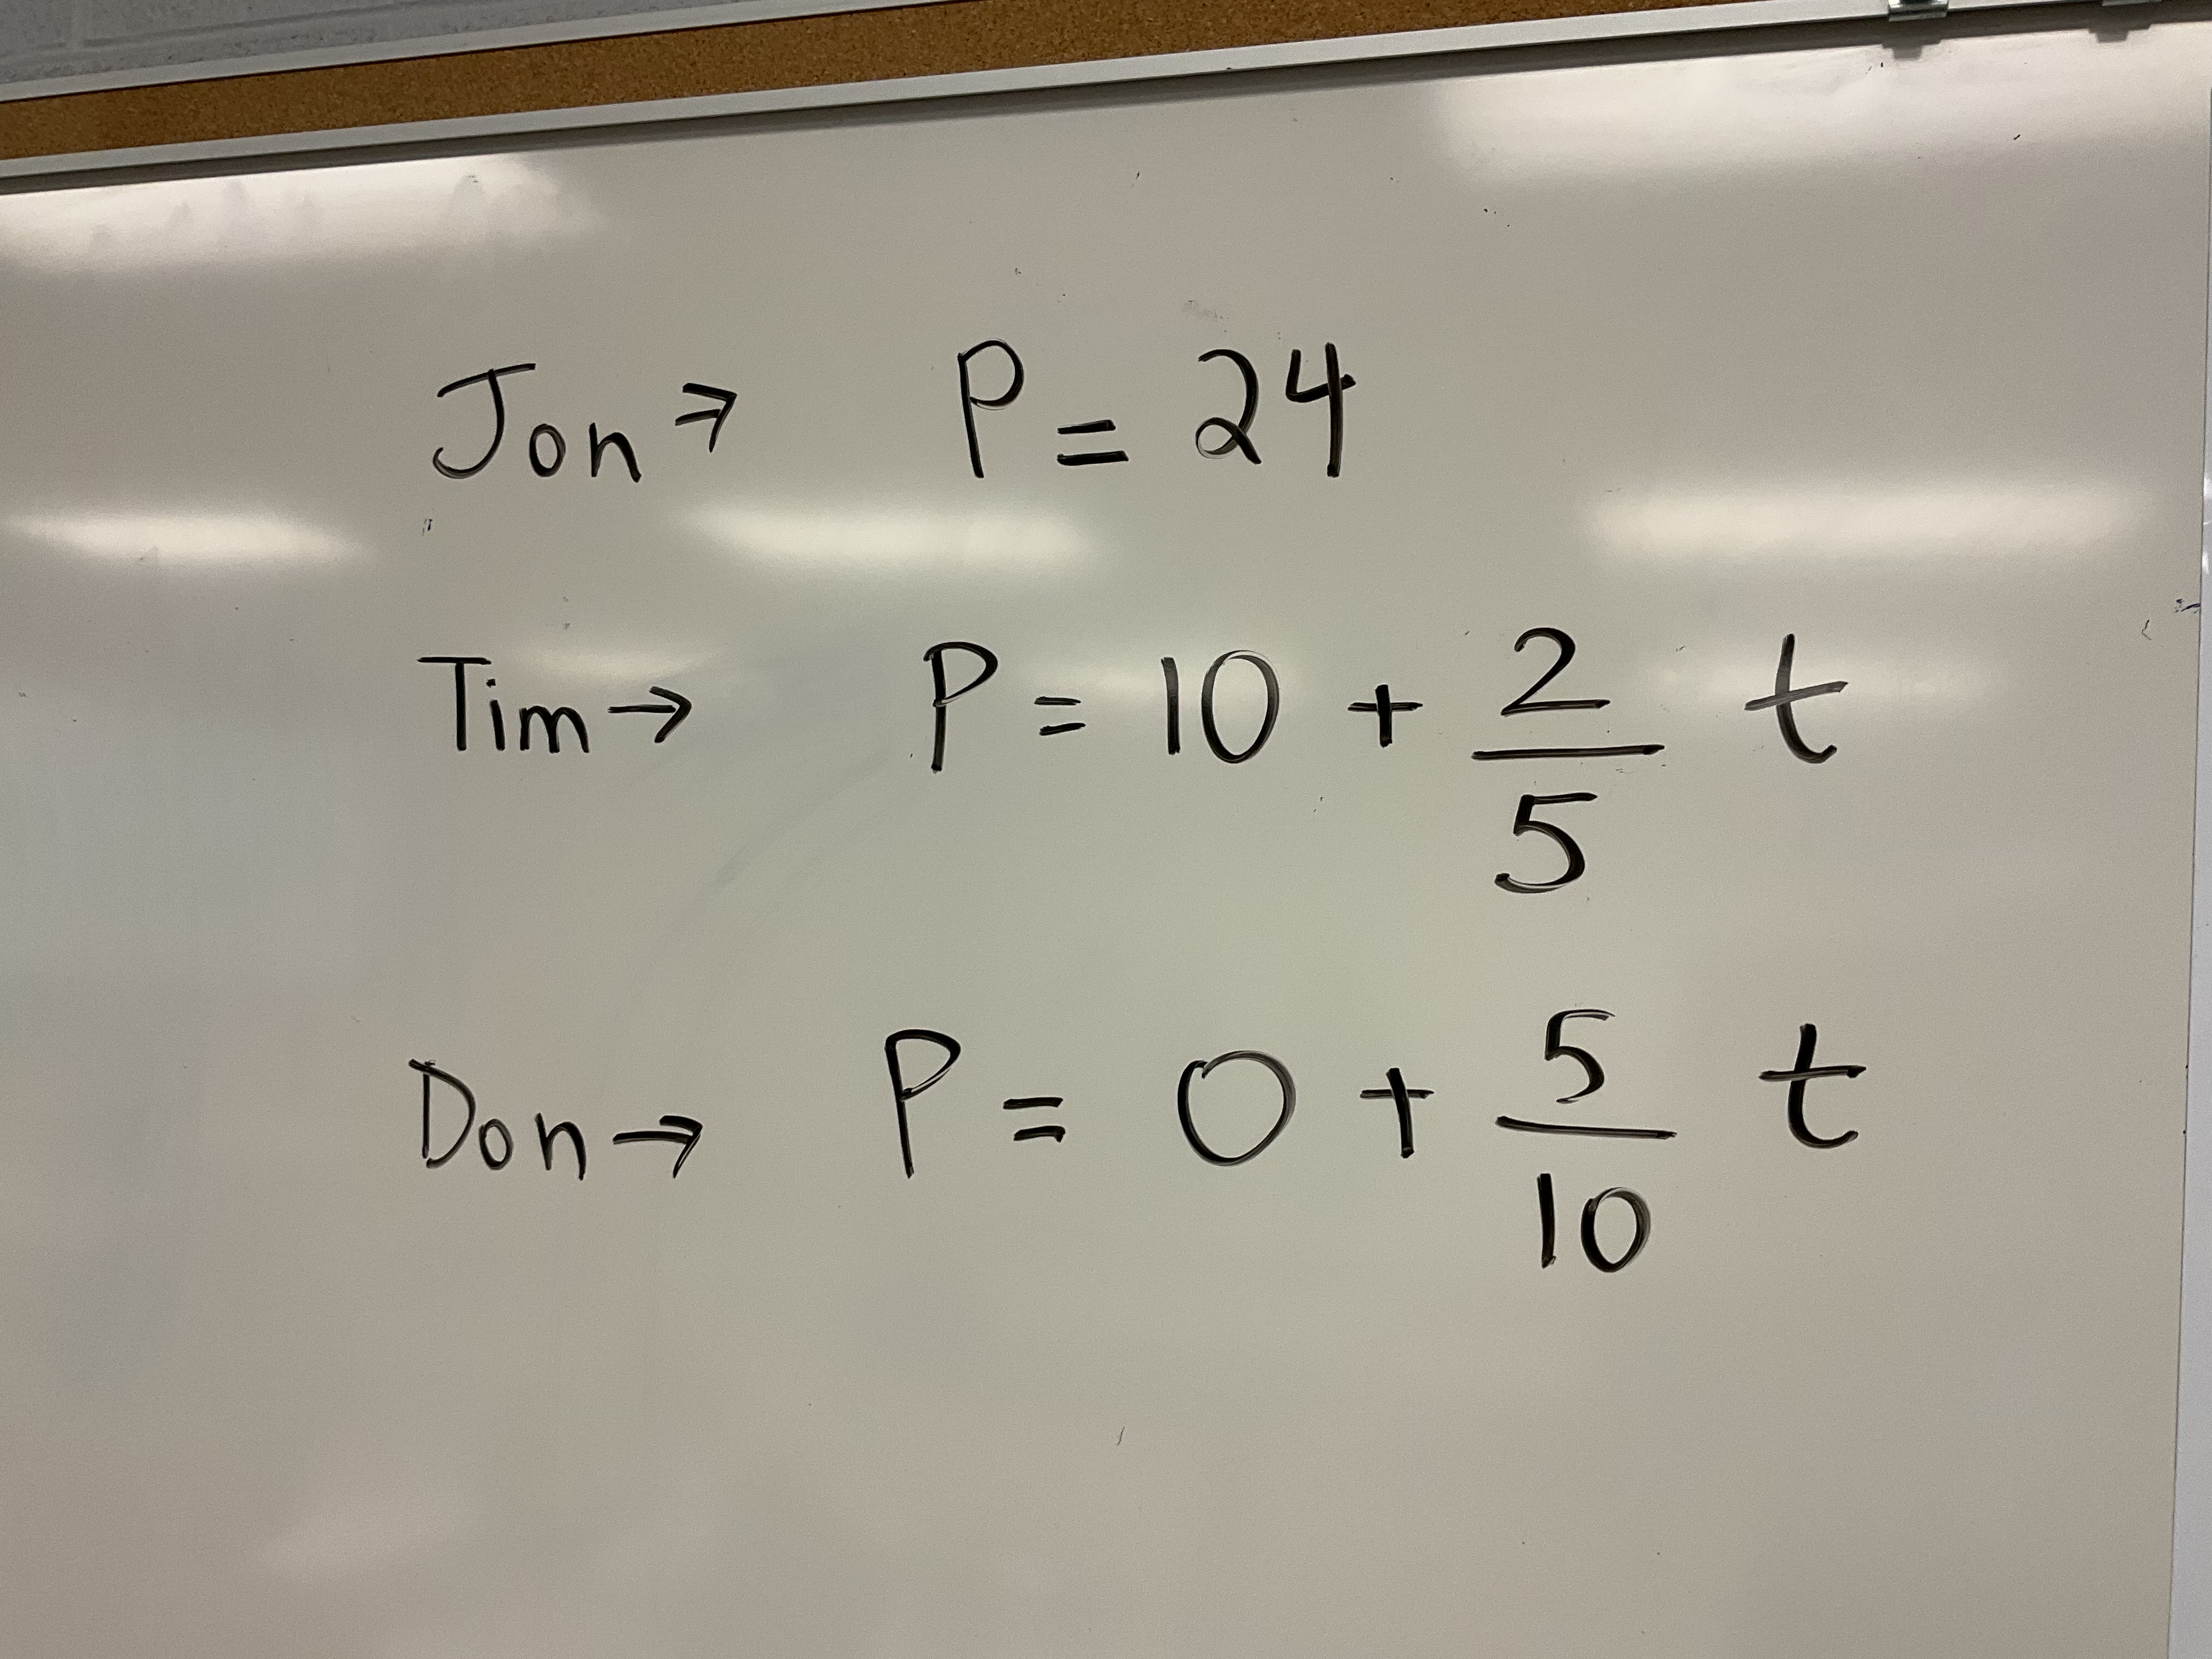
Here’s act 3 which we watched to see if we had correctly determined the popcorn they would have eaten when the timer elapsed.
Students were very engaged in graphing to solve this problem. I wonder if there’s a problem where they would gravitate to solving with equations instead.
Desmos Geometry
Today in grade 10 we worked on understanding properties of quadrilaterals and triangles. We were looking at the lengths of sides, and the slopes of sides, and also the lengths, slopes and midpoints of diagonals.
One way of exploring the ideas was to use graph paper and draw shapes and measure and explore lengths and slopes. Another more dynamic way is to use desmos geometry
Here’s a photo of what we did to explore a rhombus (losange en français)
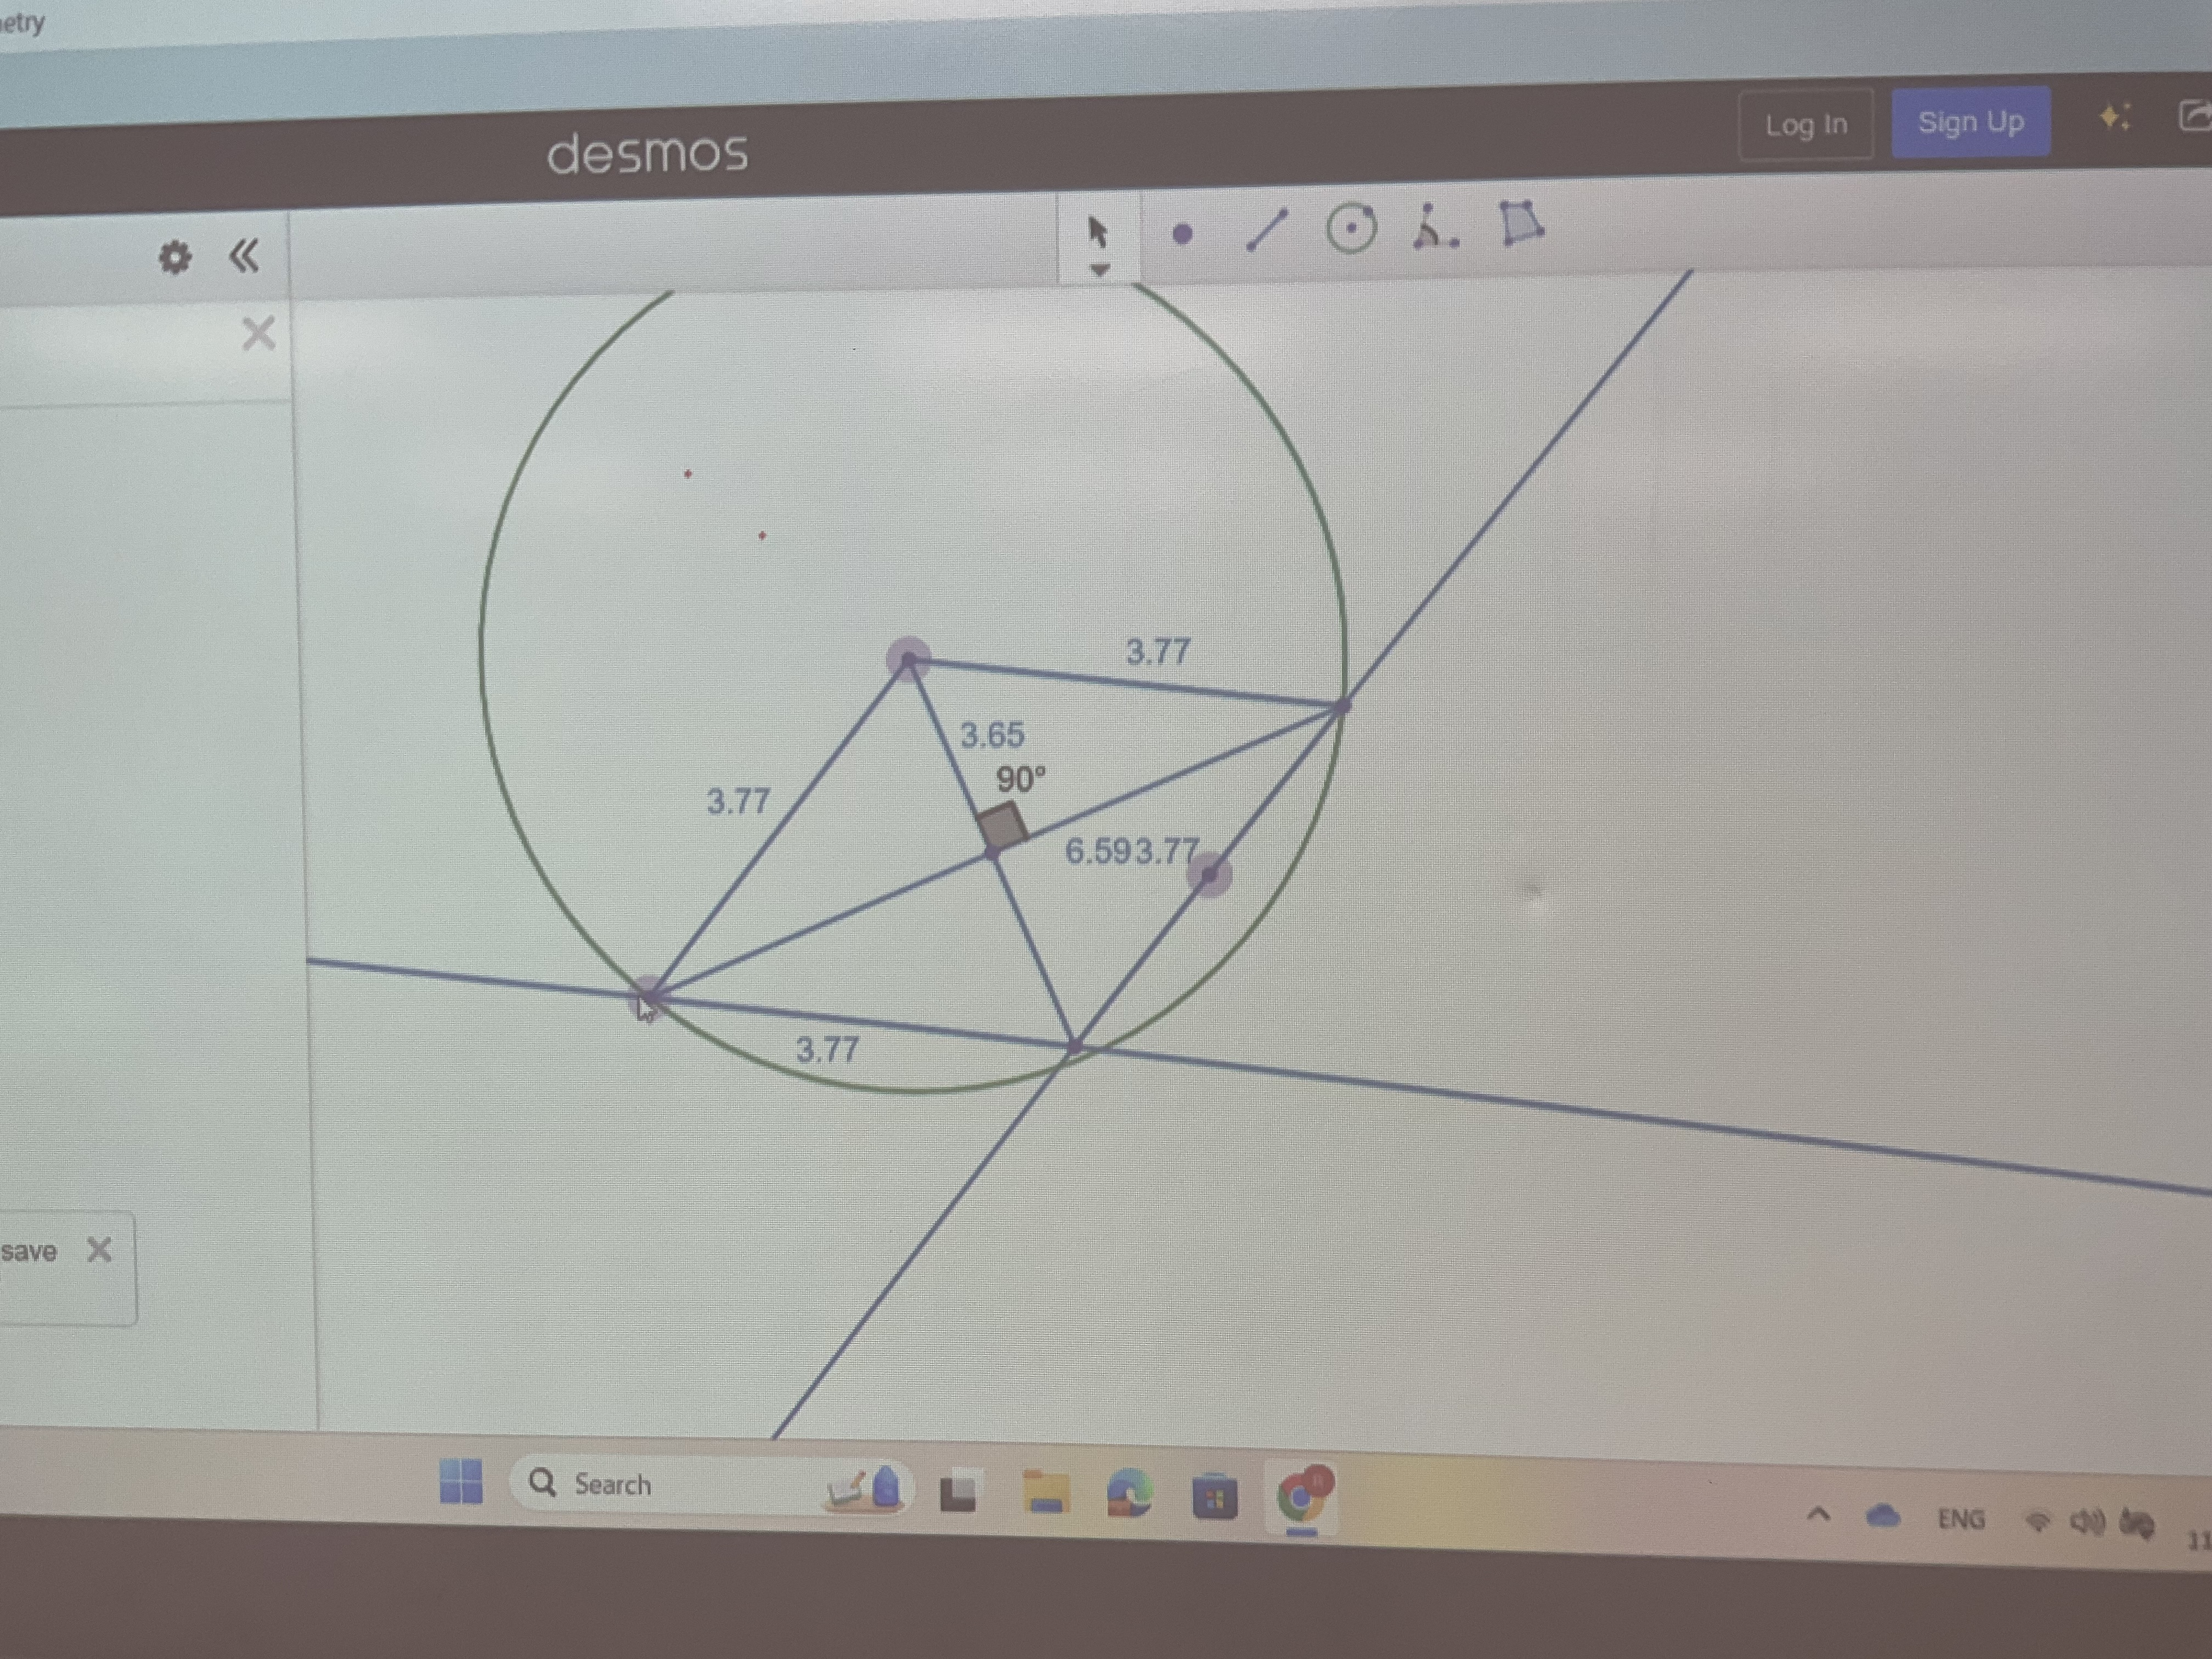
Here’s a link to a dynamic copy. Click and drag points and see how the lengths of the diagonals change, how the side lengths are all the same, and how the diagonals are always perpendicular.
Patterns to Algebra
In MTH1W today we were working on connecting representations: visual patterns, graphs, tables and equations.

We’ve been using linear patterns from visualpatterns.org and exploring how to graph them and where we can see the slope and the constant in each of the representations.
We also took some time to watch two very useful and very awesome videos:
slope dude and this music video.
We’re working on connecting all representations and forms, but will be heading towards graphing linear equations next.
Patterns to Algebra
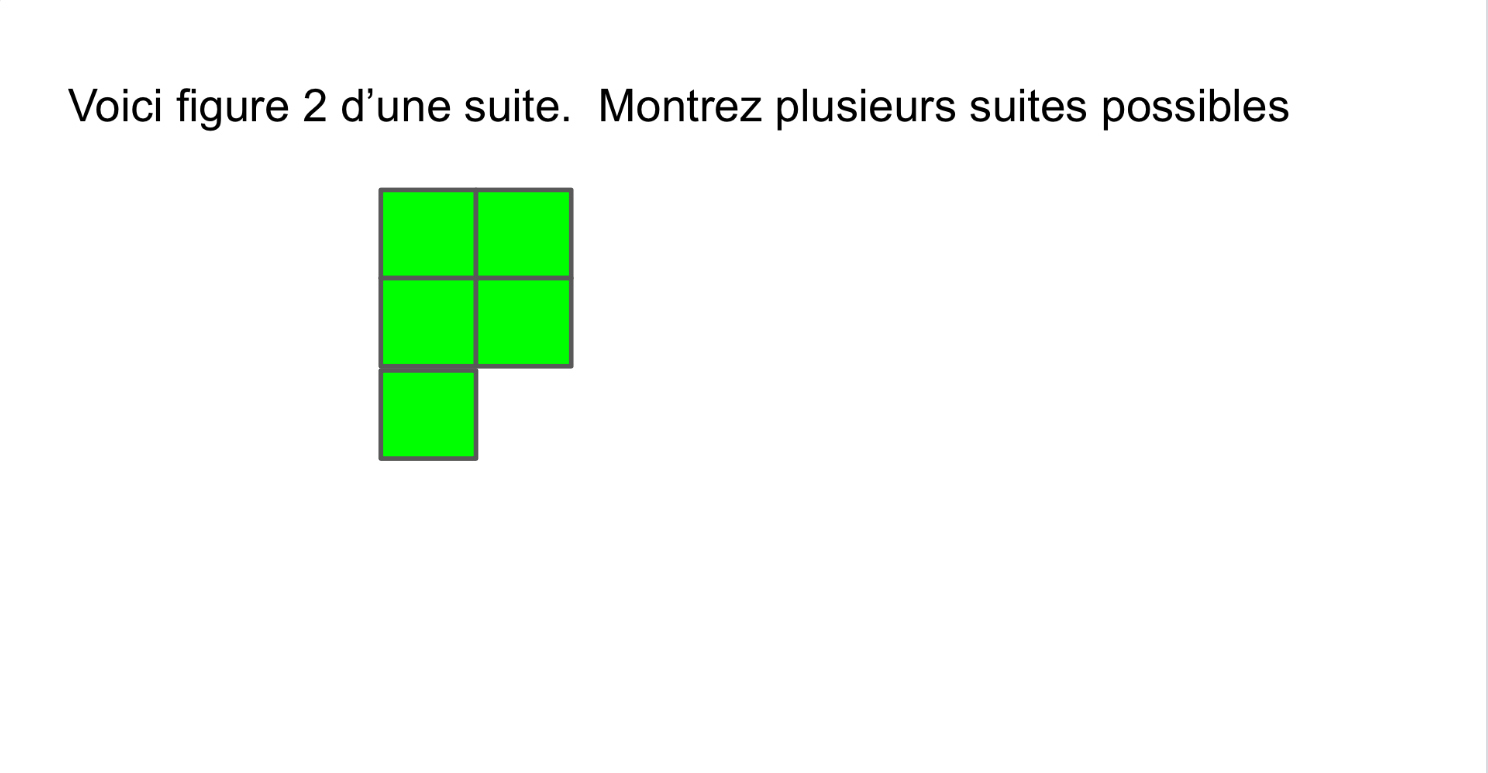
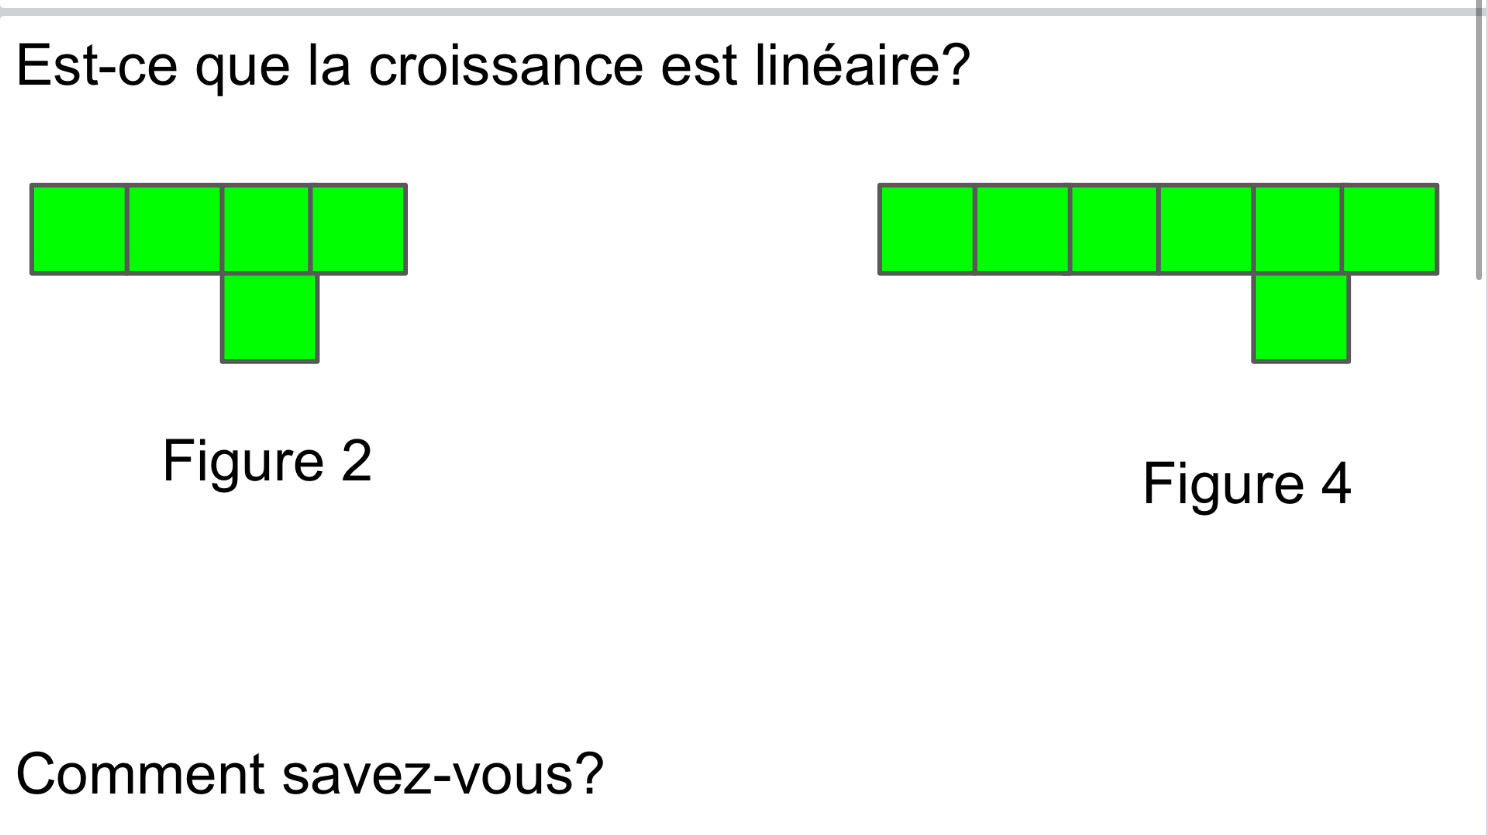
Yesterday in grade 9 we started looking at patterning. We created several growing patterns that have this as figure 2.
We worked on figuring out the pattern rule. We know that if we increase by the same number of blocks between figures each time, it is a linear relationship. The slope, or rate, for the line is equal to the common first difference. The constant is the value of figure 0. Some equations are not linear, and we notice that those ones grow by more and more and more each time. Those equations can have exponents in them.

Sometimes the pattern looks different, but the rule is the same.
We had a challenge to determine if this pattern is linear or not.
Students built what figure 3 would be, and extended the pattern back to figure 0. We noticed that the pattern grows by 1 each time. Figure 0 is the constant, which is 3. The pattern rule is y=x+3

This pattern is not linear. We know that because when we build figure 2 it will look like a square that is 3×3 and then 2 blocks at the top left. The pattern rule can be written as y=(x+1)^2+x. We know that we are adding different amounts to get from figure 1 to figure 2, than when we go from figure 2 to figure 3.
Our next step today was to start with the equation for a pattern rule, and then build figures 0,1,2,3,4 out of tiles.

Each group had different equations to build.

Groups then worked to dismantle each figure one at a time, and line the blocks up to fit on the 1 inch grid chart paper. We made each figure into a column, and then placed a dot at the top left corner. Figure 1 is then dismantled and all the blocks placed in a column and a dot drawn at the top left.

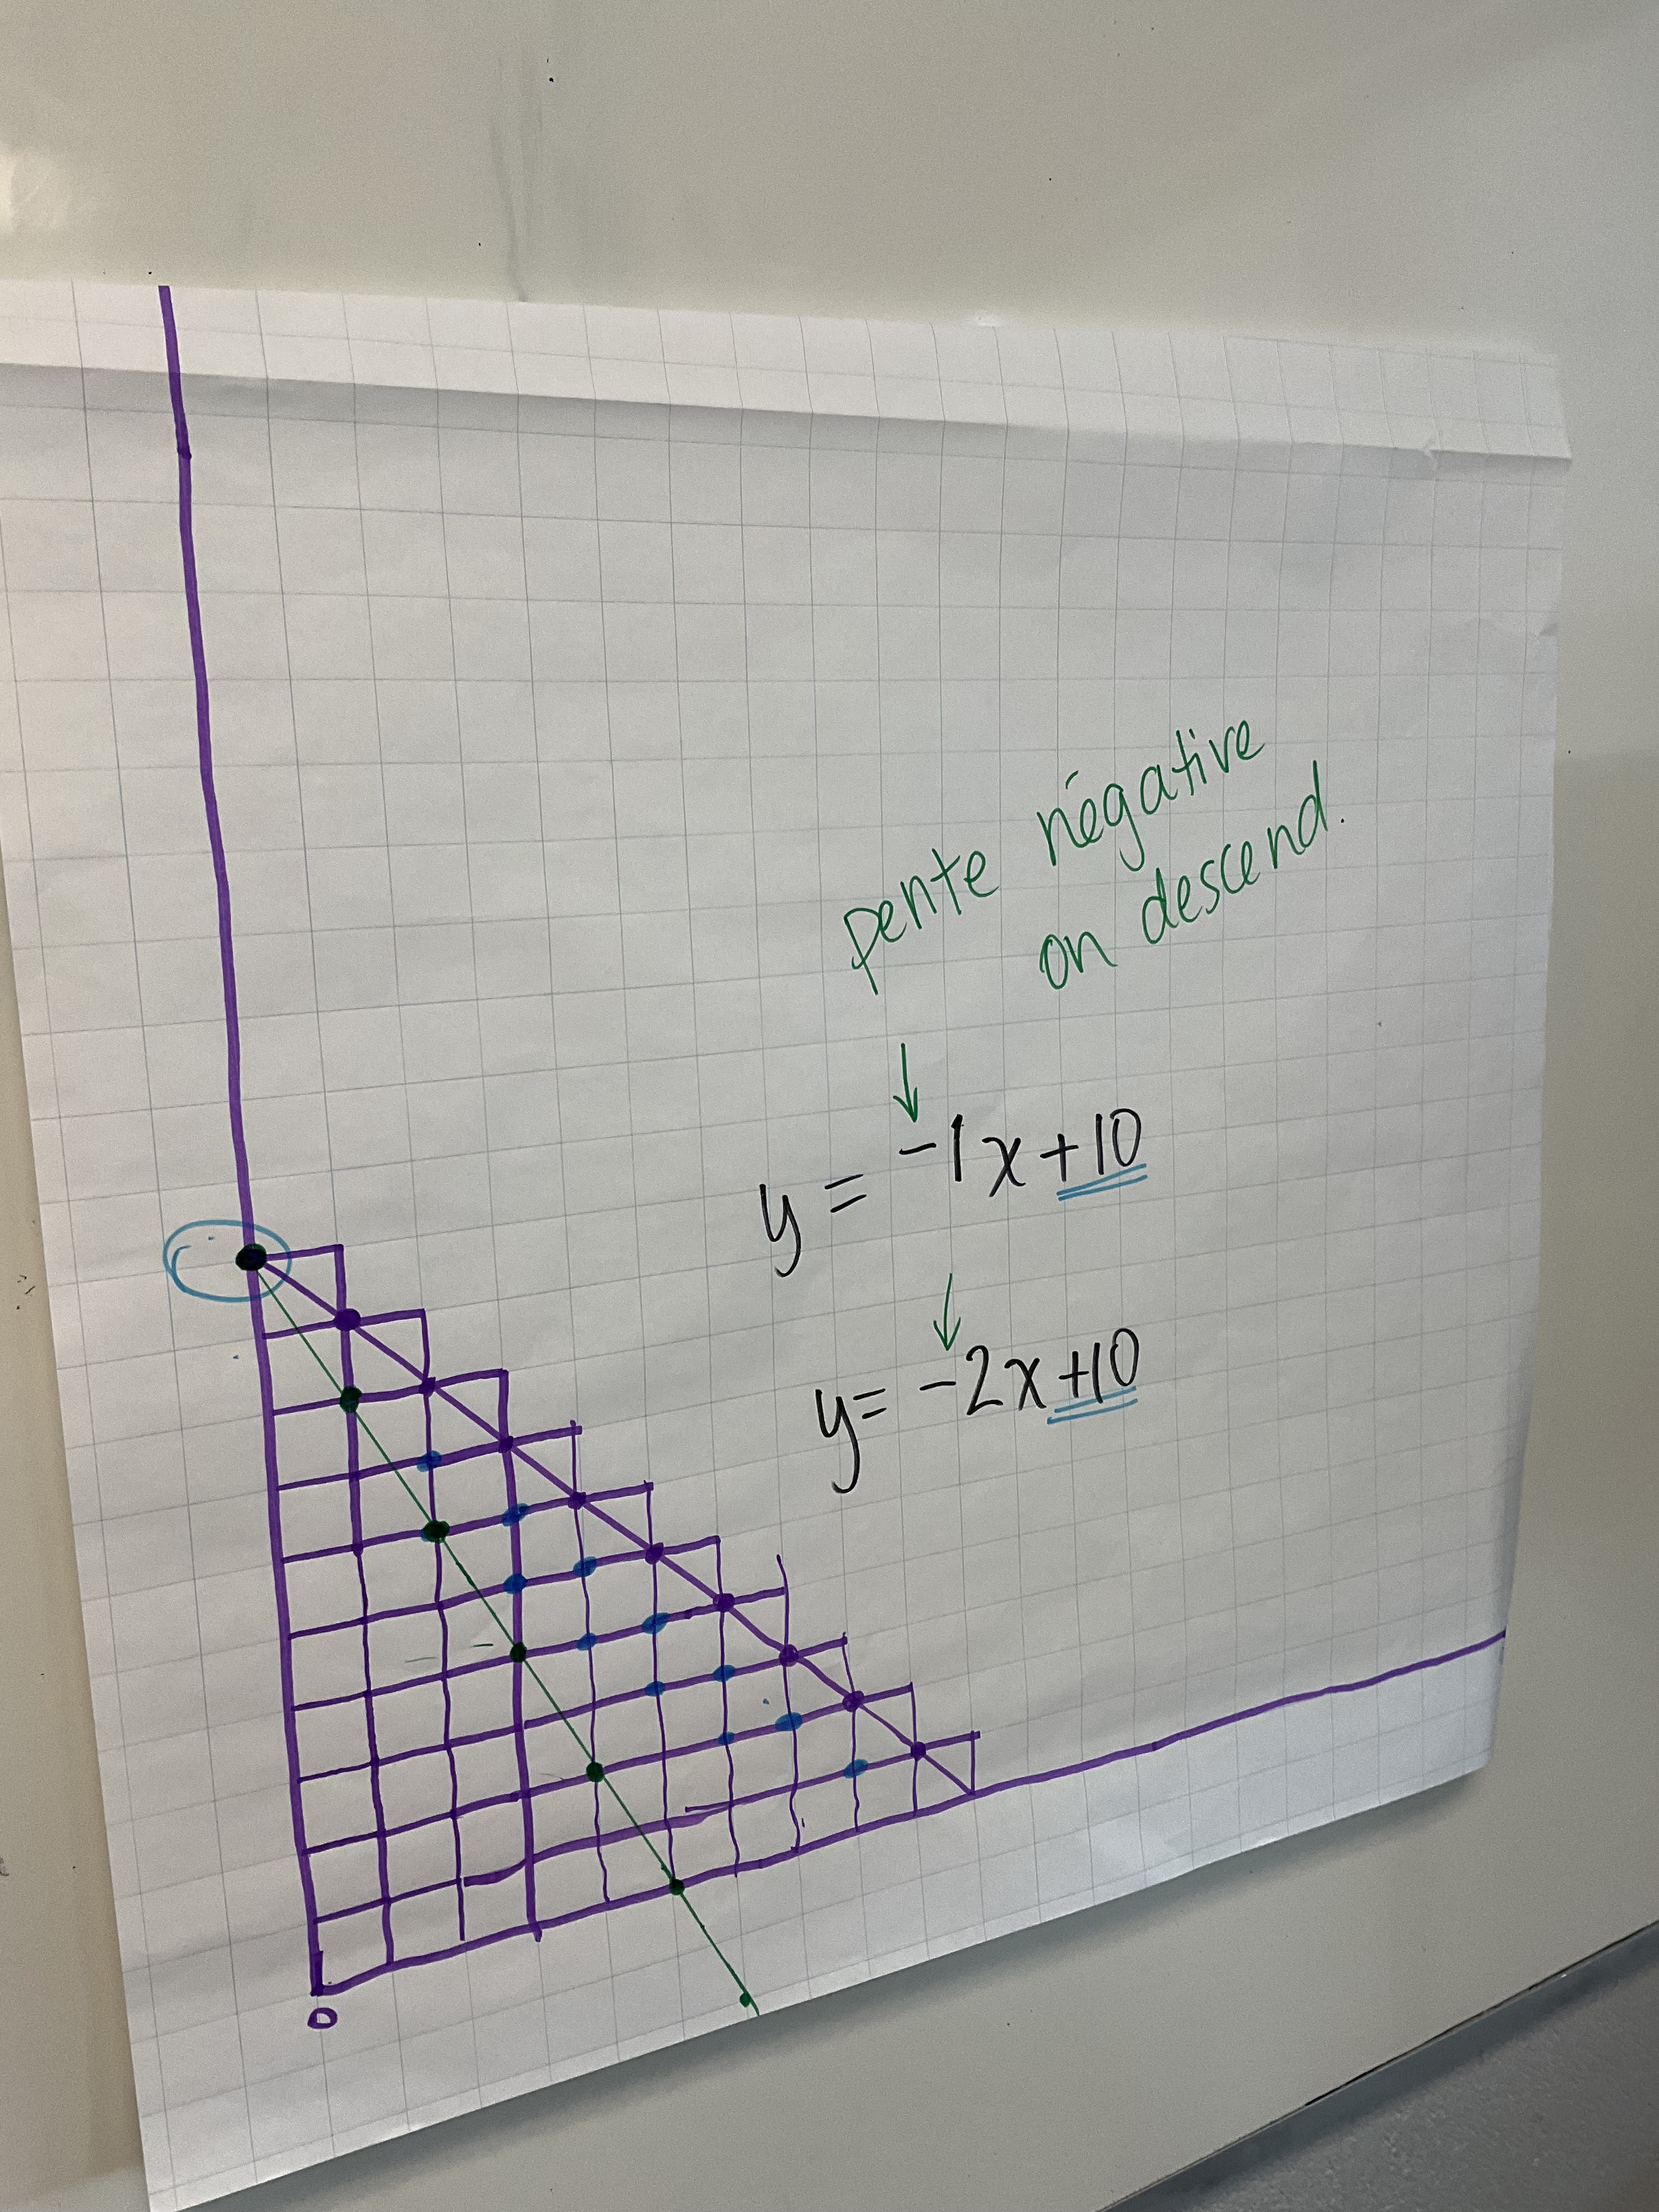
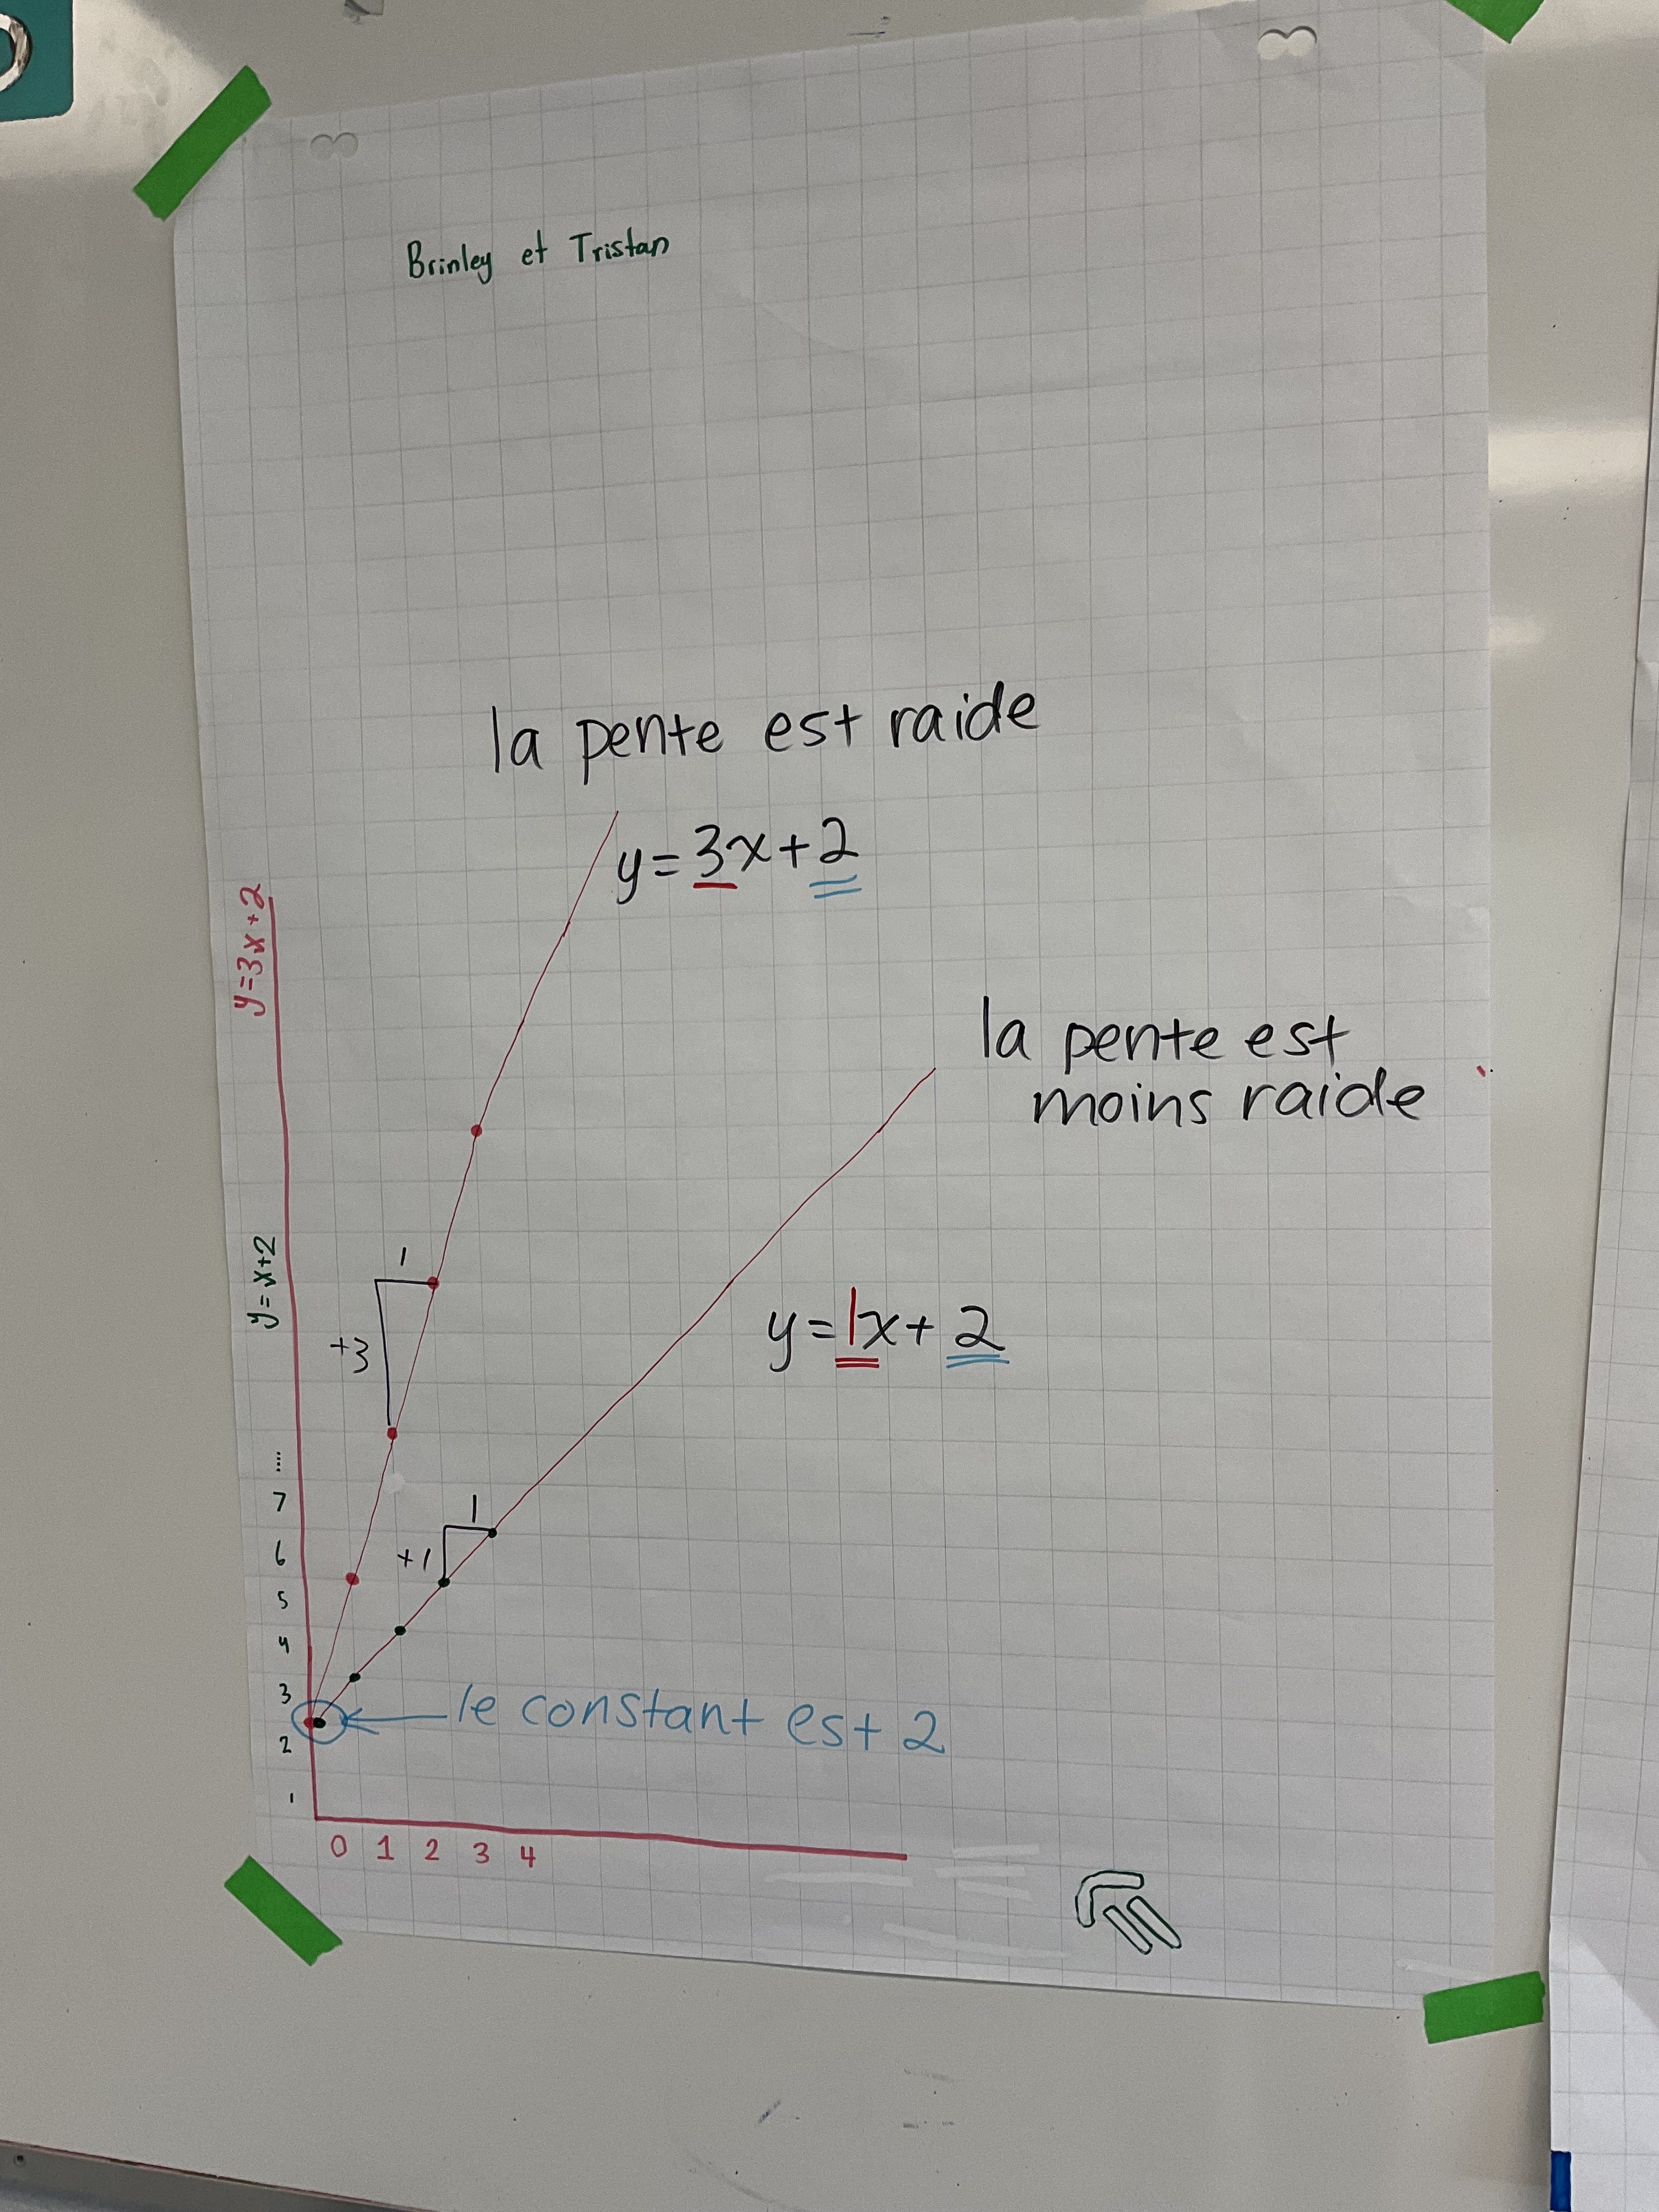
We can see that the constant, the y intercept, is 2, and the slope in this case is 3, since the “stairs” go up by 3 each time.
After groups had their graph complete, they were given a new pattern rule to do, and they used a different colour marker to make dots, so they ended up with 2 unique lines.

Groups all placed their work on the wall, and we did a consolidation lesson which talked through some new vocabulary, and we learned about slopes, y intercepts, and parallel lines. We looked at points of intersection, and were able to compare steepness of lines using their equations.
I wrote on the graphs as we went through the material. Here are the final chart papers.


We covered a great deal today! It was impressive work on a Friday afternoon.
A Visit to Grade 7
This morning I had the pleasure of visiting a grade 7 class to see what they are doing in math. It was a great experience, and interesting to see what’s going on.

They were working with counters to create a bucket of zeros, and using that to represent operations with integers. Thos particular question was an adding question and didn’t need zeros in the bucket, but yellow represented positive, and red negative and students knew to add the quantities together and create zero pairs and see that there is -1 that remains as their answer.
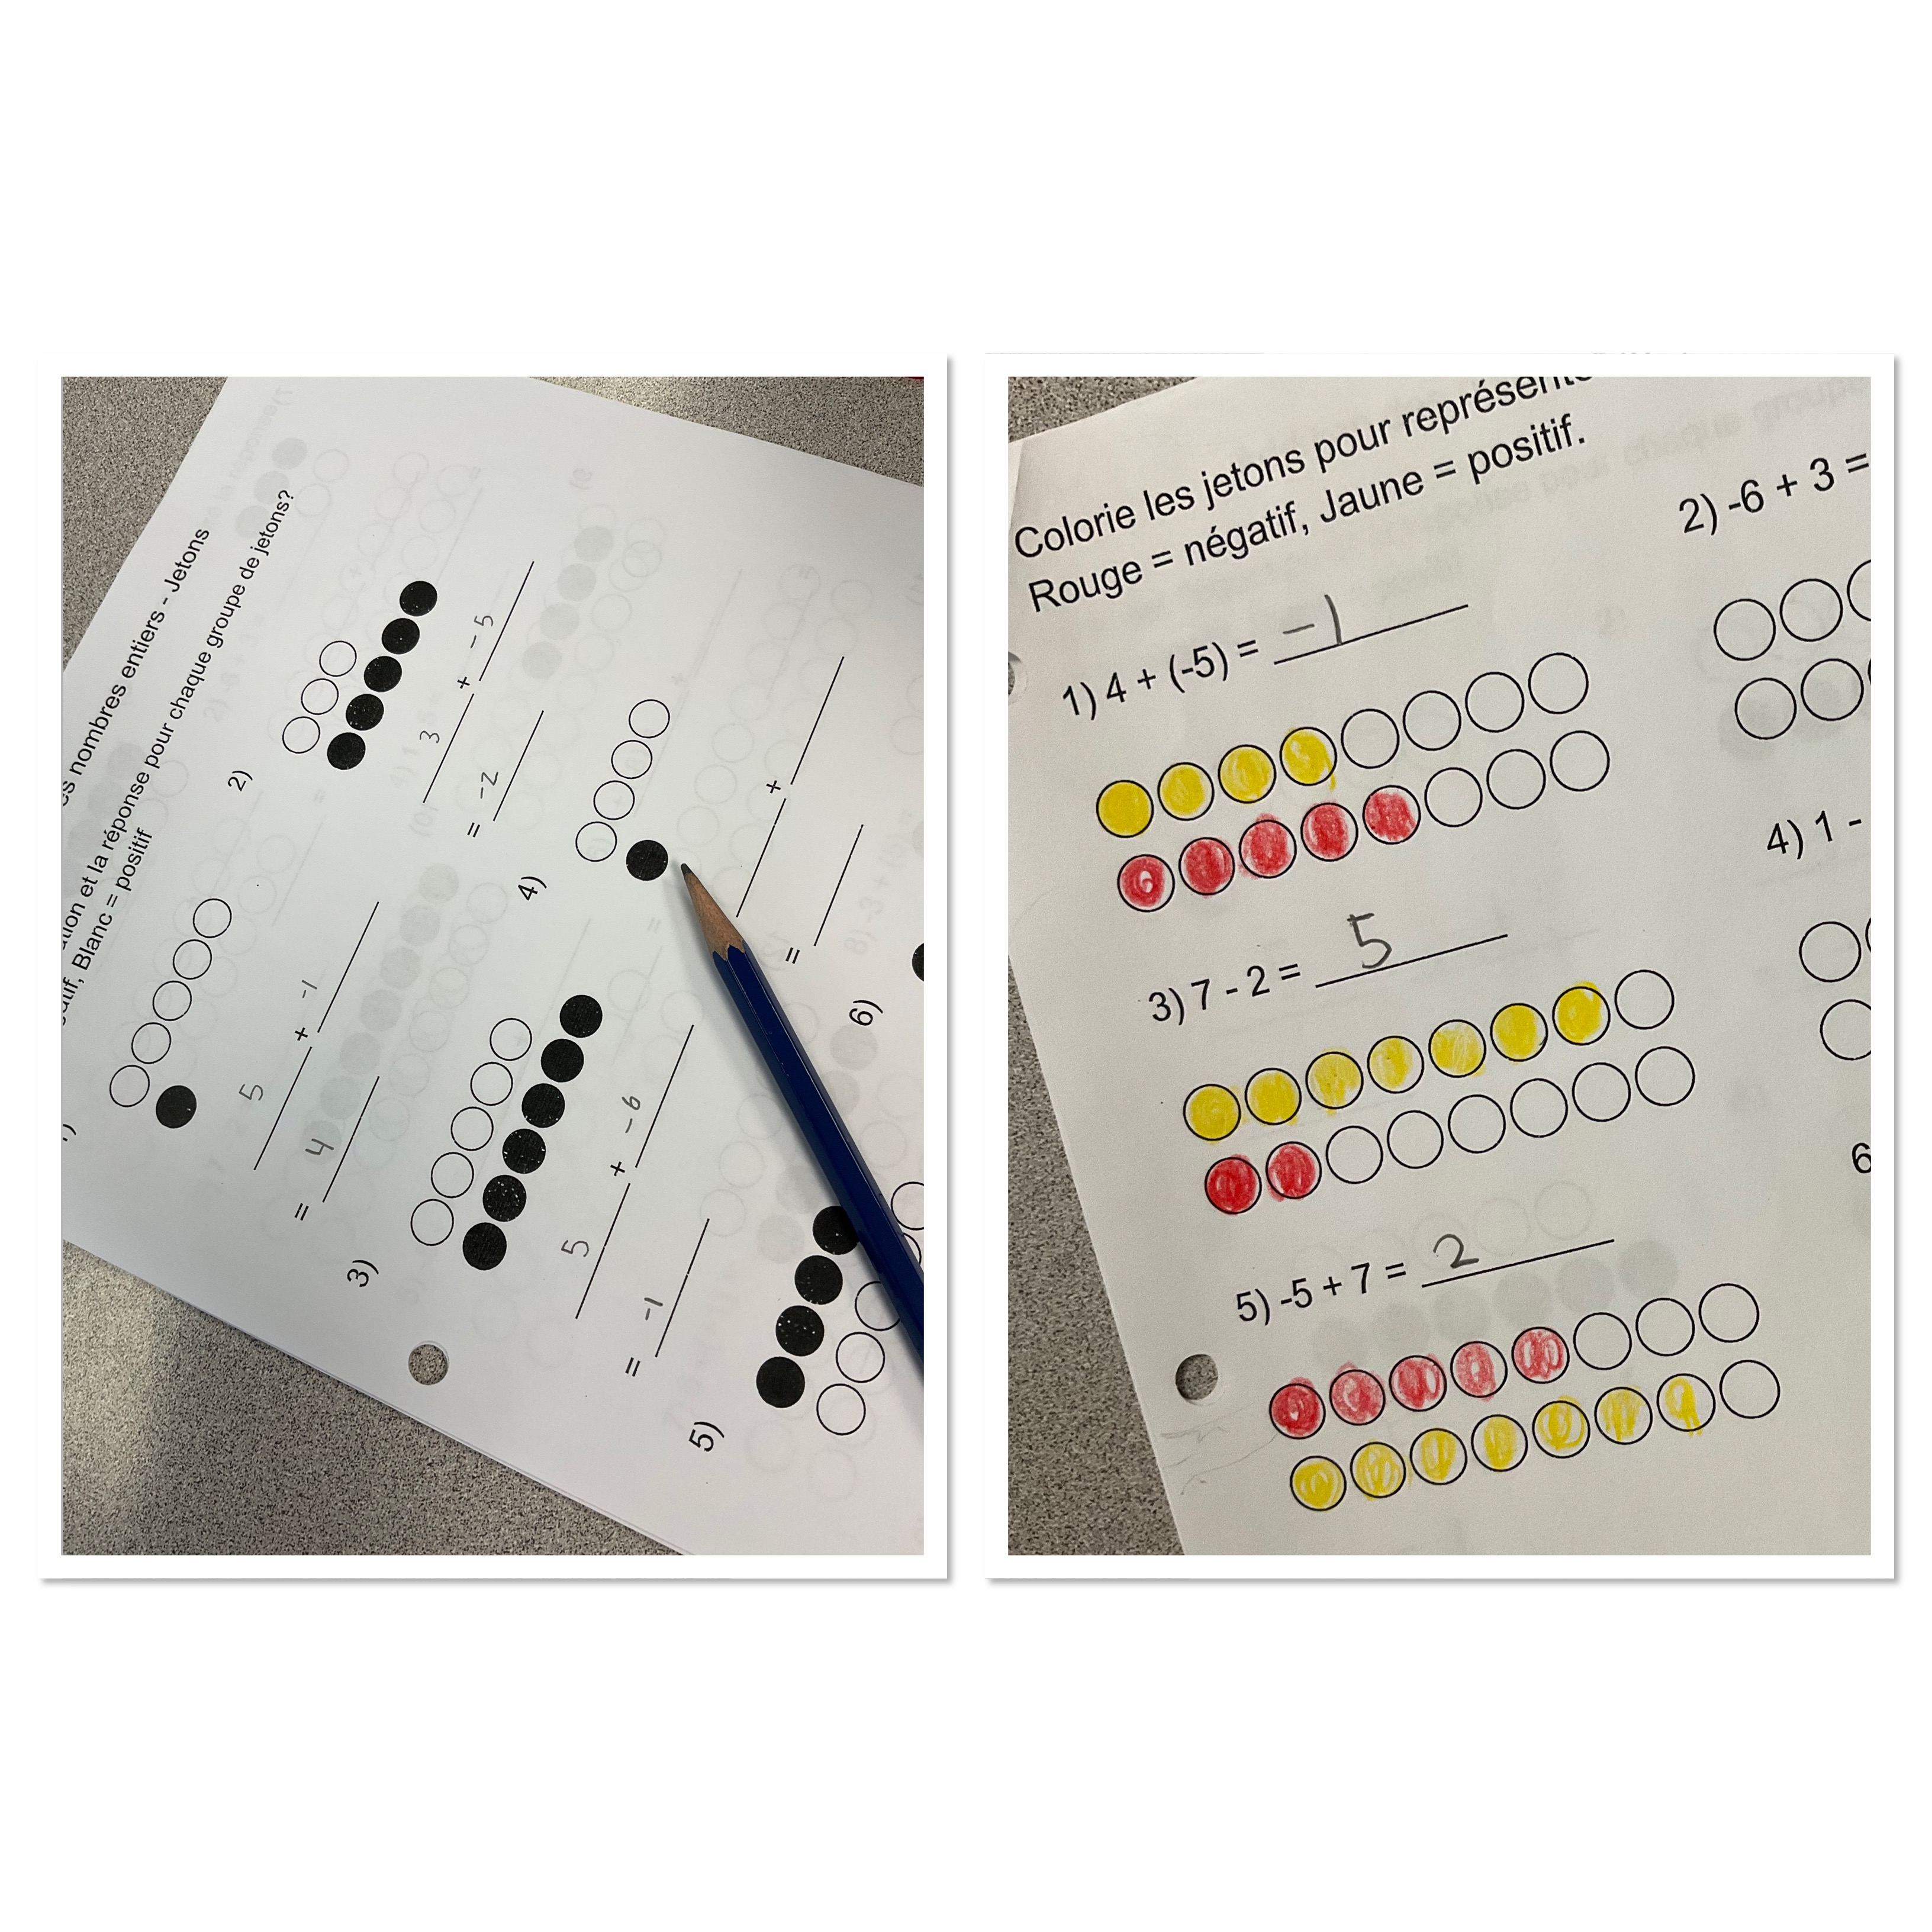
Students did purposeful practice reading and interpreting using visual representation of counters and also colouring in counters to arrive at their answer. After students got their work checked, they moved on to the next task which was to solve a Tarsia puzzle in groups. The puzzle was again practice with integer addition.

The bucket of zeros came back out and they worked through how to subtract using the bucket. They solved several subtraction questions as a class. They started off being sure their bucket has zero pairs. Next they placed their first value at the top of the bucket. This question starts out with -1 (one red counter) at the top. The instructions then say to remove/subtract/takeaway +6 (6 yellow counters). Students then removed 6 yellow counters from inside the bucket. What was left were 7 red counters and a bunch of zero pairs. The answer to the question is -7 due to the 7 red counters remaining.

After several examples and chances to practice, students had time to use their integer skills while playing cards. The red was negative and black was positive. Face cards were worth 10. Students flipped cards over and raced to determine the sum of their cards. Whoever got it right first got the cards. It became a little heated! Students were actively involved. Some used counters still, and others were feeling quite confident to add integers without concrete tools.

Thank you very much for inviting me to experience such an active and engaging lesson! I look forward to connecting further as the year progresses.
The Great Cheerio Stacking Competition
We had a fun time this morning in an MFM2P class. We worked on understanding linear systems and what the solution to the system is, by doing a competition.
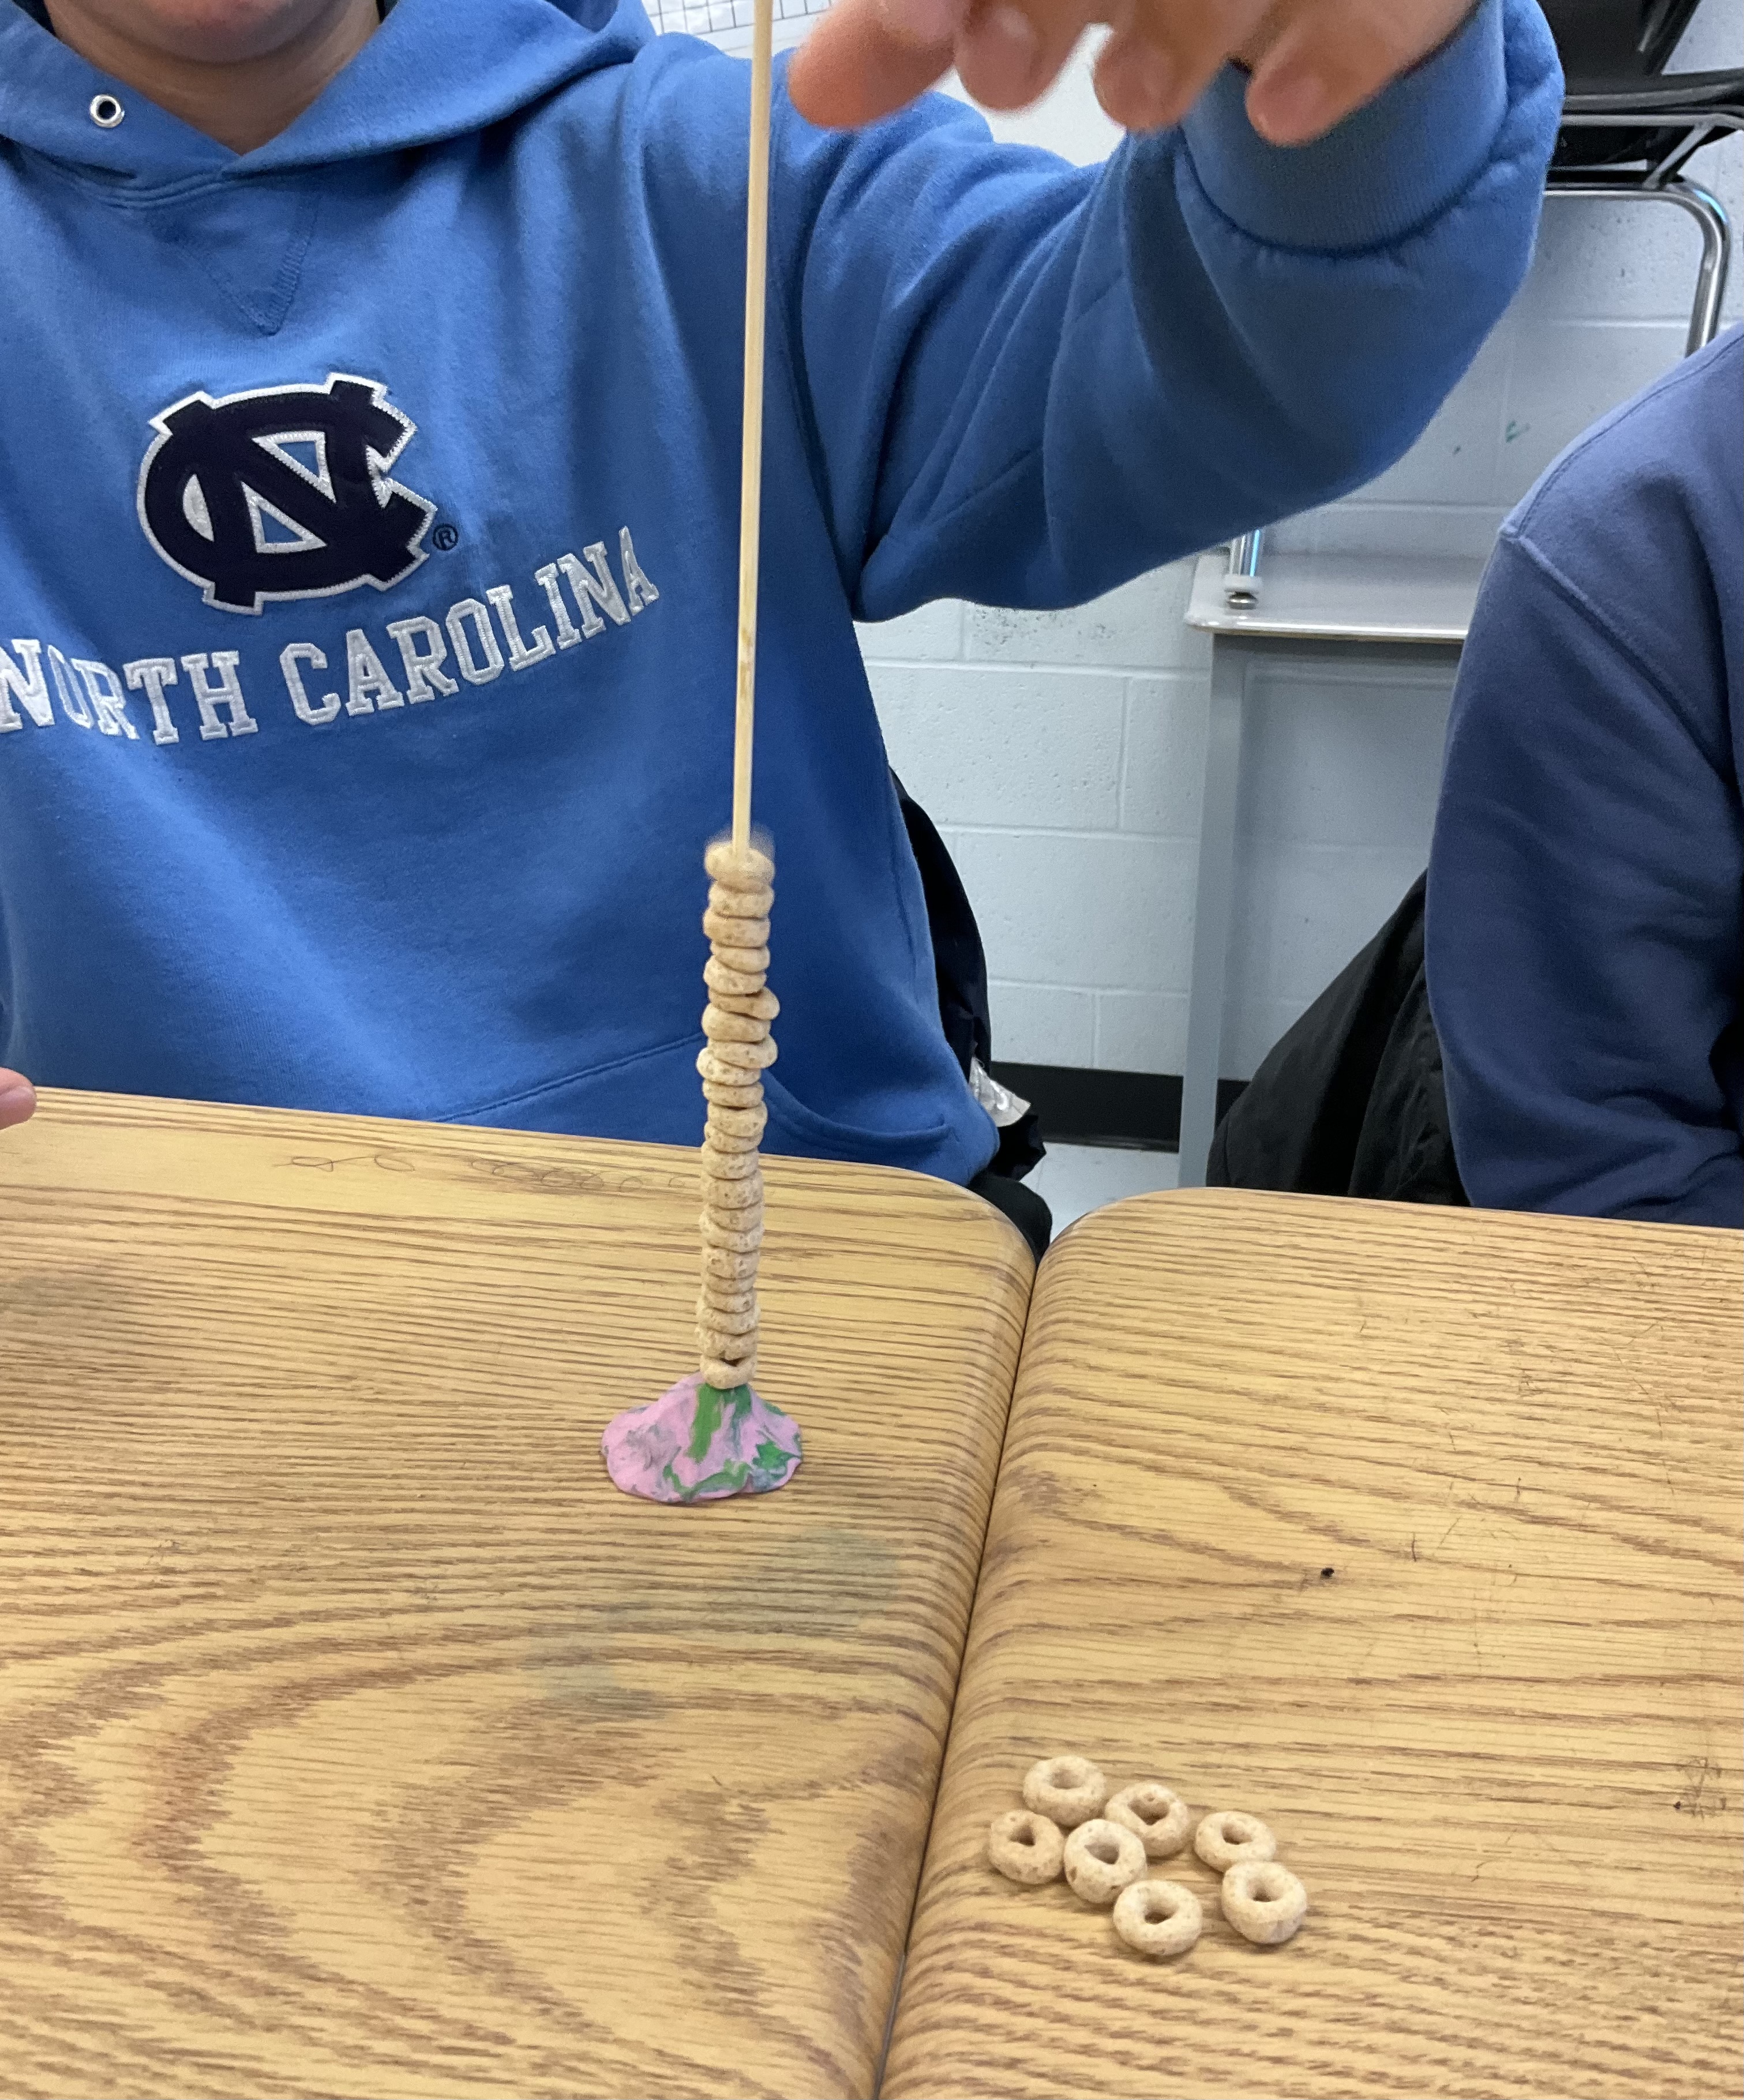
Students took turns seeing how fast they could stack cheerios onto a skewer. In their groups they needed to determine who was the fastest stacker.

Some chose to do this by measuring how many they stacked in a minute, or how much time it took to fill a skewer completely, or up to an arbitrary height decided by the group.

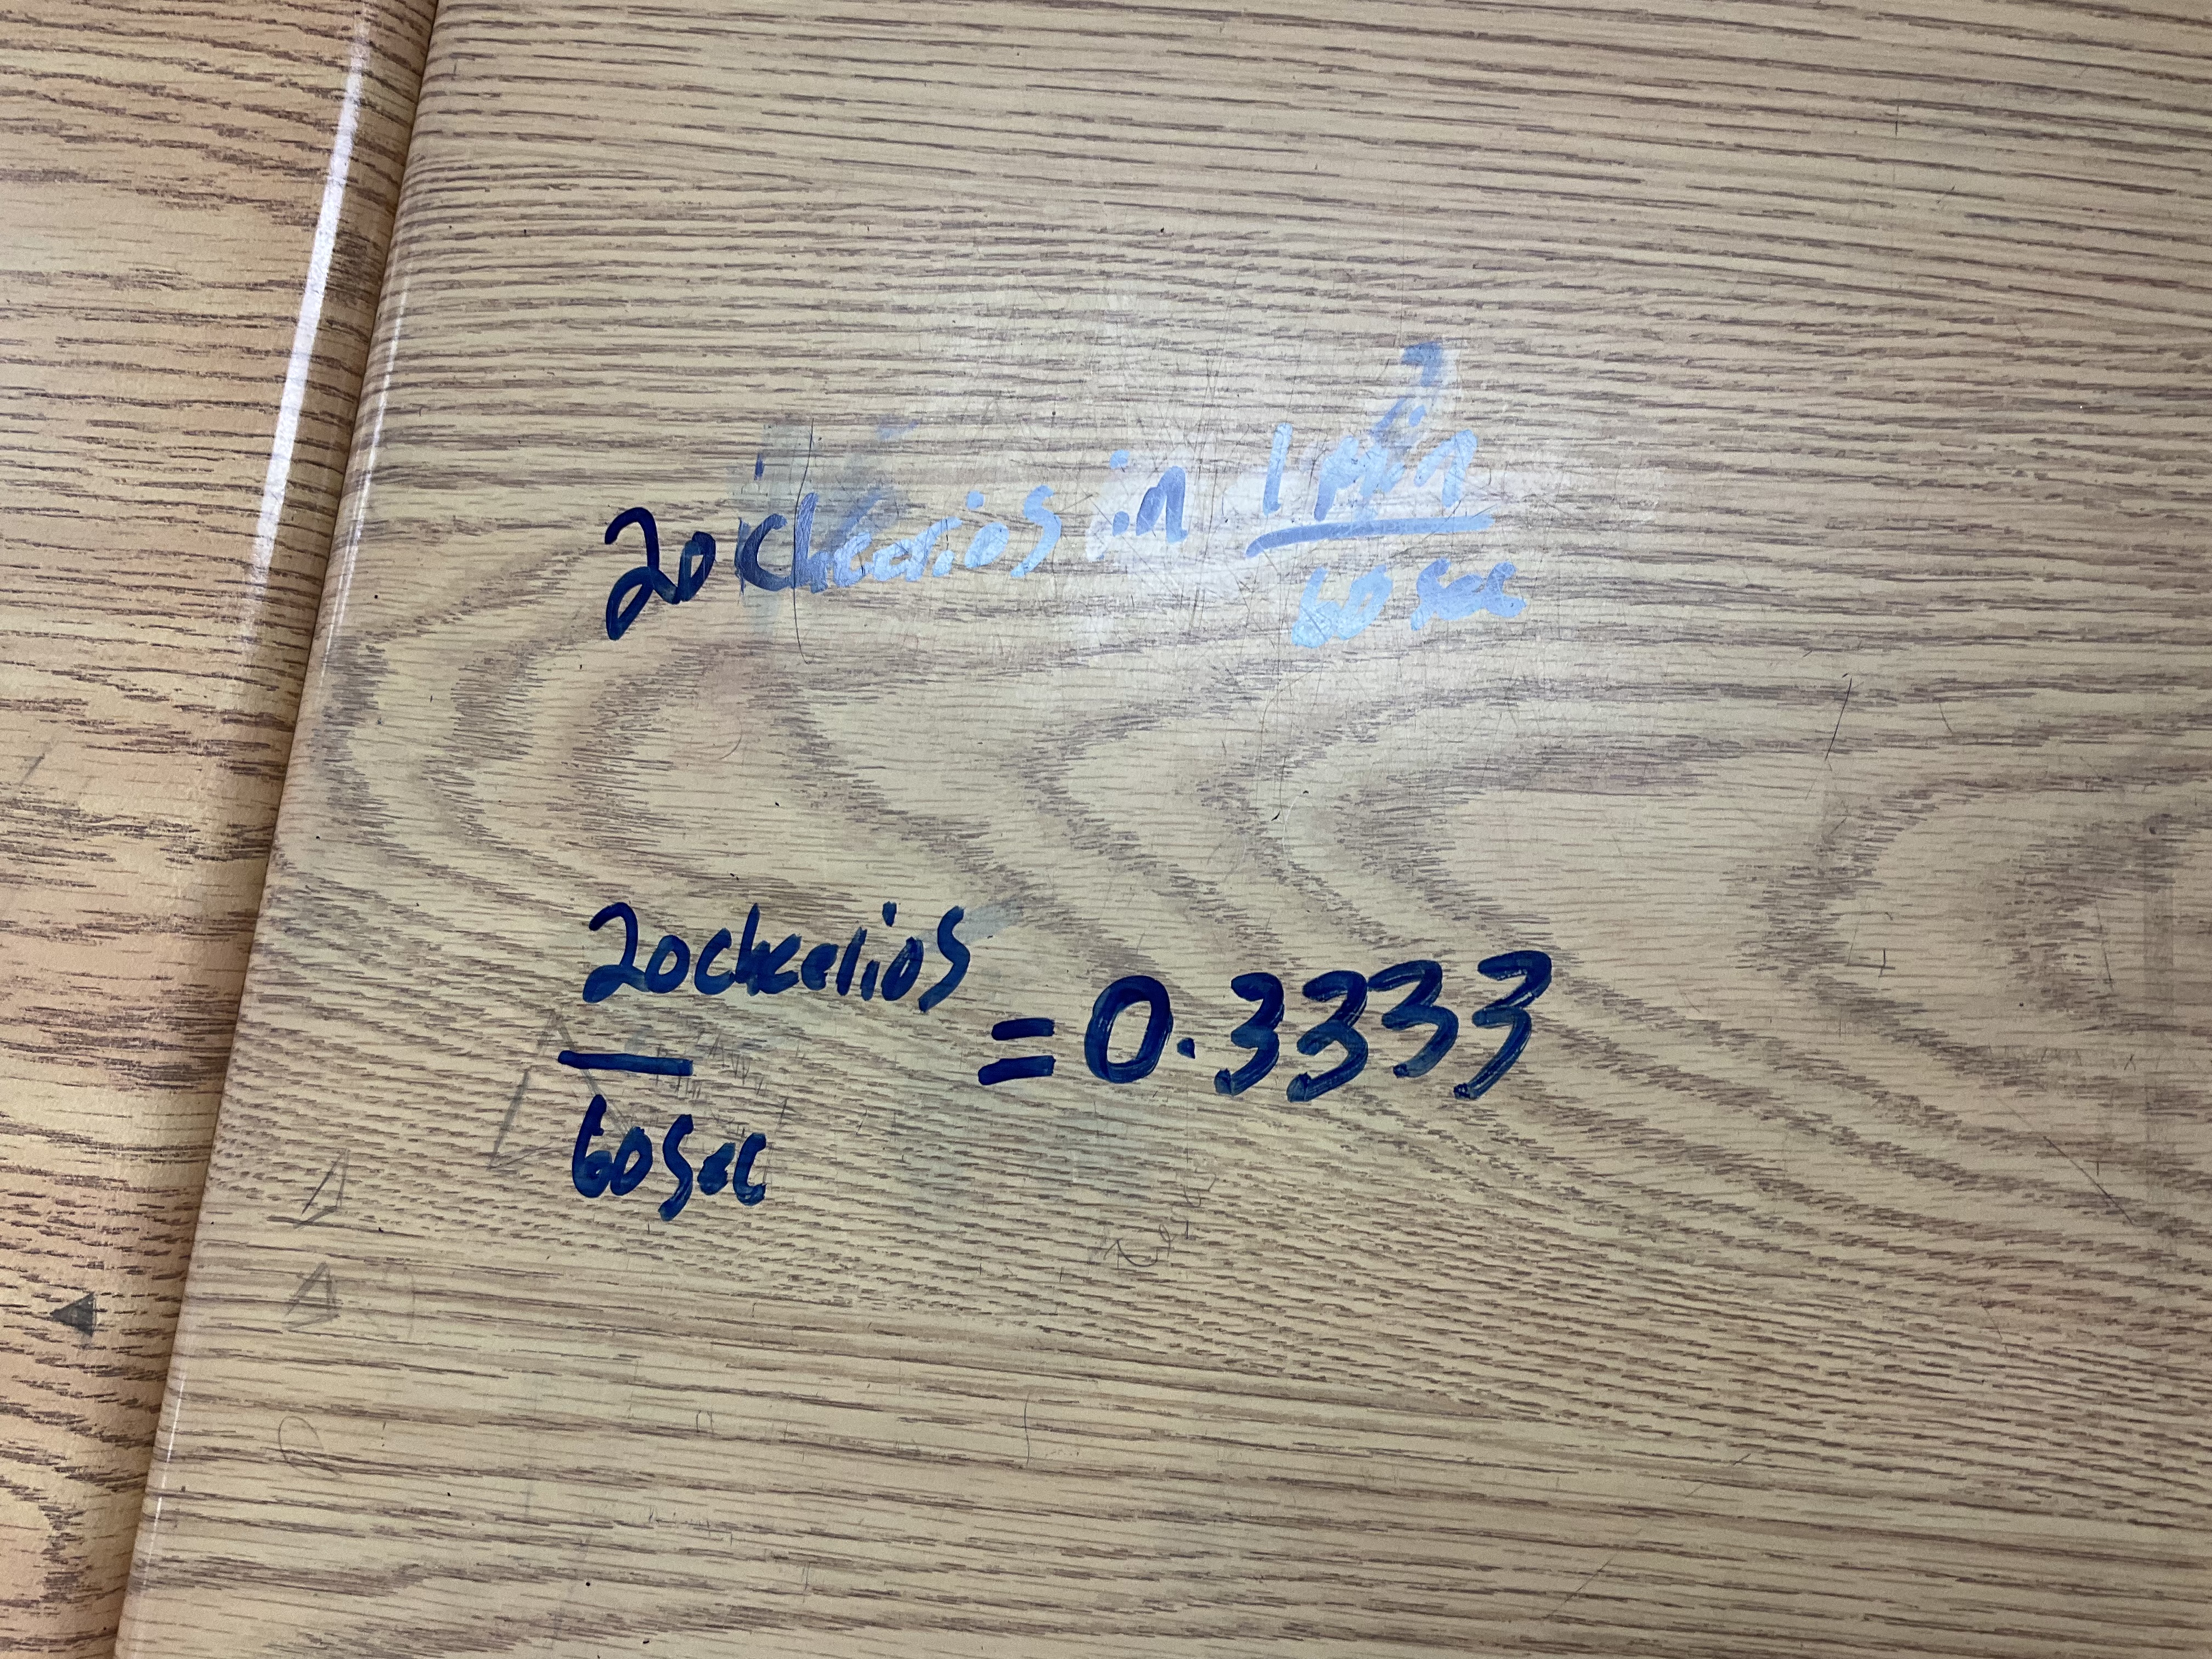
Once everyone was satisfied with their stacking, we determined who was the fastest stacker in the class. To do this we needed to decide on a good metric to compare. We came up with cheerios per second as our units of speed that we used to compare everyone in the class.
The next step was to work on creating an exciting photo finish at the end of the class. The goal was for each group to figure out the number of cheerios needed to add to their skewer as a head start when competing against the fastest stacker.
We tied the ideas of rate and slope of cheerio stacking to what it would look like on a graph. We know that the faster stacker would have a steeper slope.
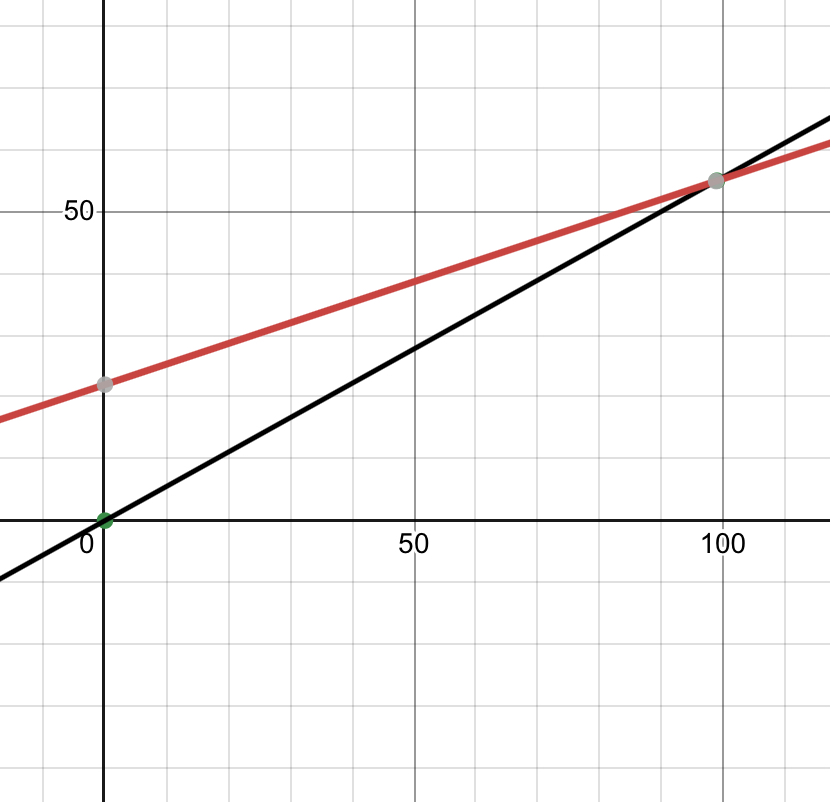
In the end we had our stackers line up with their calculated head starts and see how close to a photo finish we can create.

Many groups came pretty close to having a full skewer at the same time! It was a lot of fun to see how close they came.
competition was friendly but intense!
Solving Systems with Elimination
Today grade 10s are starting a new cycle of learning. We started off thinking classroom style at the boards to do a three act task.
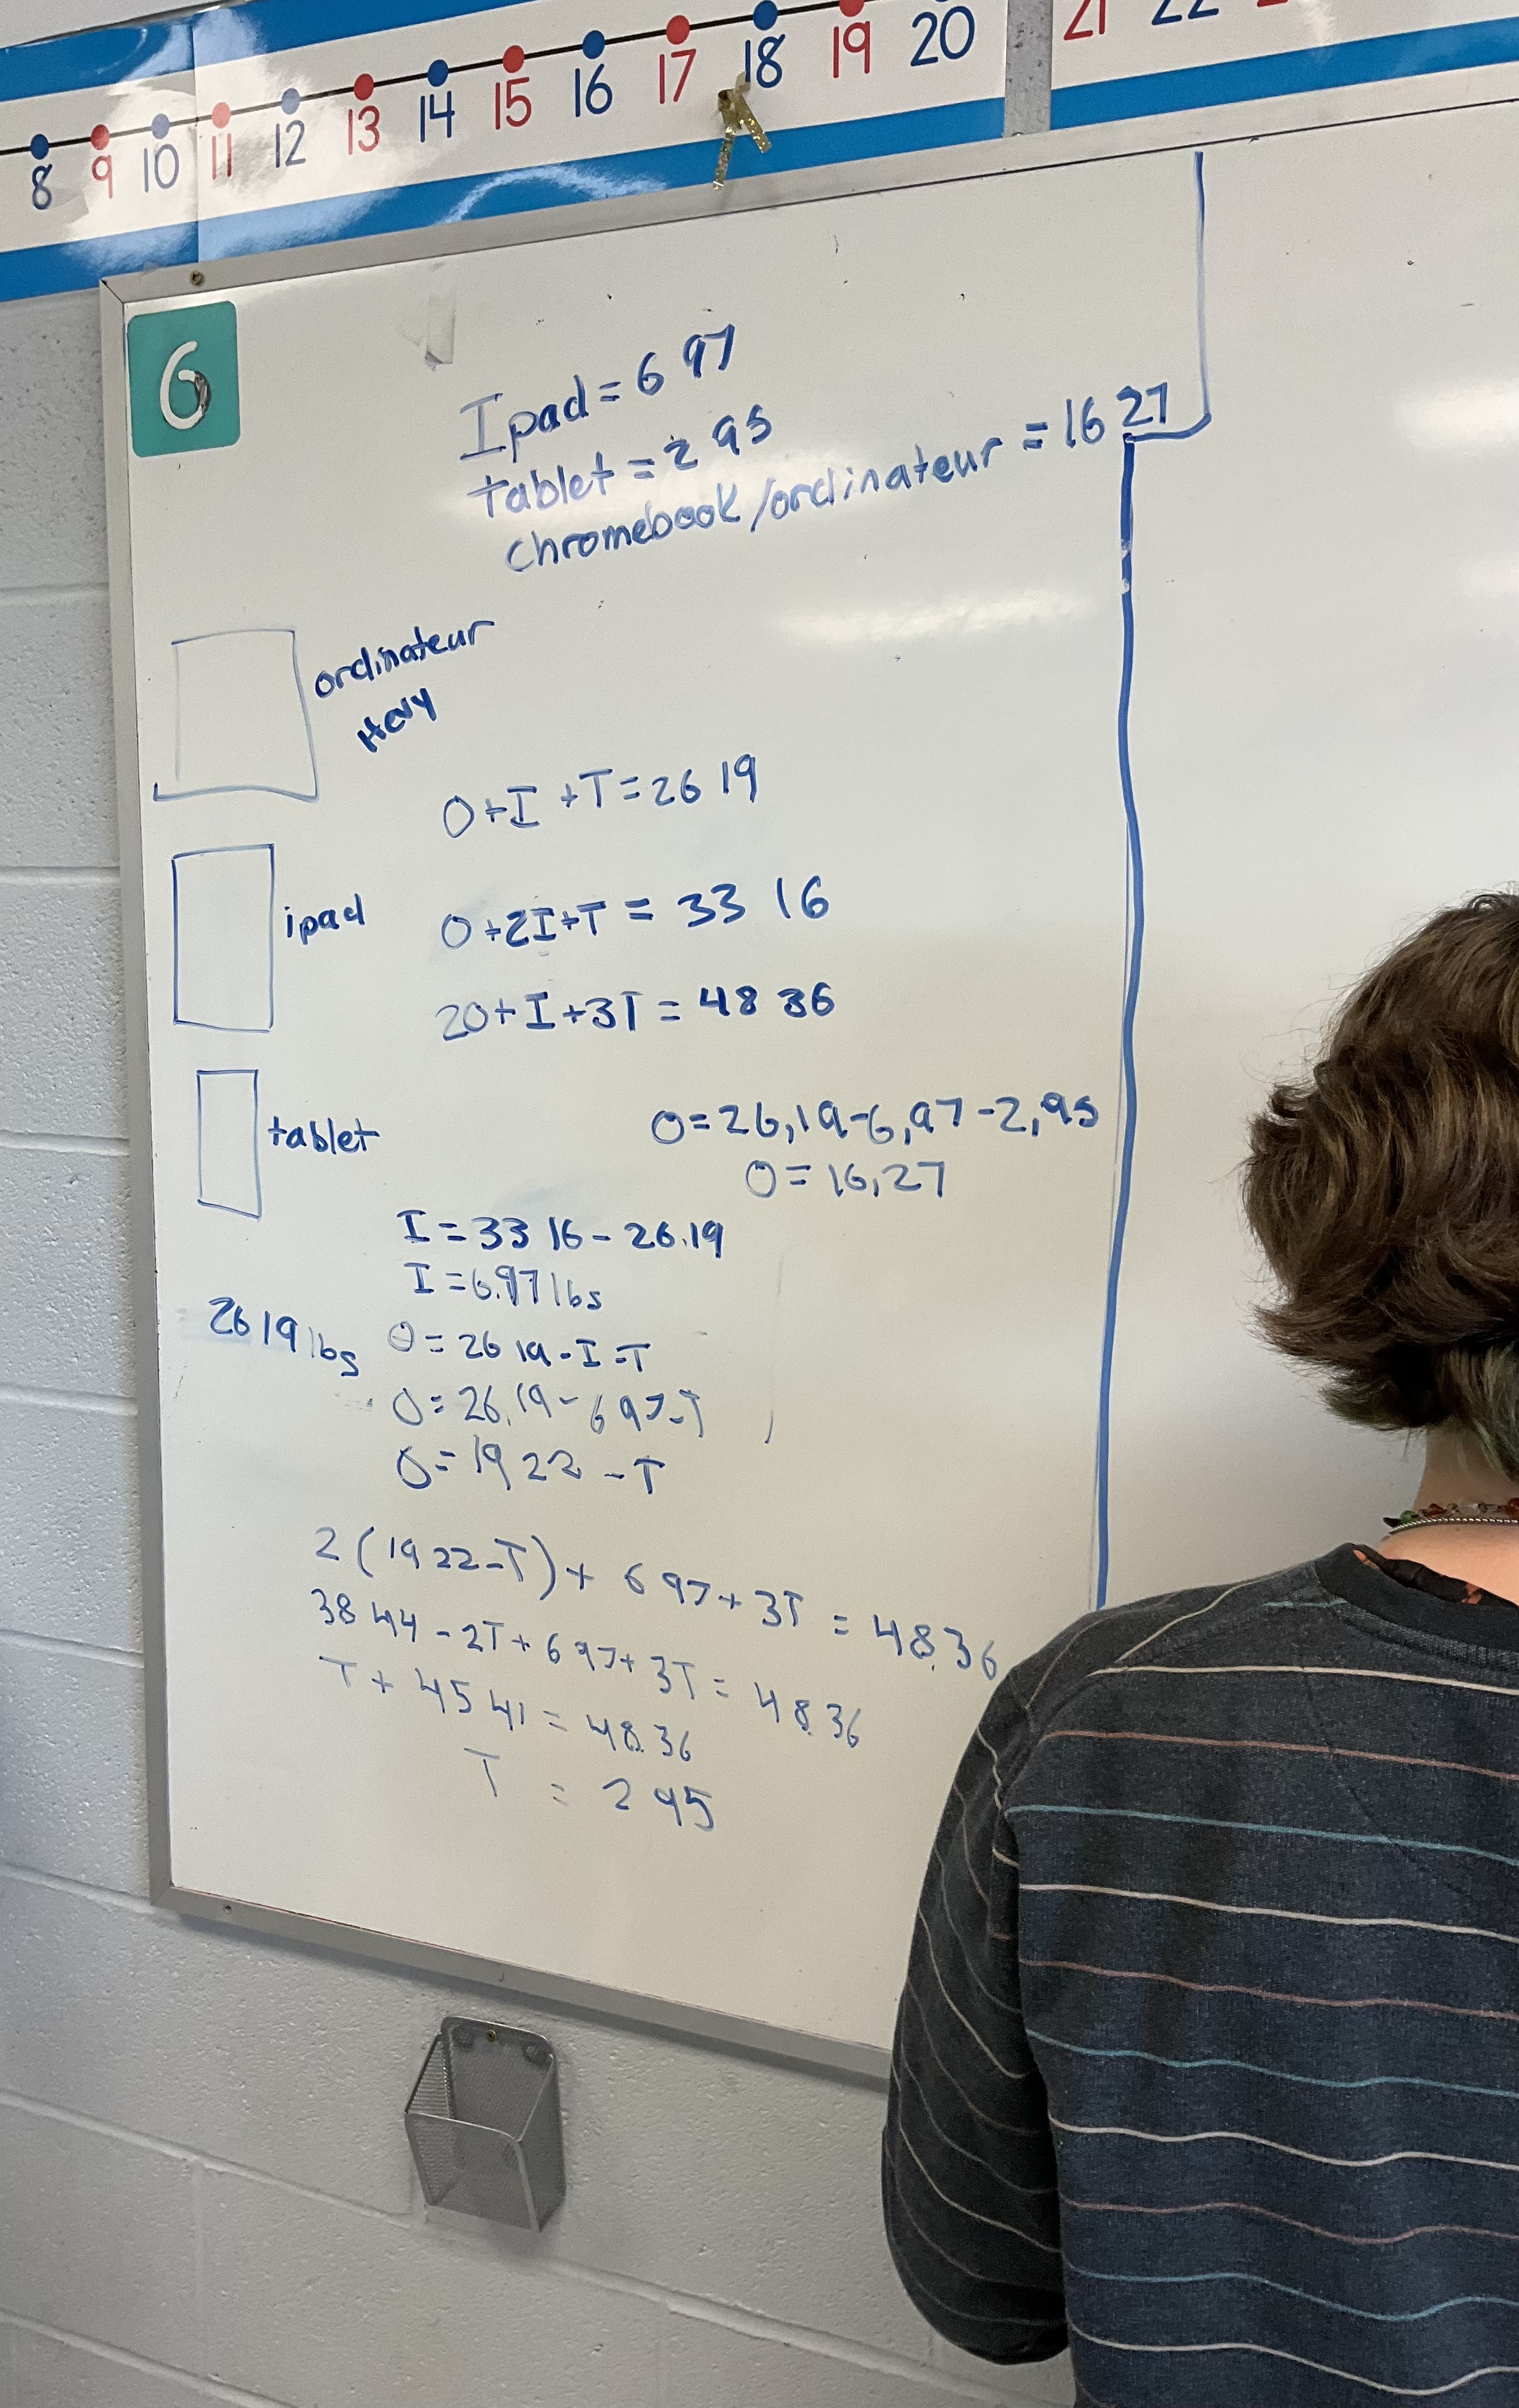
We noticed that they are weighing piles of tech devices.
we watched 3 parts of Act 2 and wrote down information and equations, and started to solve for the weight of each device.
It was a hive of activity as students attempted for the first time to solve a system of 3 equations with 3 variables.
Students noticed that by subtracting 2 equations they could determine one of the values, and they then could use substitution and the 2 remaining equations to solve.
It was interesting to see how students drew out their first steps and distilled the information into equations.
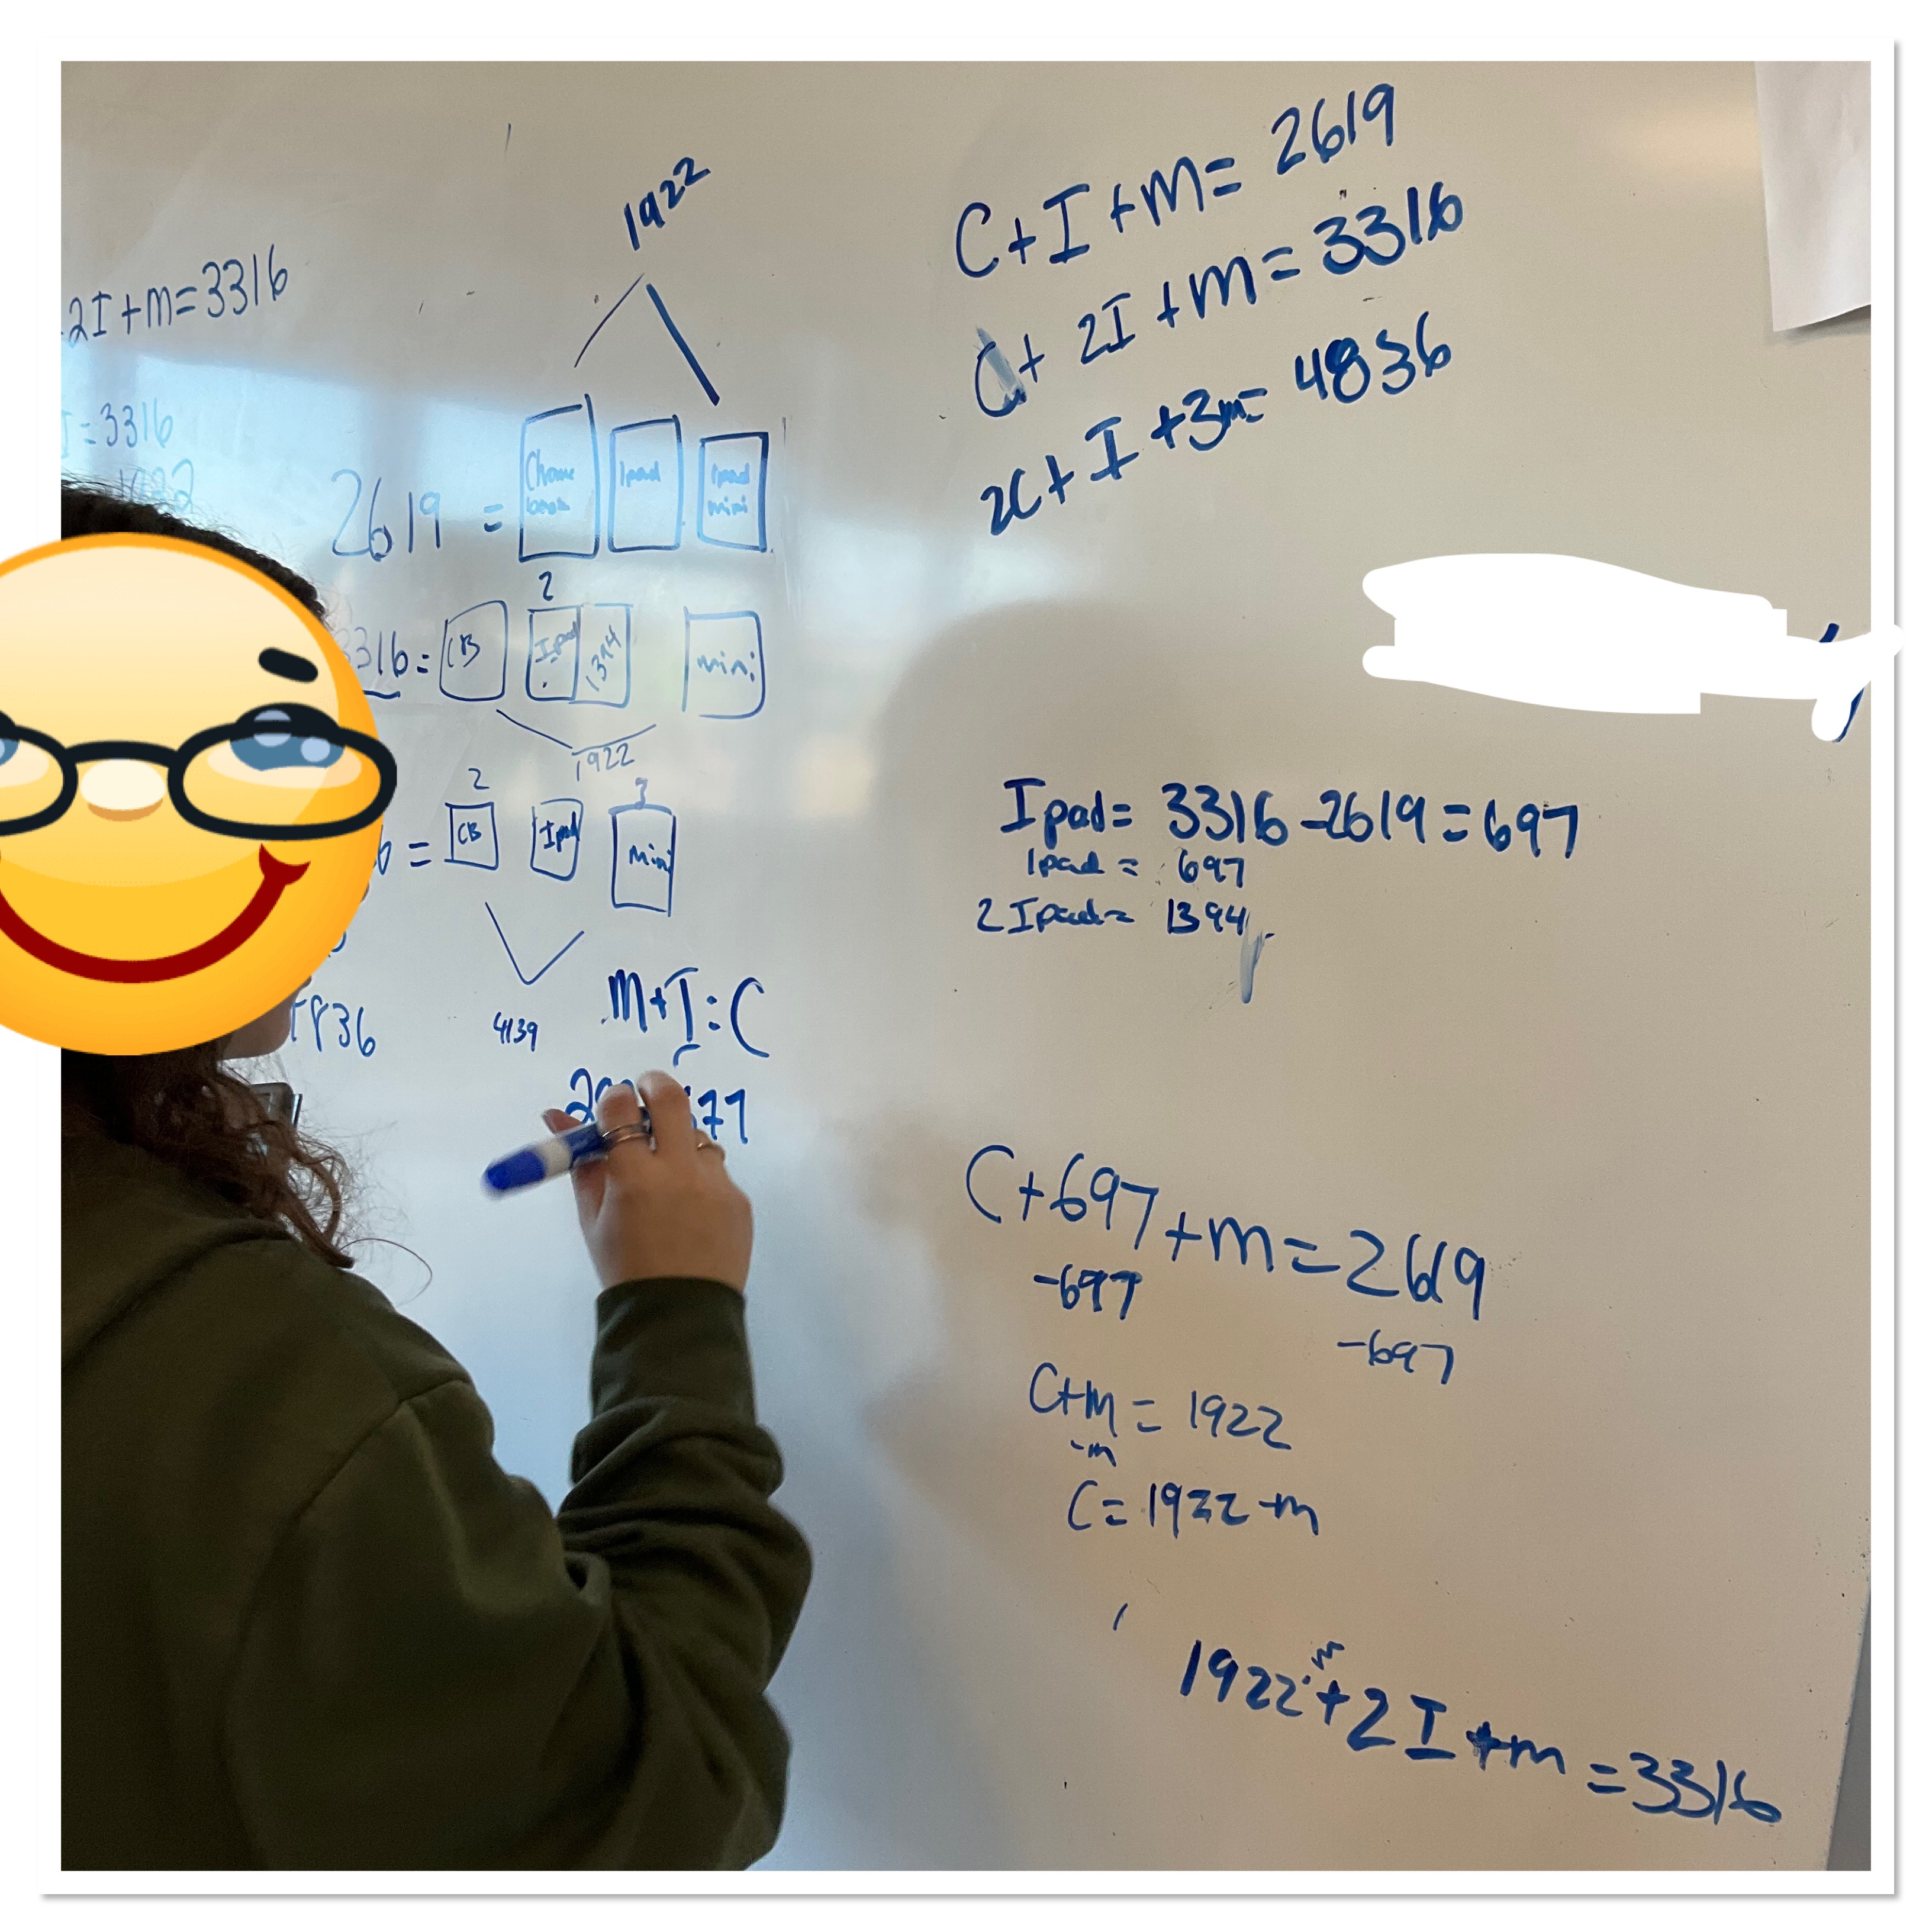
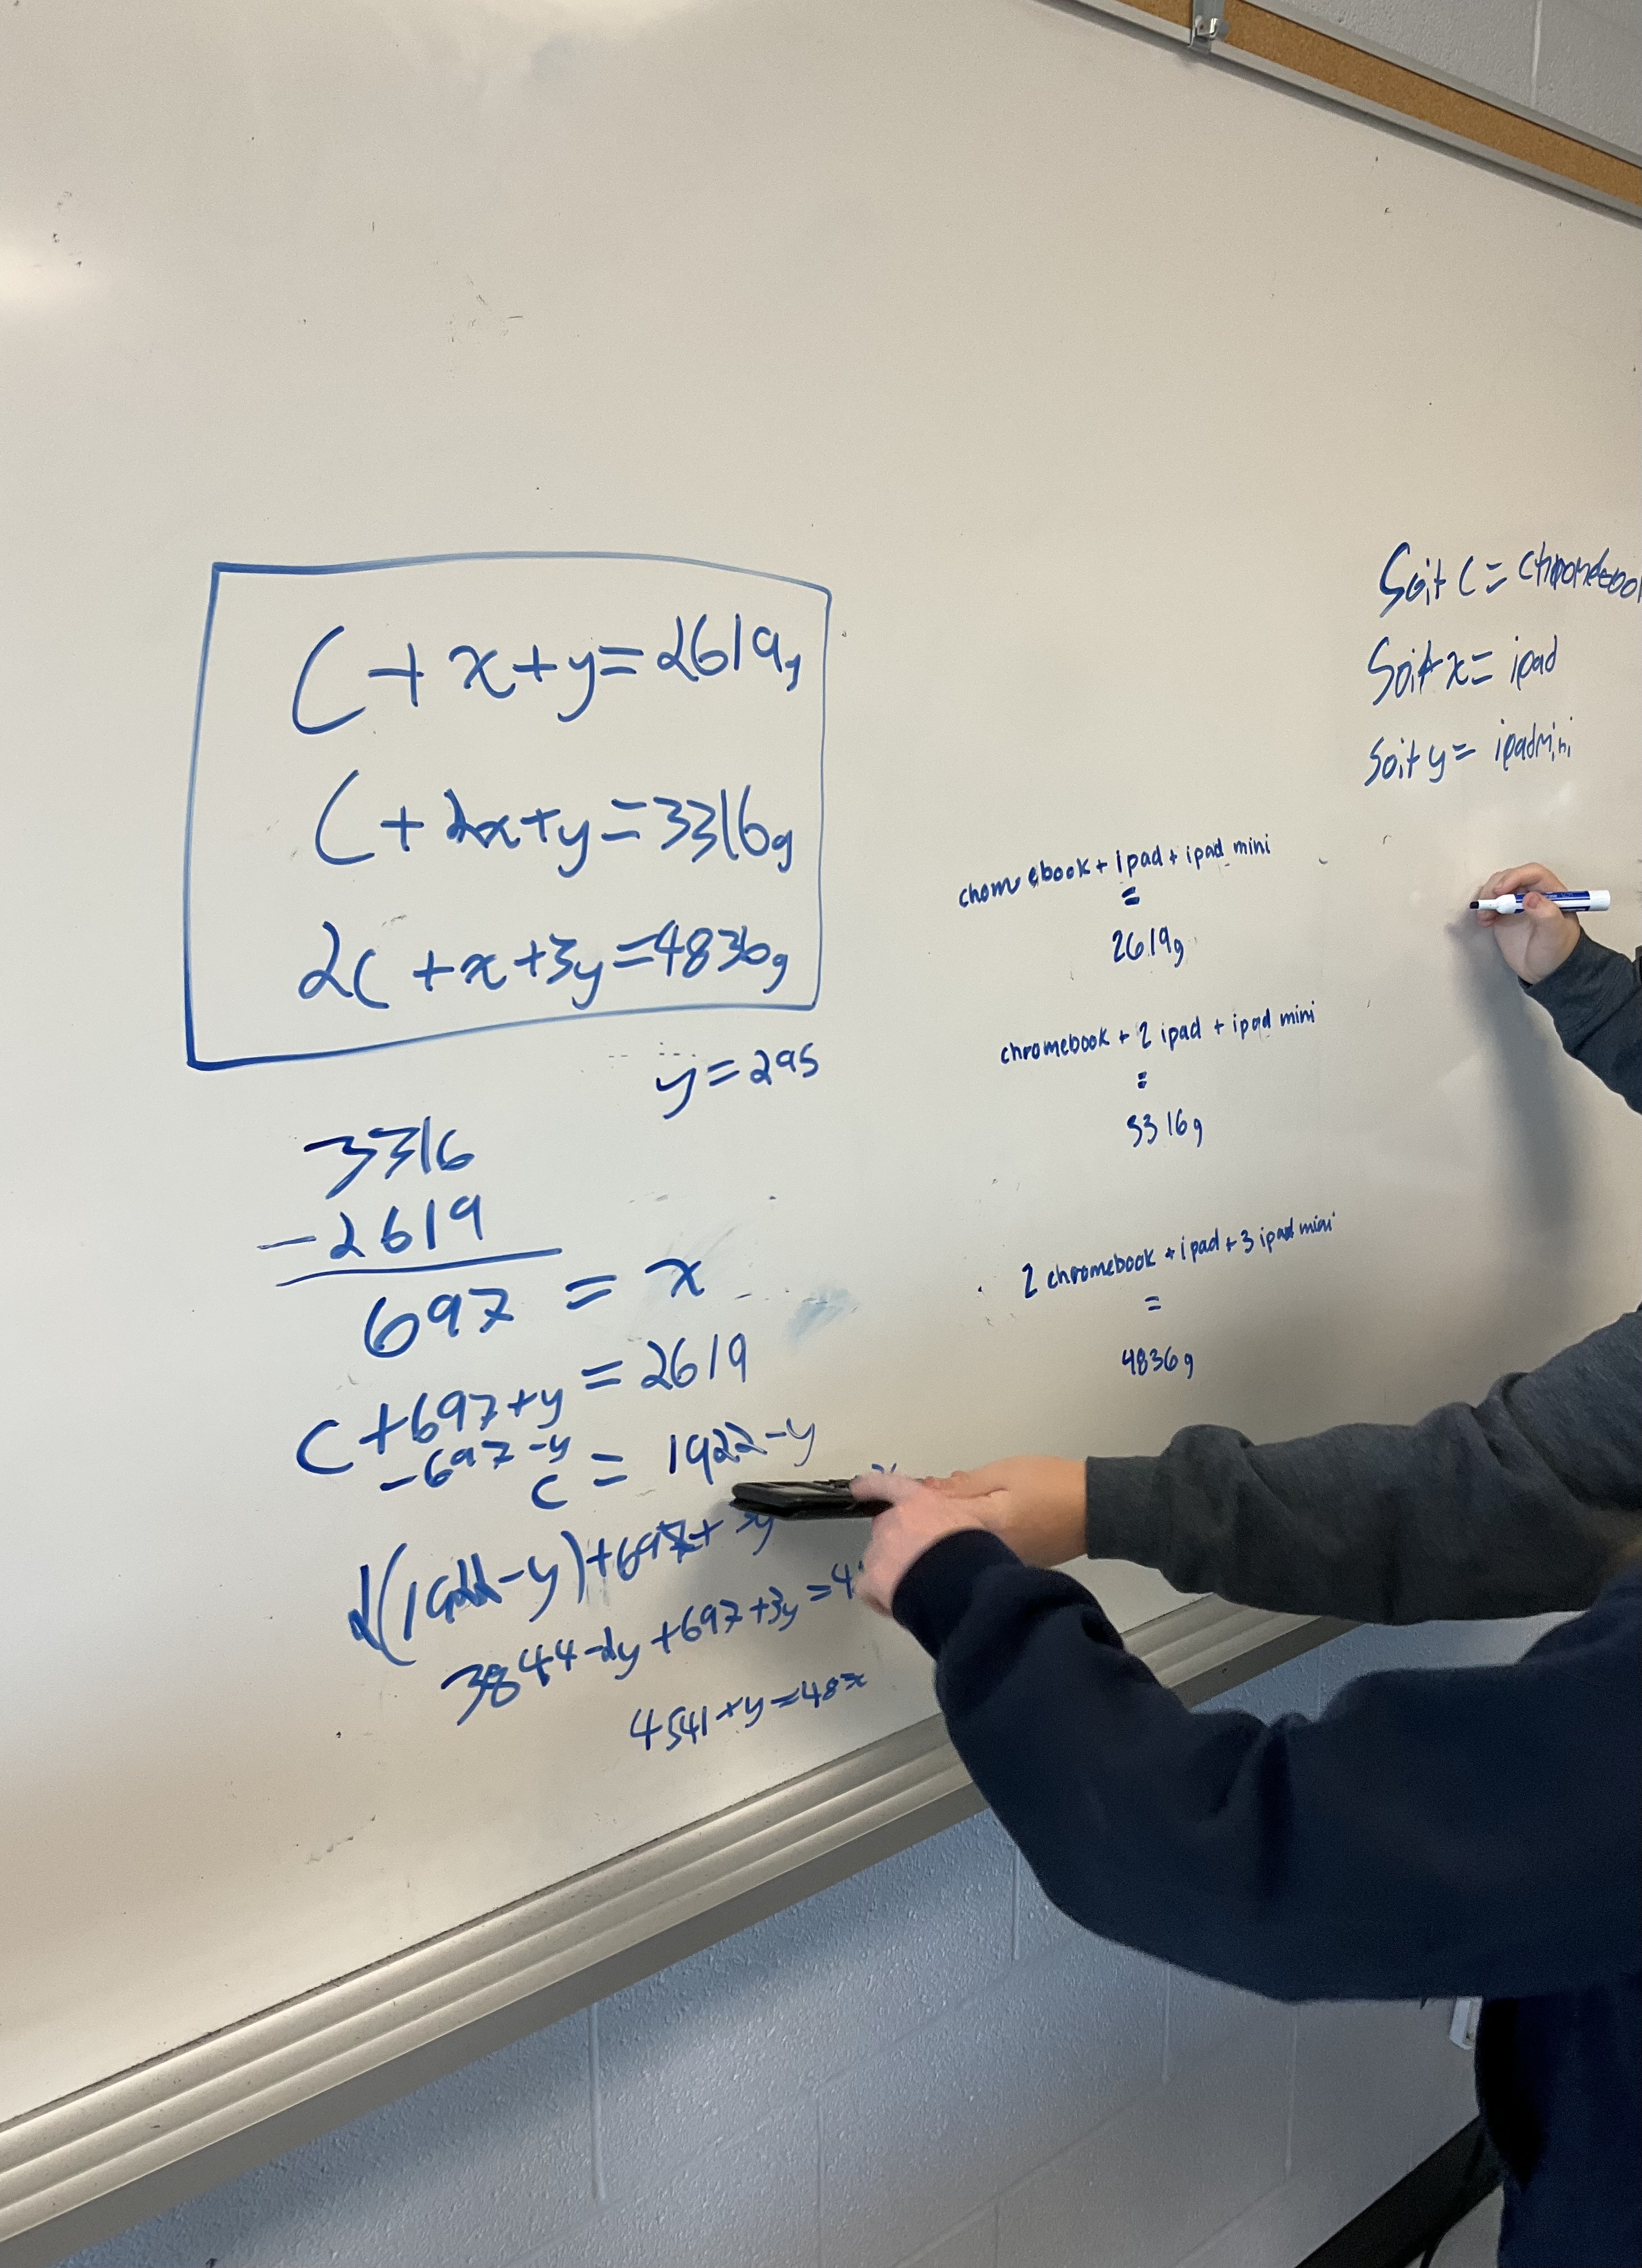
We talked about how to introduce variables, and how it’s best to have one letter or symbol represent one variable, and how choosing letters that do not look like numbers or symbols are better choices. In the following example the choice of “o” as a variable is challenging as it looks like 0.
There were high fives today as students figured out how to solve problems with the new method of elimination.
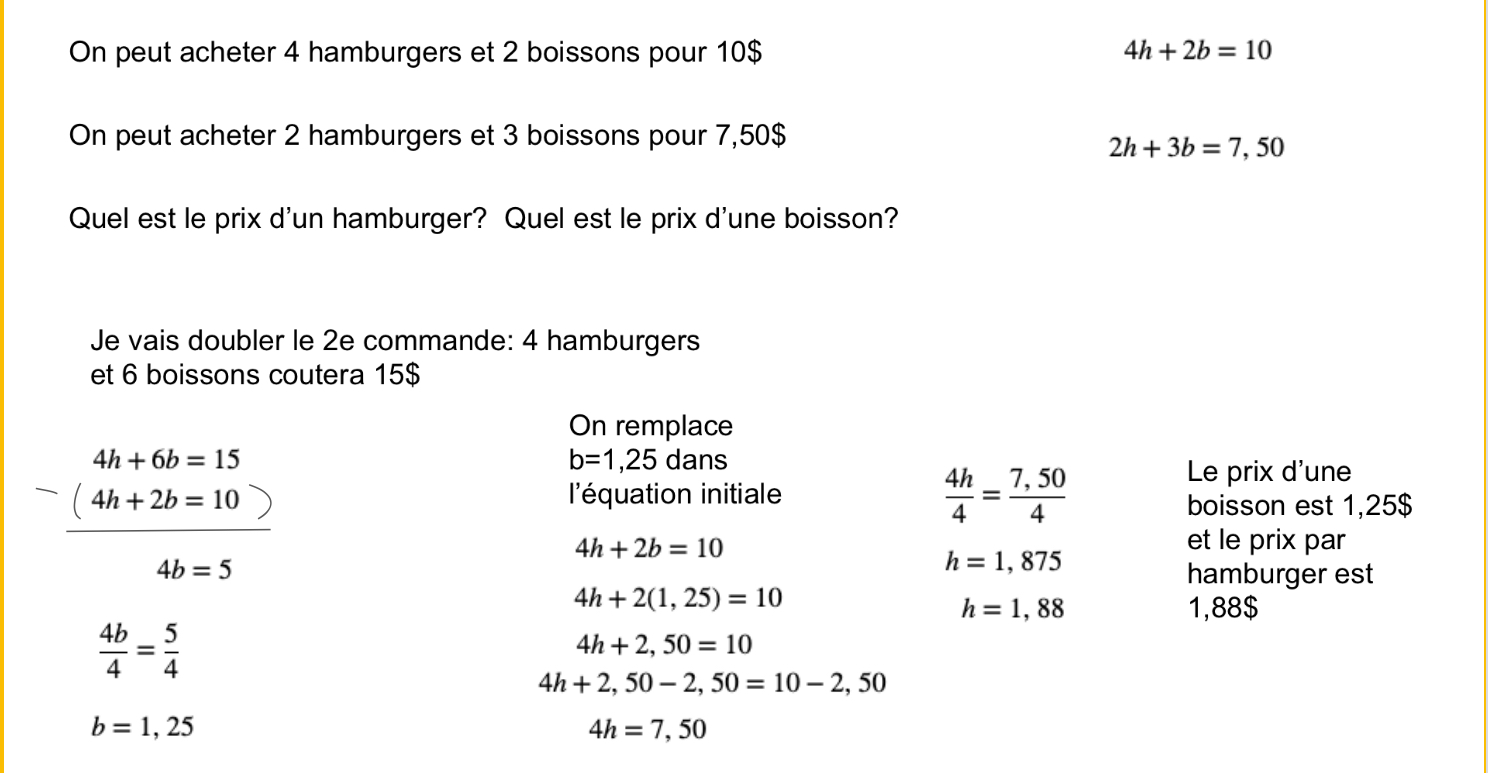
Here are the problems we worked through. We could use substitution to solve these, but since we have equations with coefficients for each variable it is an easier process to use elimination.