Friday Photos
I was in several classes on Friday and took some photos of the neat tasks and activities that were going on.
One class was working on adding and subtracting positive and negative numbers, with an emphasis on zero pairs.

They also had a neat quiz, based on the max/min dice game

To start the quiz a dice is rolled 4 times, and students place the 4 numbers into the boxes, then evaluate each expression.
Another class was doing this slow reveal data talk. A series of images are shown, and students notice and wonder more and more as more information is revealed.

Another was consolidating the R2D2 3 act task, looking at 2 different ways to solve the task, by a ratio of areas, or by converting the dimension in inches into a dimension in “post it notes”. Consolidation ideas included making sure the number sentences were all written in a way for others to follow clearly.

Finally, in my class we were working on order of operations. We were working on the 4 4s task where we use four 4s to create a math expression that equals 0,1,2,3,4,5,6,7,8,9,10.
e.g. 4+4-4-4=0

It was impressive to see the different approaches. We practiced using brackets, and exponents, and found out that since square and square root are opposite operations, they have the same level in BEDMAS. Groups looked to other groups for inspiration, and students were working hard to check and double check their work.
It’s been a fun week in the math department!
Dot Talks
Today several classes were working on dot talks as a way to encourage students to express themselves and explain how they perceive different patterns of dots.
An image is projected for several seconds, and students are asked how many dots there were on the screen. Students then take turns explaining how they know how many dots there are.

As they explain, the teacher groups the dots and shows the different ways that the students suggest. It’s always impressive to see how many different ways we can see things to get to an answer. It’s a great activity to encourage participation, and to celebrate different approaches and viewpoints.
some sources of dot talks are: numbertalkimages, and youcubed.
Working at the Walls
Today in grade 10 we did some review in groups of 3 at the walls. We worked on simplifying algebraic expressions, and solving equations including ones with fractions.
It was great to see the students working so well with each other and collaborating on day 2. Having lots of practice in grade 9 has been very helpful in building the expectations of collaboration and the ability for groups to ask for help within and amongst the groups. Our class has 32 students, so I am not able to be the sole source of information, nor the sole checker of “is it right?”. I was impressed by the different strategies students used to solve equations with fractions, and how they communicated their work.
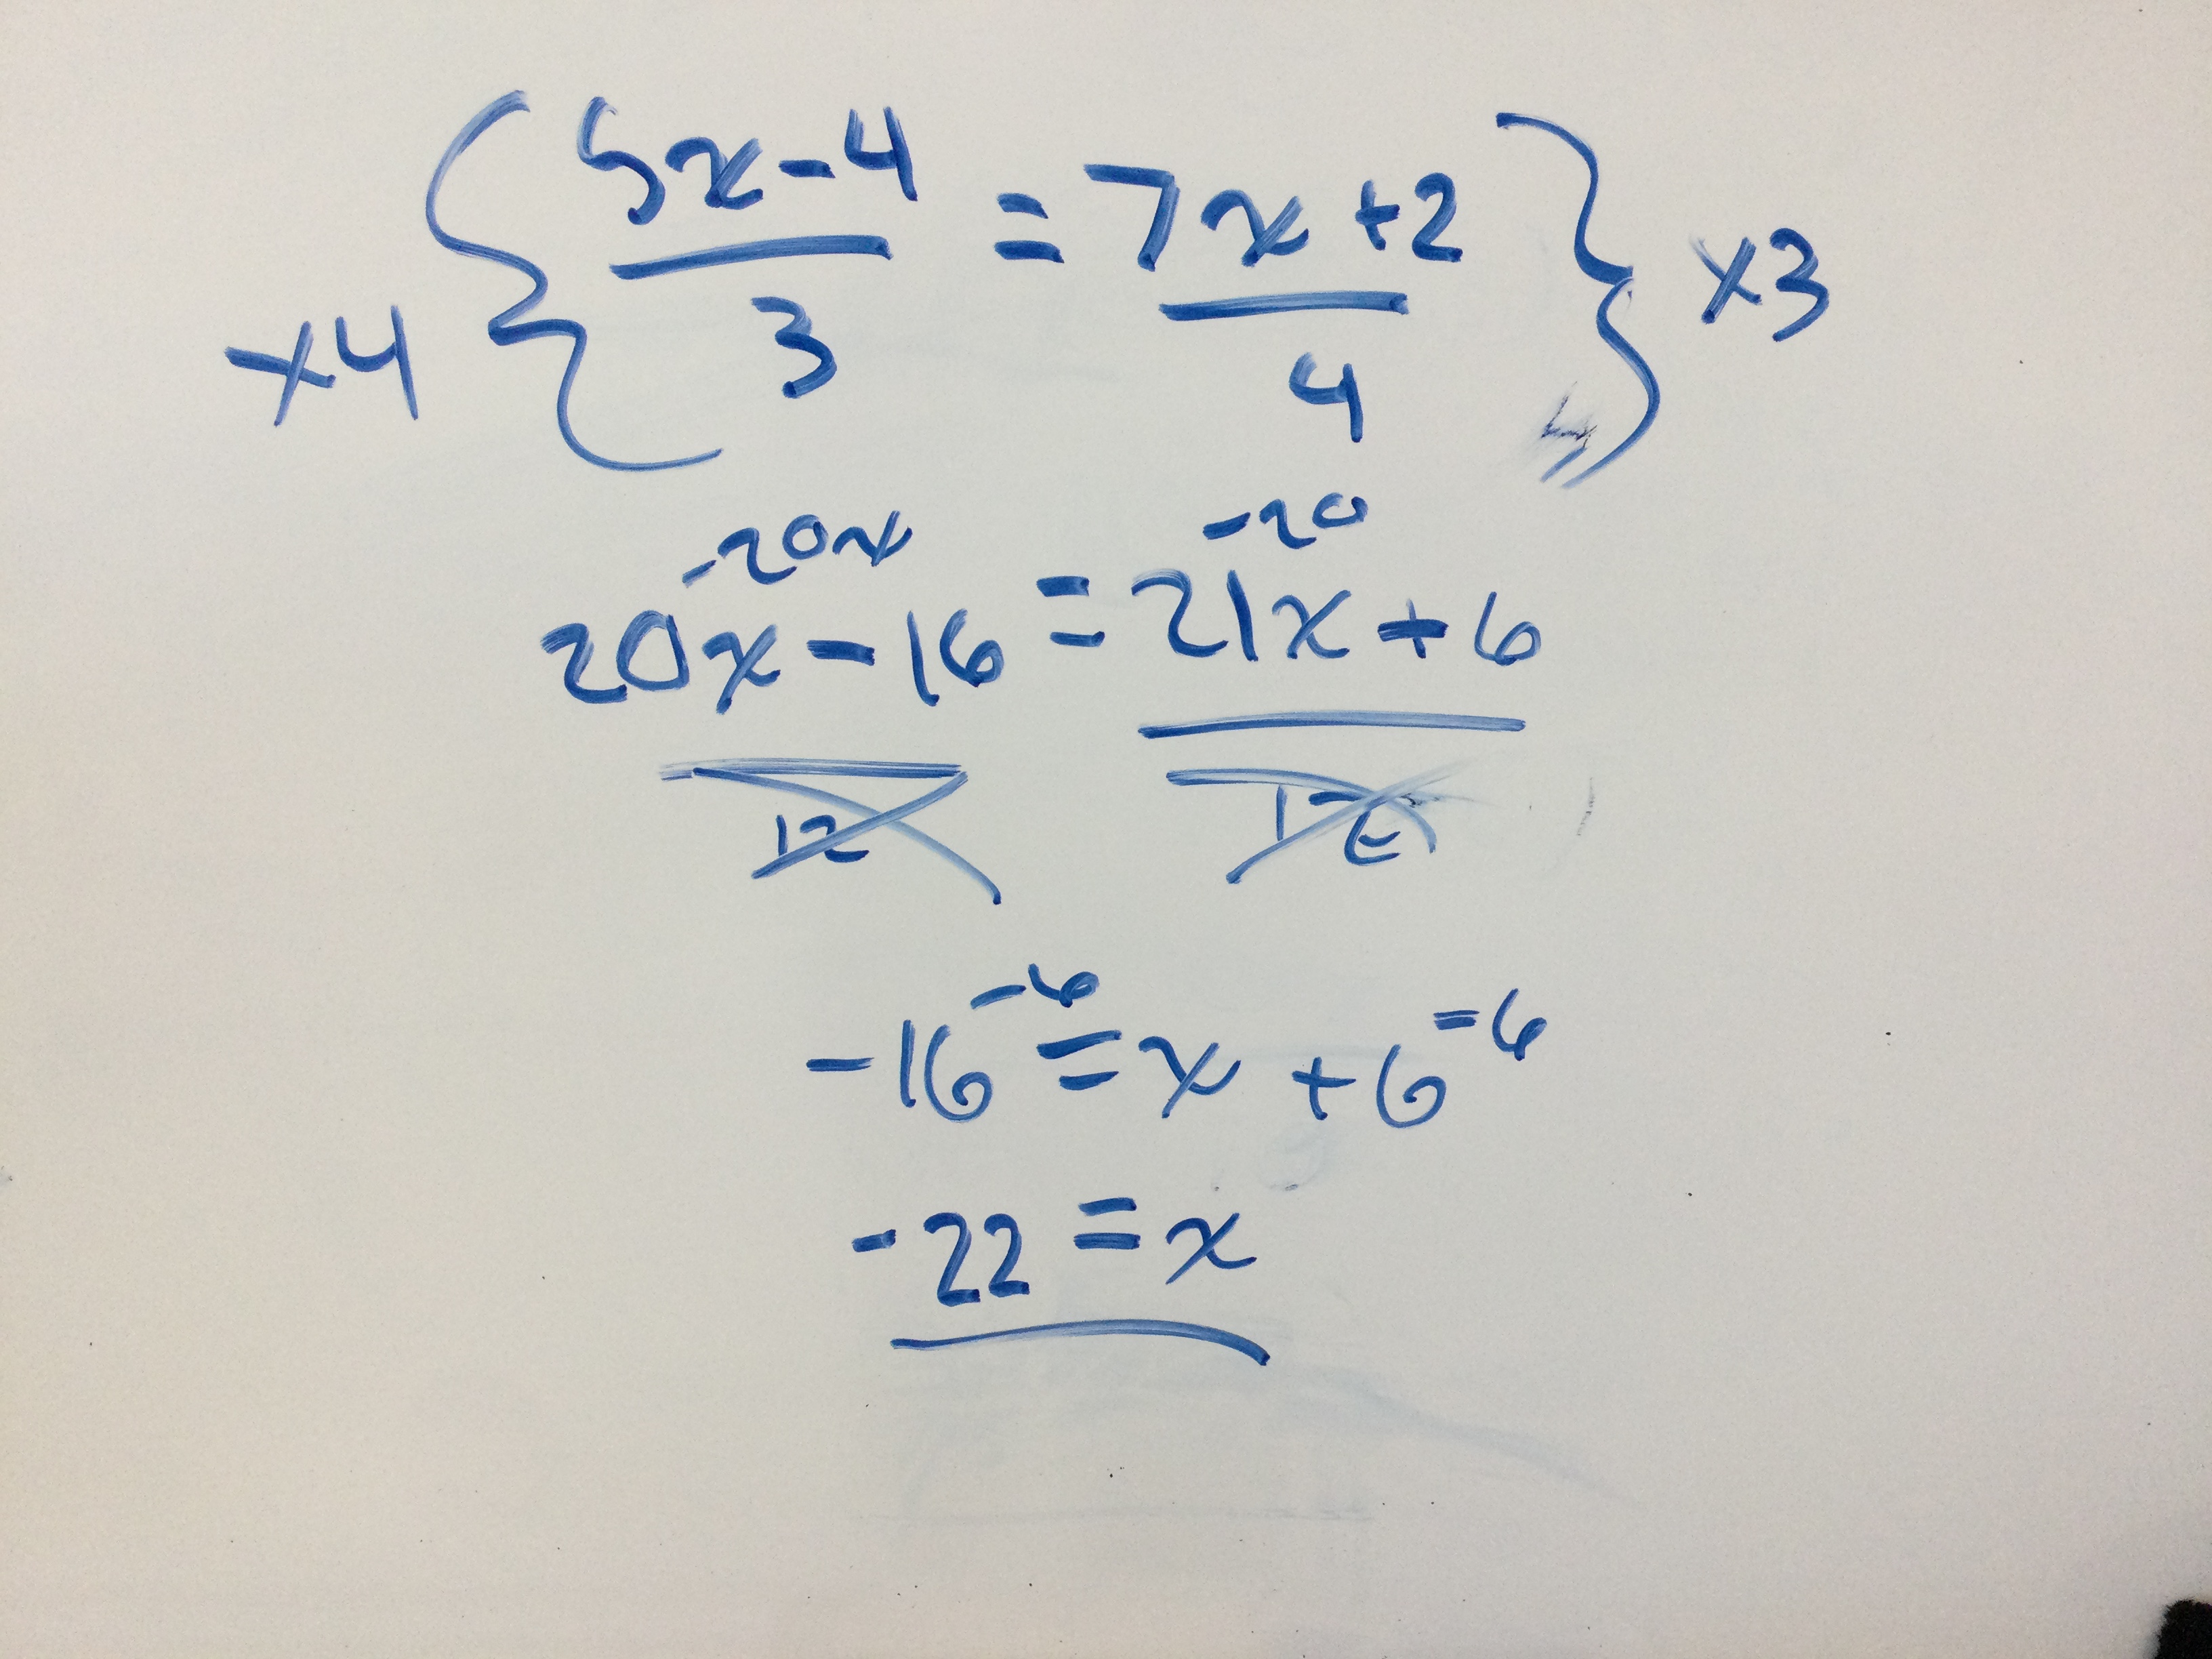


We have some work to do with fractions and integers coming up tomorrow, which will hopefully work to increase accuracy of solutions. Many groups worked through questions a few times, finding out where they made errors, and checked their work with each other. I was so lost in the moment with them that I didn’t take any action shots, just photos at the end of class while I cleaned up the room. It was an impressive whirlwind of activity last period, working right to the bell!
Teamwork in Grade 9
Today Grade 9s tried the 1-100 task, where they circle numbers in order.
The first time through, as individuals, and we timed it…it took about 8-11 minutes. I took photos as they worked to debrief the class later.

Next, working in groups of 4 (each student has a different colour marker).

If students follow the rules, and take turns circling numbers one at a time in order, they will see some neat patterns emerge. On the left, the rules were followed. On the right is what you see if there’s a group of more/less than 4, or students aren’t taking turns.
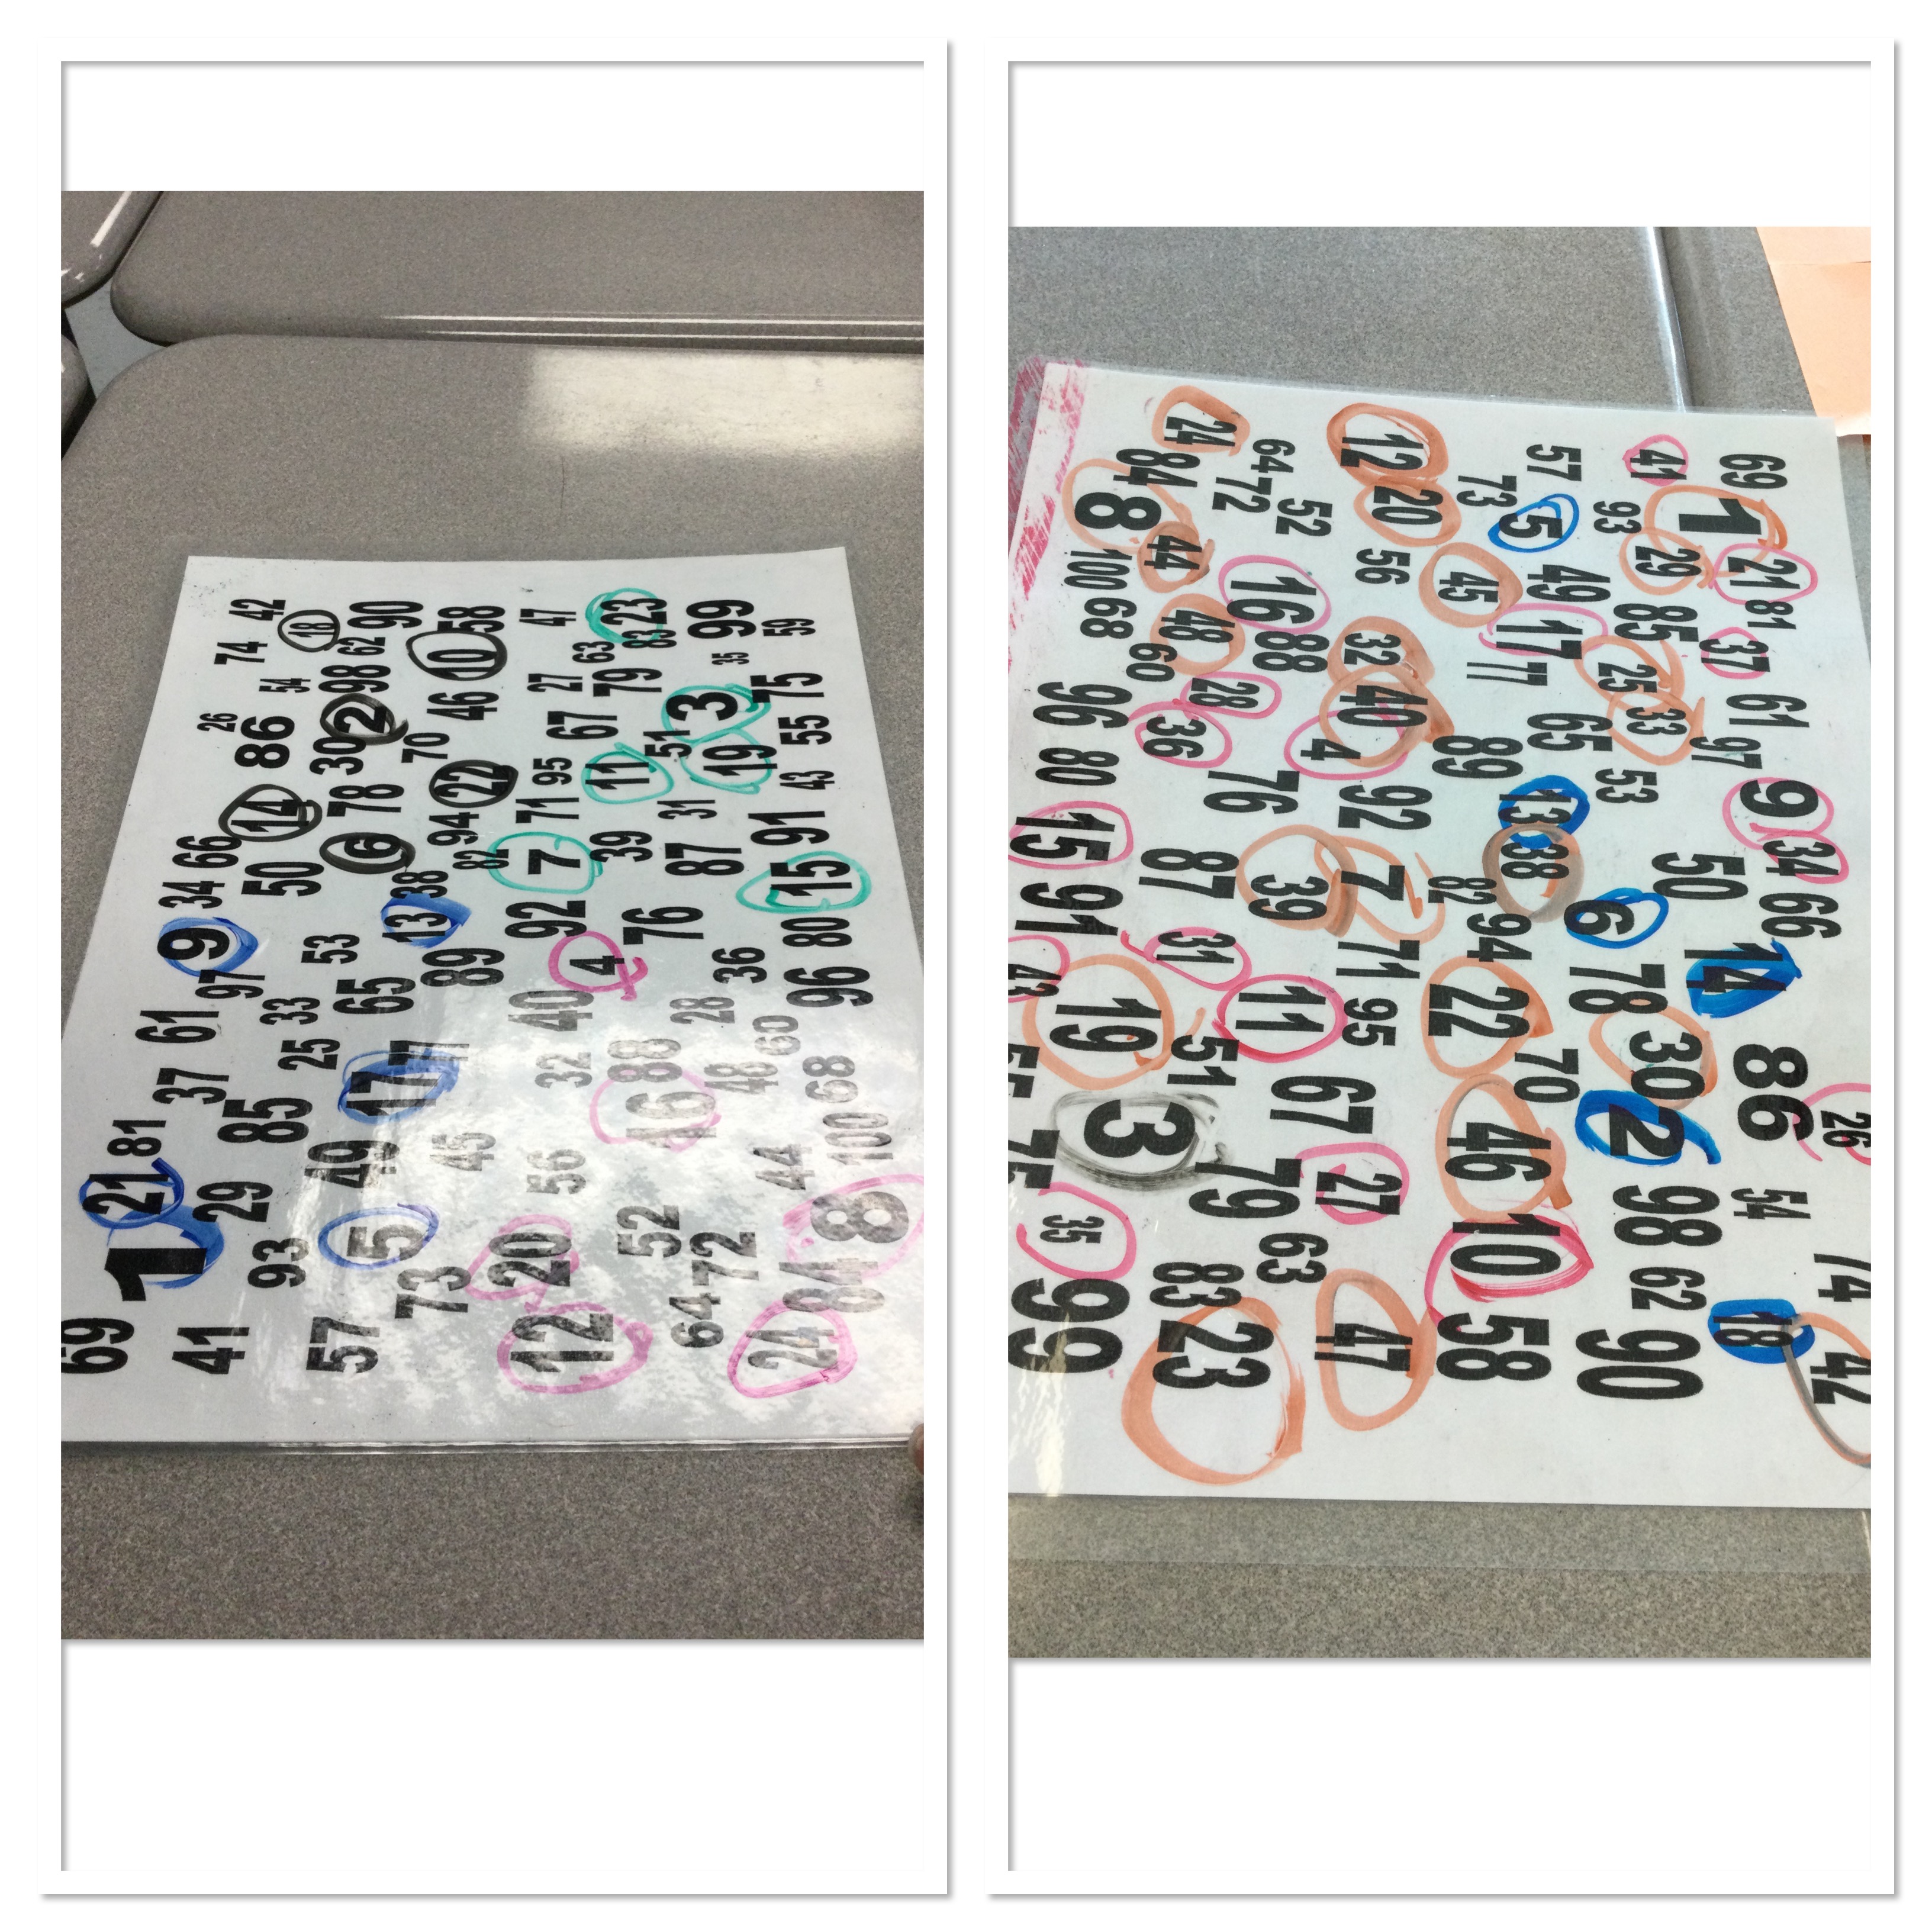
this round took 4-6 minutes. It emphasizes that when we work together we can accomplish things quicker, and help each other. Many students naturally started looking ahead for their number, or pointed out numbers for peers, or were counting out loud to help themselves keep track.
For the final round groups strategized, and moved themselves, or furniture, and made a plan before attempting the task again.

This group decided to work around the desk so everyone saw the numbers right side up. They drew a grid to help narrow down their search areas, they spoke out loud, and helped each other find the numbers. This round took under 2 minutes for some groups.
At the end of the lesson I showed the pictures I took, and we discussed the ways that they worked well as a team.
The final stage of the task was to brainstorm in groups what good teamwork looks like, sounds like, and feels like. These ideas will be combined to make a list of group norms for teamwork.

At the end of this task we had some time left, so we did an intro sheet which starts with graphing their math life. This was inspired by a workshop by Liesl McConchie (@lieslmcconchie on Twitter).

Students think back to how they felt about math over the years, and represent that on the graph. While they worked I circulated, and had some discussions with students about the peaks and valleys on their graphs and learned a lot about them, and how they view their journey through math class.
Productive Struggle on Day 1
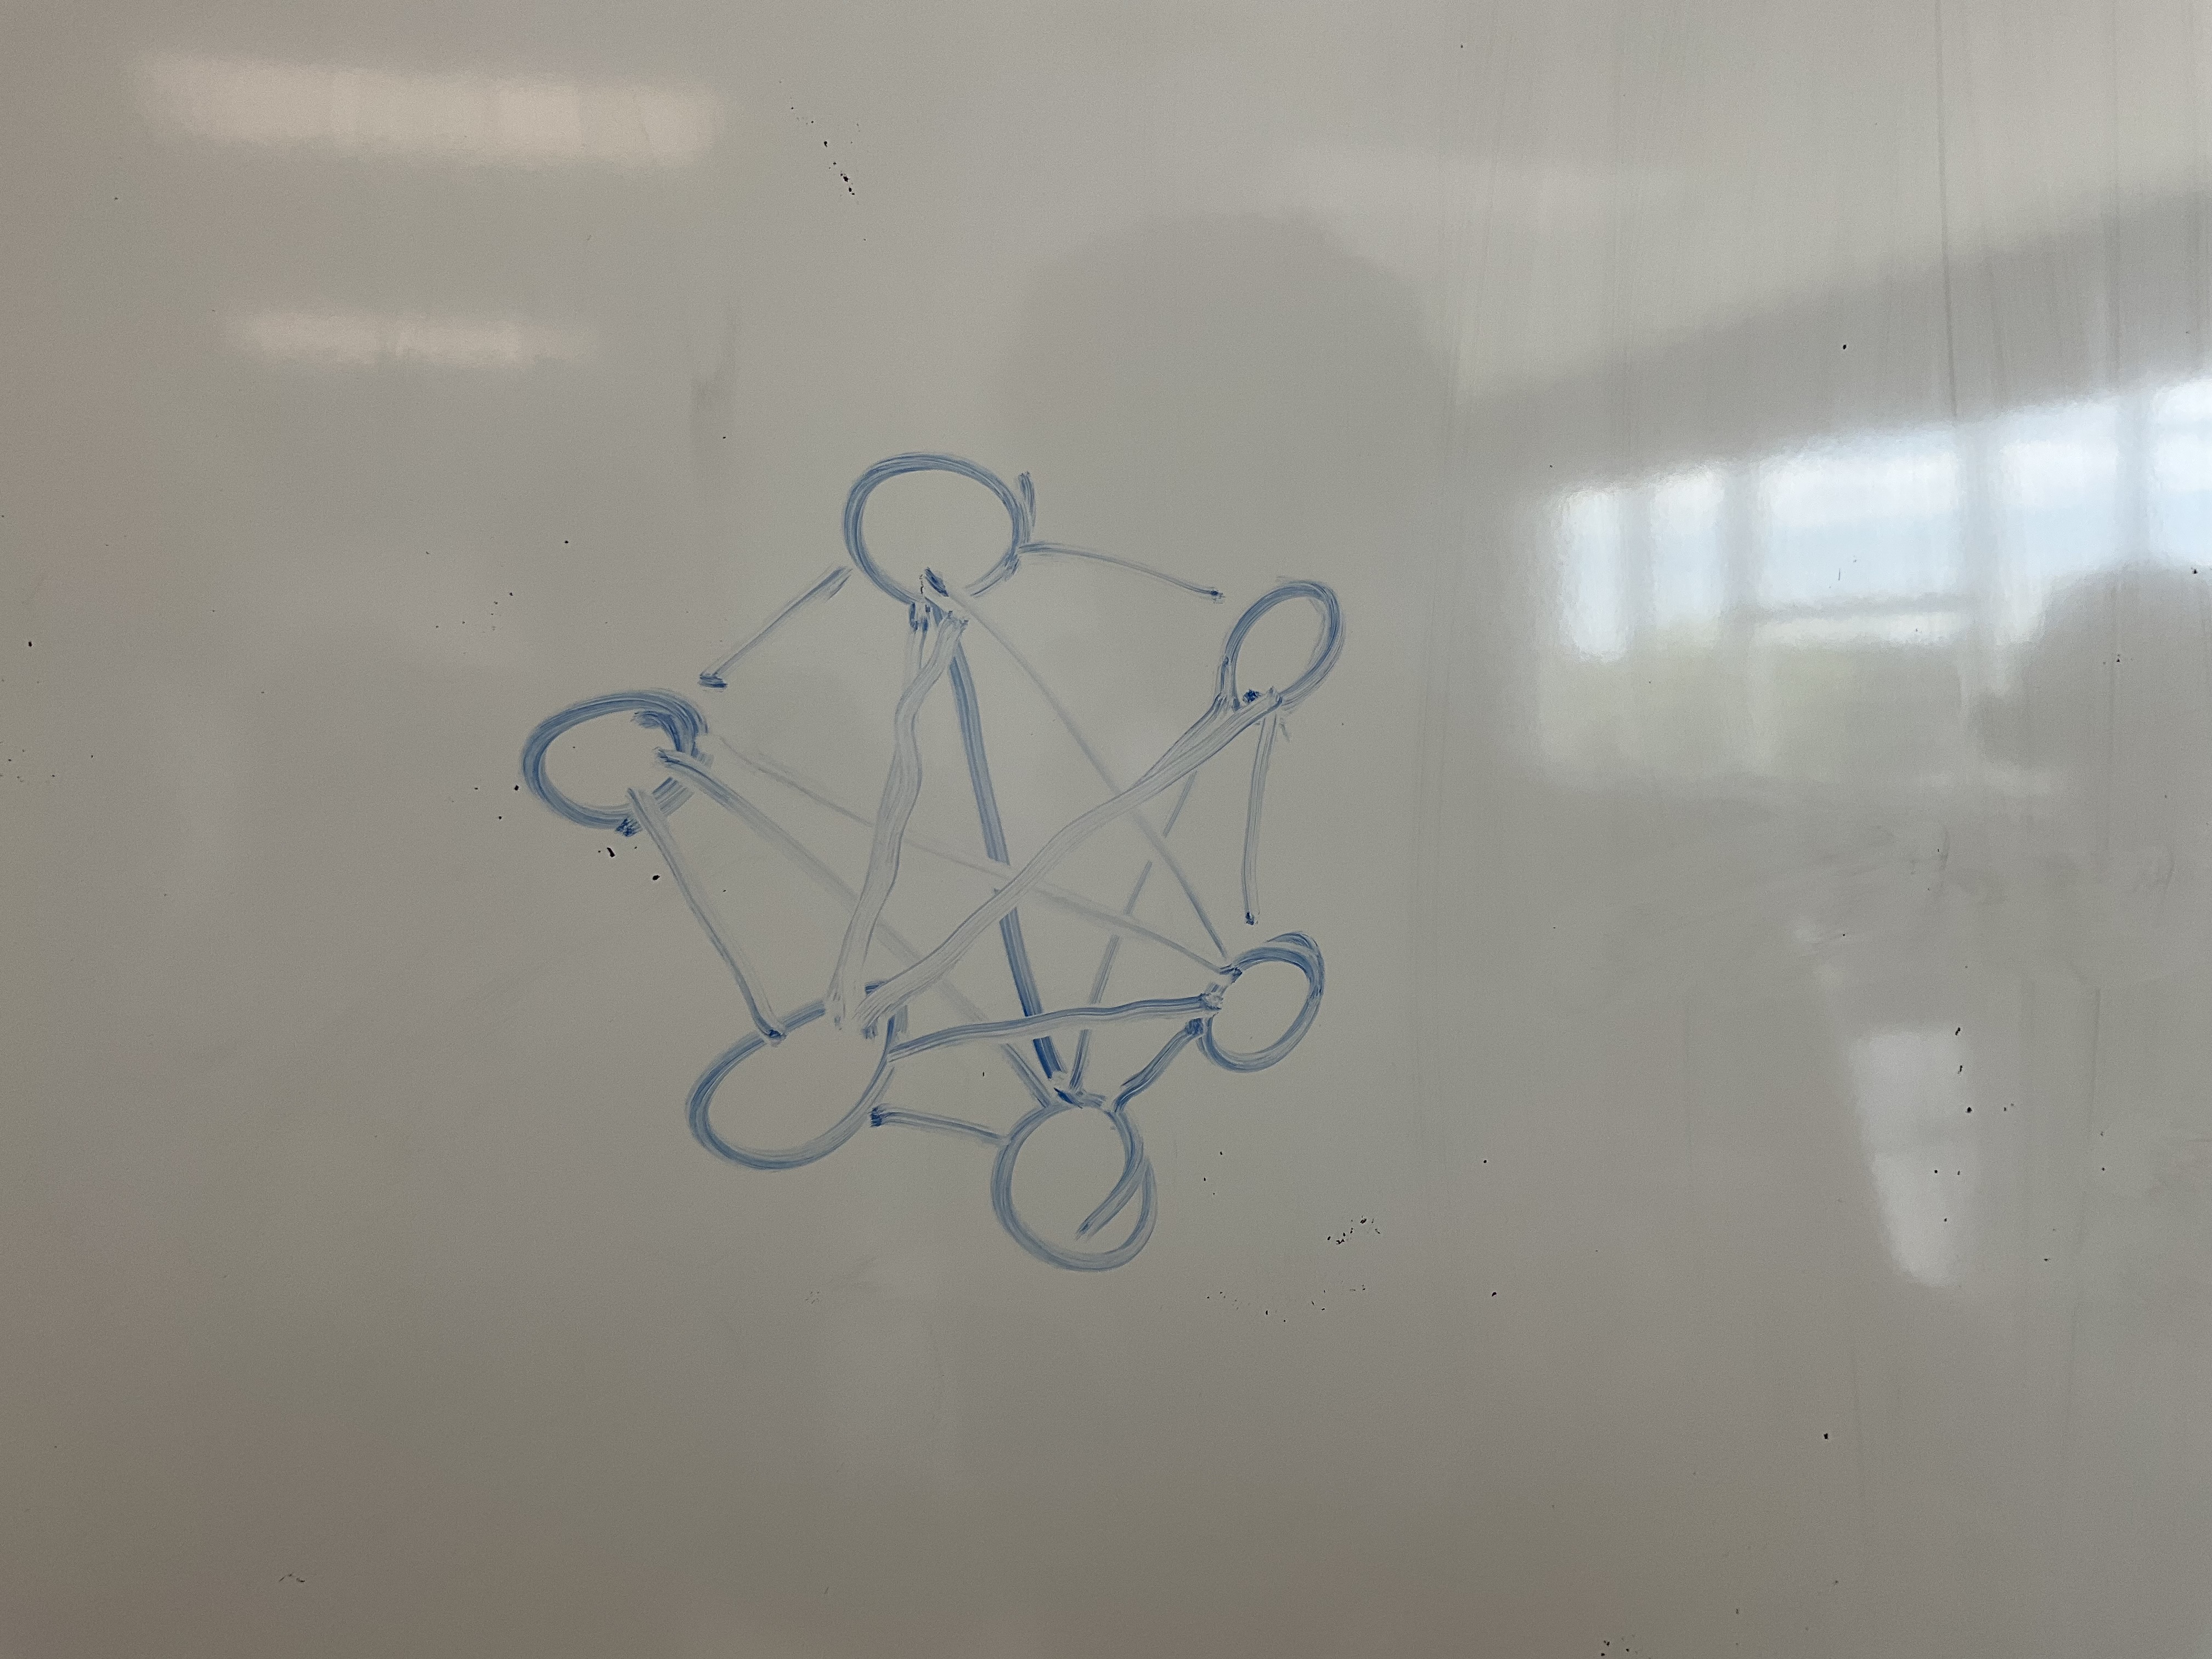
This year I am supporting staff and students in the math department as a coach/facilitator. Today I was helping in grade 10 applied math, and brought a non-curricular activity to challenge everyone on day 1. It is based on this activity(spoilers if you scroll to the end of the linked page).
The goal was to use a half piece of paper to recreate this shape. Students couldn’t touch the pink page, but could come up and examine it. Some brought rulers and took detailed notes.
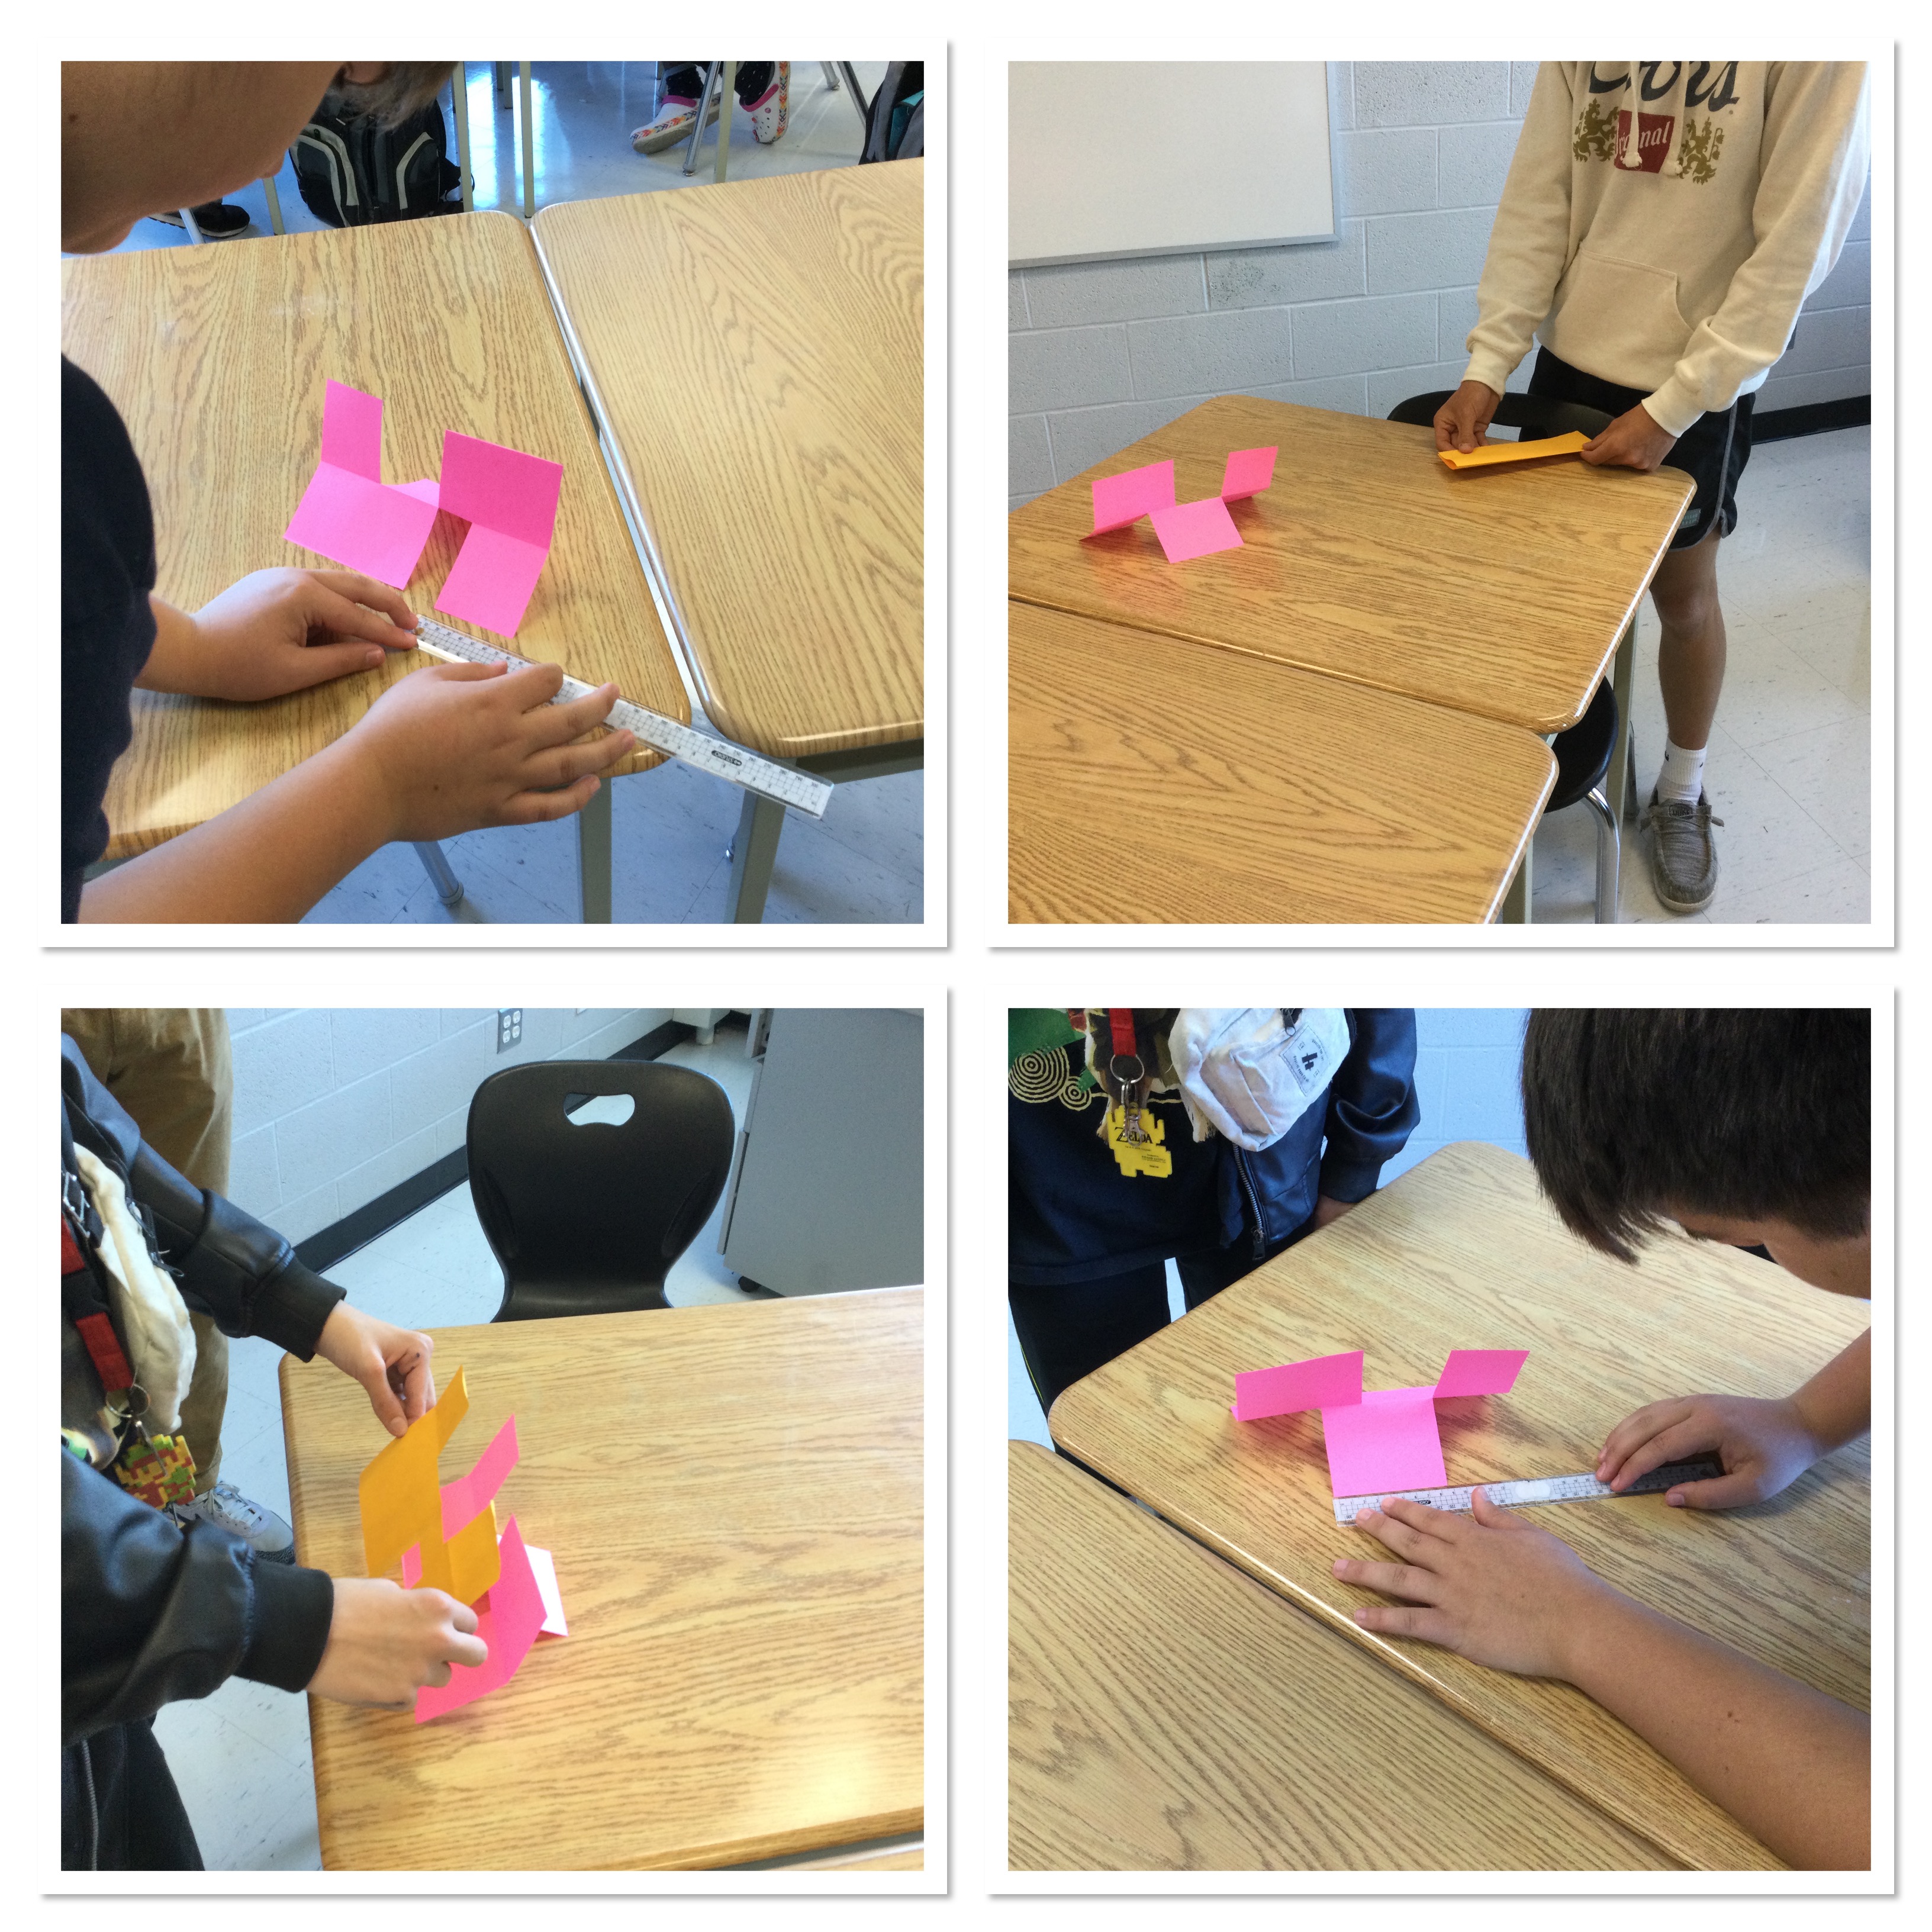
In groups students worked to recreate the shape. It is not an easy task, so they needed to try a few different approaches. It was neat to see how different groups approached the same task.

While they worked, I documented some of their commentary. There was evidence of frustration, and exasperation, and also evidence of some students perseverance.

We talked about how we will experience struggle in math class, and in life, and how we can lean in to the struggle, and enjoy the challenge and work together to solve problems in groups, and helping each other.
The class didn’t solve the challenge yet, but some will likely keep working at home. We did have a successful vice principal who visited, and managed to solve the challenge!

We’ll keep working on leaning in to the productive struggle this term.
Welcome back Grade 10s!
Grade 10s worked on visual patterns today. Many of them did this kind of task with me in grade 9 last year, so we were remembering what we knew, and making connections to quadratic patterning which is new this year.

Students worked on remembering their modelling skills from last year. We had so many representations!

we worked on going directly to an equation from the pattern, since the table of values told us it was not linear, we needed a new approach.
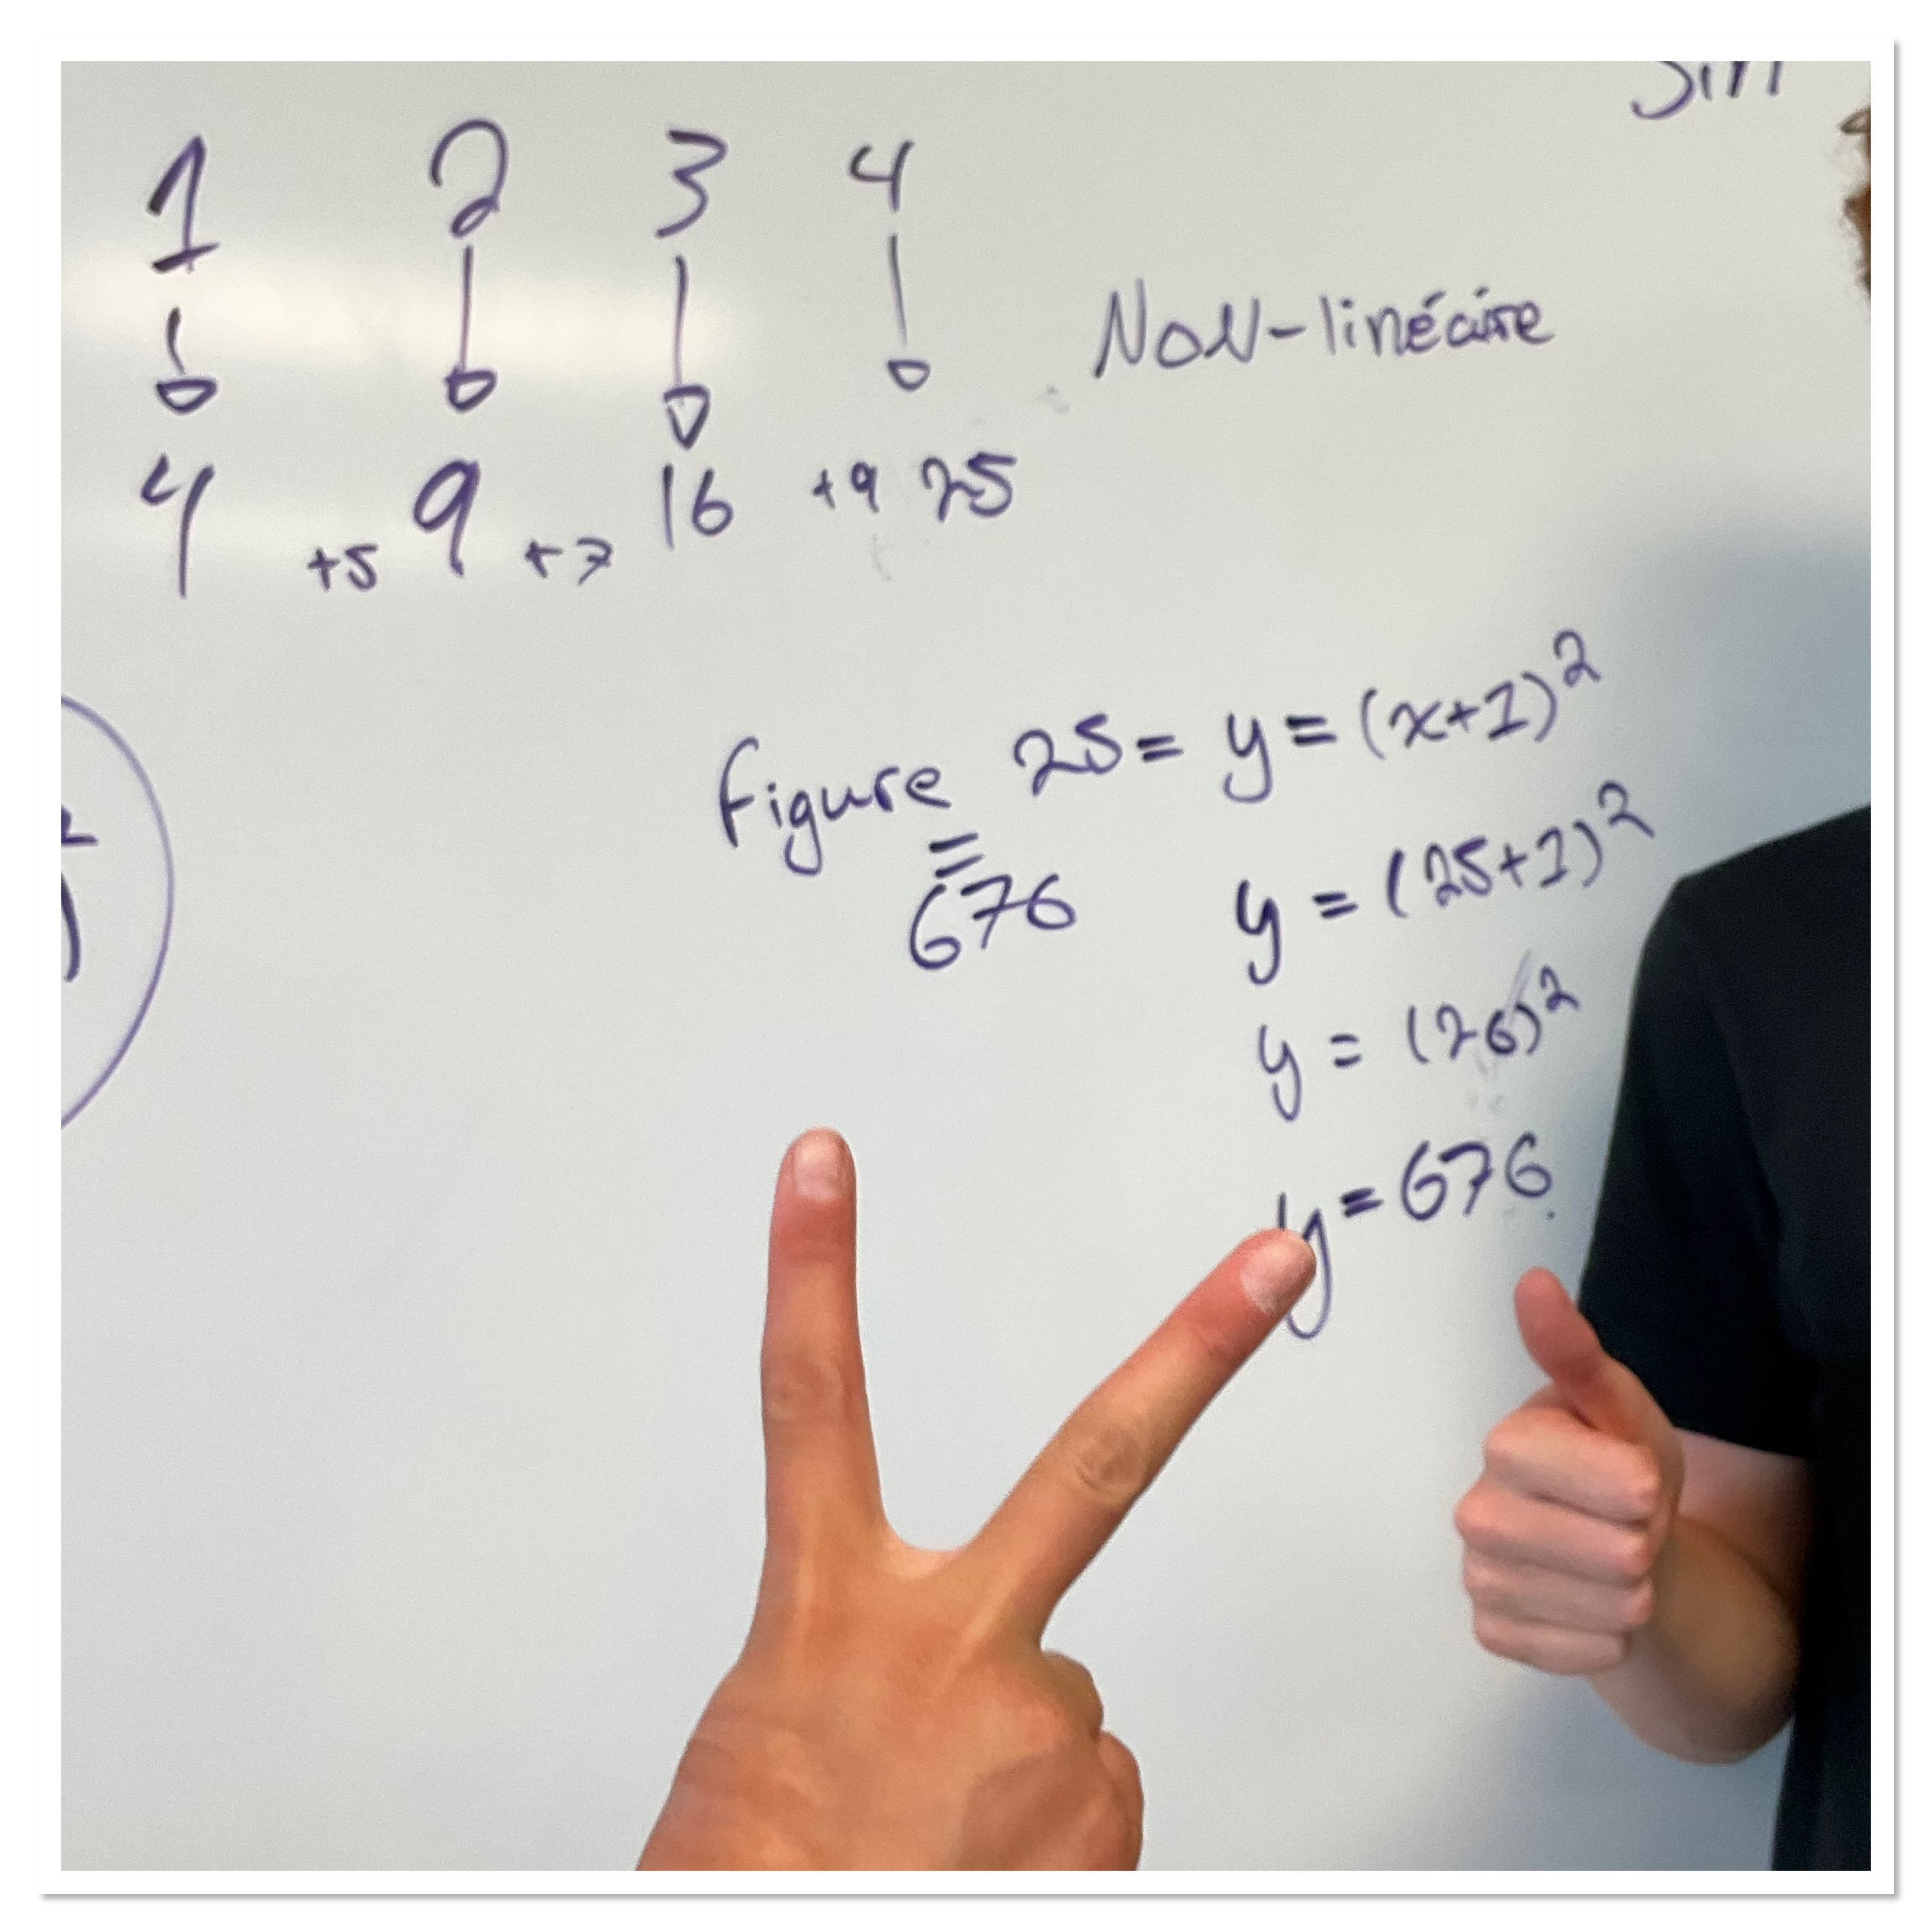
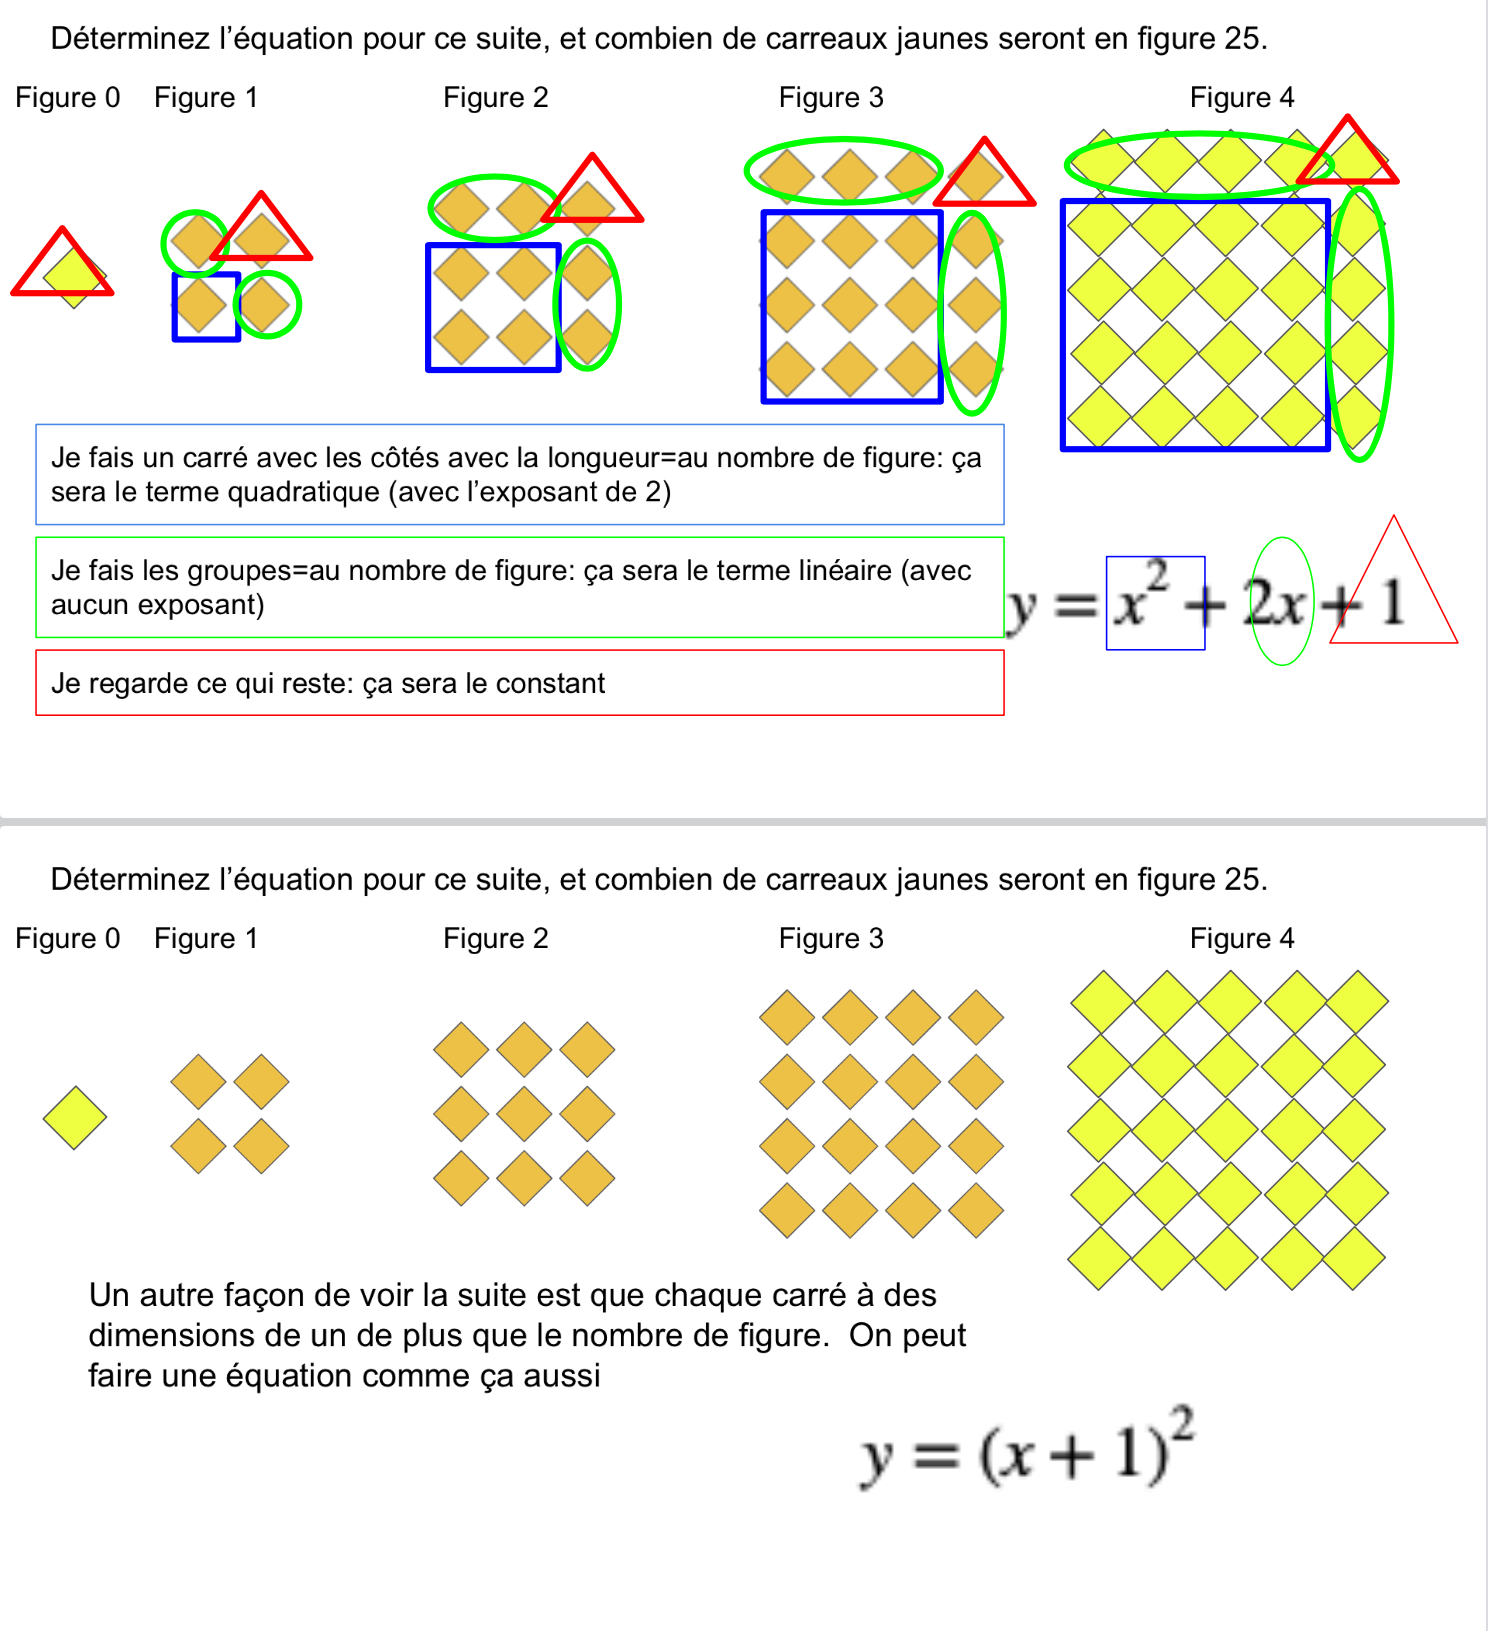
We did quite a few examples to practice our new skills
our final task of the day was to tackle this question, to find out for which figure number the perimeters are the same.

We had lots of students making tables and comparing, but then we used our new tools (magnetic graphing grids) to draw on the whiteboards with more precision.
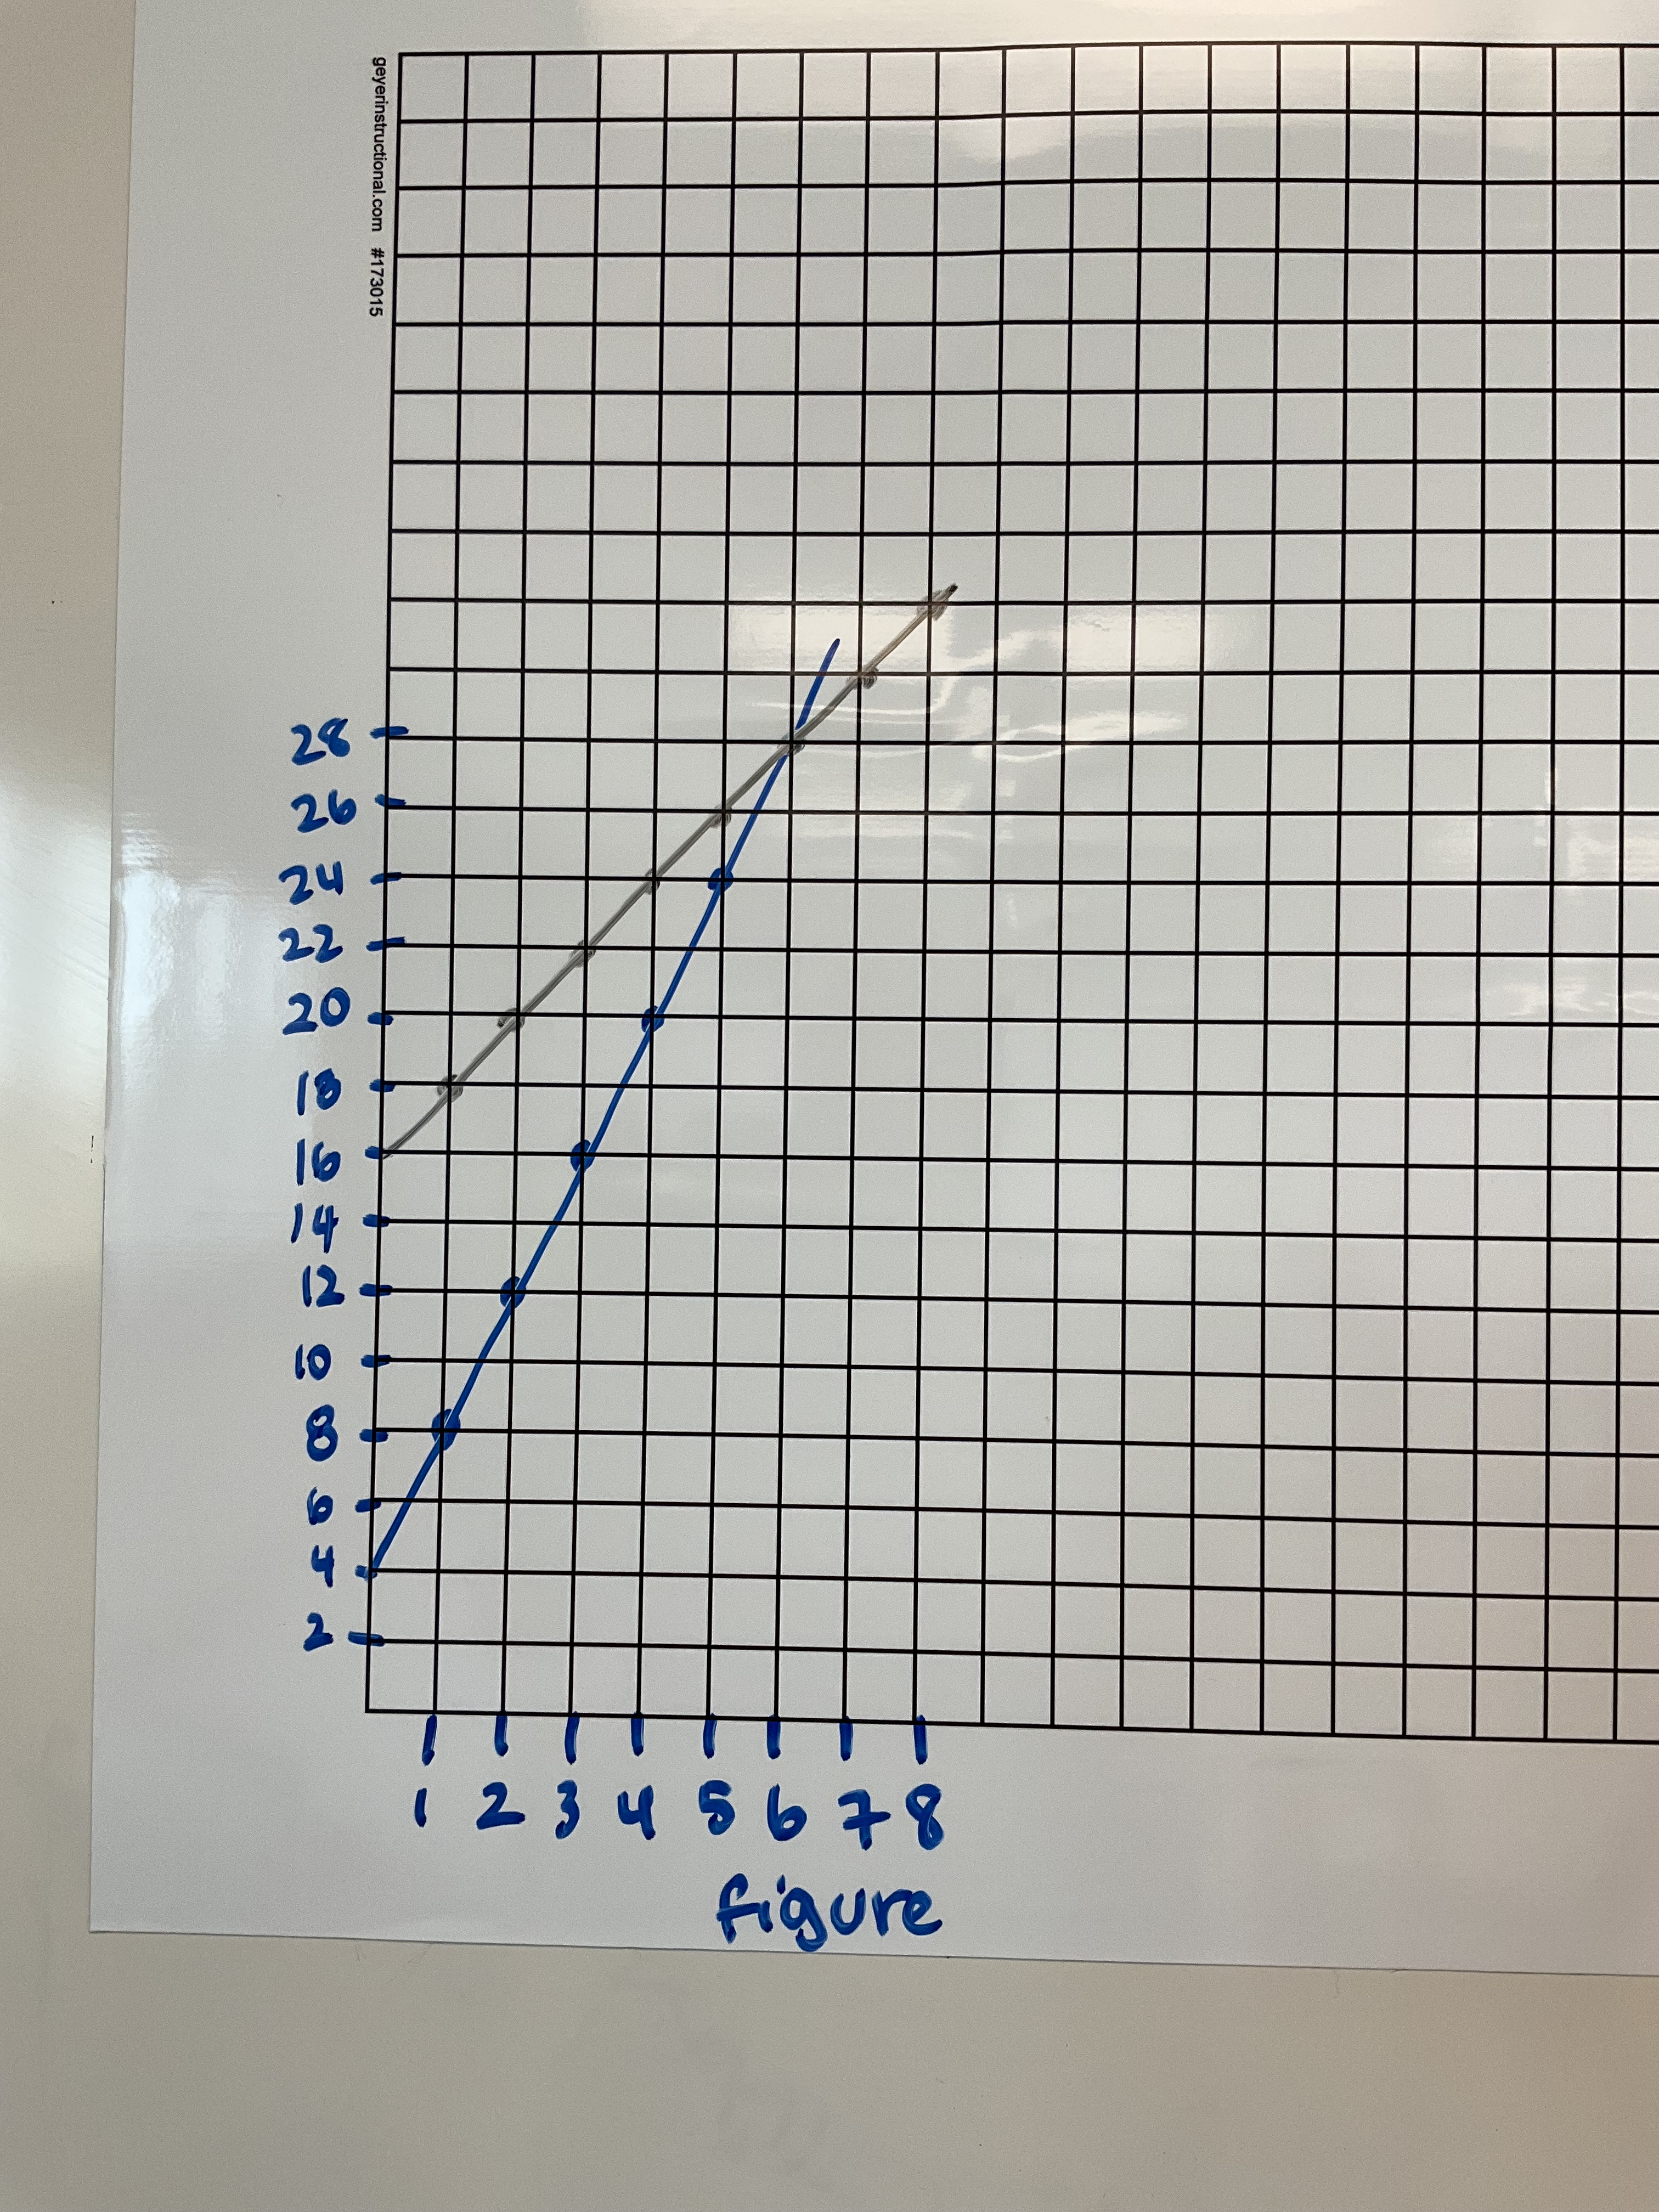
this is a nice introduction to solving systems graphically, which we will be doing a lot over the next few weeks.
We’ve got a lot of enthusiasm and energy on day 1 which bodes well for the future.
Welcome Back Grade 9s!

Today in Grade 9 we started off with some collaborative problem solving with skyscraper games (available here). Some of our groups were brave and tried the 5×5 challenges.

On day 1 we practice what we value, teamwork, and productive struggle as we tackle a challenging problem. We worked on speaking in French, sharing our ideas, taking charge sometimes, but not taking over. This problem in particular is a good one for valuing different perspectives and viewpoints (literally).

When we had done enough of those challenges, we tried the Max-min dice challenge.
The way this works is a framework BEDMAS question is given, fill in the blank style.

Students, up at the boards in random groupings of 3 copy the framework provided. Next we decide as a class if we’re aiming for the maximum number or the minimum number. We then have volunteers roll a 10 sided dice and one by one the numbers are entered into the framework. Groups decide on where each number goes before the next is rolled.

Each group then uses their BEDMAS skills to evaluate their expression. An extension can be to ask if we actually made the max or min…or if there is a better way to arrange the numbers if you knew them at the start to make a bigger/smaller number.
That game was a win. We played 3 or 4 rounds, until the bell went!
High Fives in Grade 10
Today in grade 10 we determined how many unique high fives there were among the 26 people in our classroom.
Groups split up and got to work modelling the situation and trying to determine the answer, and how to communicate it.
some groups imagined a line of 26 people. The first person goes down the line high fiving everyone, then leaves. There are 25 high fives done at that point. The next person does 24 high fives, and the pattern continues, adding one fewer high five to the total each time.

other groups viewed the number of people in the group as the x value, and the number of high fives in the group as the y. They can determine how many high fives exist in a pair, and a group of 3 and 4 and 5 and put that in a table. They noticed that the first differences increase by 1 each time.

Both groups found parabolas, but different ones to model the same situation. We worked on making equations, and extending tables to find key points like x intercepts and the vertex.
some groups viewed the challenge a bit differently, making equations and testing them out.

Other groups were working visually, showing the connections between dots and the high fives that exist
By the end of class there were graphs and equations showing up and being worked on. Students then used their models to solve the question about the number of high fives in a class of 26, which quickly changed into “how many high fives are there in a school of 1000 people”. Models got changed, and adapted, and students could see the power of using an equation rather than continuing a table for 1000 rows.

I showed a neat solution that students presented last year which turns the entire situation into a visual pattern. They modelled the blue triangle as the number of high fives. The blue triangle is half of the rectangle. The rectangle has dimensions (x)(x-1), so we need y=0.5(x)(x-1) as our equation.
As a wrap up we went back to some questions we’d worked on in the first week of class, that were quite challenging in February.
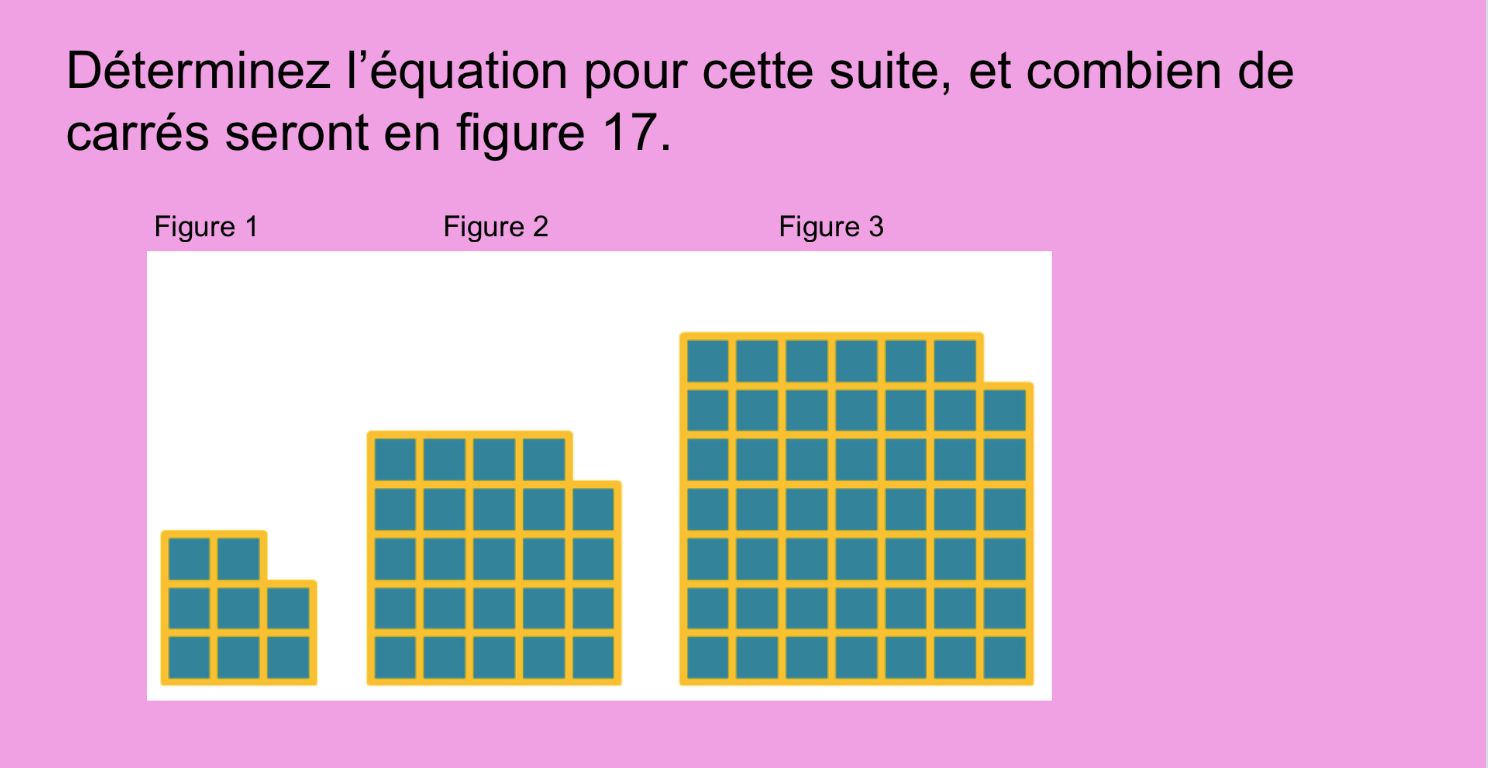
What was lovely to see is that students immediately dived into the problem, drawing and modelling, and finding equations. Where they had been hesitant in February, they are much more confident now, and helped their peers when they got stuck.


Once the equation was modelled and the number of squares in figure 17 determined, the extension questions were to graph it, or find the x intercepts, or complete the square or determine the vertex. This one pattern kept us going right until the bell on a Friday afternoon in June.
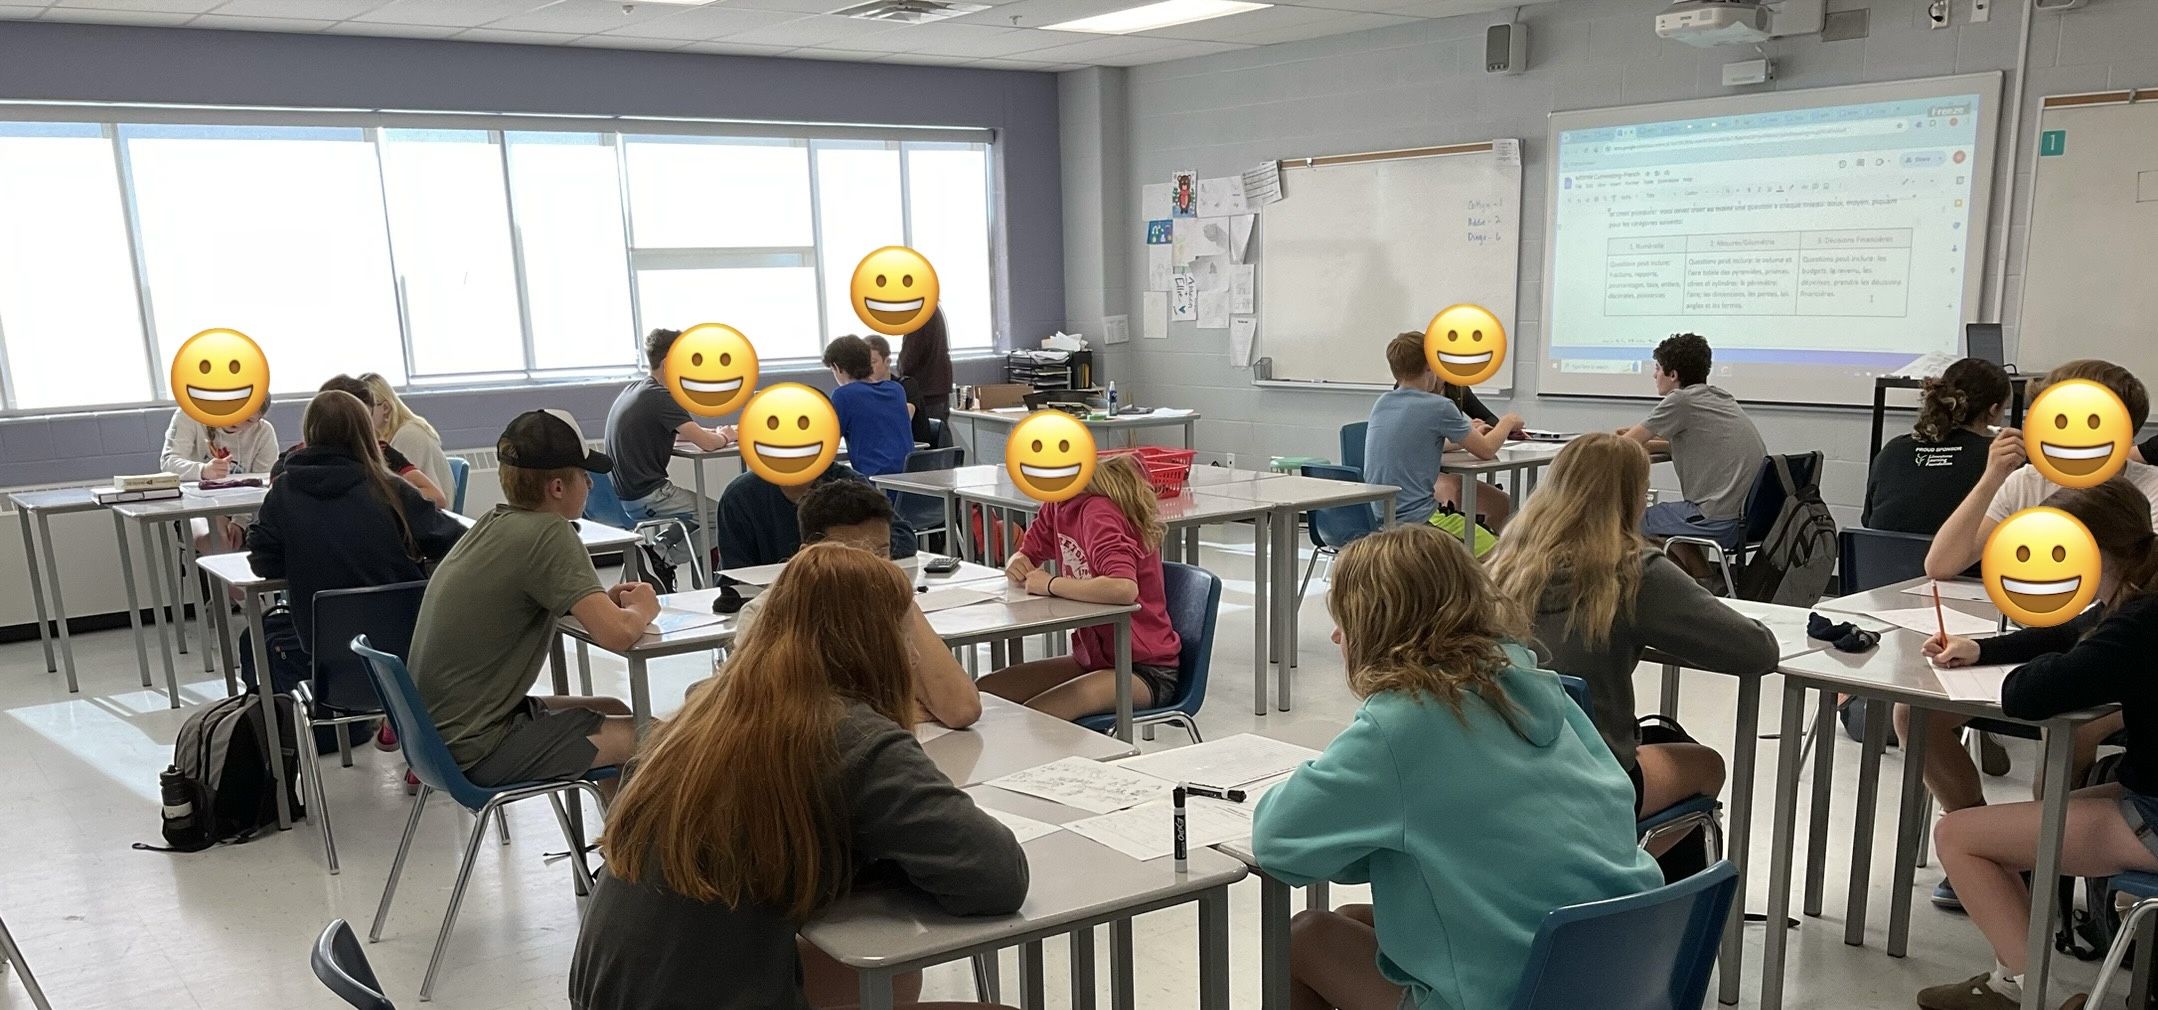
Culminating Task Day 1
Grade 9s worked in small groups today to create questions that were mild/medium/spicy based on an image of our school BBQ. They needed a question about numeracy, and one about geometry and measurement, and one about financial math.
Groups collaborated well and discussed what kinda of questions they’d be able to answer, and then created questions for each level. They next had to request which will be provided on Monday, so they can use that information and complete their calculations.

We have been working in groups all semester, and we’ve been noticing and wondering with our 3 act tasks, and our slow reveal graphs. This culminating task values the collaborative nature of our experience this term, and allows students to take ownership of their learning.

By the end of the class each group had their questions prepared and submitted, and everyone knows exactly what to expect for Monday, so hopefully there will be less anxiety surrounding this culminating compared to a math test.

Grade 9 Culminating Practice
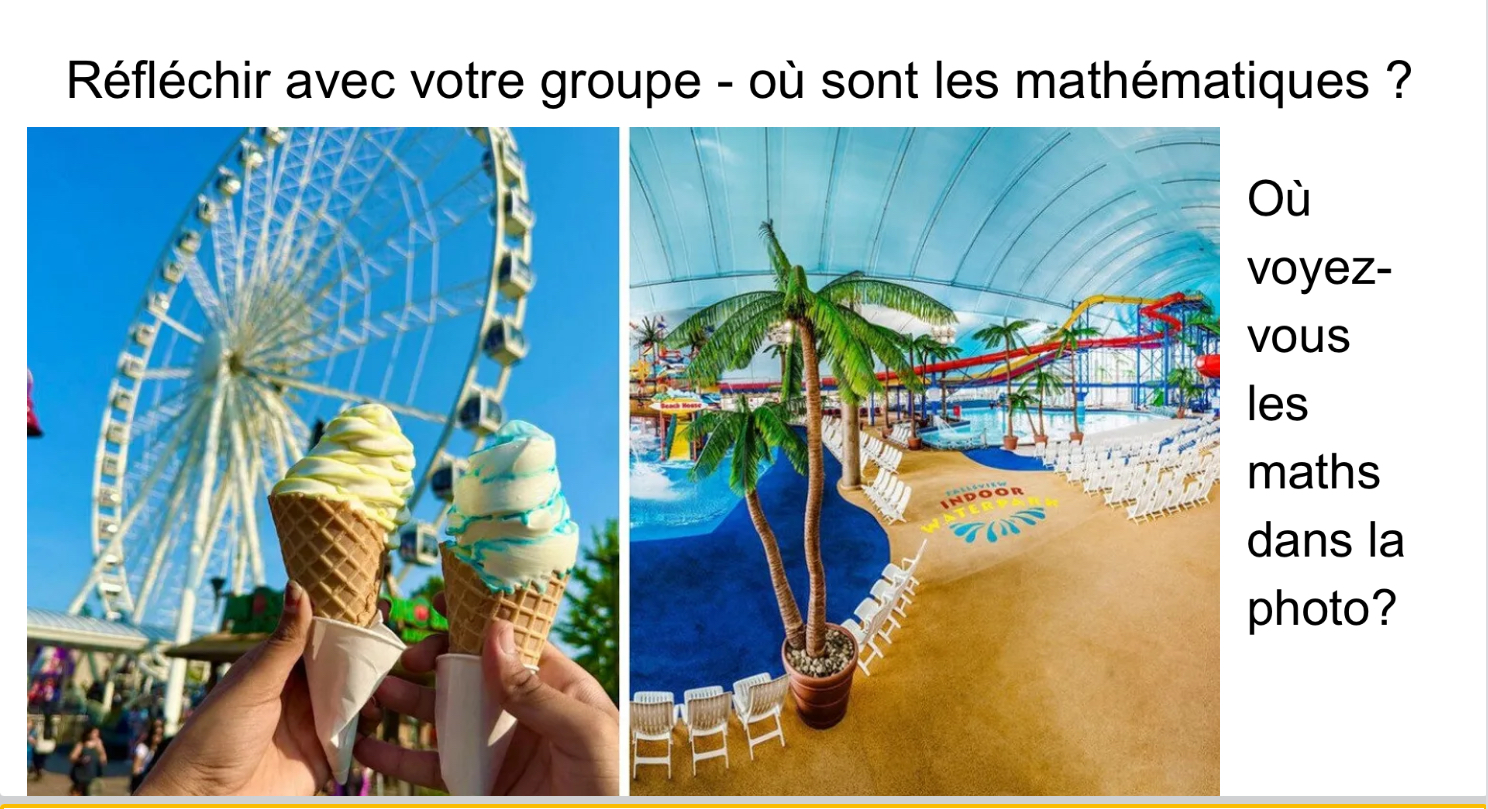
Grade 9s have a culminating task soon. They will be given a picture and they will need to create questions to answer related to measurement&geometry, number sense, and also financial decision making.
We have been practicing lately, and we made questions to solve using these images as inspiration.
Today we took some of the questions and then sorted them into mild, medium and spicy based on the calculations involved, the number of steps, and the complexity.
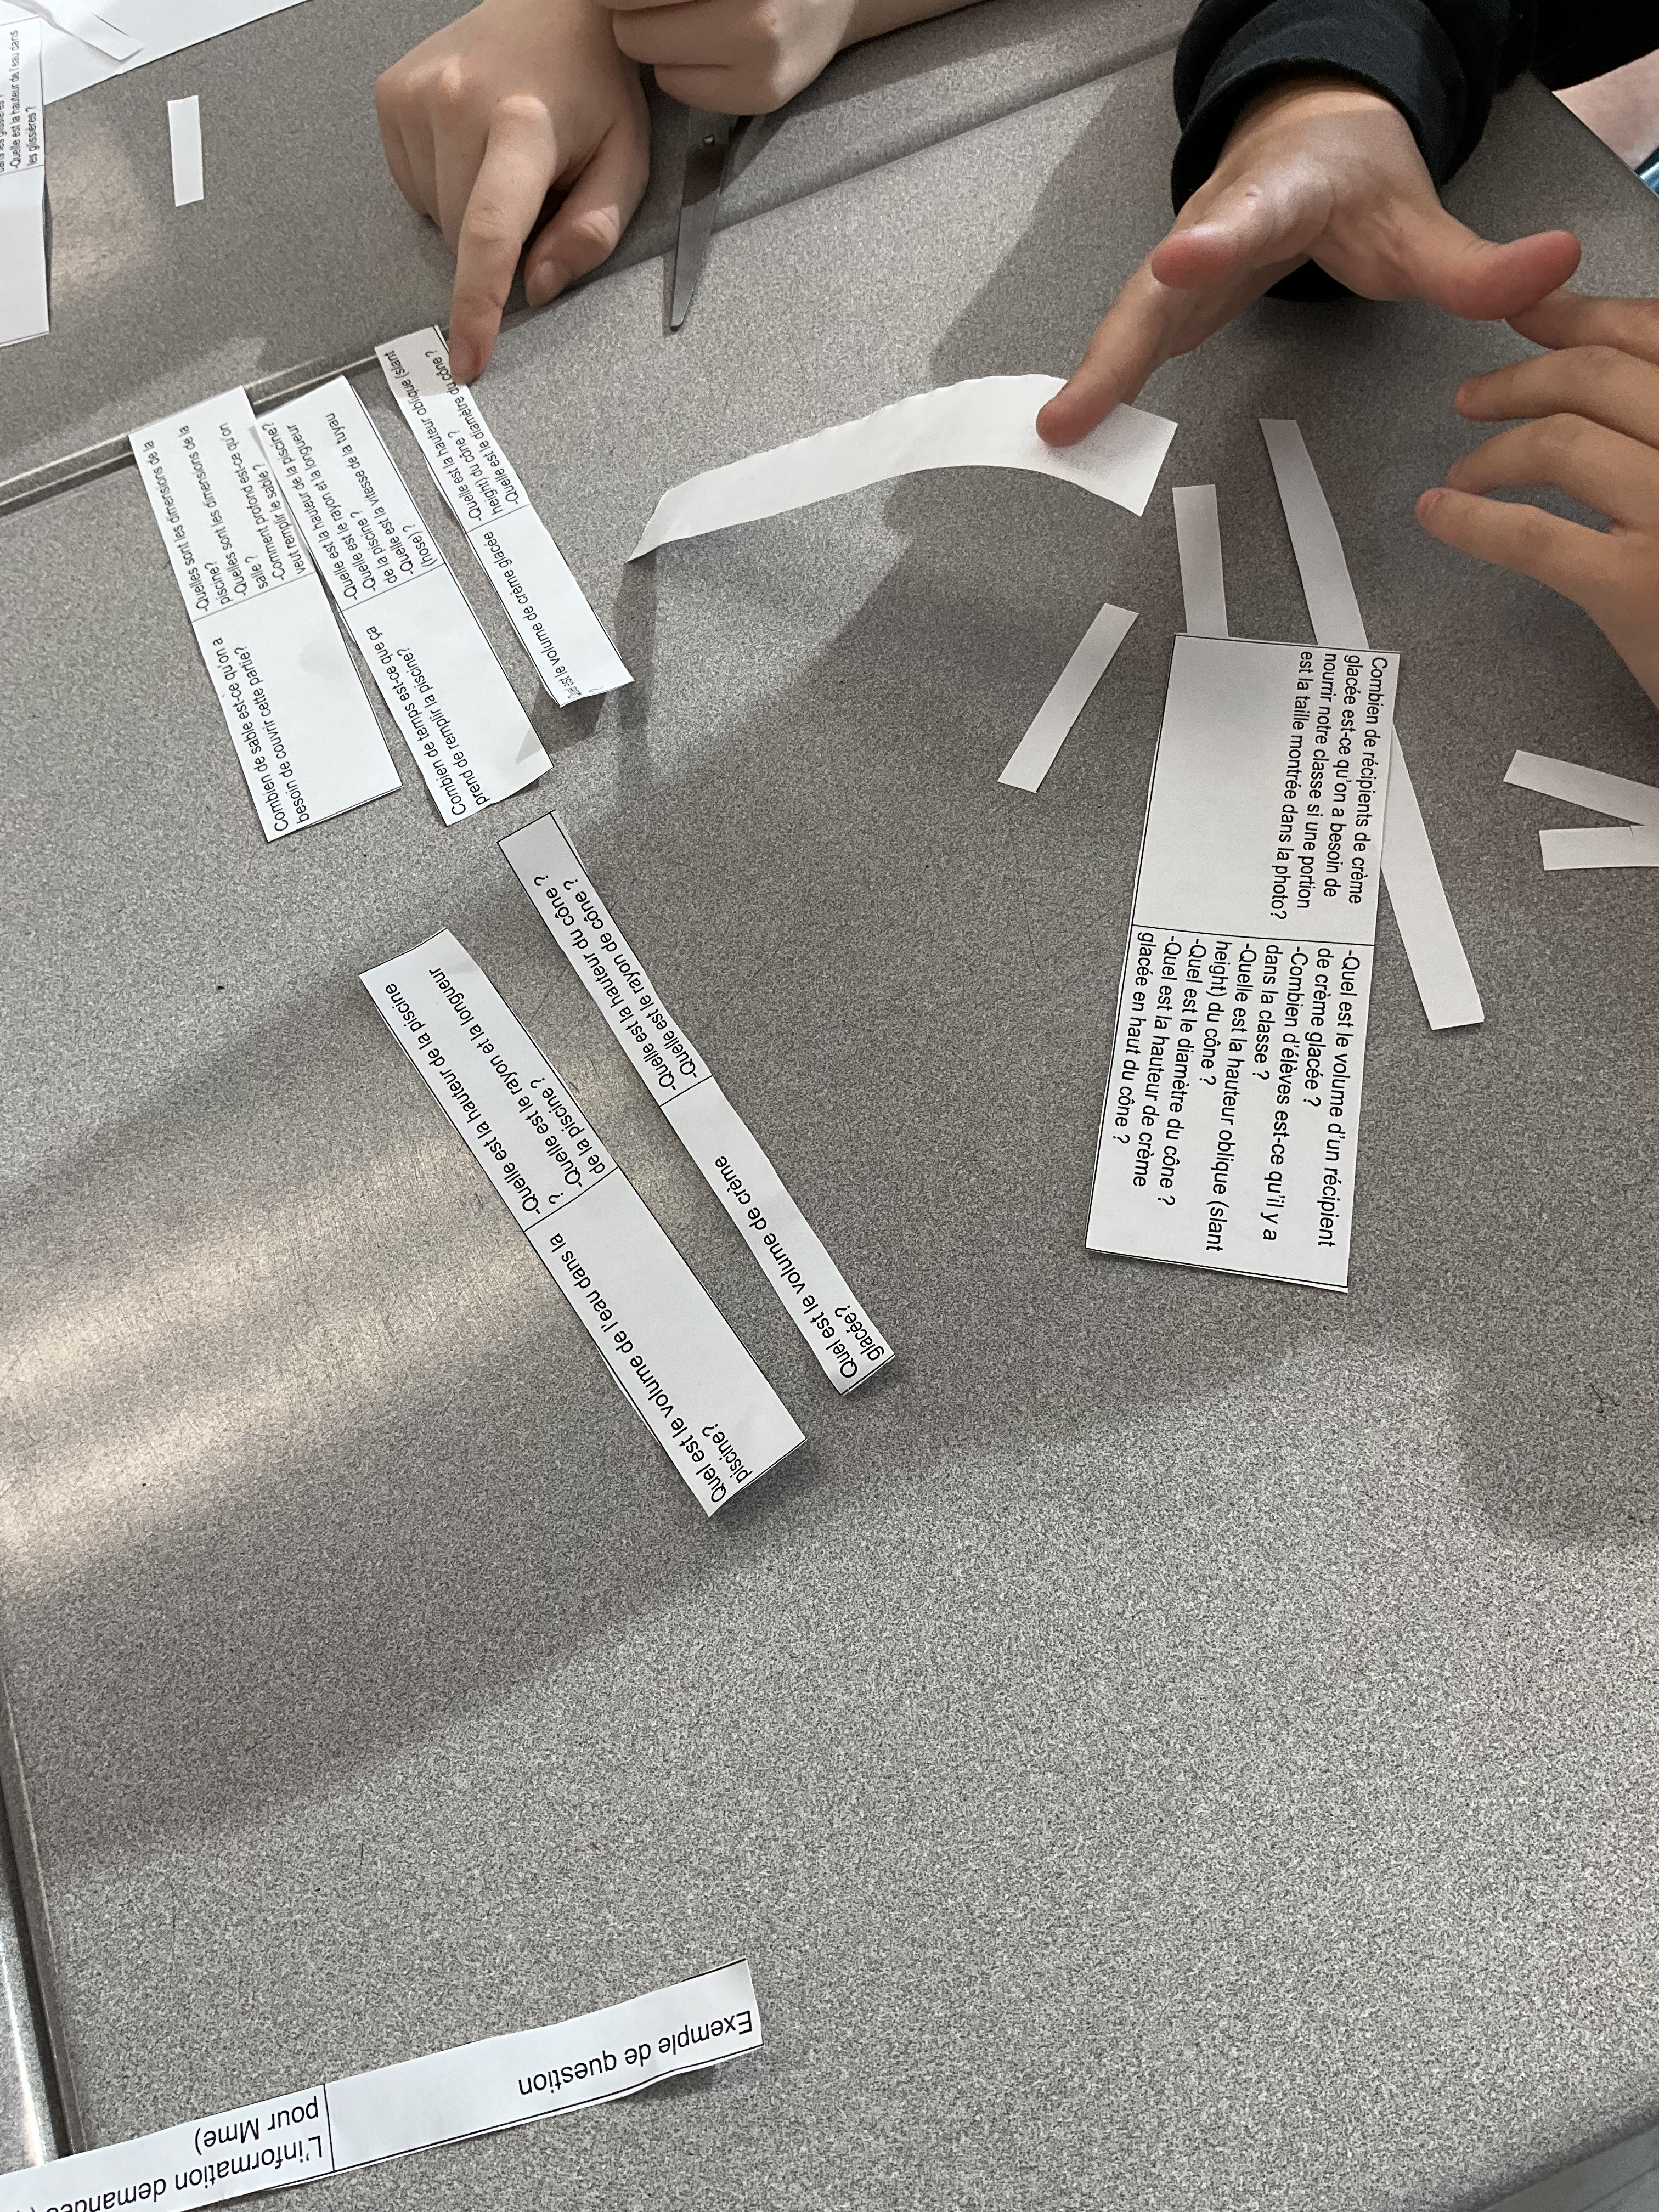
We chatted in our groups and tried to decide which questions involved more calculating than others, and we chatted about what we’d do to solve them.
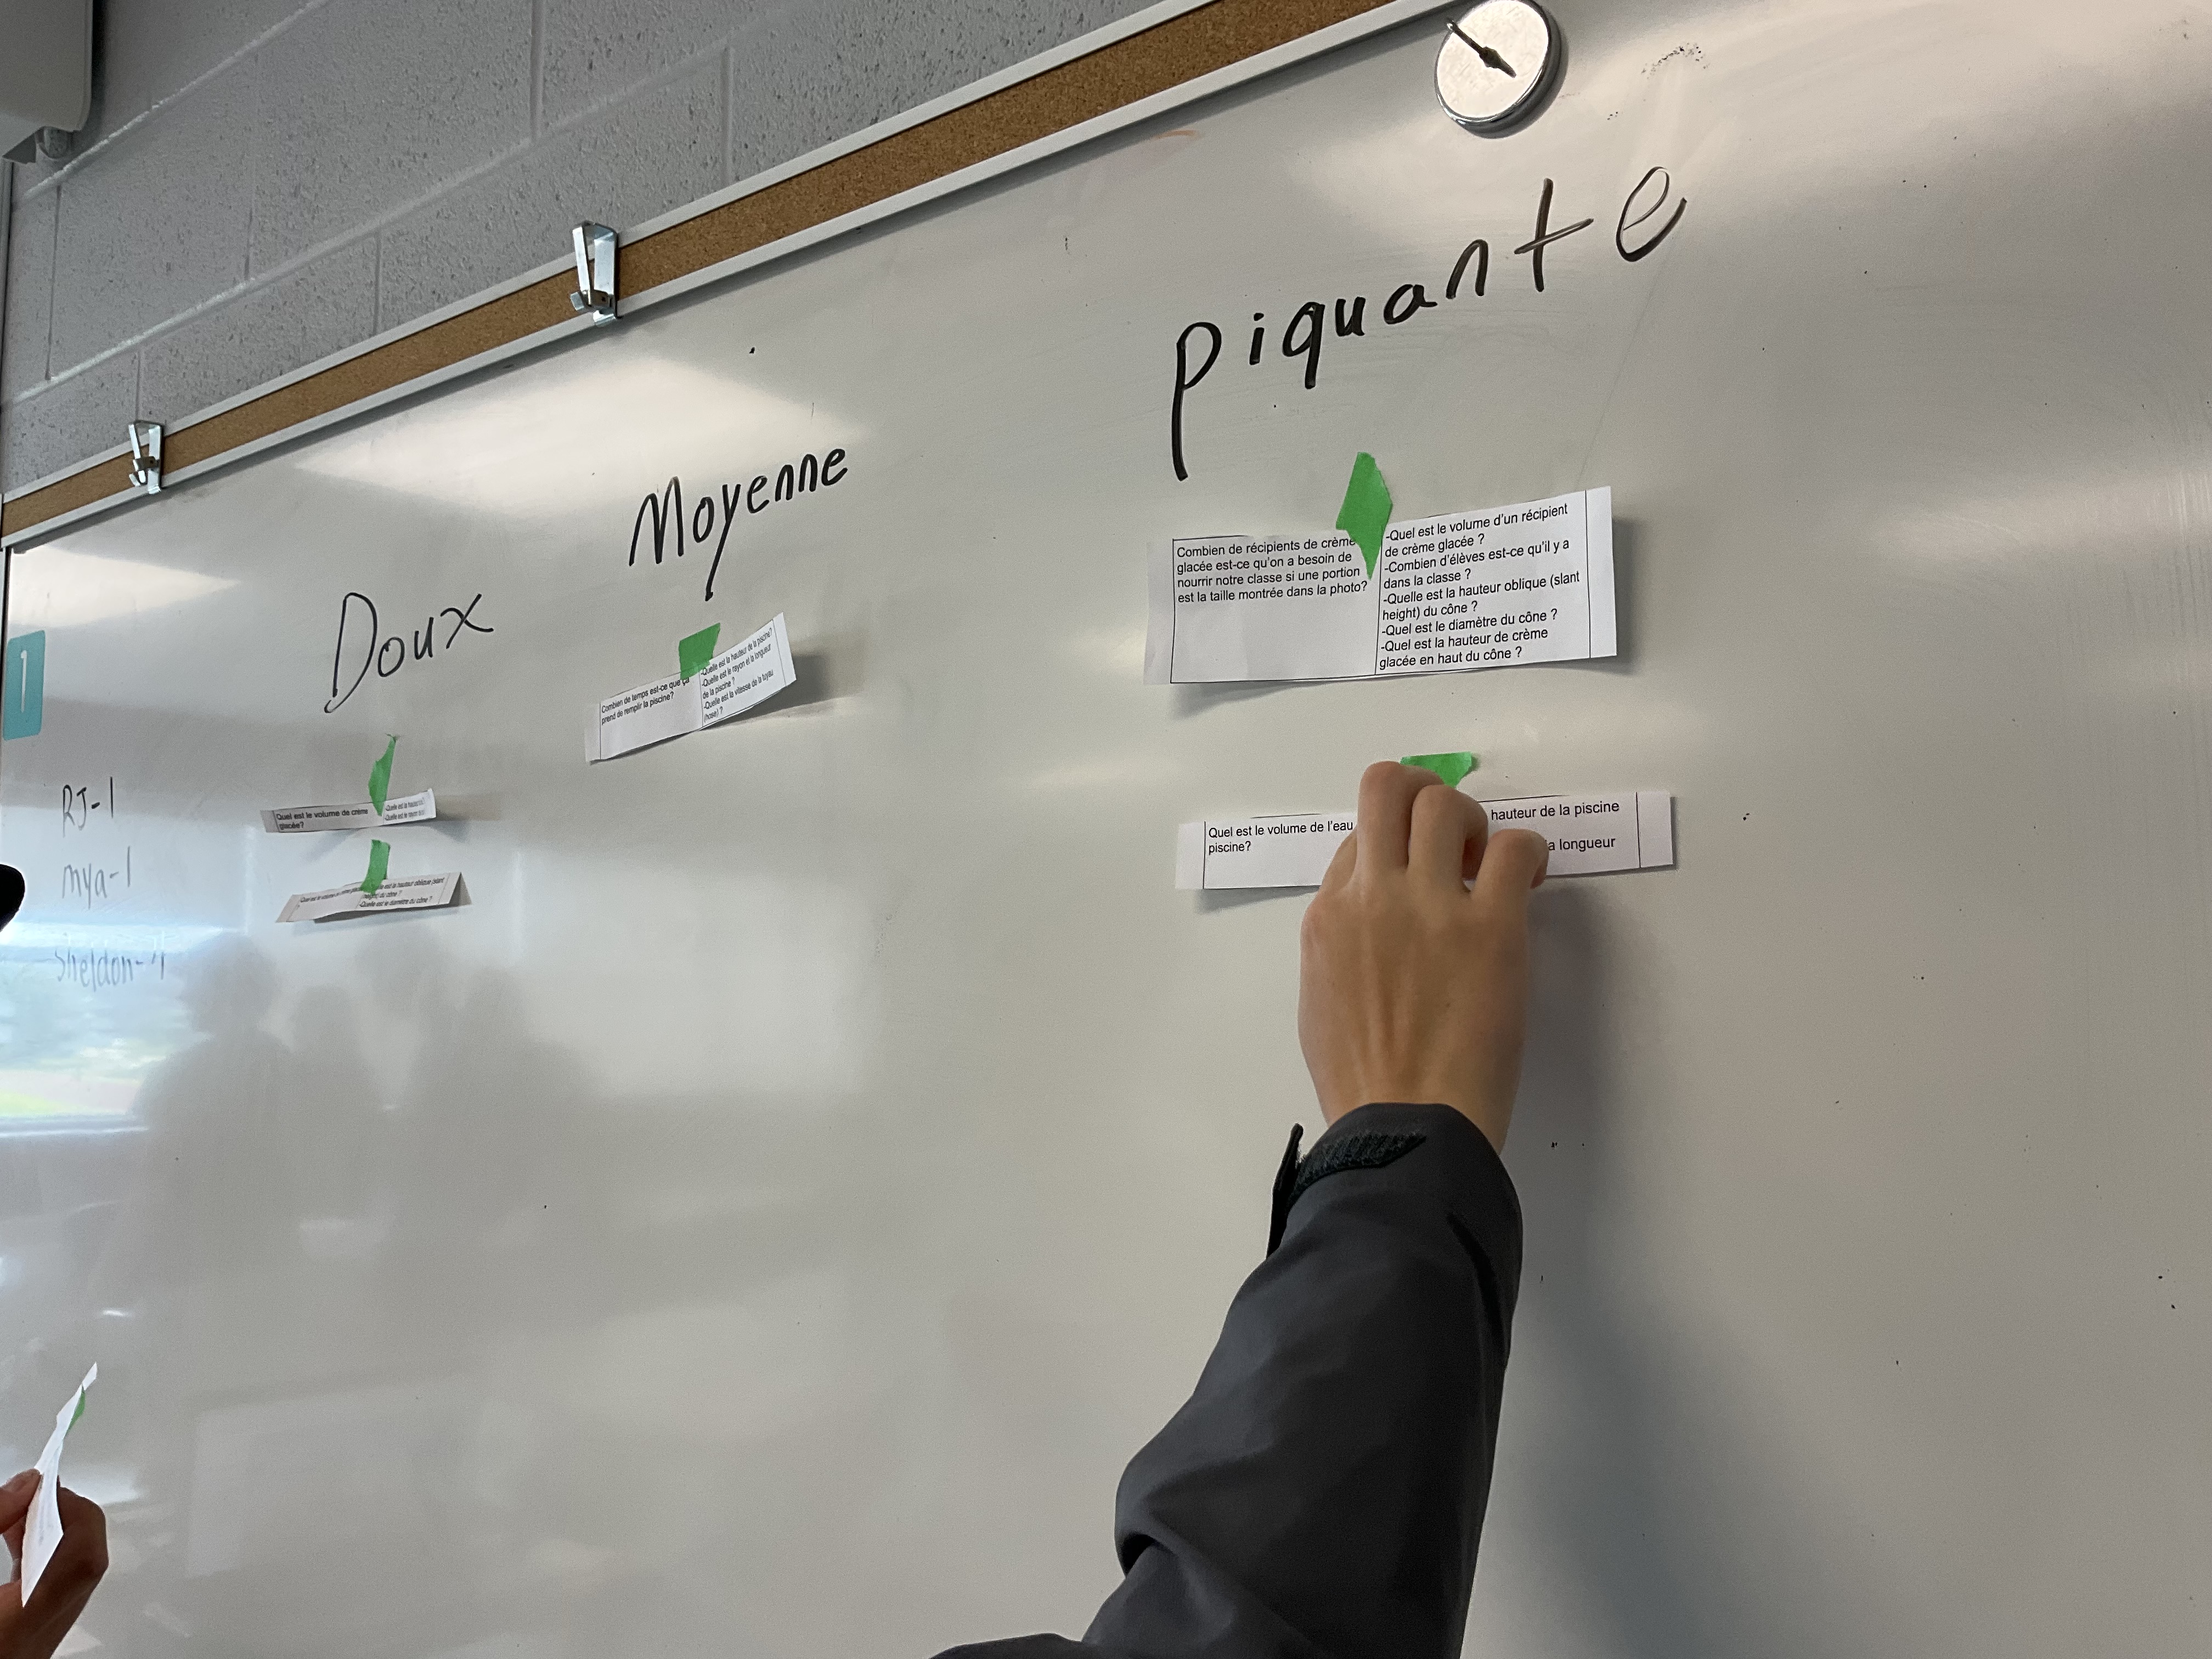
It was interesting to see how some groups classified the same question in different categories.
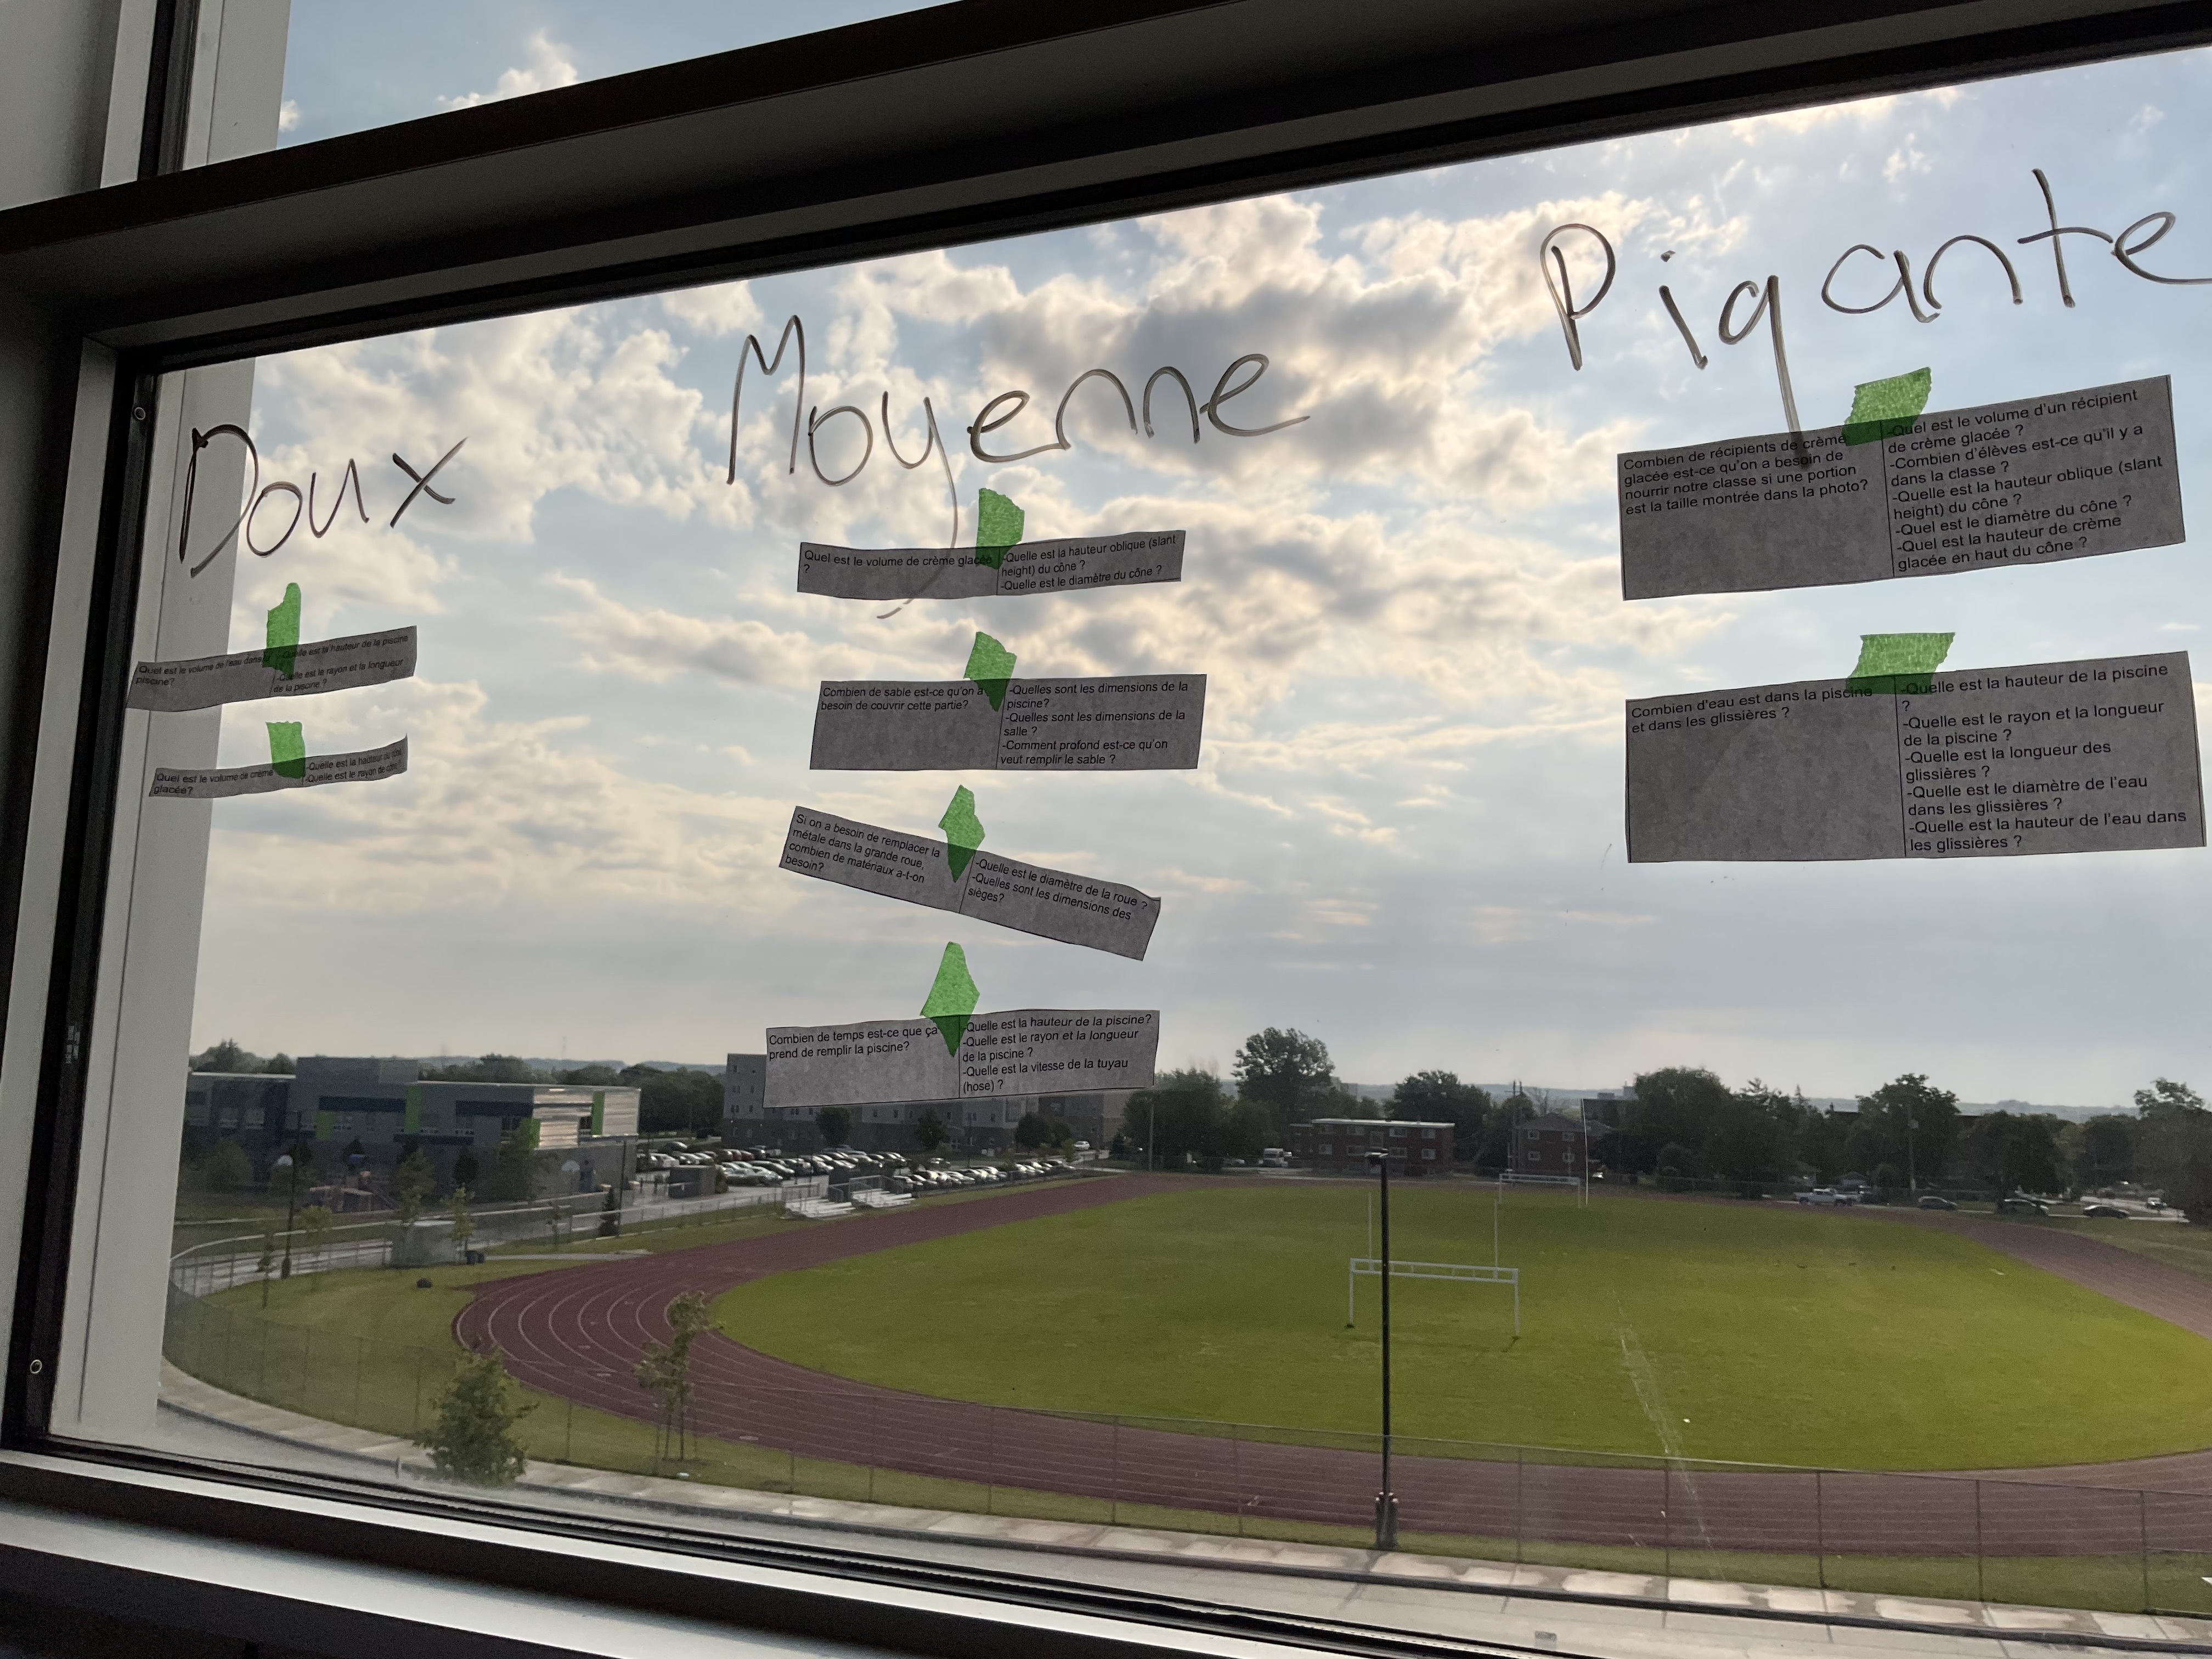
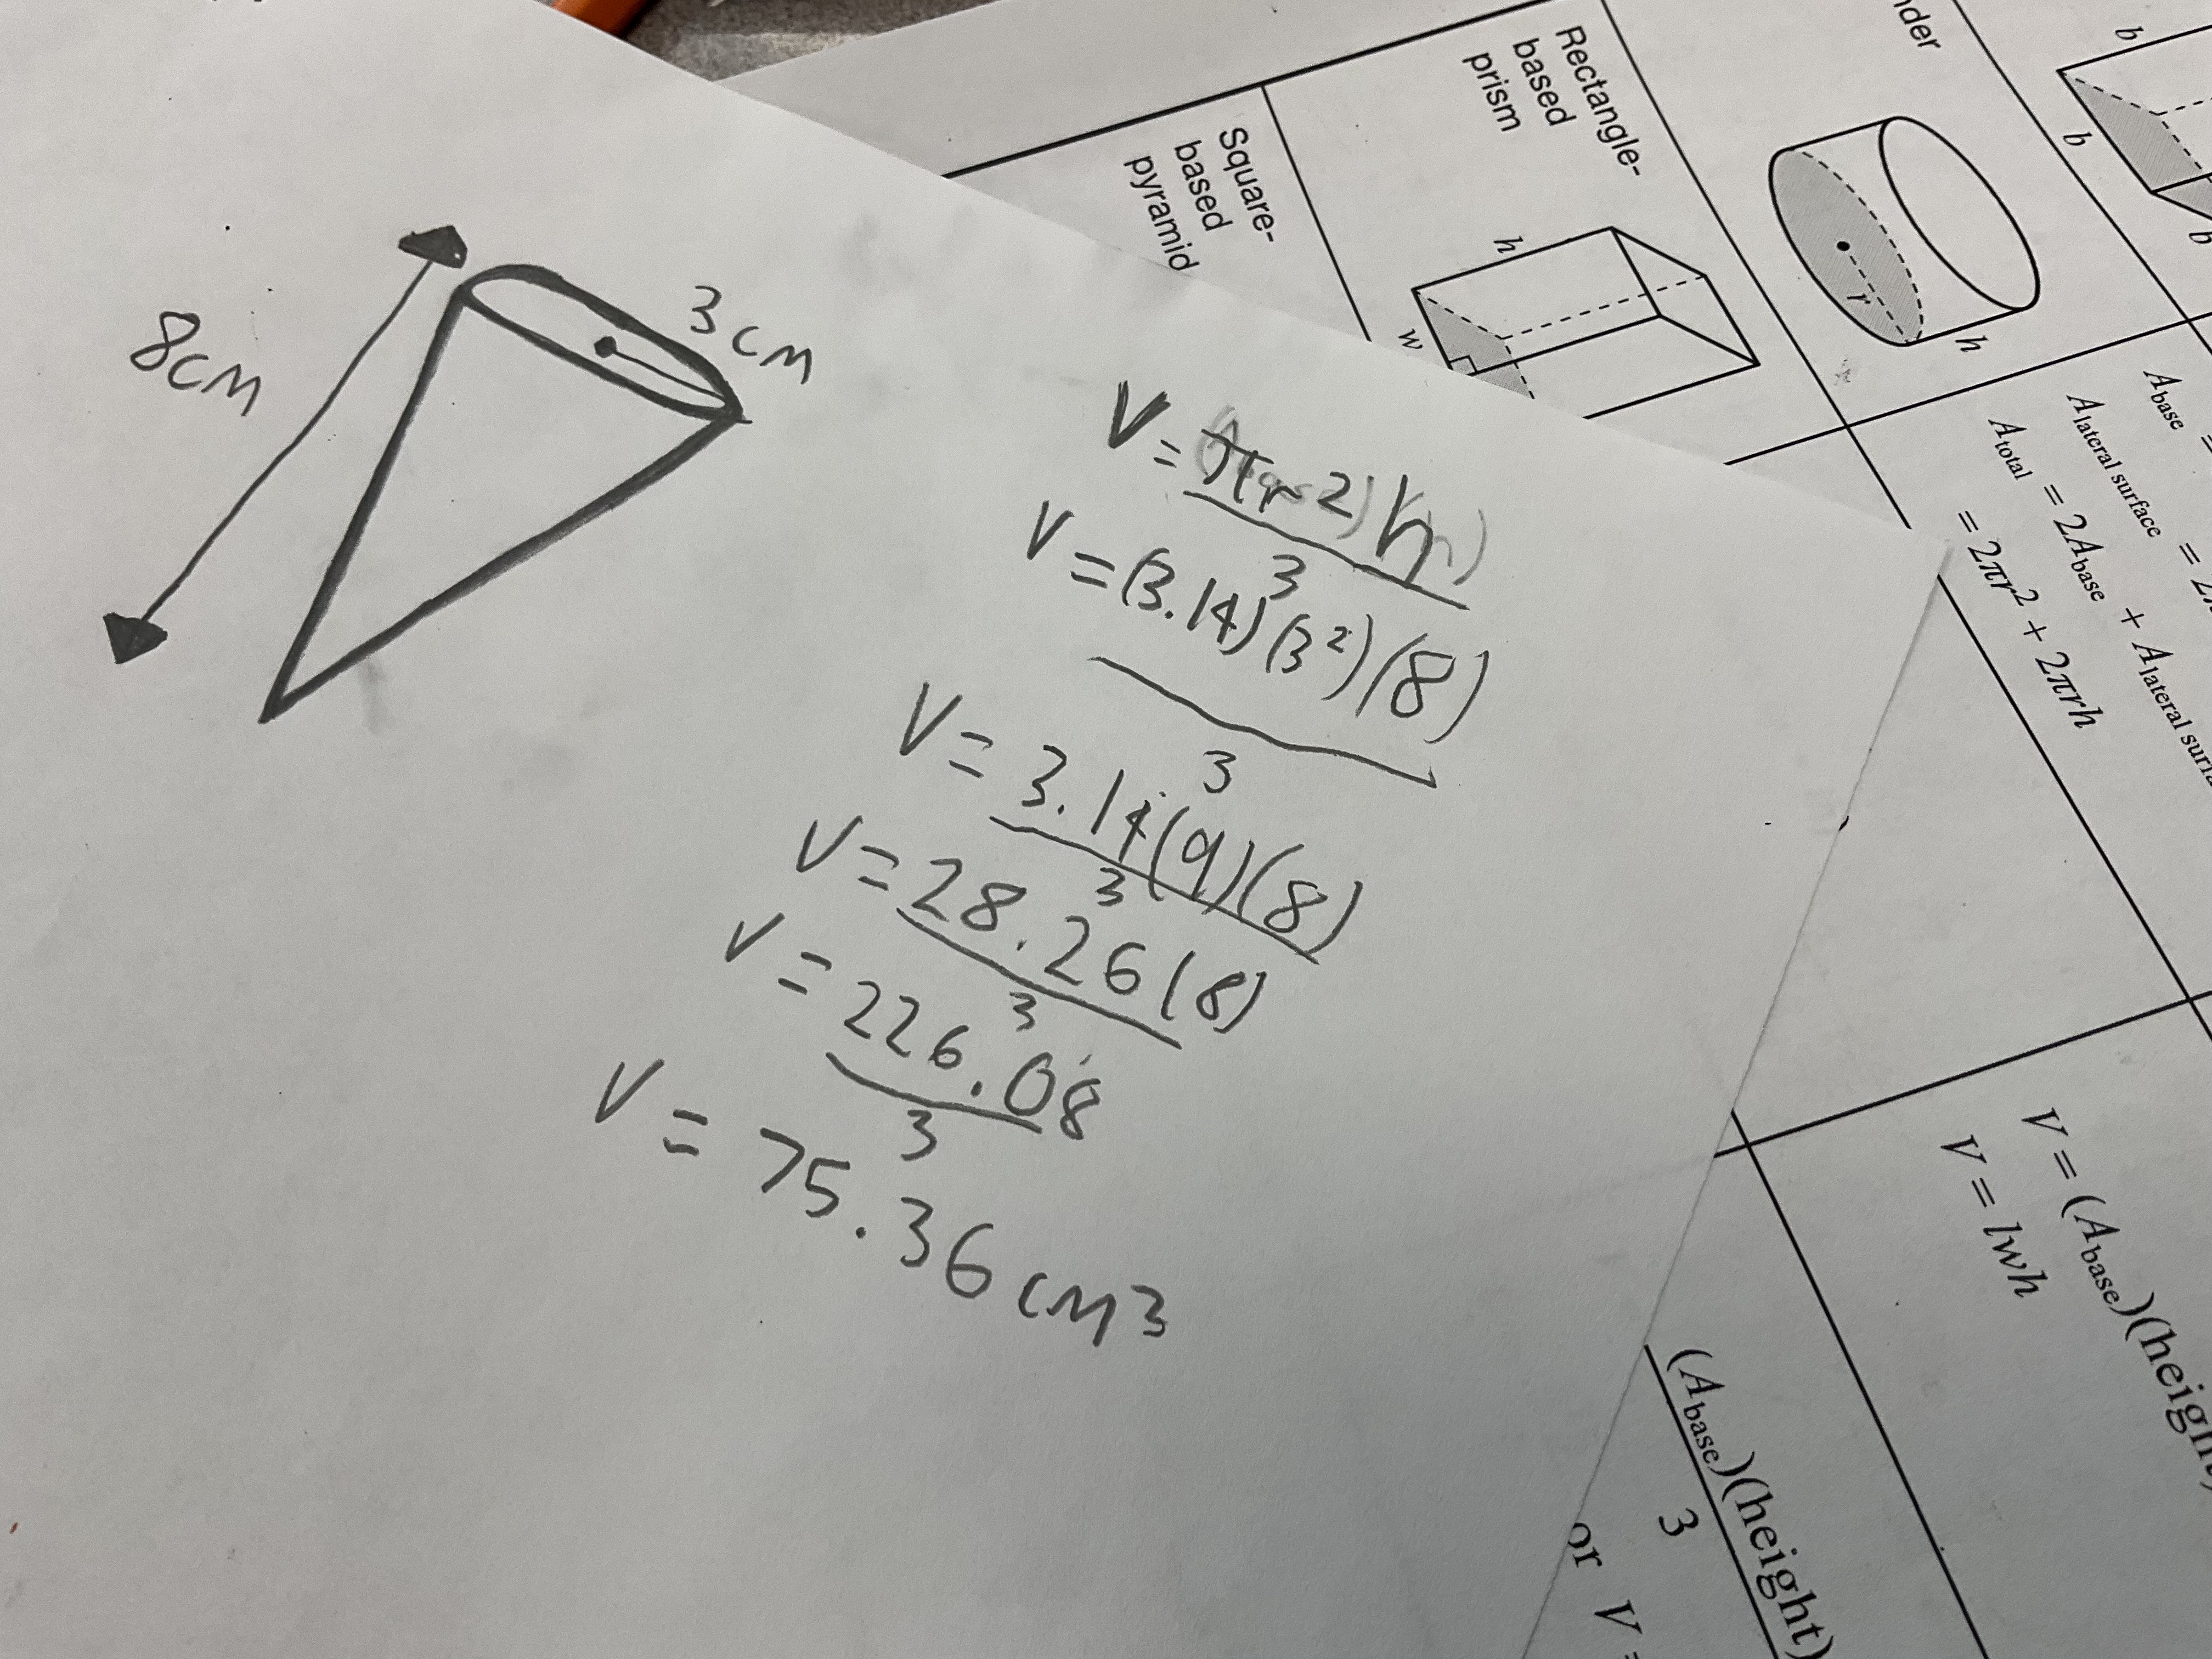
We talked about how calculating the volume of ice cream in the cone could be a mild question if you ask for radius and height for each cone.
To make the question a medium one, we could ask for the cone’s circumference and slant height, and then asking how tall the ice cream will be above the cone part if the height of the ice cream that’s piled on top of the cone is 60% of the height of the cone. This question involves calculating the radius and using the pythagorean theorem to calculate the height of the cone. The height of the ice cream is used to help calculate another cone.
To make it a spicy question you could ask how many containers of ice cream to buy from the store to serve each classmate a cone like the ones illustrated. This question involves calculating all the ice cream in the cone, using dimensions, and then also using the volume of the container which could be given in litres to add unit conversion to the question.
Groups then split up and tackled a question from the list with information that was provided to them.
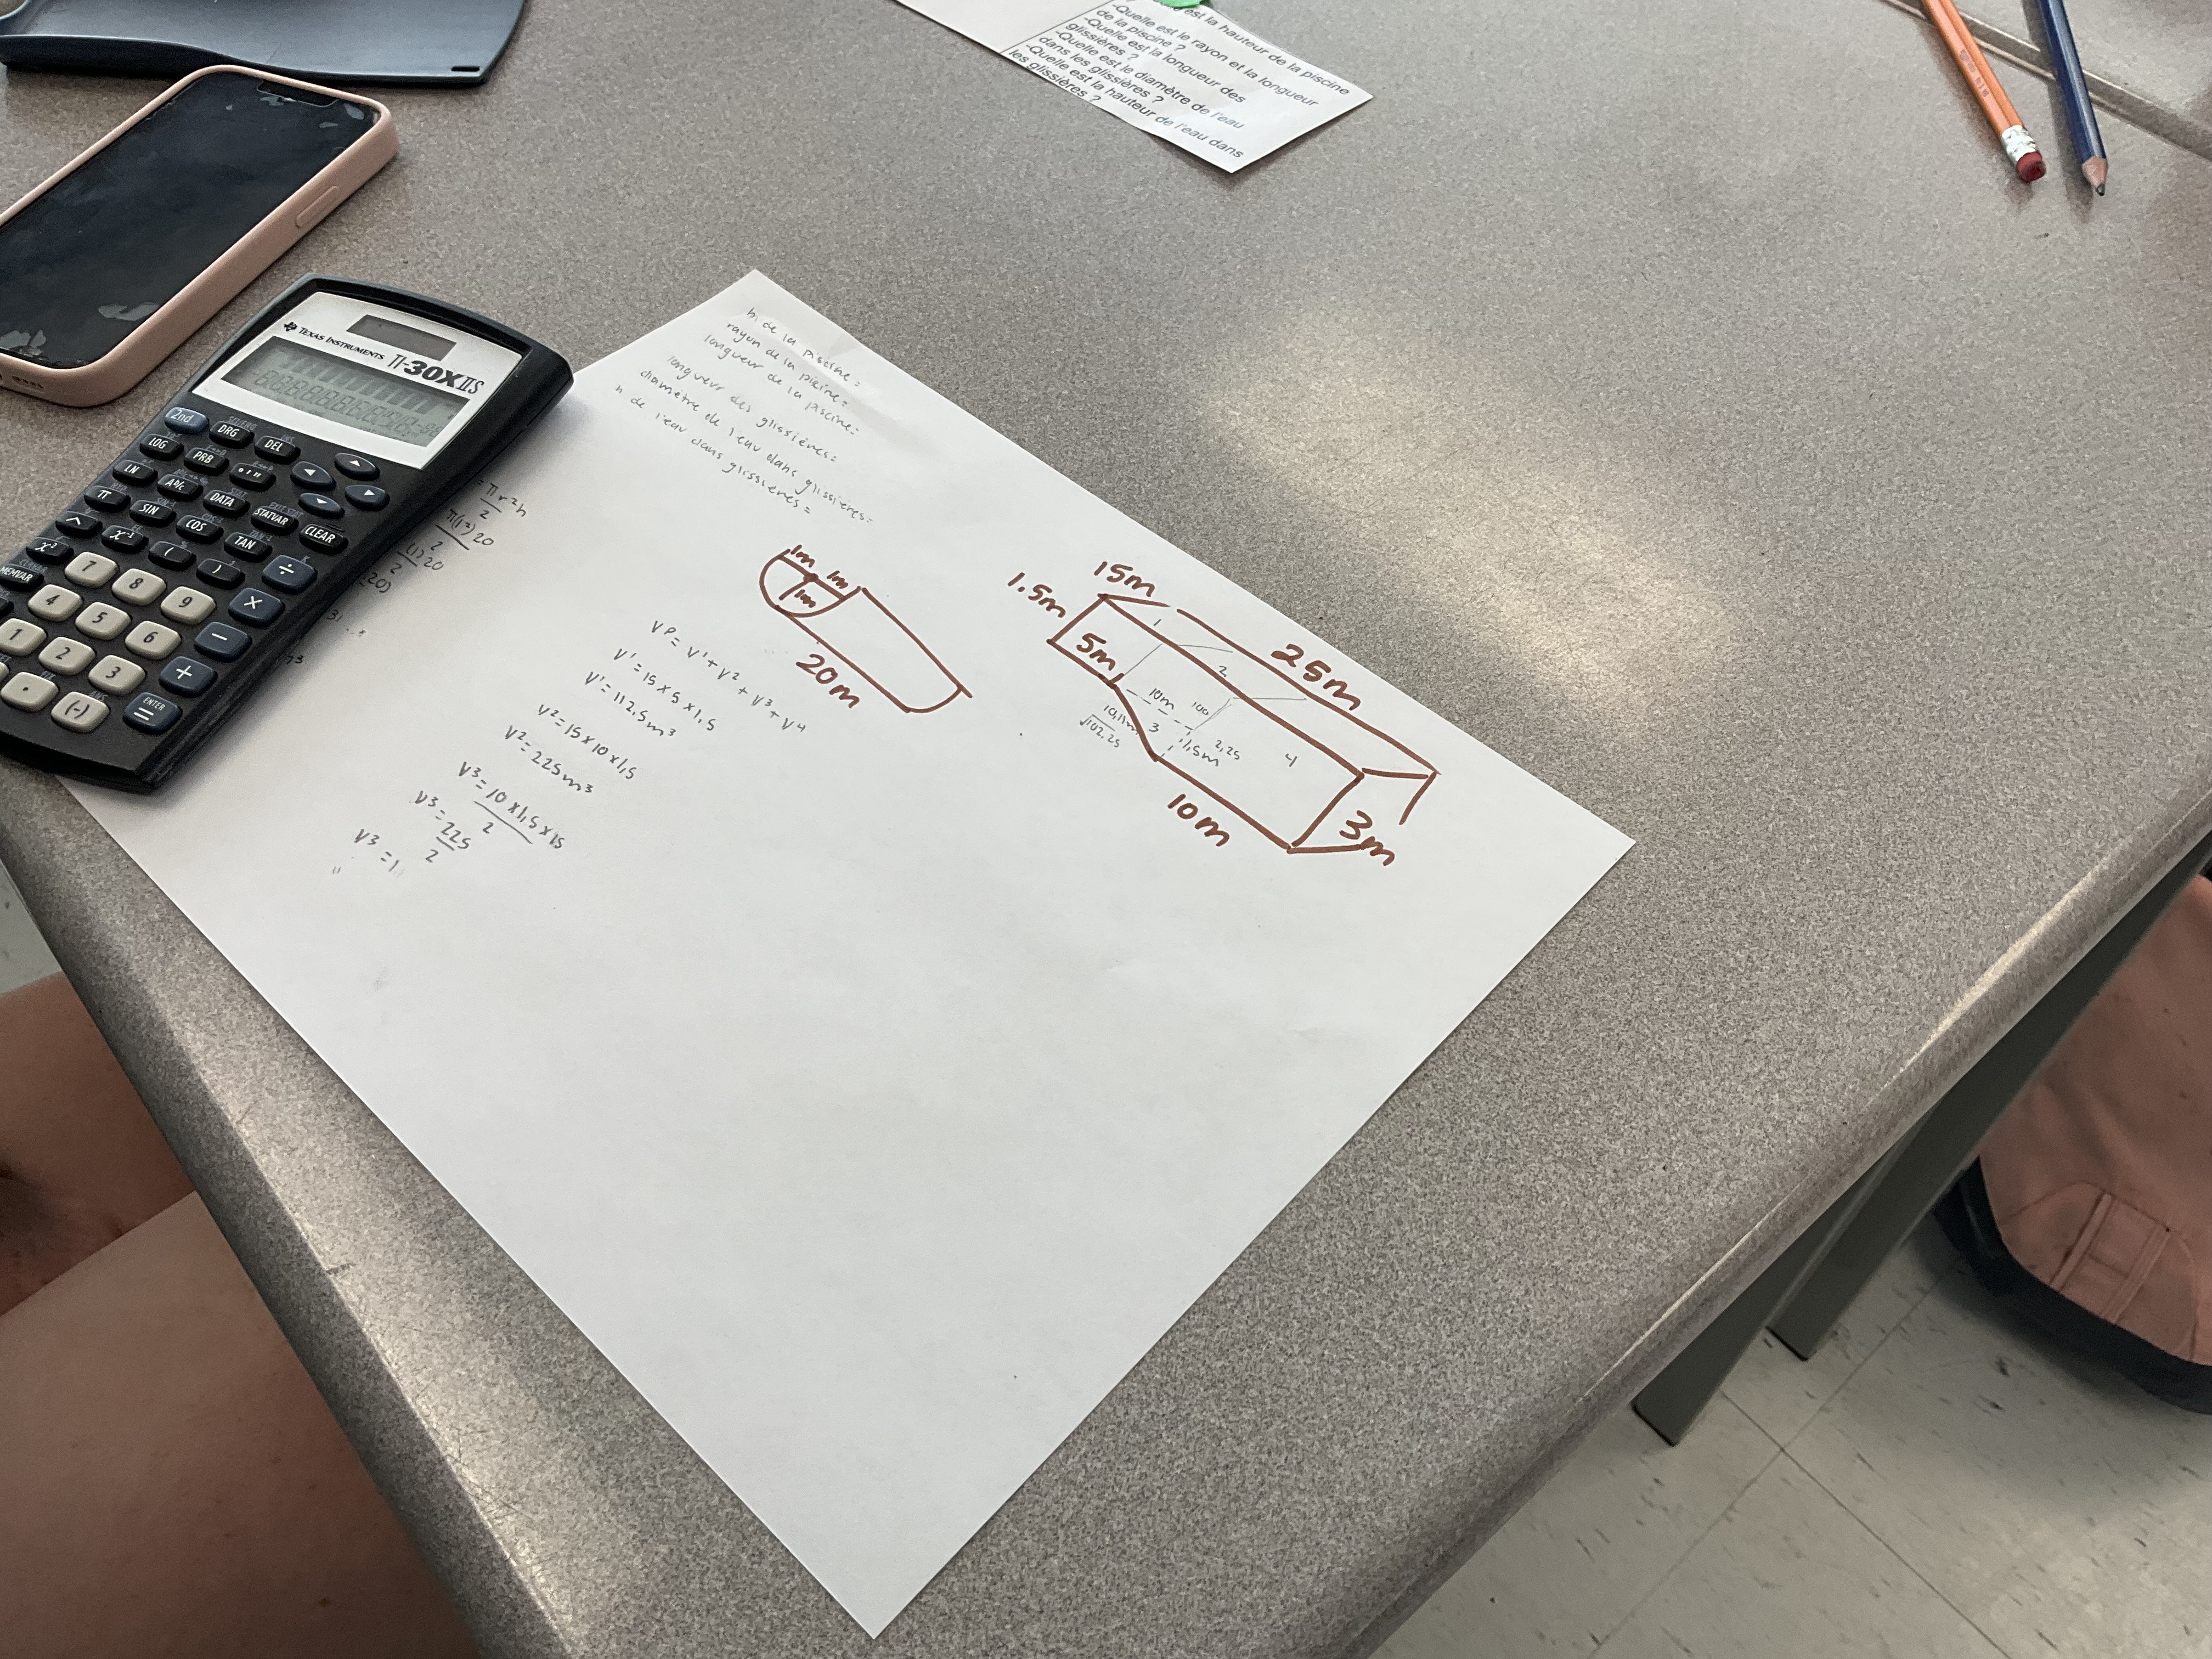
here’s one student who chose to calculate the volume of the pool and water slide.
Tomorrow is the big day where we’ll see the image we’re using for inspiration. We’ll get our groups together and make up questions to solve, and submit our requests for information.
Monday we’ll be working individually to solve the questions that were made in groups.
