Exponent Laws Continued
Grade 9s were hard at work today continuing on their exponent laws journey.
We explored some examples with numbers.

We learned that if we have a fraction with the same numerator and denominator it simplifies to 1. Each of the circled pairs will simplify to 1. We can now express the answer as an exponent. When we divide and the bases are the same, we can subtract the exponents.
This works if the base is a variable as well.

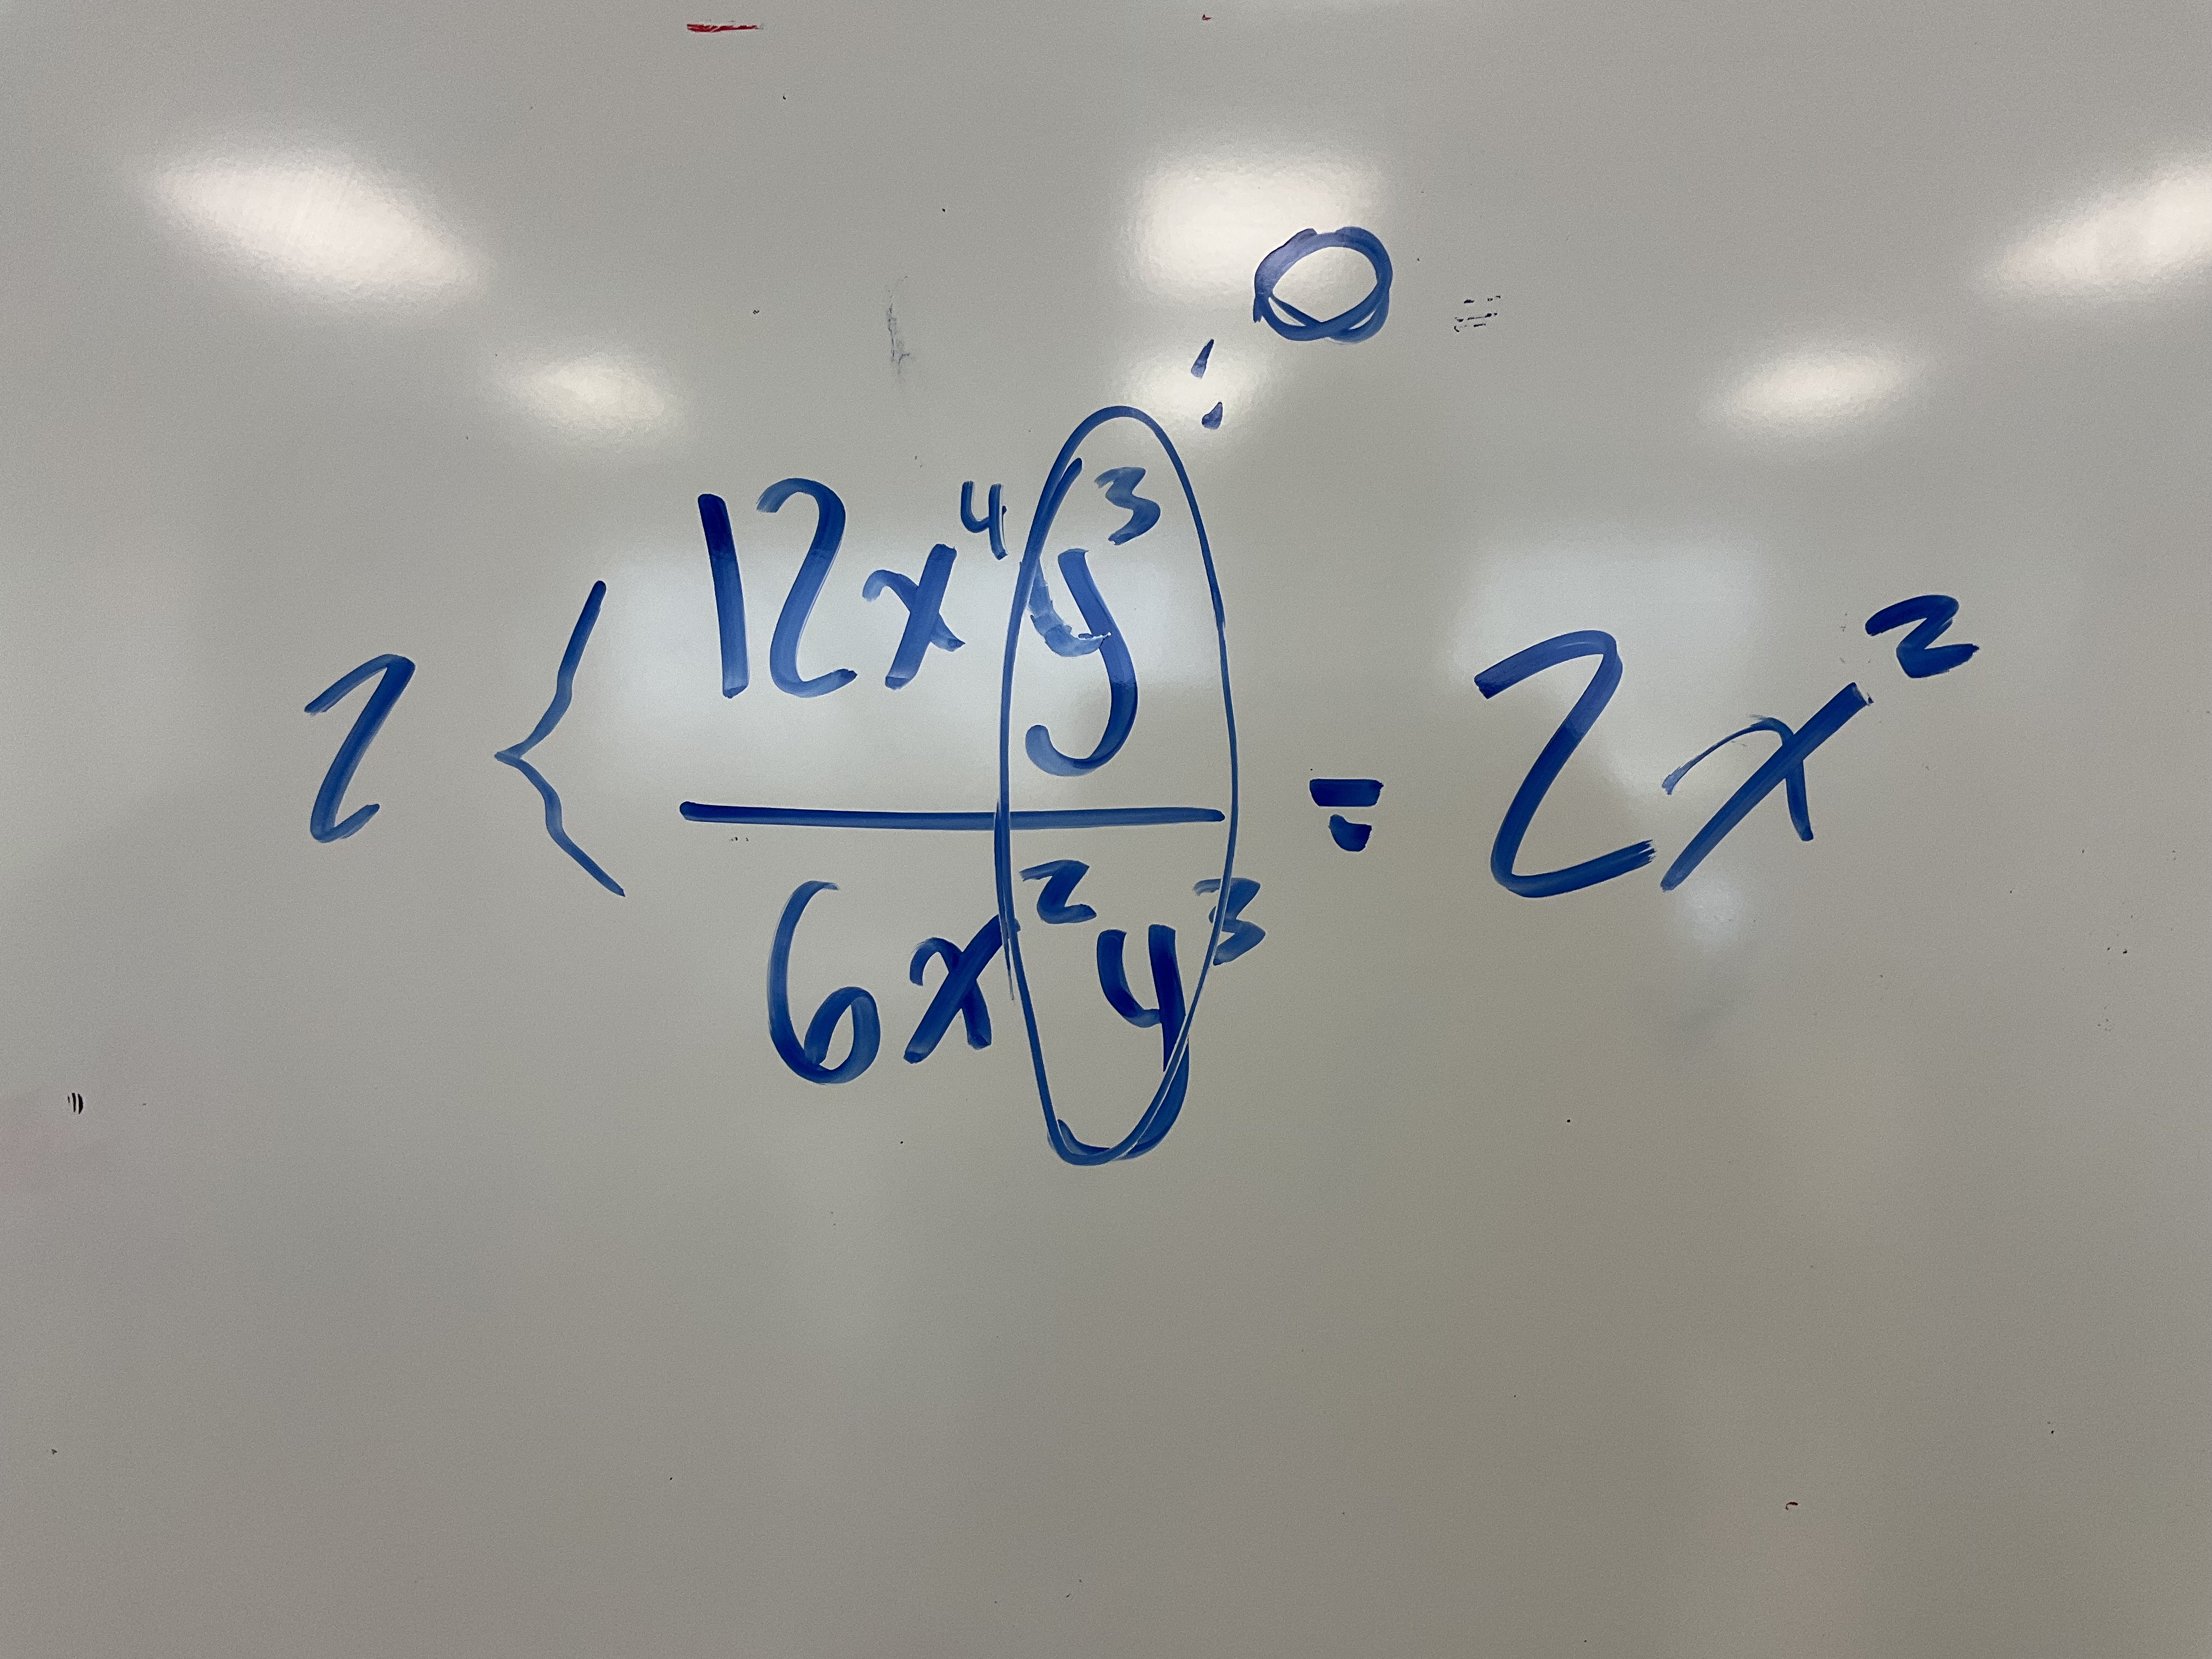
The next example includes coefficients and 2 variables. We know that we divide the coefficients as normal. 12/6=2. We look at the xs next. We have x^(4-2) which is x^2, and something neat happens with the ys. We see that when we subtract the exponents we get 0. We also see that we can circle the y^3 in the numerator and denominator and that this fraction will equal 1. Anything to the power of 0 will be equal to 1.
The next example leads us to explore negative exponents. We can easily manage the fraction and the as, but when we have b^(4-6) that leaves us with b^(-2).
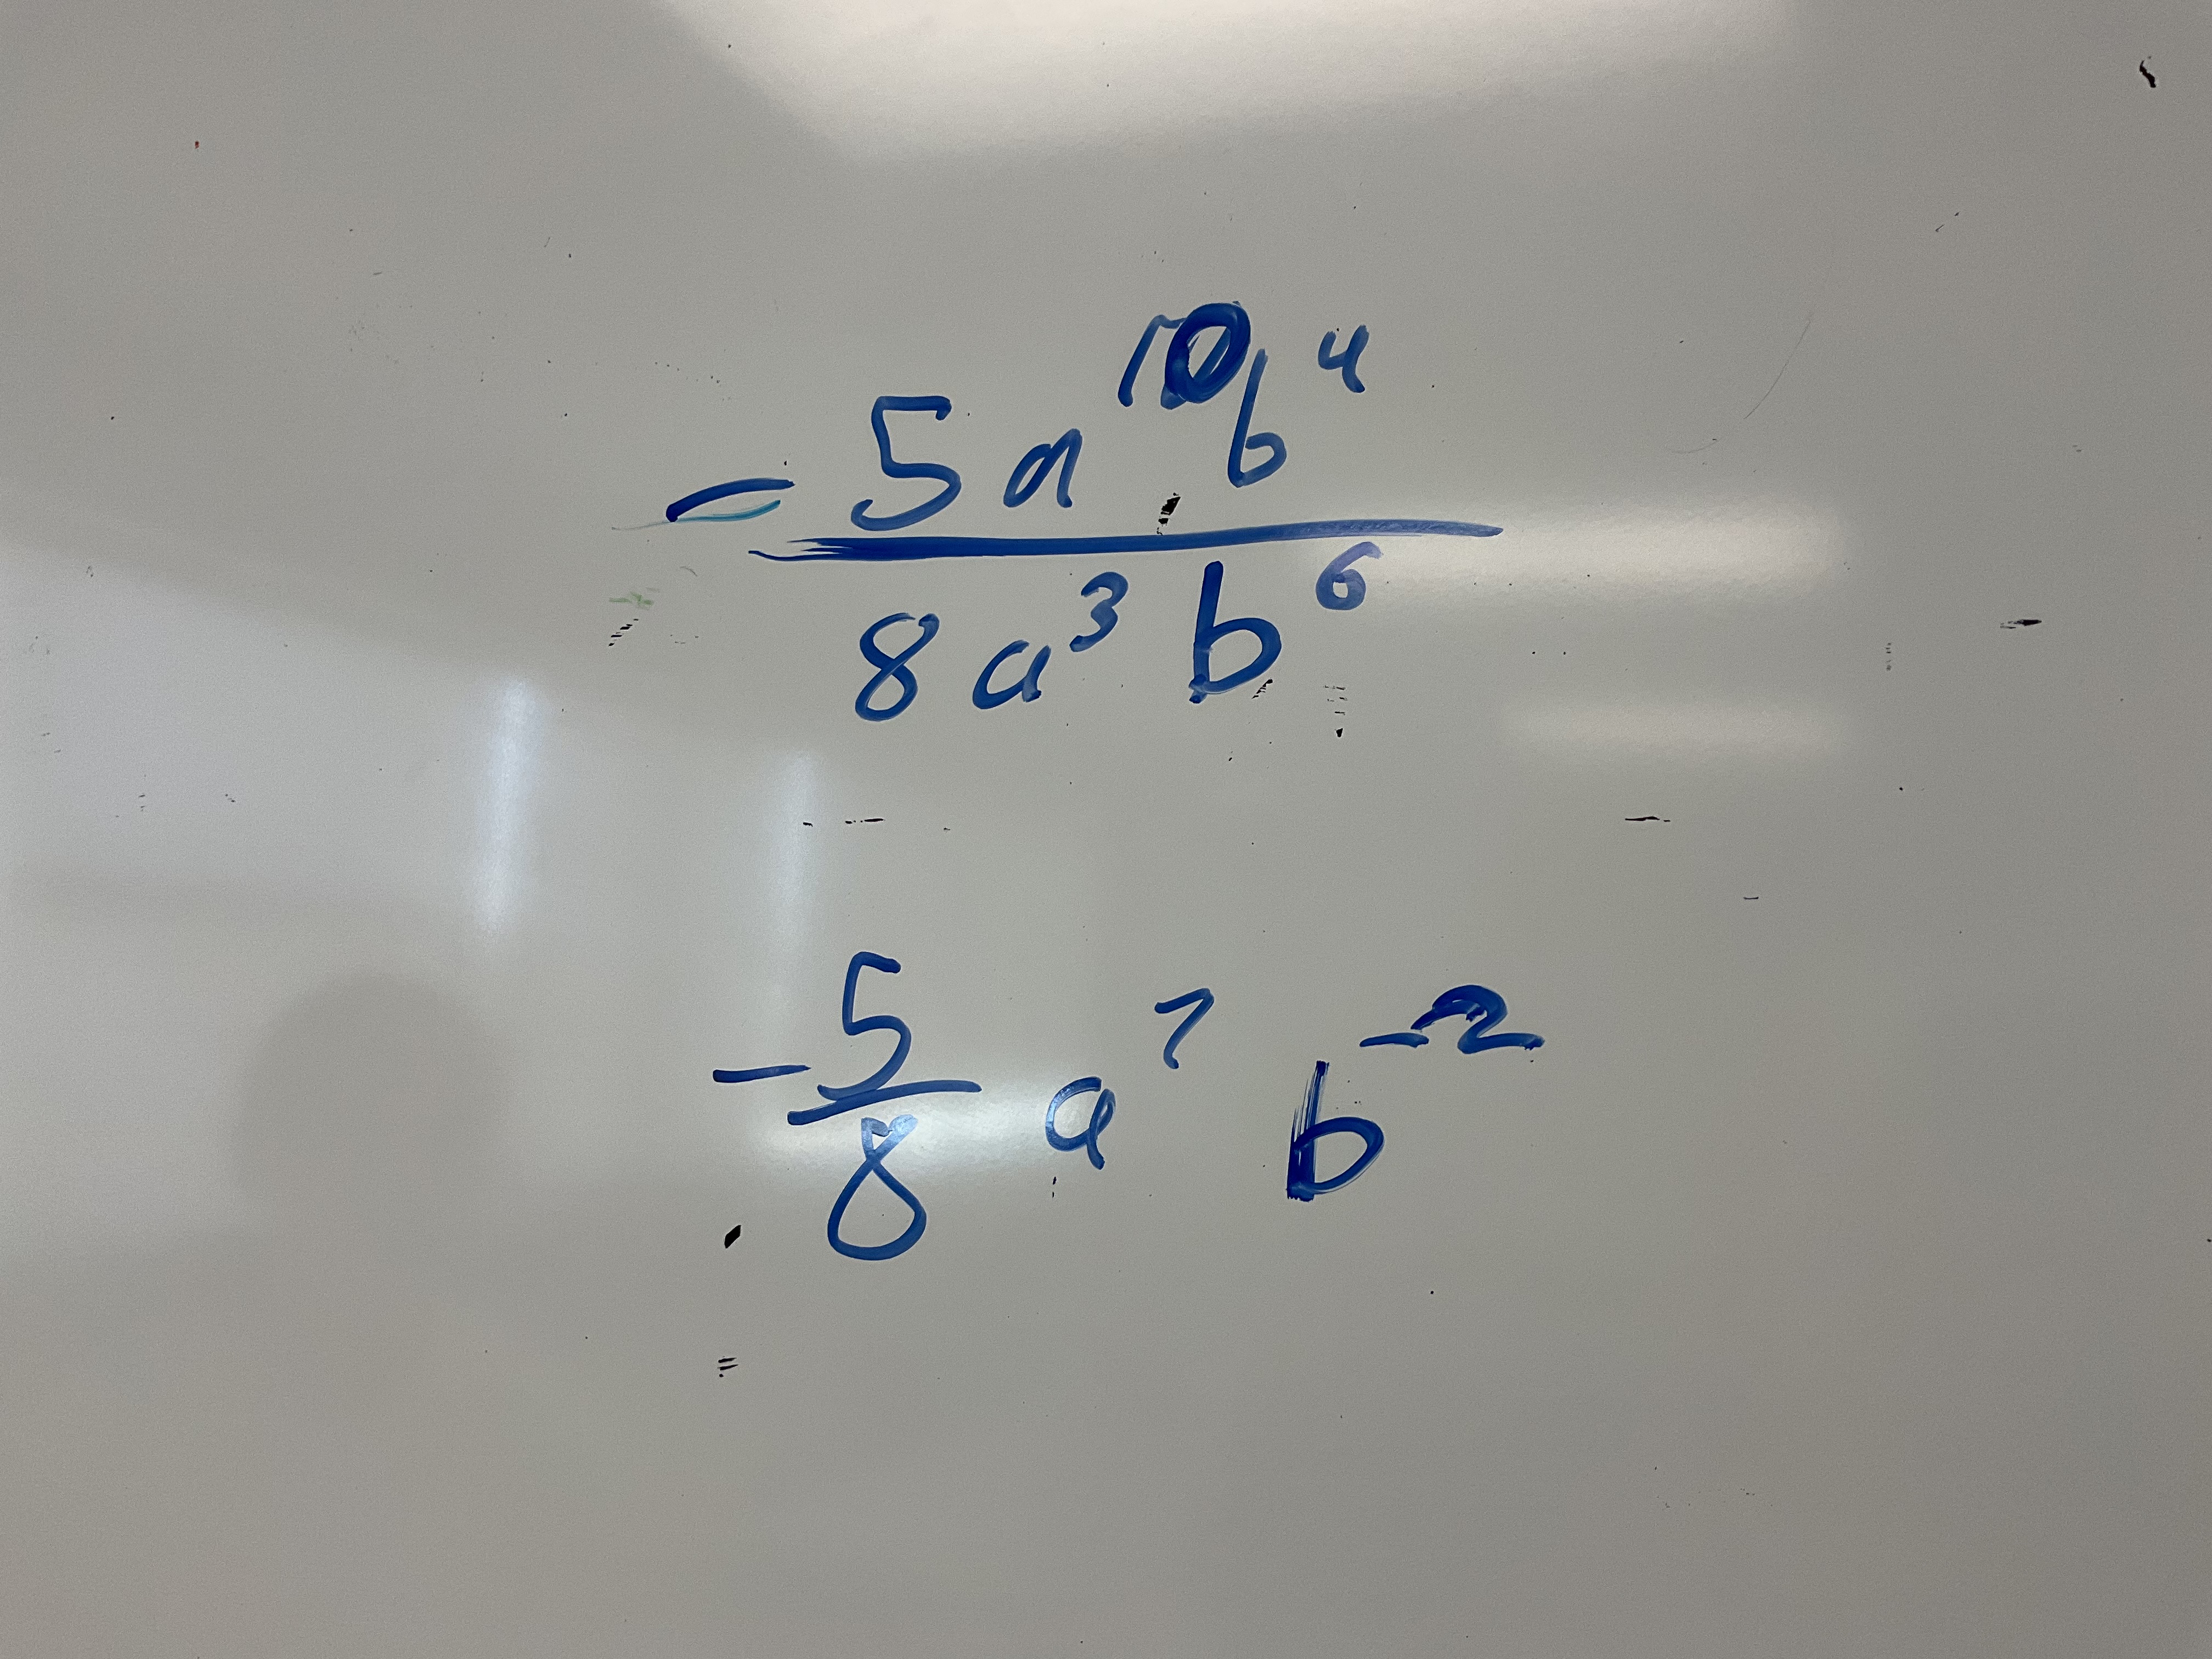
We explored how to write negative exponents another way. When we have a negative exponent, it has come from a case where the exponent in the denominator is higher than the exponent in the numerator. If we write it in developed form and circle all the fractions that equal 1, then we will be left with variables in the denominator. a^(-2)=1/(a^2)

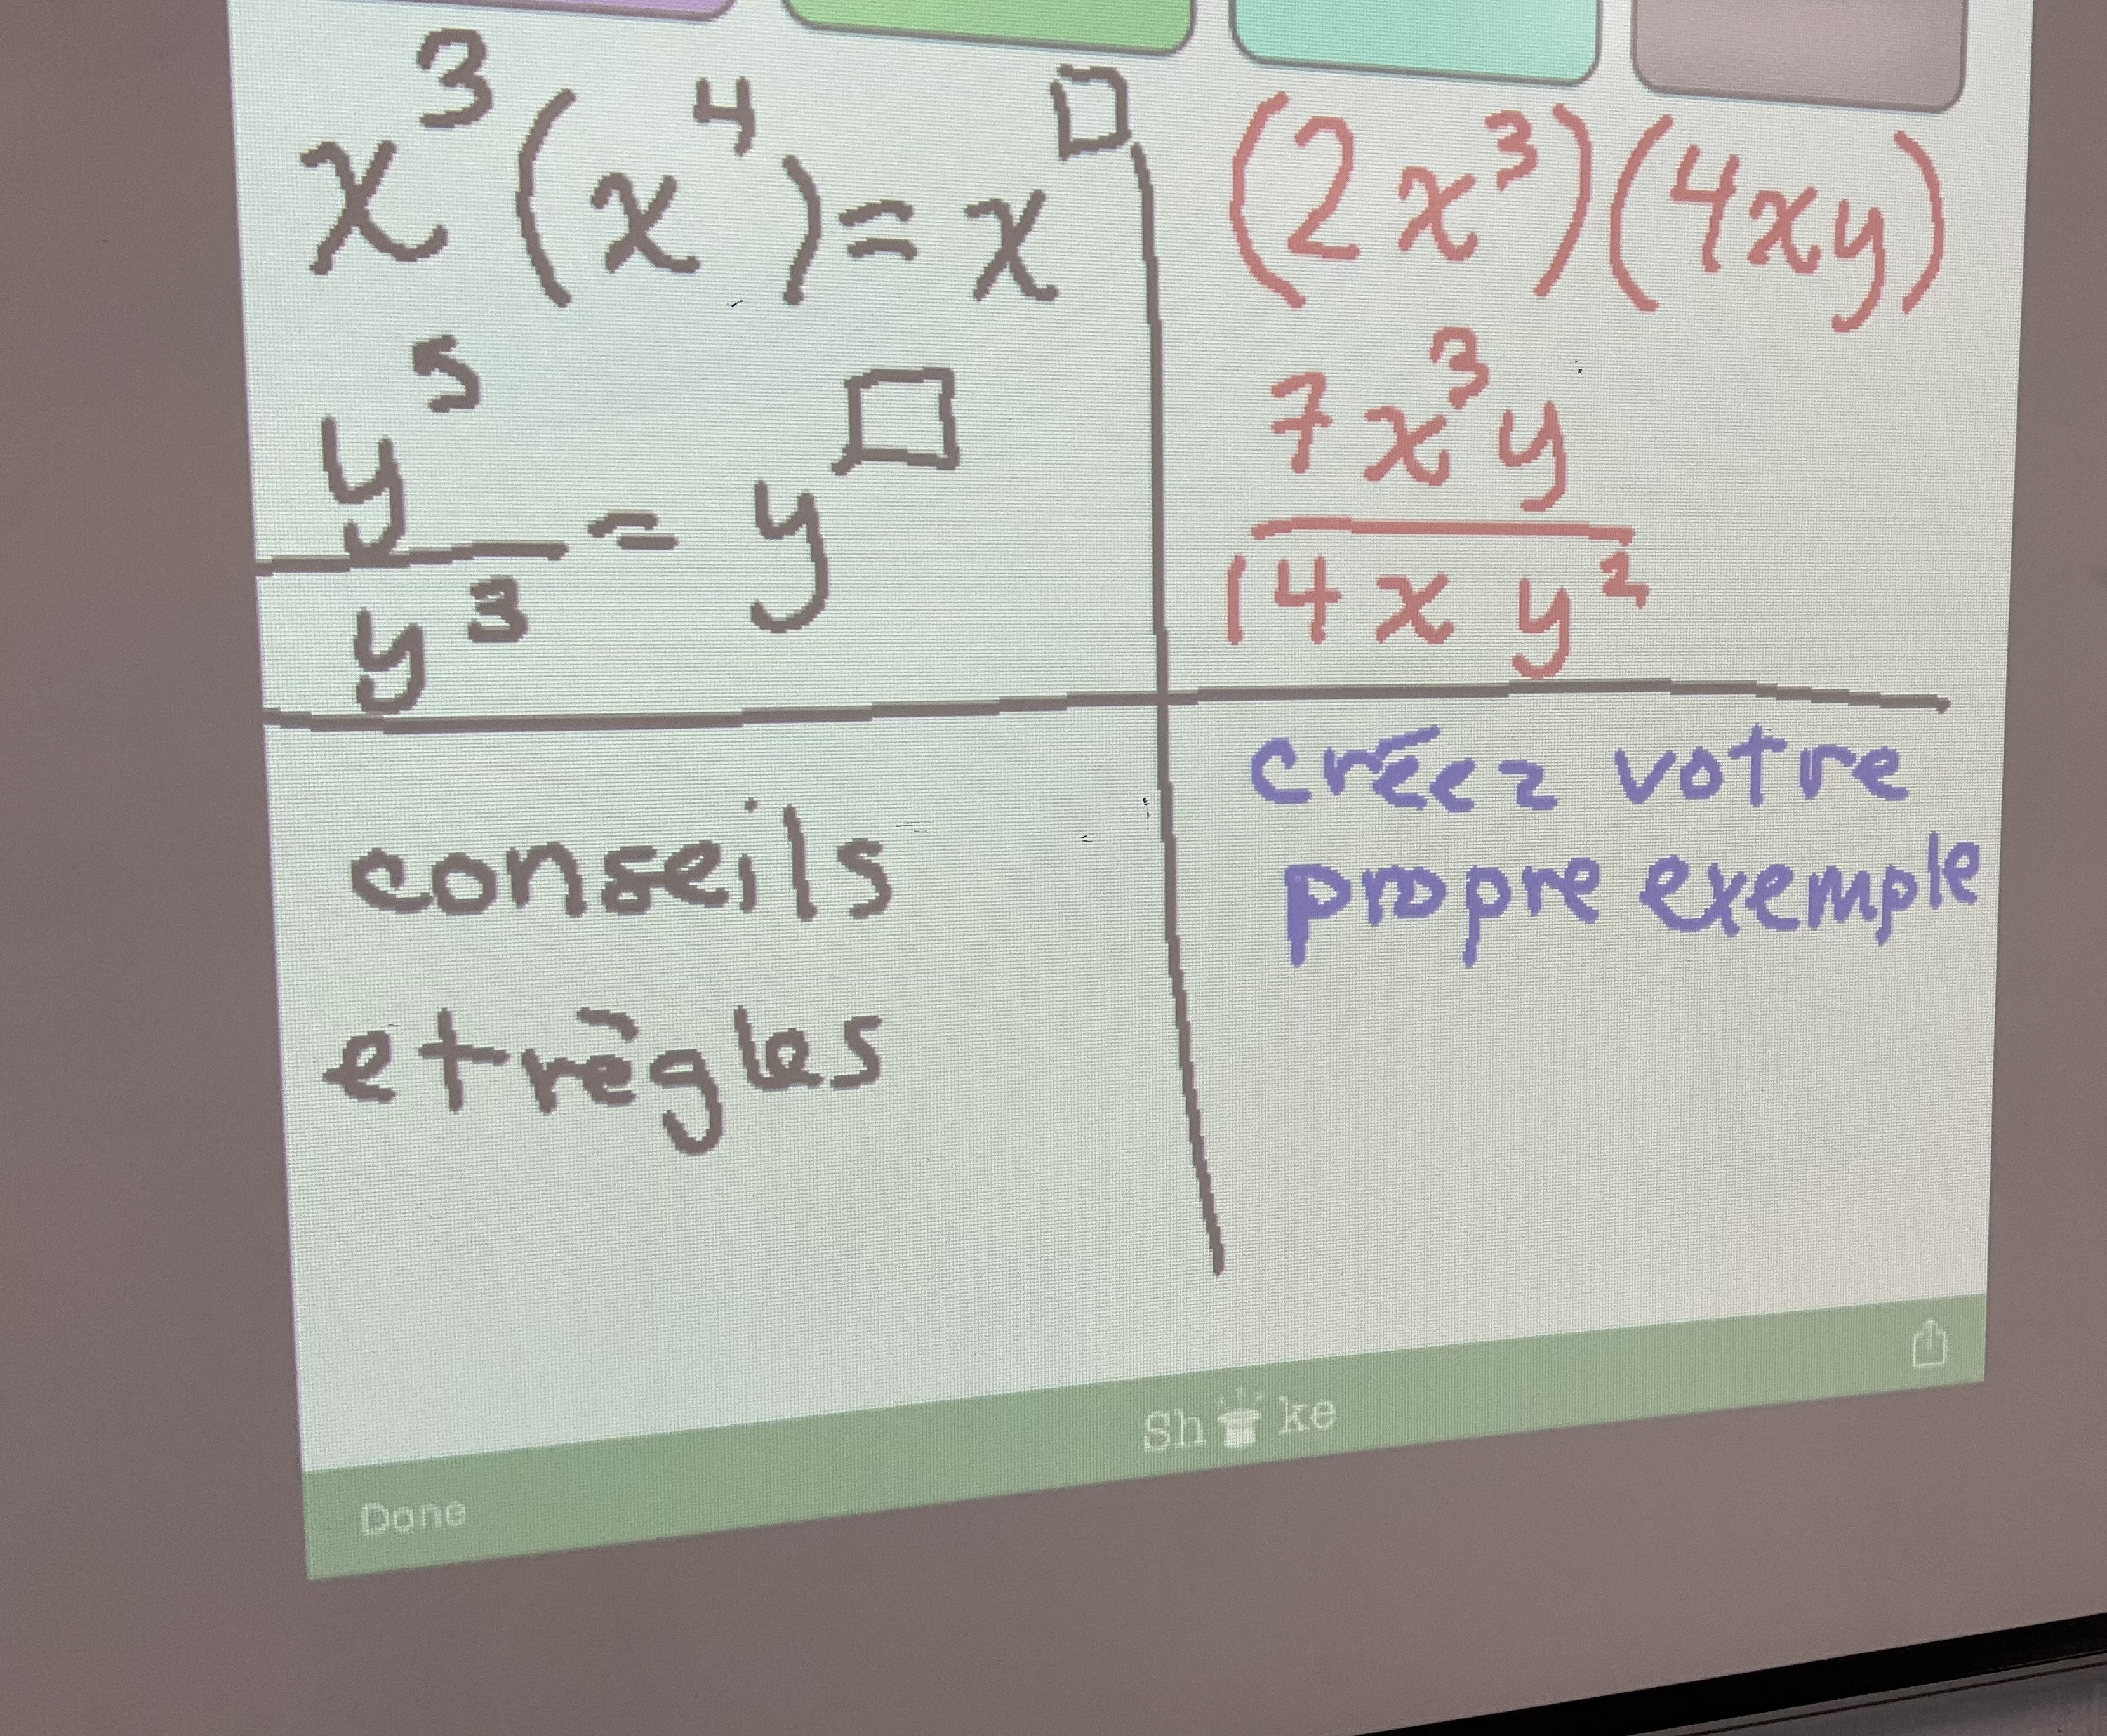
We consolidated our work, and made a note in quadrants. Students made their own examples, and we co-created a list of things to remember and write down.

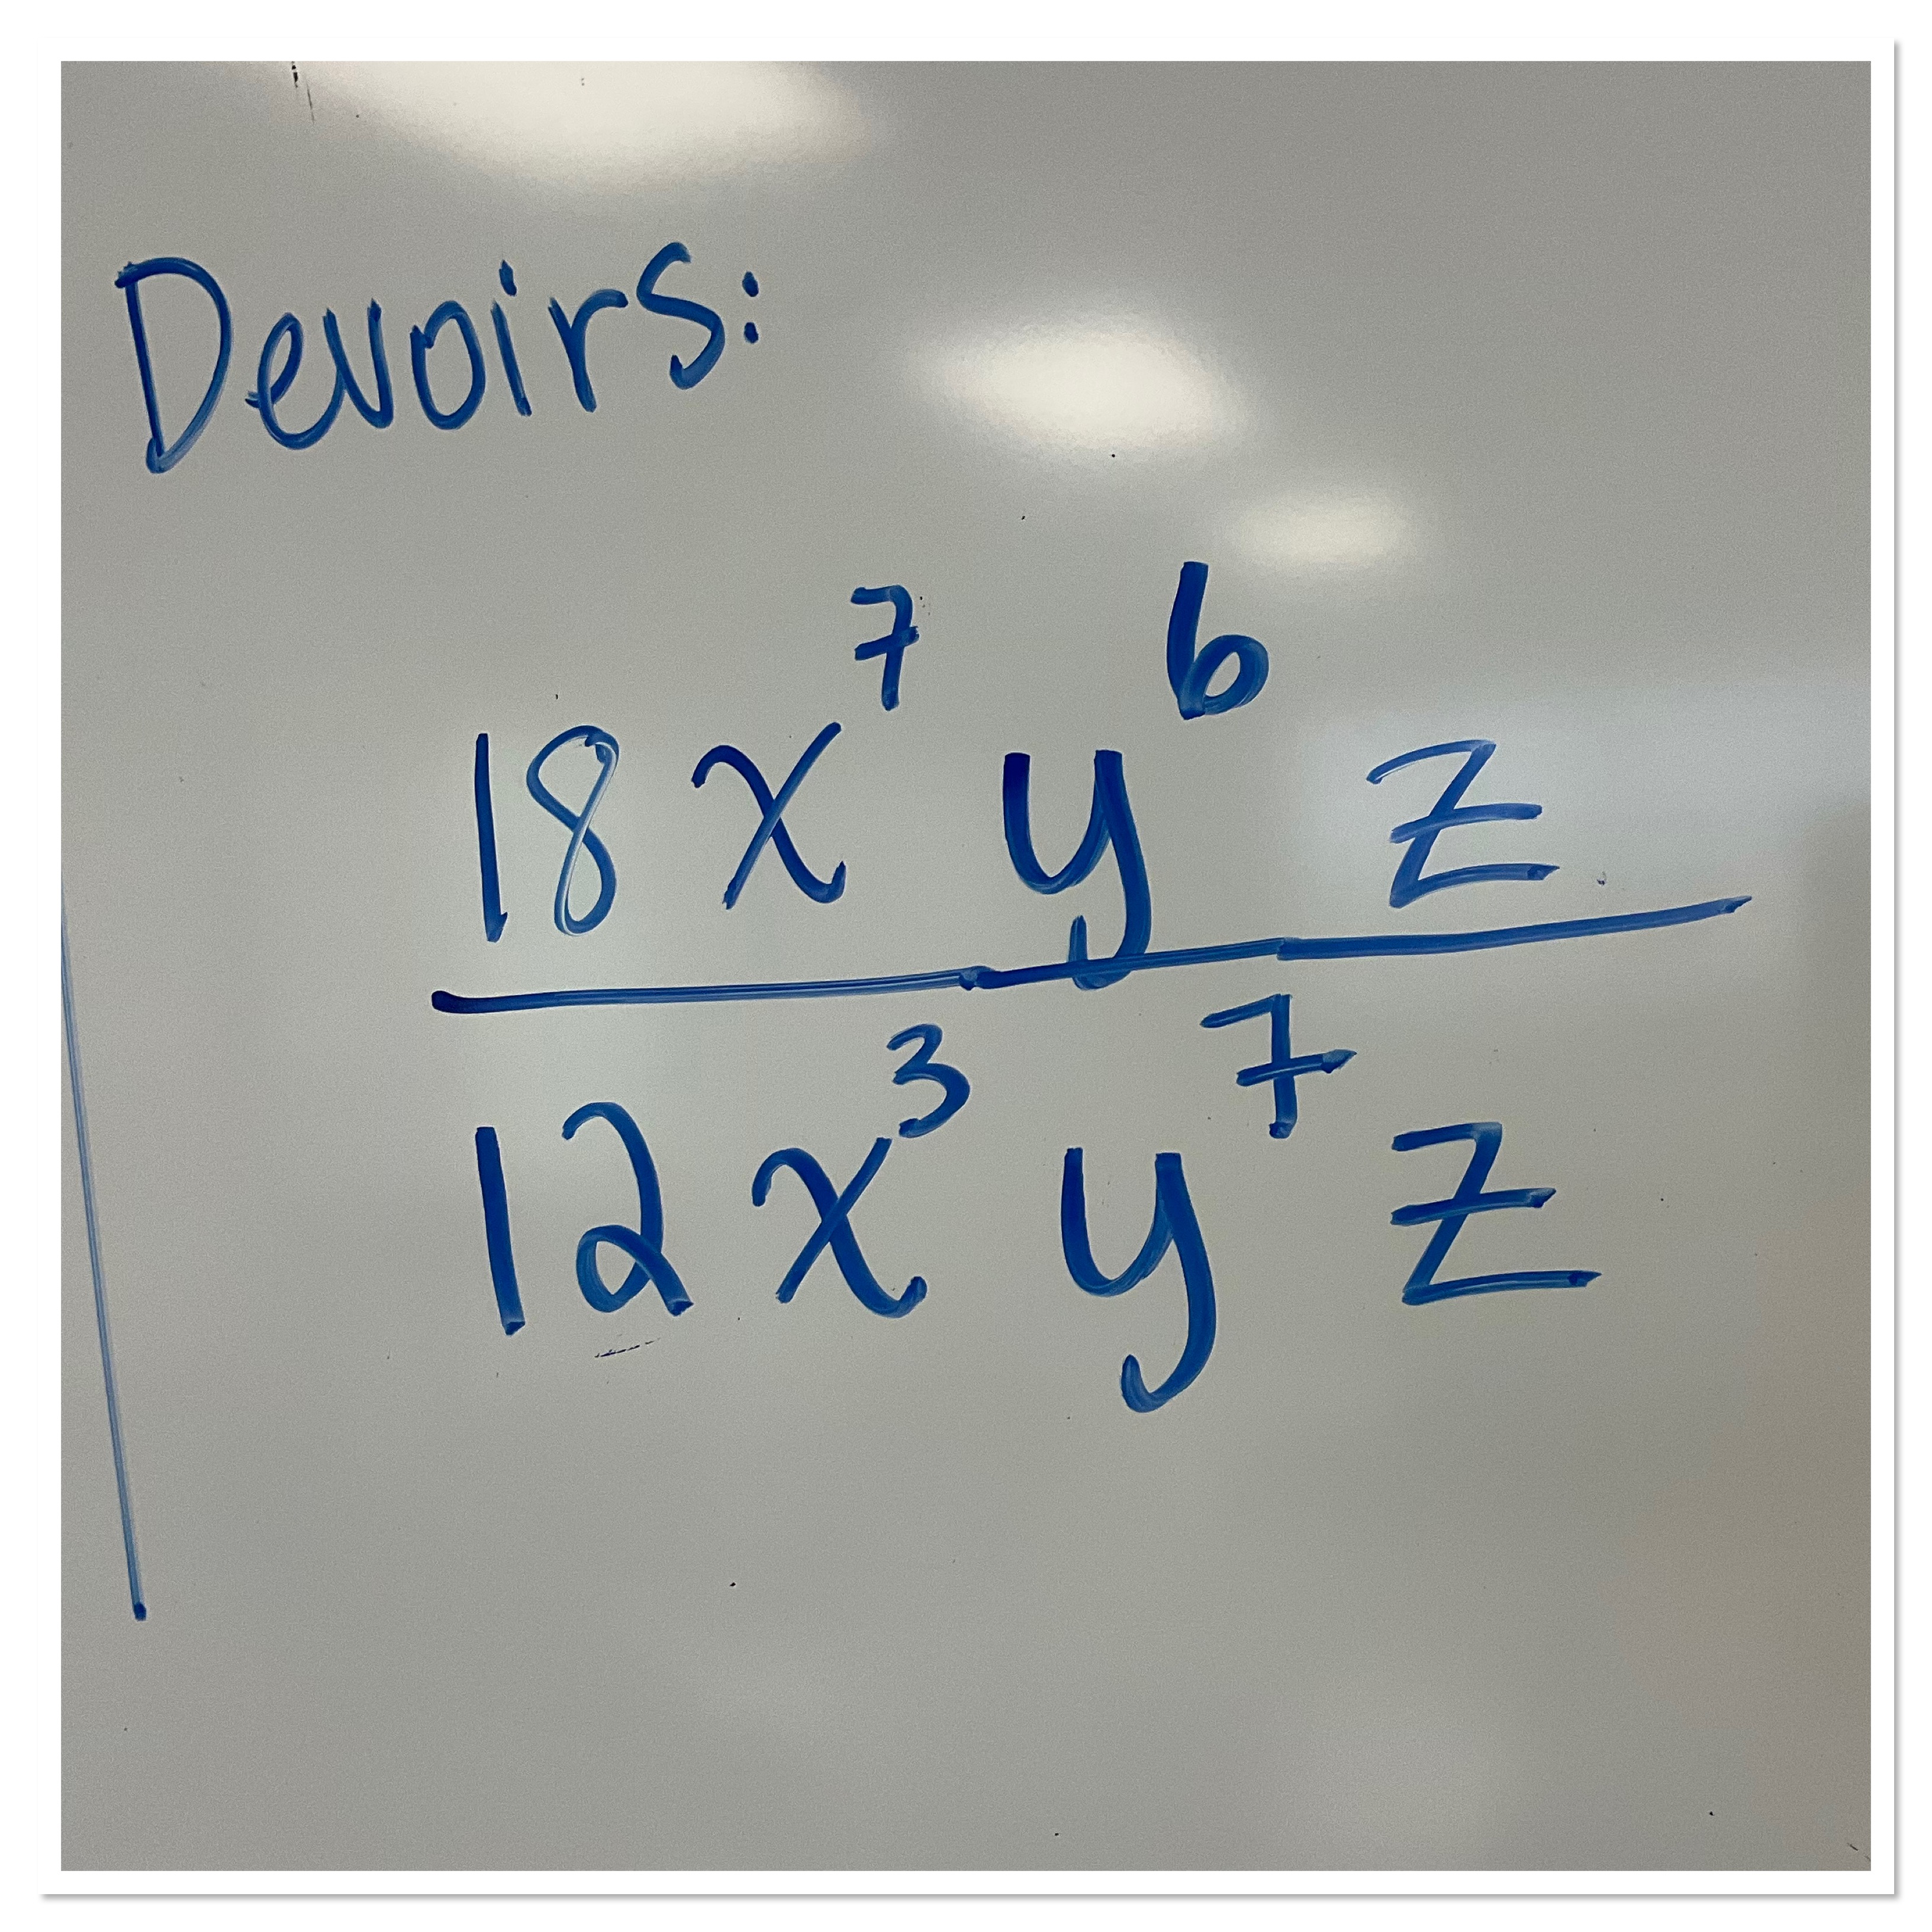
I sent a mass email to students and families with this homework task: Students should explain how to do this question tonight or over the weekend.
Exponent Laws Introduction
Today grade 9s were working hard to represent multiplication in many ways. Here’s a sequence of questions that led us to the exponent law for multiplying.
Represent 4 times 2 times 3:
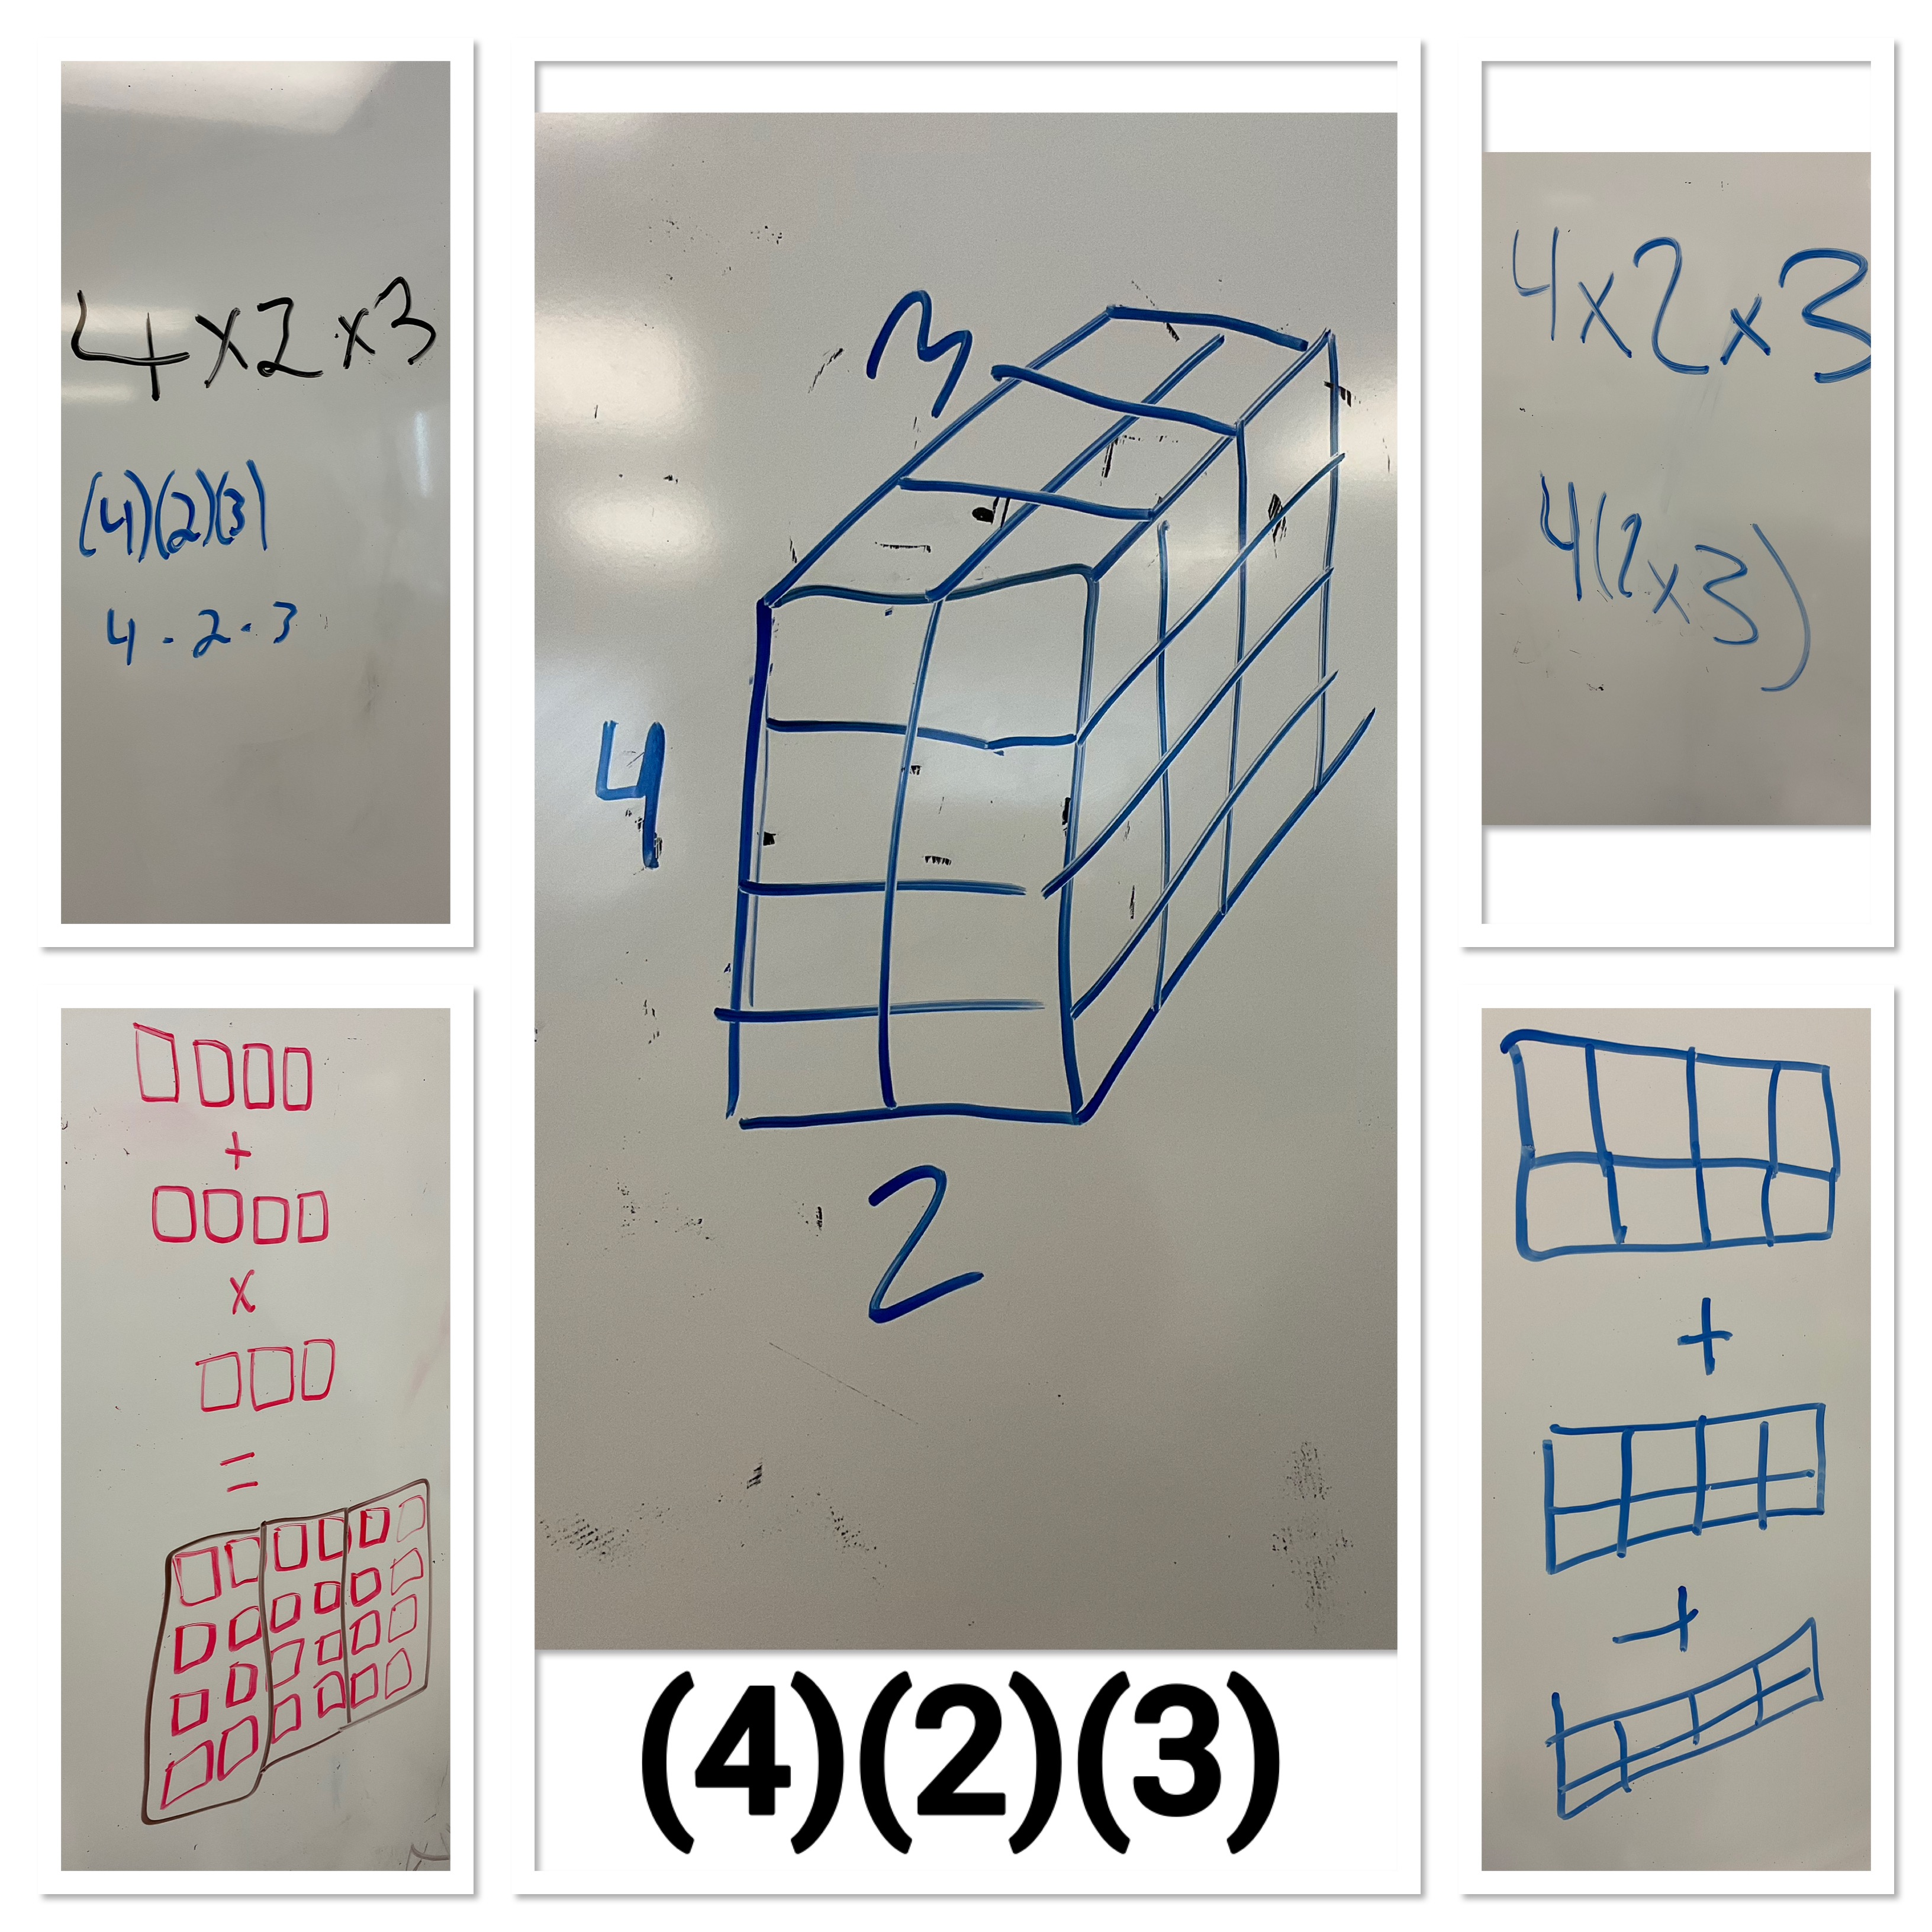
Students showed in many ways that they understood what (4)(2)(3) is.
Represent 3 squared.
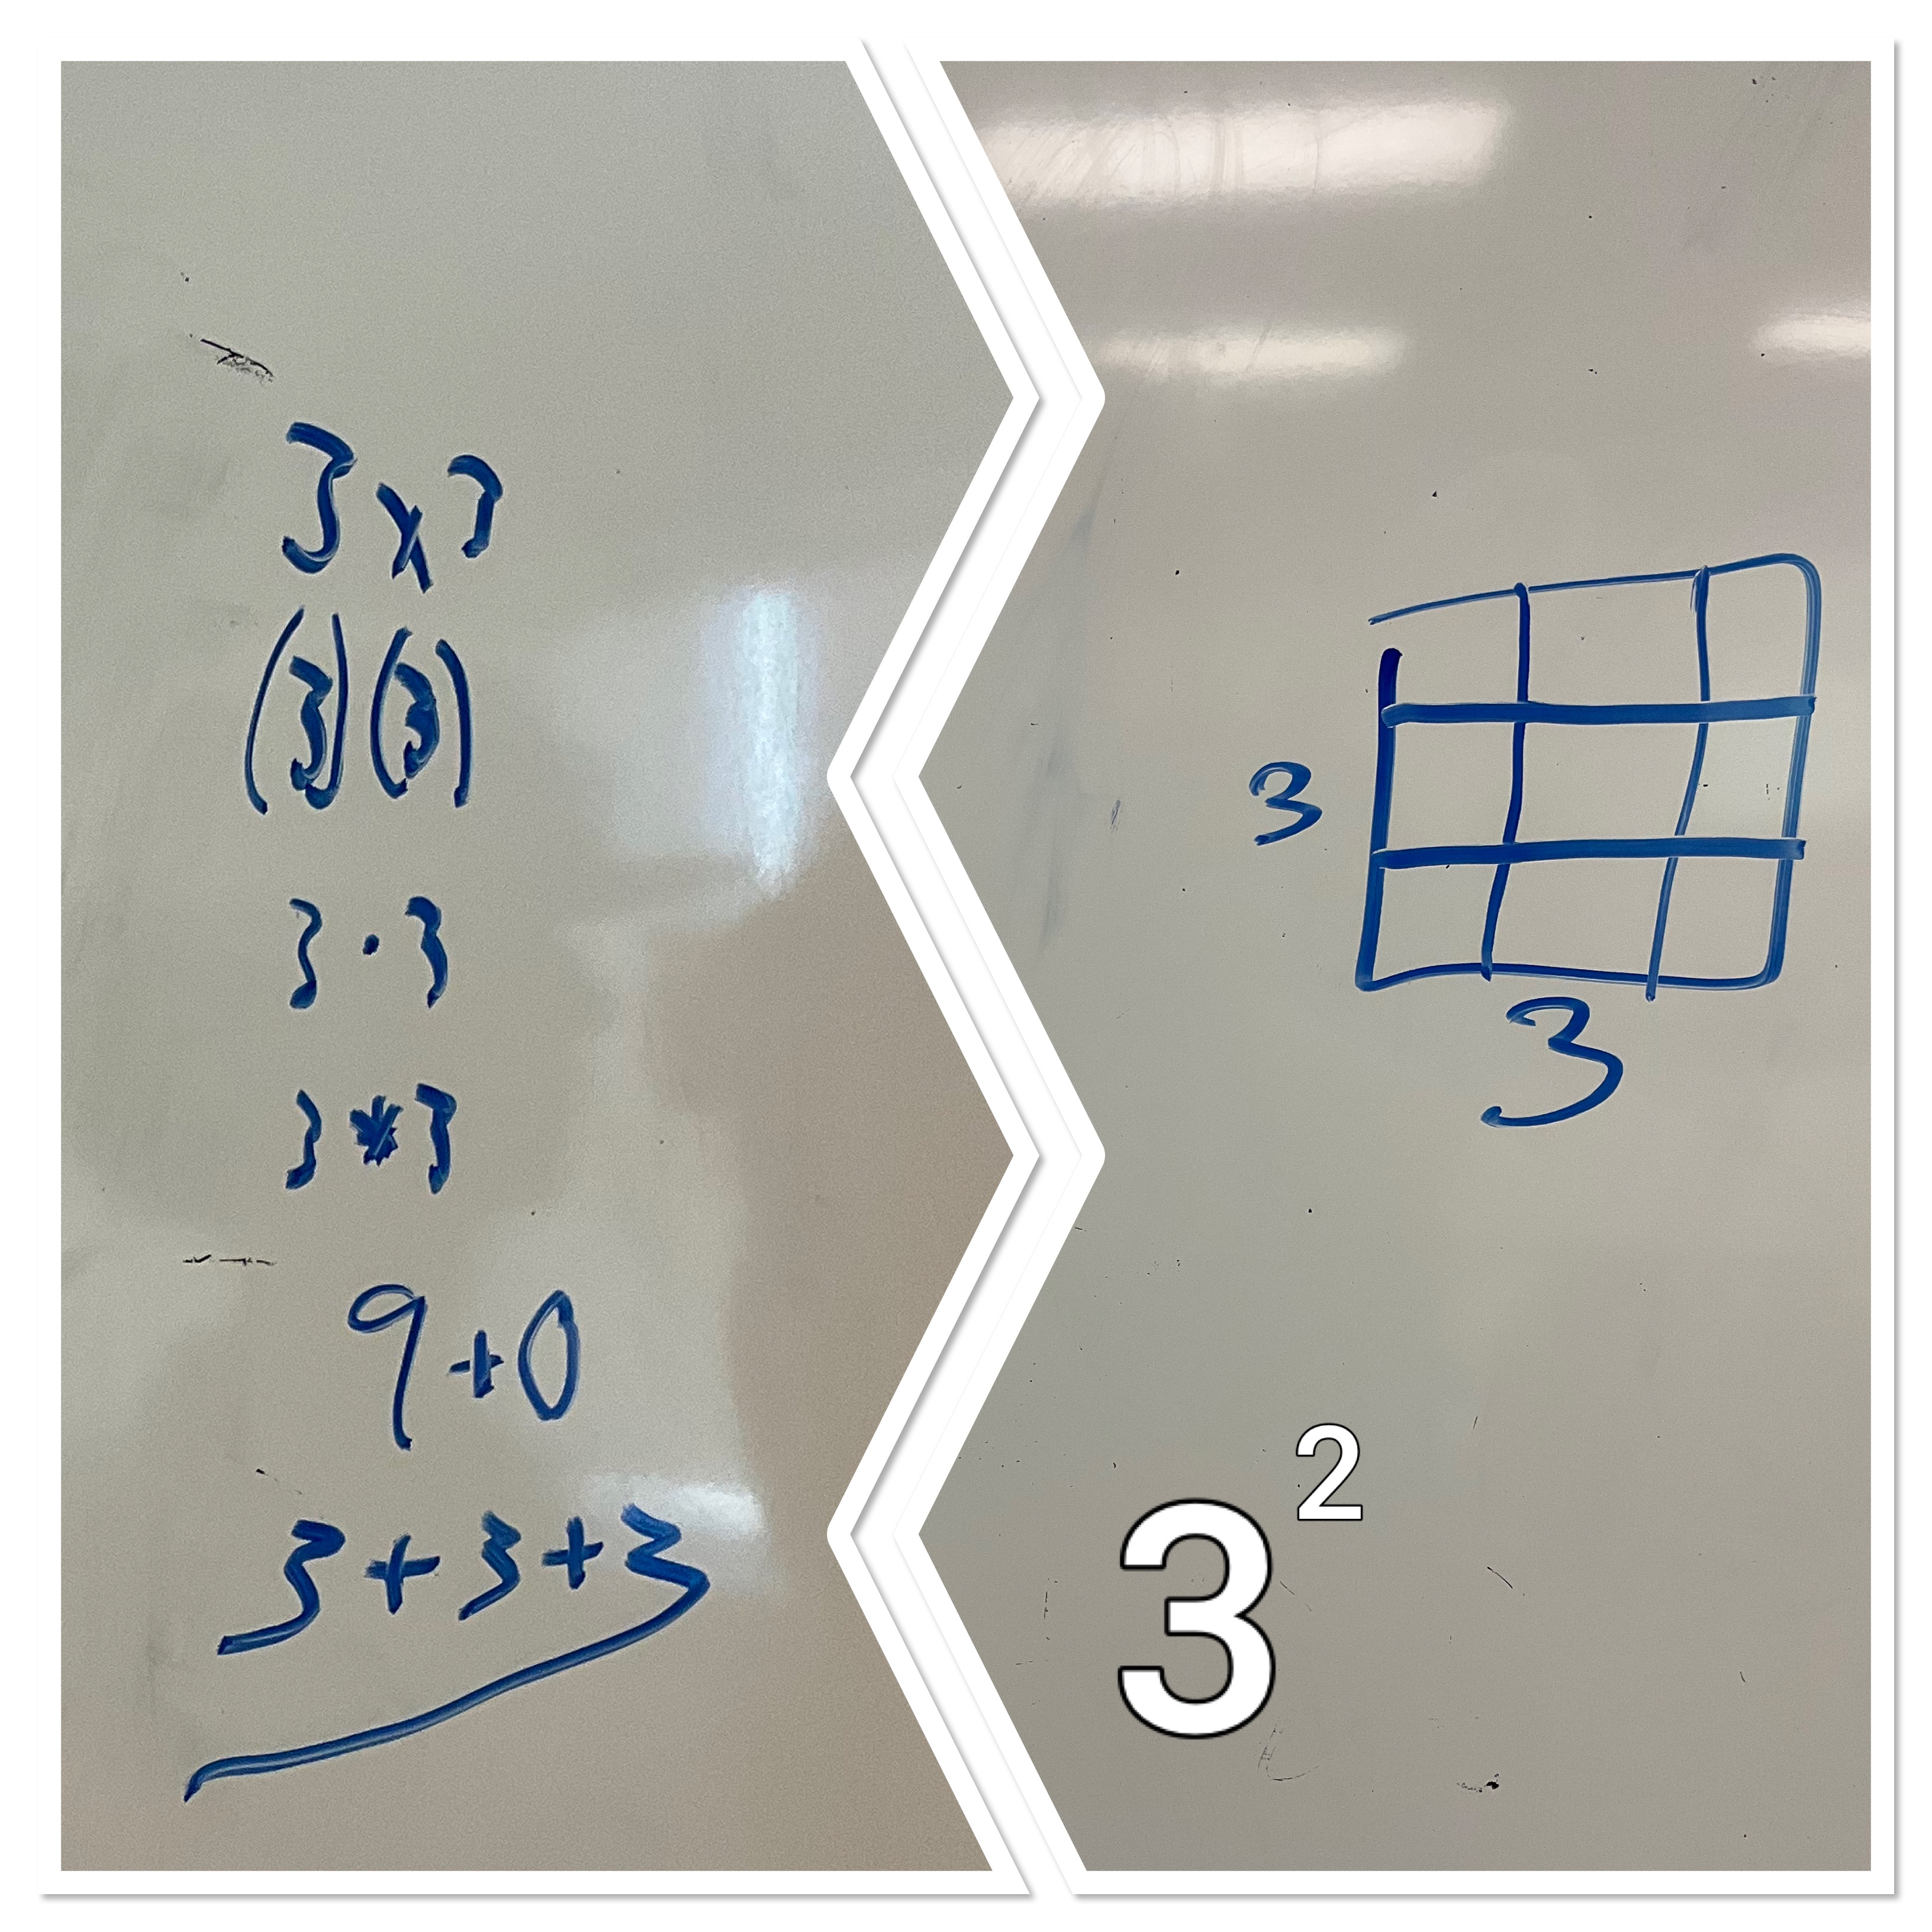
Following what we did yesterday, we know that the exponent 2 means to make a square. The side lengths are 3. We know we can write (3)(3) in many ways as well.
Represent 4 cubed:

It will take 64 little cubes to build a 4x4x4 cube.
Represent x squared.

Represent 2x^3

2(x)(x)(x) is another way to show it.
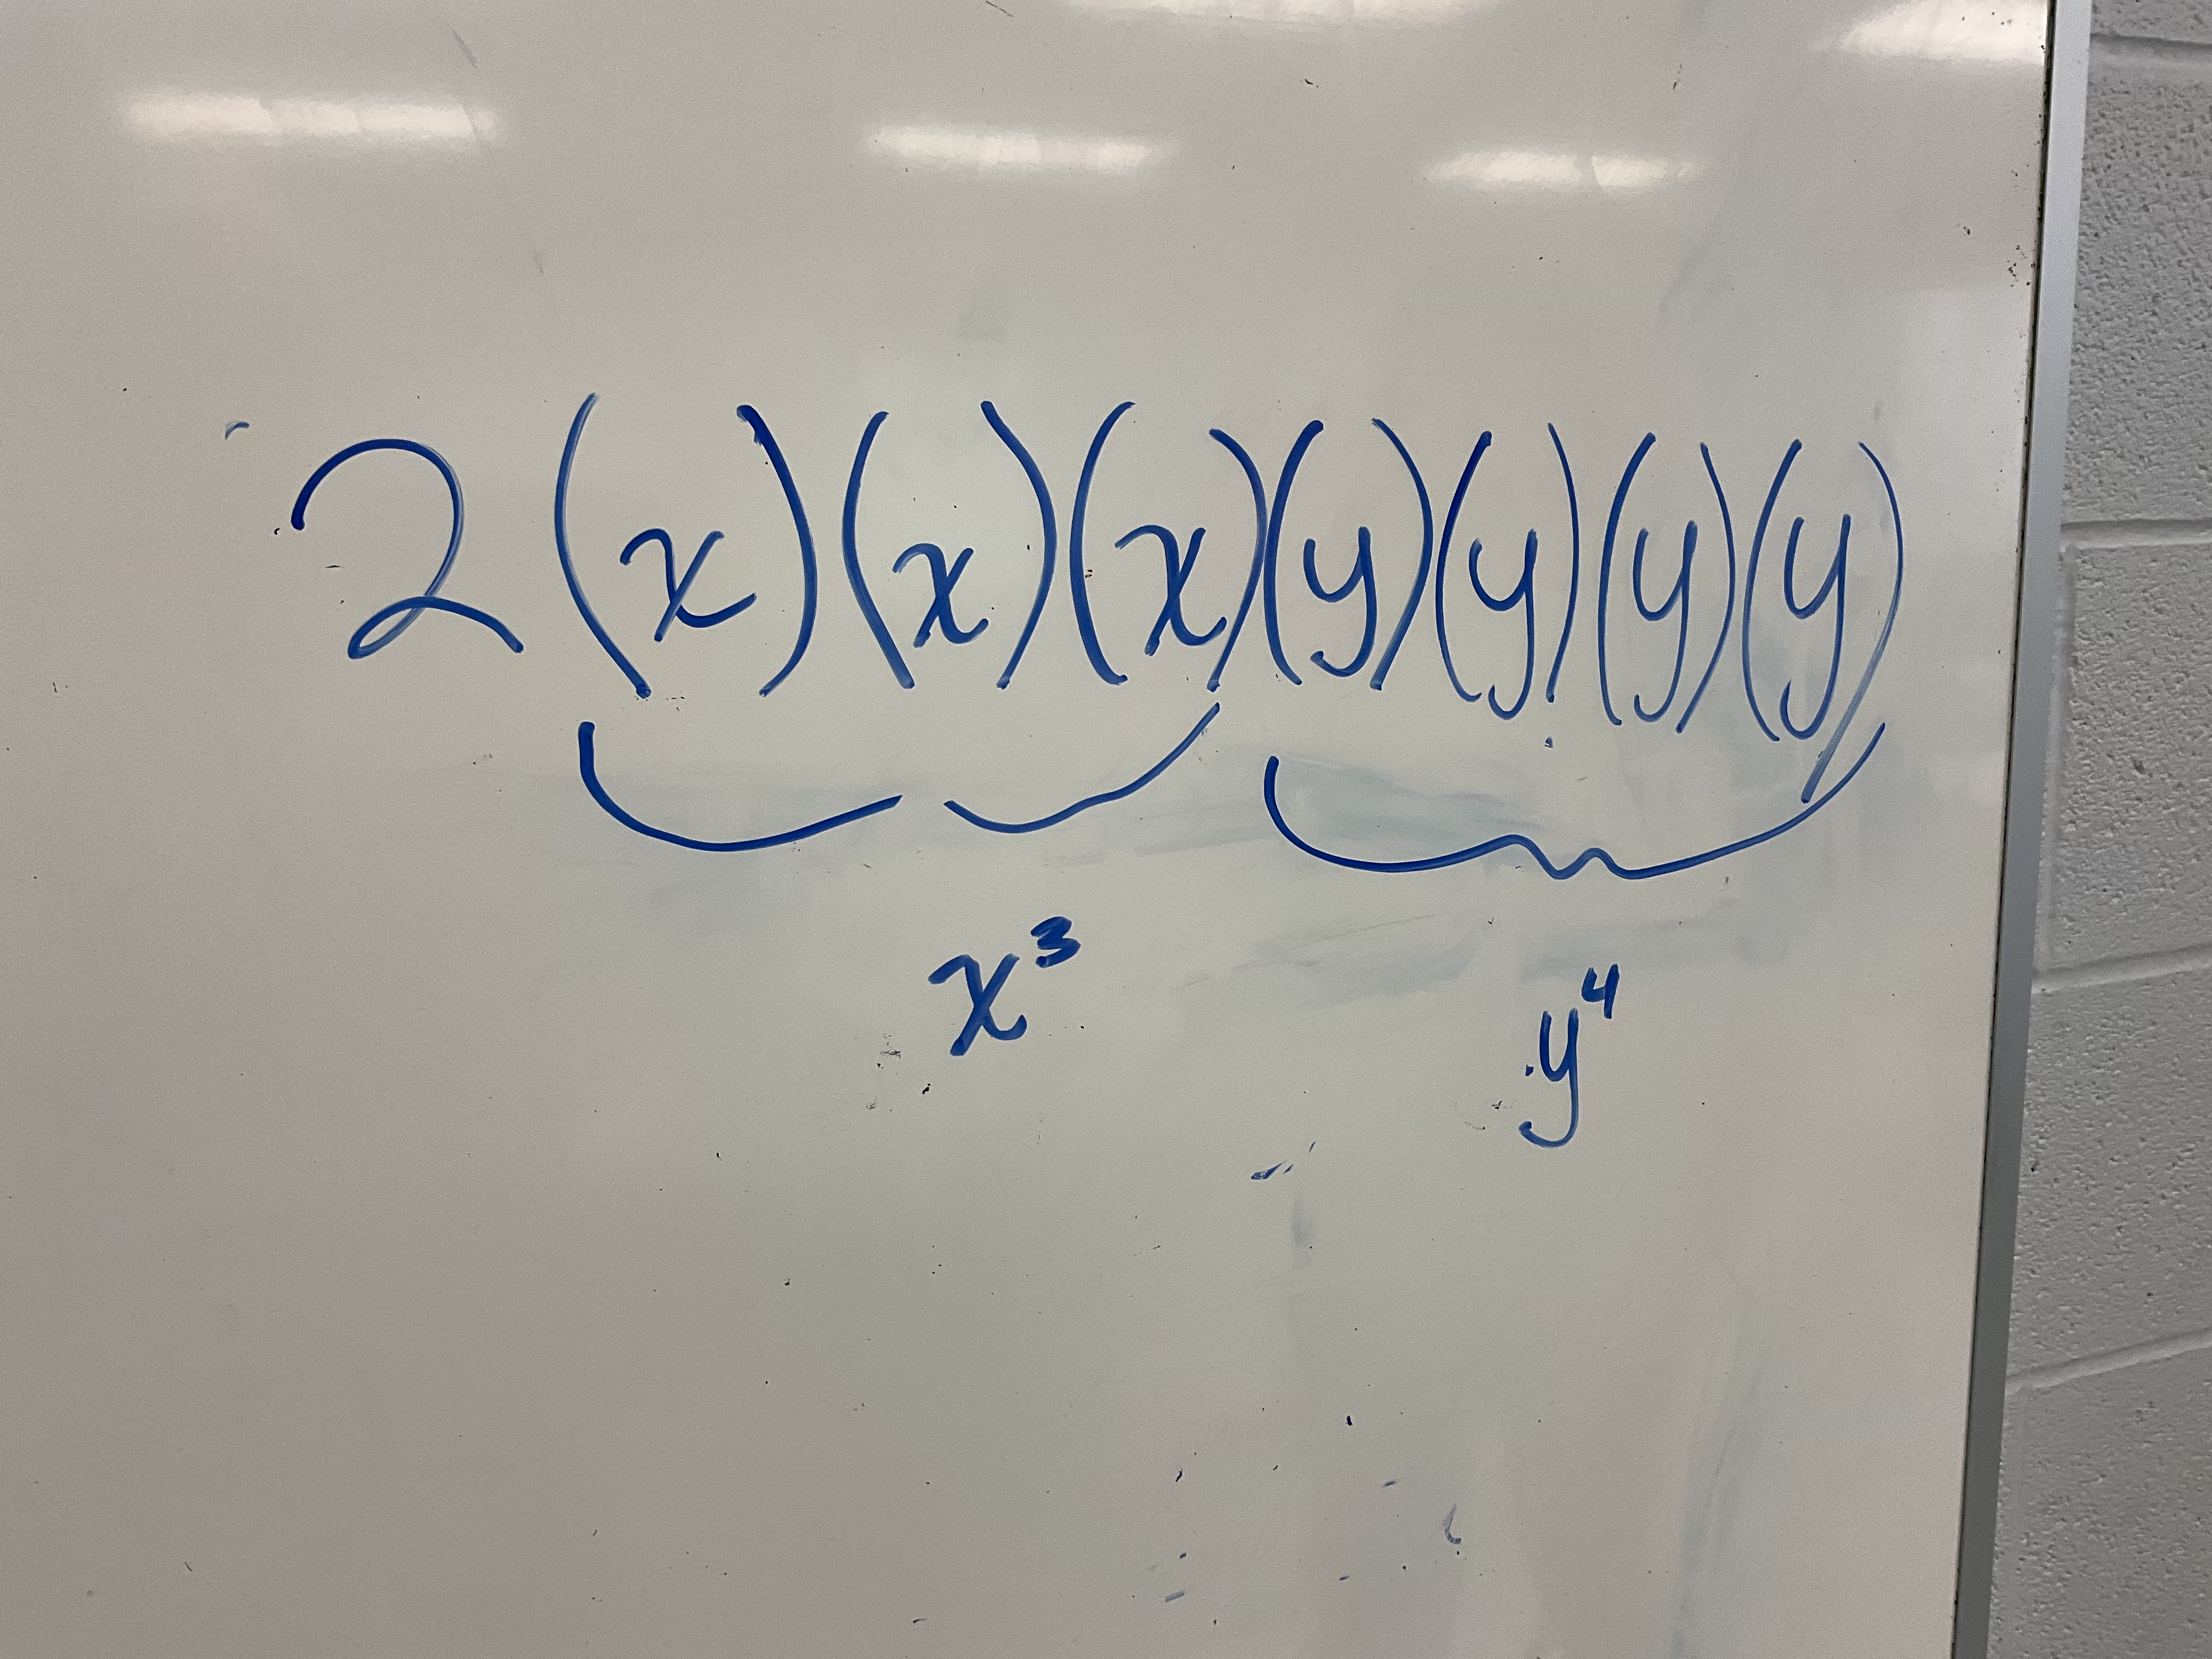
Represent 2x^3y^4
Represent 1/2x^4z^2p^3
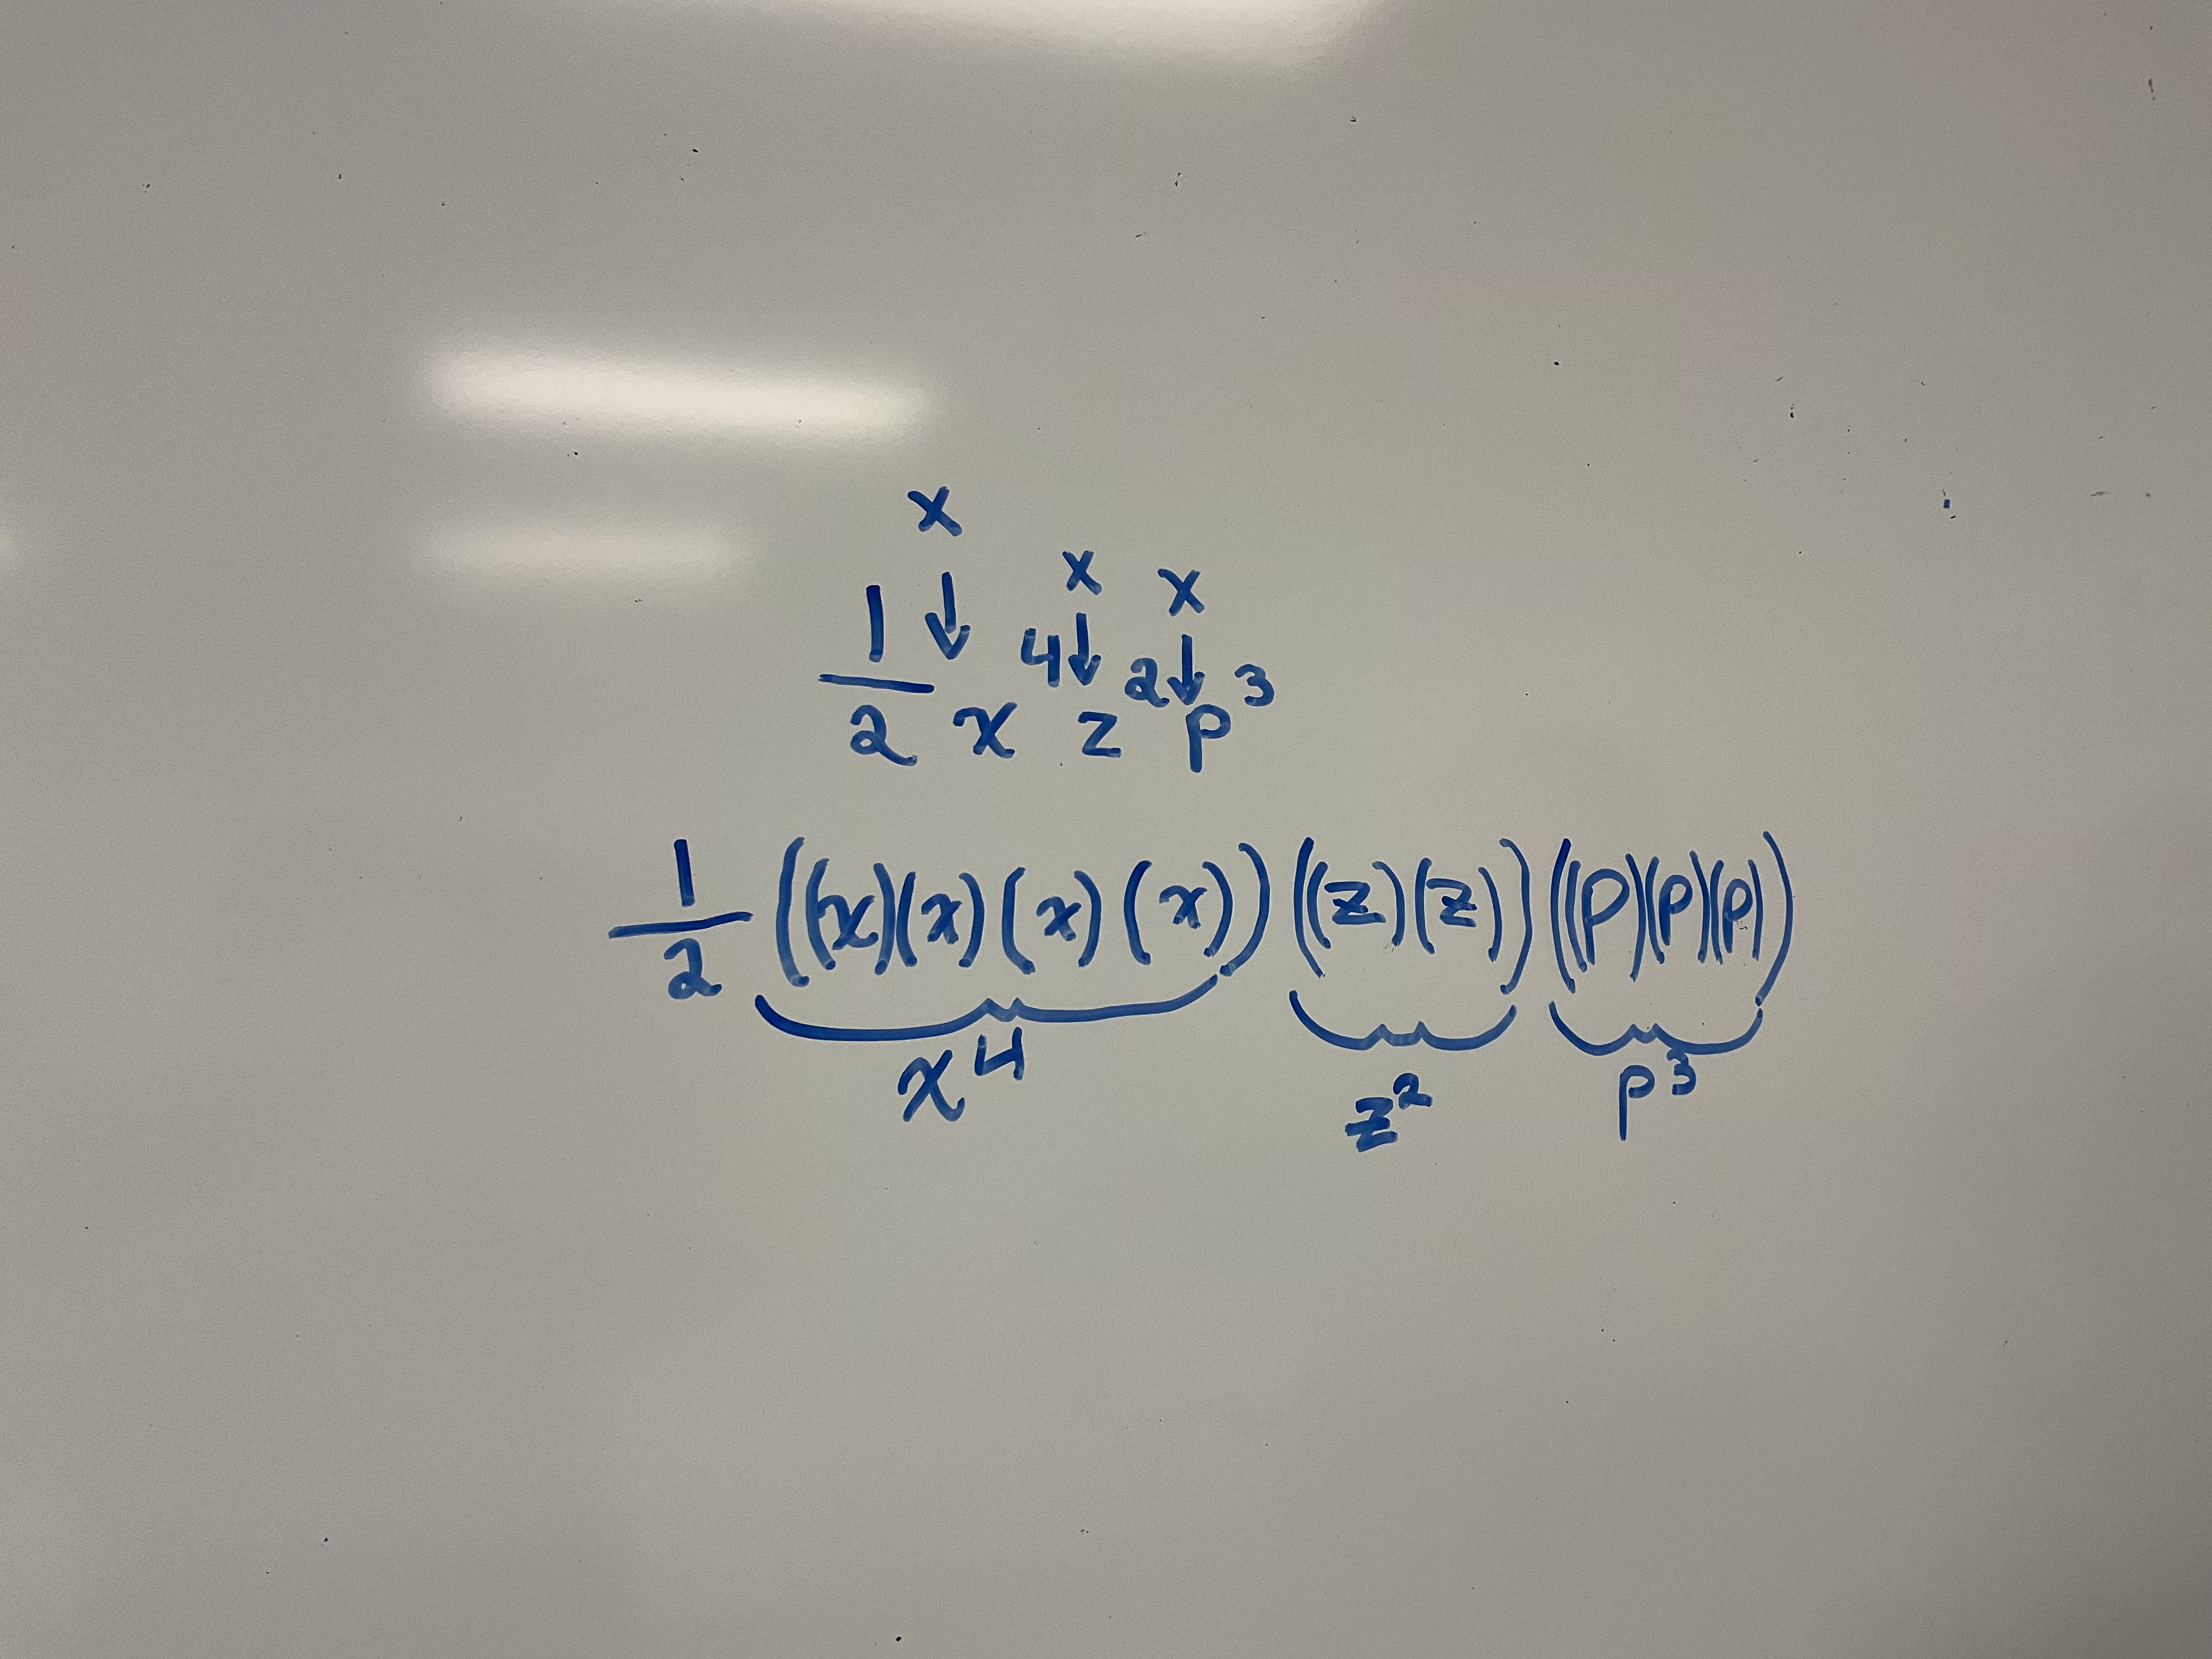
We noticed that there is a hidden multiplication between all the letters.
Represent (x^4)(x^2)(x^3)
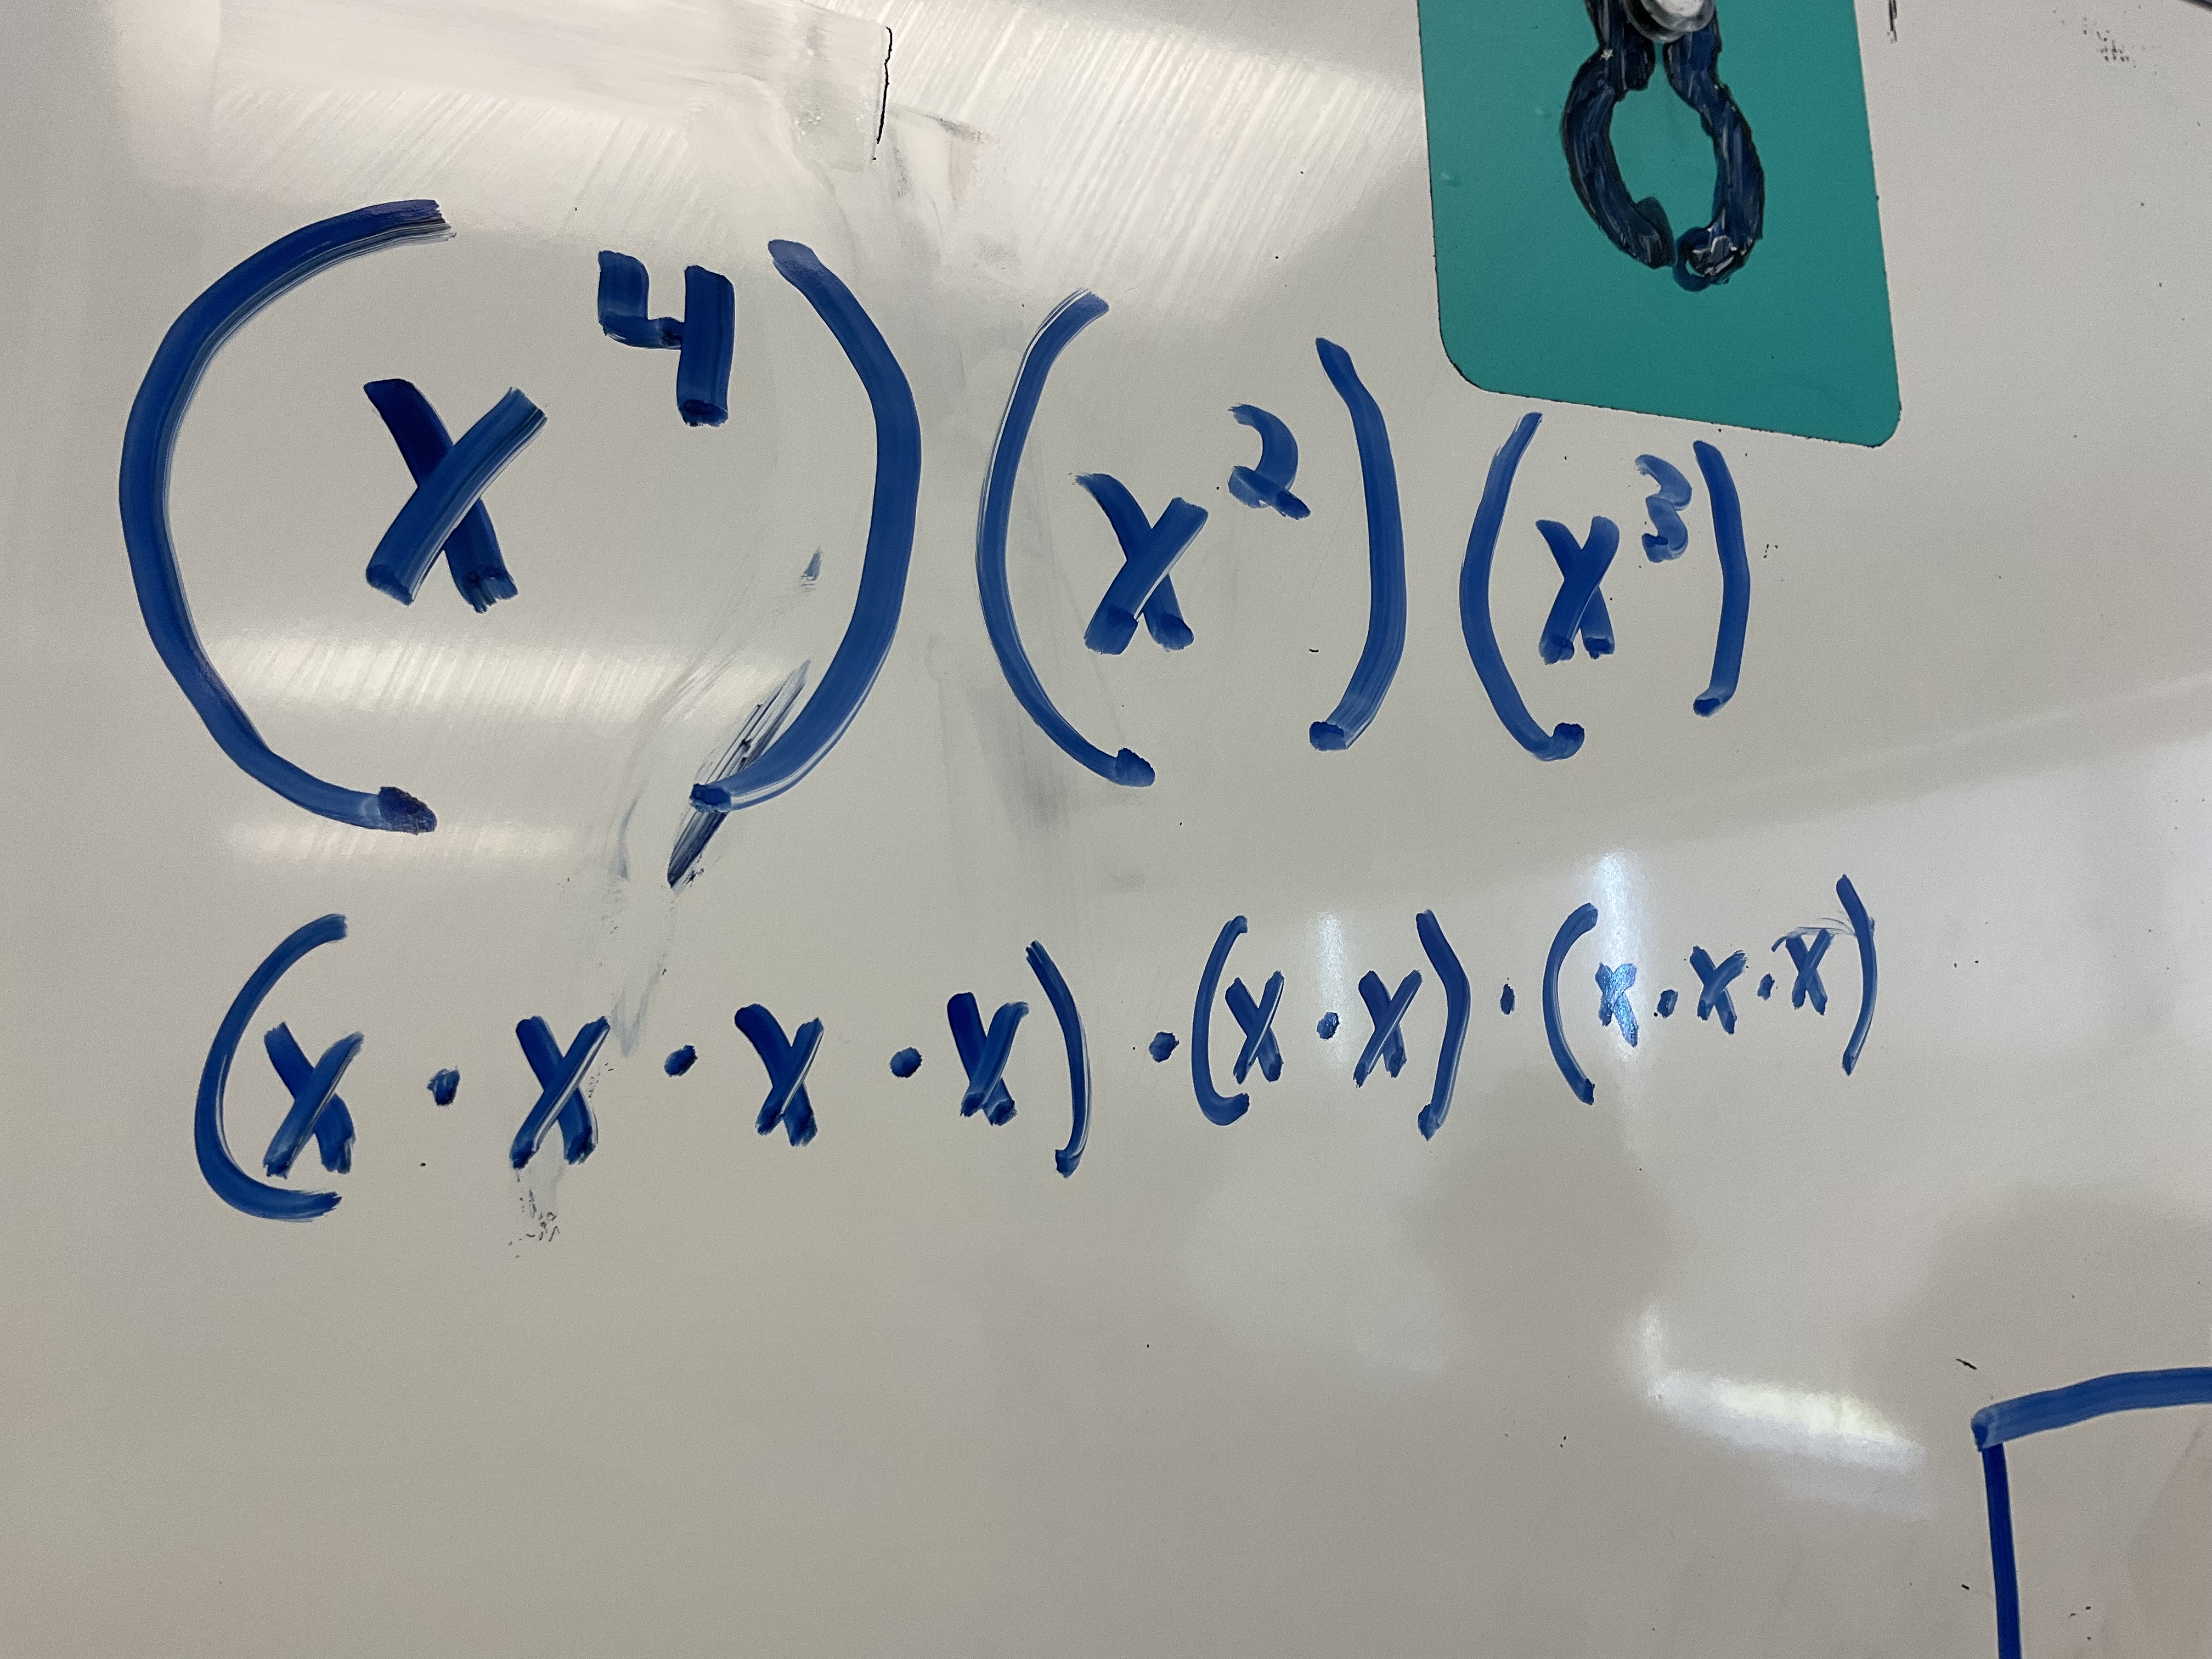
We can see so many (x) multiplied together, and we can represent this as x^9. When we multiply and the bases are the same we can add the exponents.
This next question was more challenging because we now have coefficients involved.

(-4)(x)(x)(x)(y)(y)(-2)(x)(y)(y)(y)(y)
this can be written as (-4)(-2)(x)(x)(x)(x)(y)(y)(y)(y)(y)(y) since the order doesn’t matter when we multiply.
It was a busy fun class today! Well done grade 9s.
Representing Exponents
Today my grade 9 class built exponent models using toothpicks and plasticine. The mild version included x^2, x^3, 2x^2, 2x^3, (2x)^2, (2x)^3, 1/2x^2 and (1/2)^2.

The x is a toothpick, so x^2 is a square (x by x). We made connections between the exponent being a 2 meaning we build a square, and if the exponent is 3 we build a cube. The base of the exponent represents the side length of the cube or square, and the coefficient will tell you how many to build.

We had a very carefully prepared (2x)^3. We can clearly see that it is made up of 8 little x cubes. This helps us see that if we double the side length of a cube, the volume will be multiplied by 8 (2^3=8). In the same photo you can see a (2x)^2 which helps us see that there are 4 x squares in it. When the side length of a square is doubled, the area is multiplied by a factor of 4 (2^2=4).
We moved on to a spicy concept circle, including skewers for y and toothpicks for x.
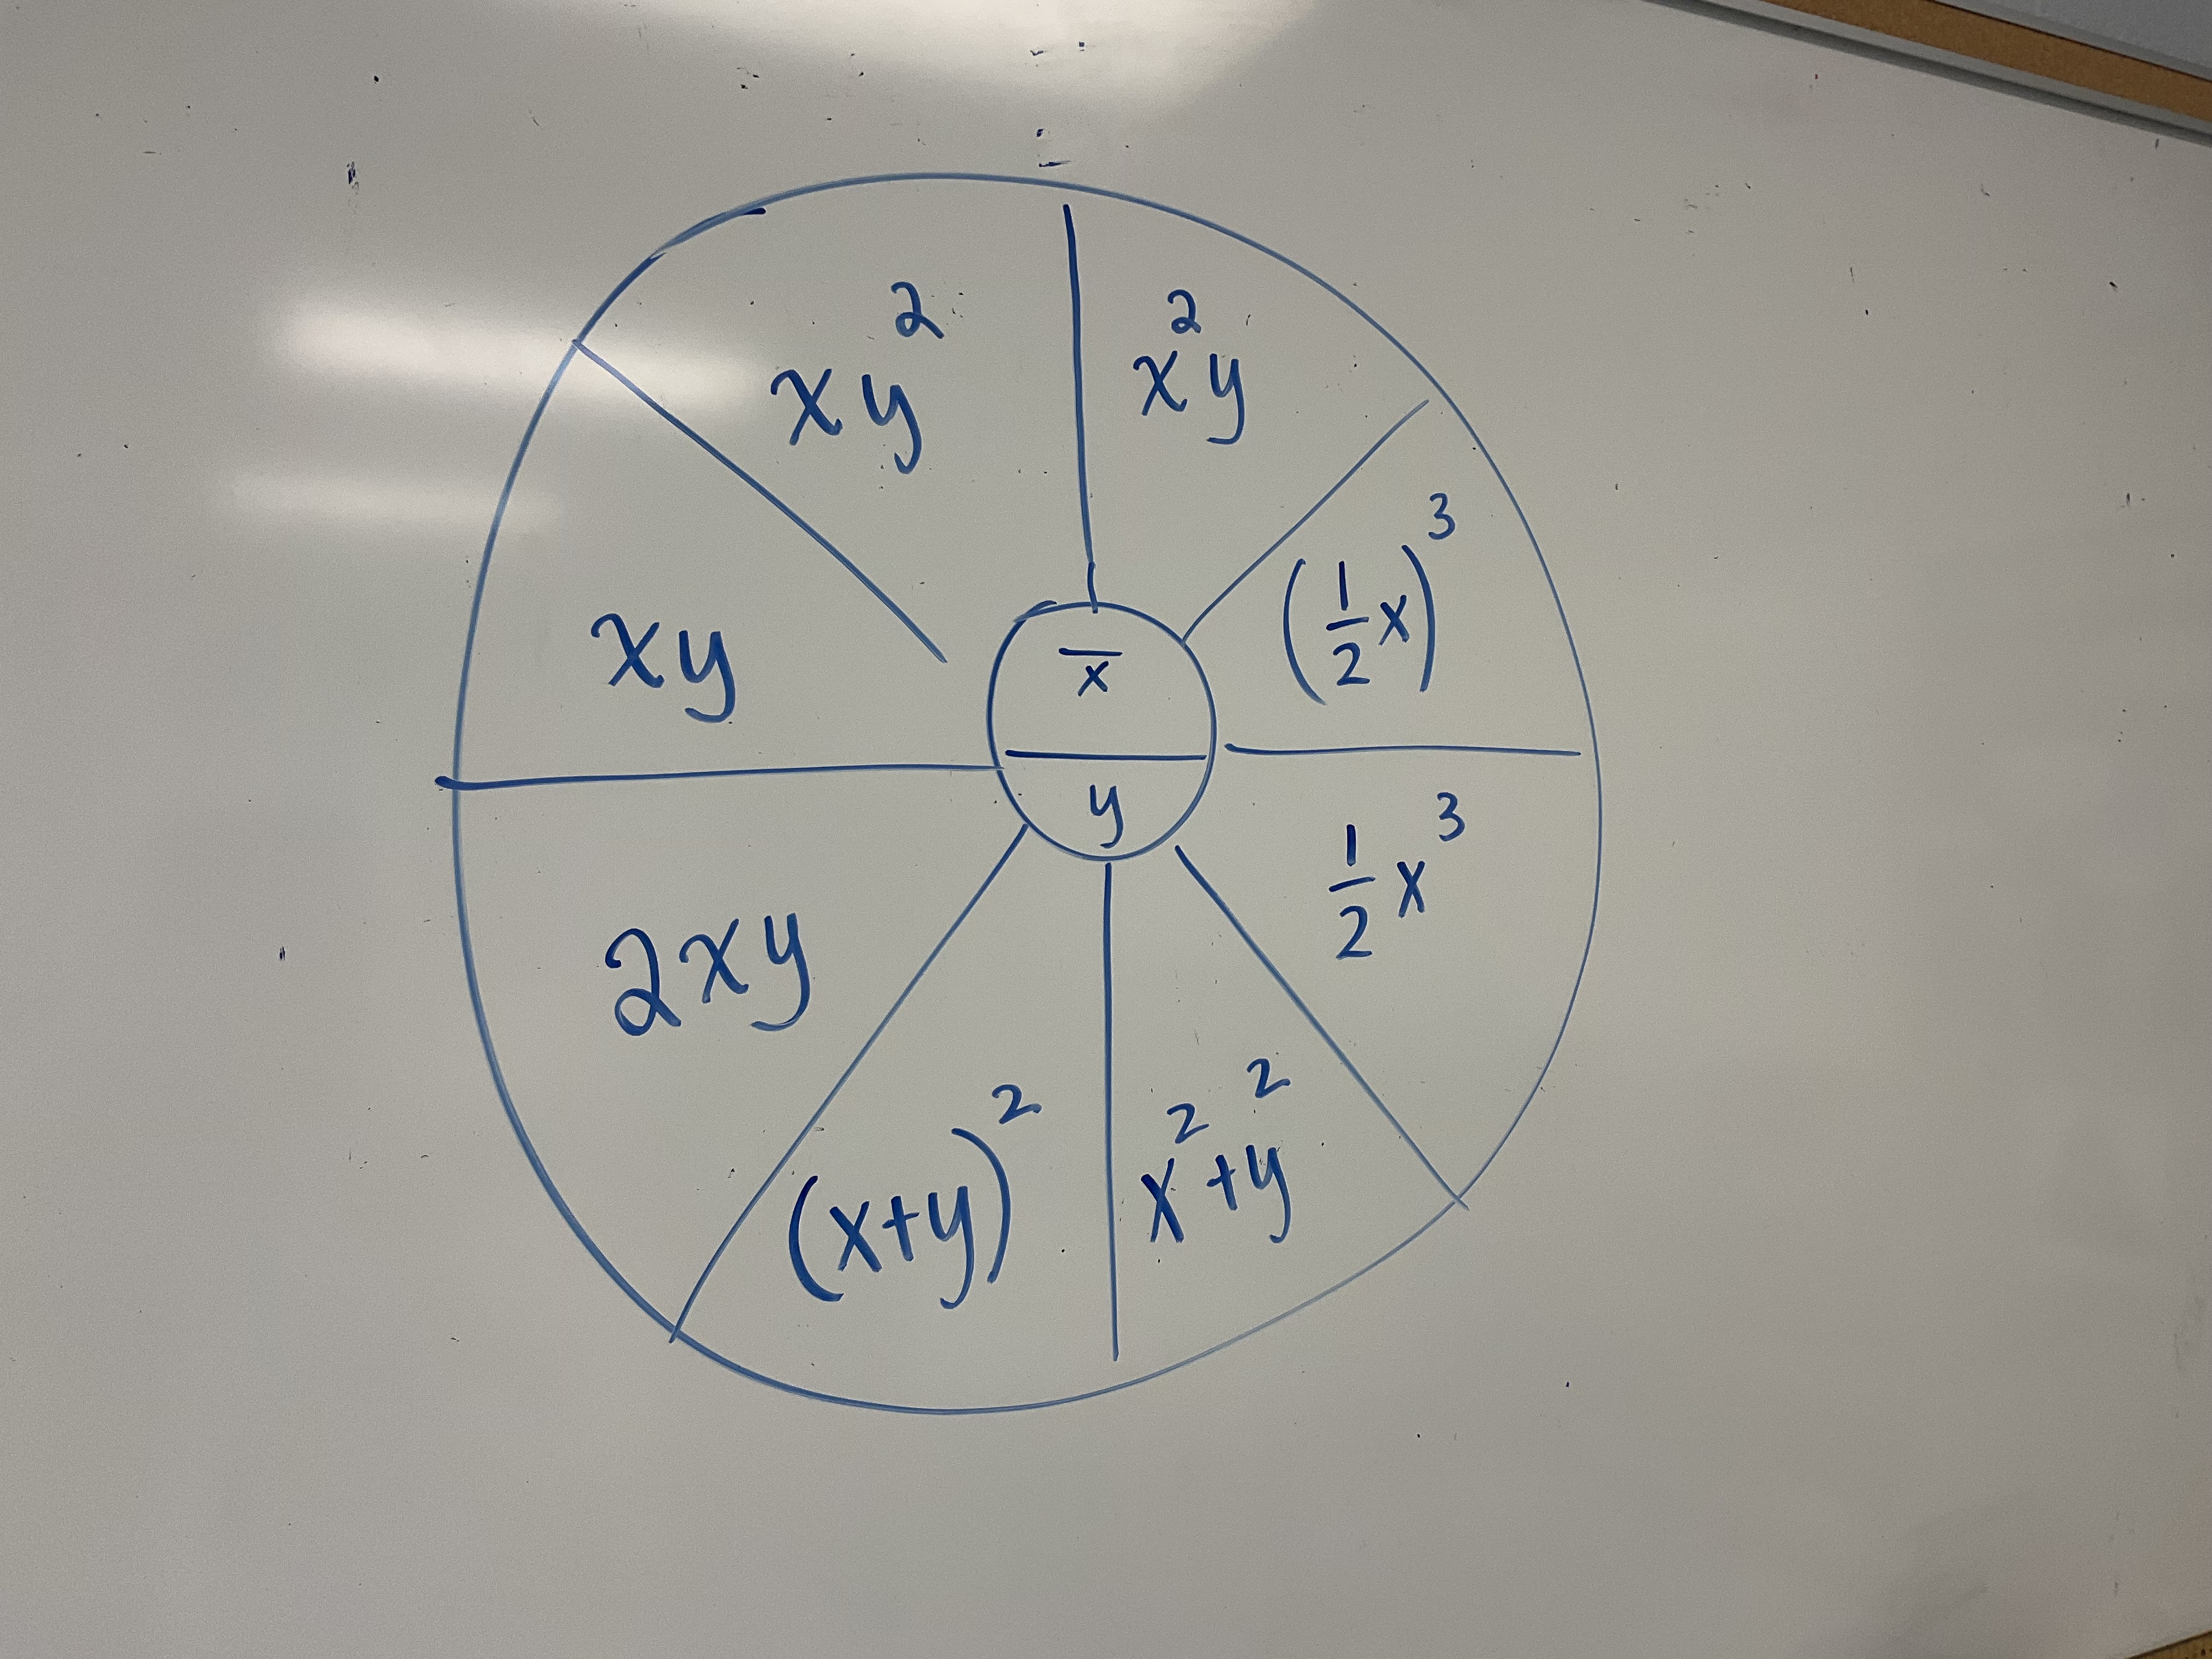
We had some interesting conversations about where to start. Some groups gravitated to the (x+y)^2 since they knew they were making a square with side lengths of (x+y).

We were able to split up the (x+y)^2 into x^2+y^2+2xy. We also showed that (x+y)^2 is NOT equal to x^2+y^2.
Other groups got into building the rectangular prisms with dimensions (x)(y)(y) or (x)(x)(y)

We noticed that an x^2y and an xy^2 were not the same. We could identify which was which based on the square that we saw. This one in the picture is an xy^2 since we see the skewers making a square.
I think we had many lightbulb moments today as we explored what exponents mean. We will continue exploring exponents for the next few days as we look at exponent laws.
Distributive Property
Today several grade 9 classes were working on the distributive property and how that applies to multiplying monomials by binomials.
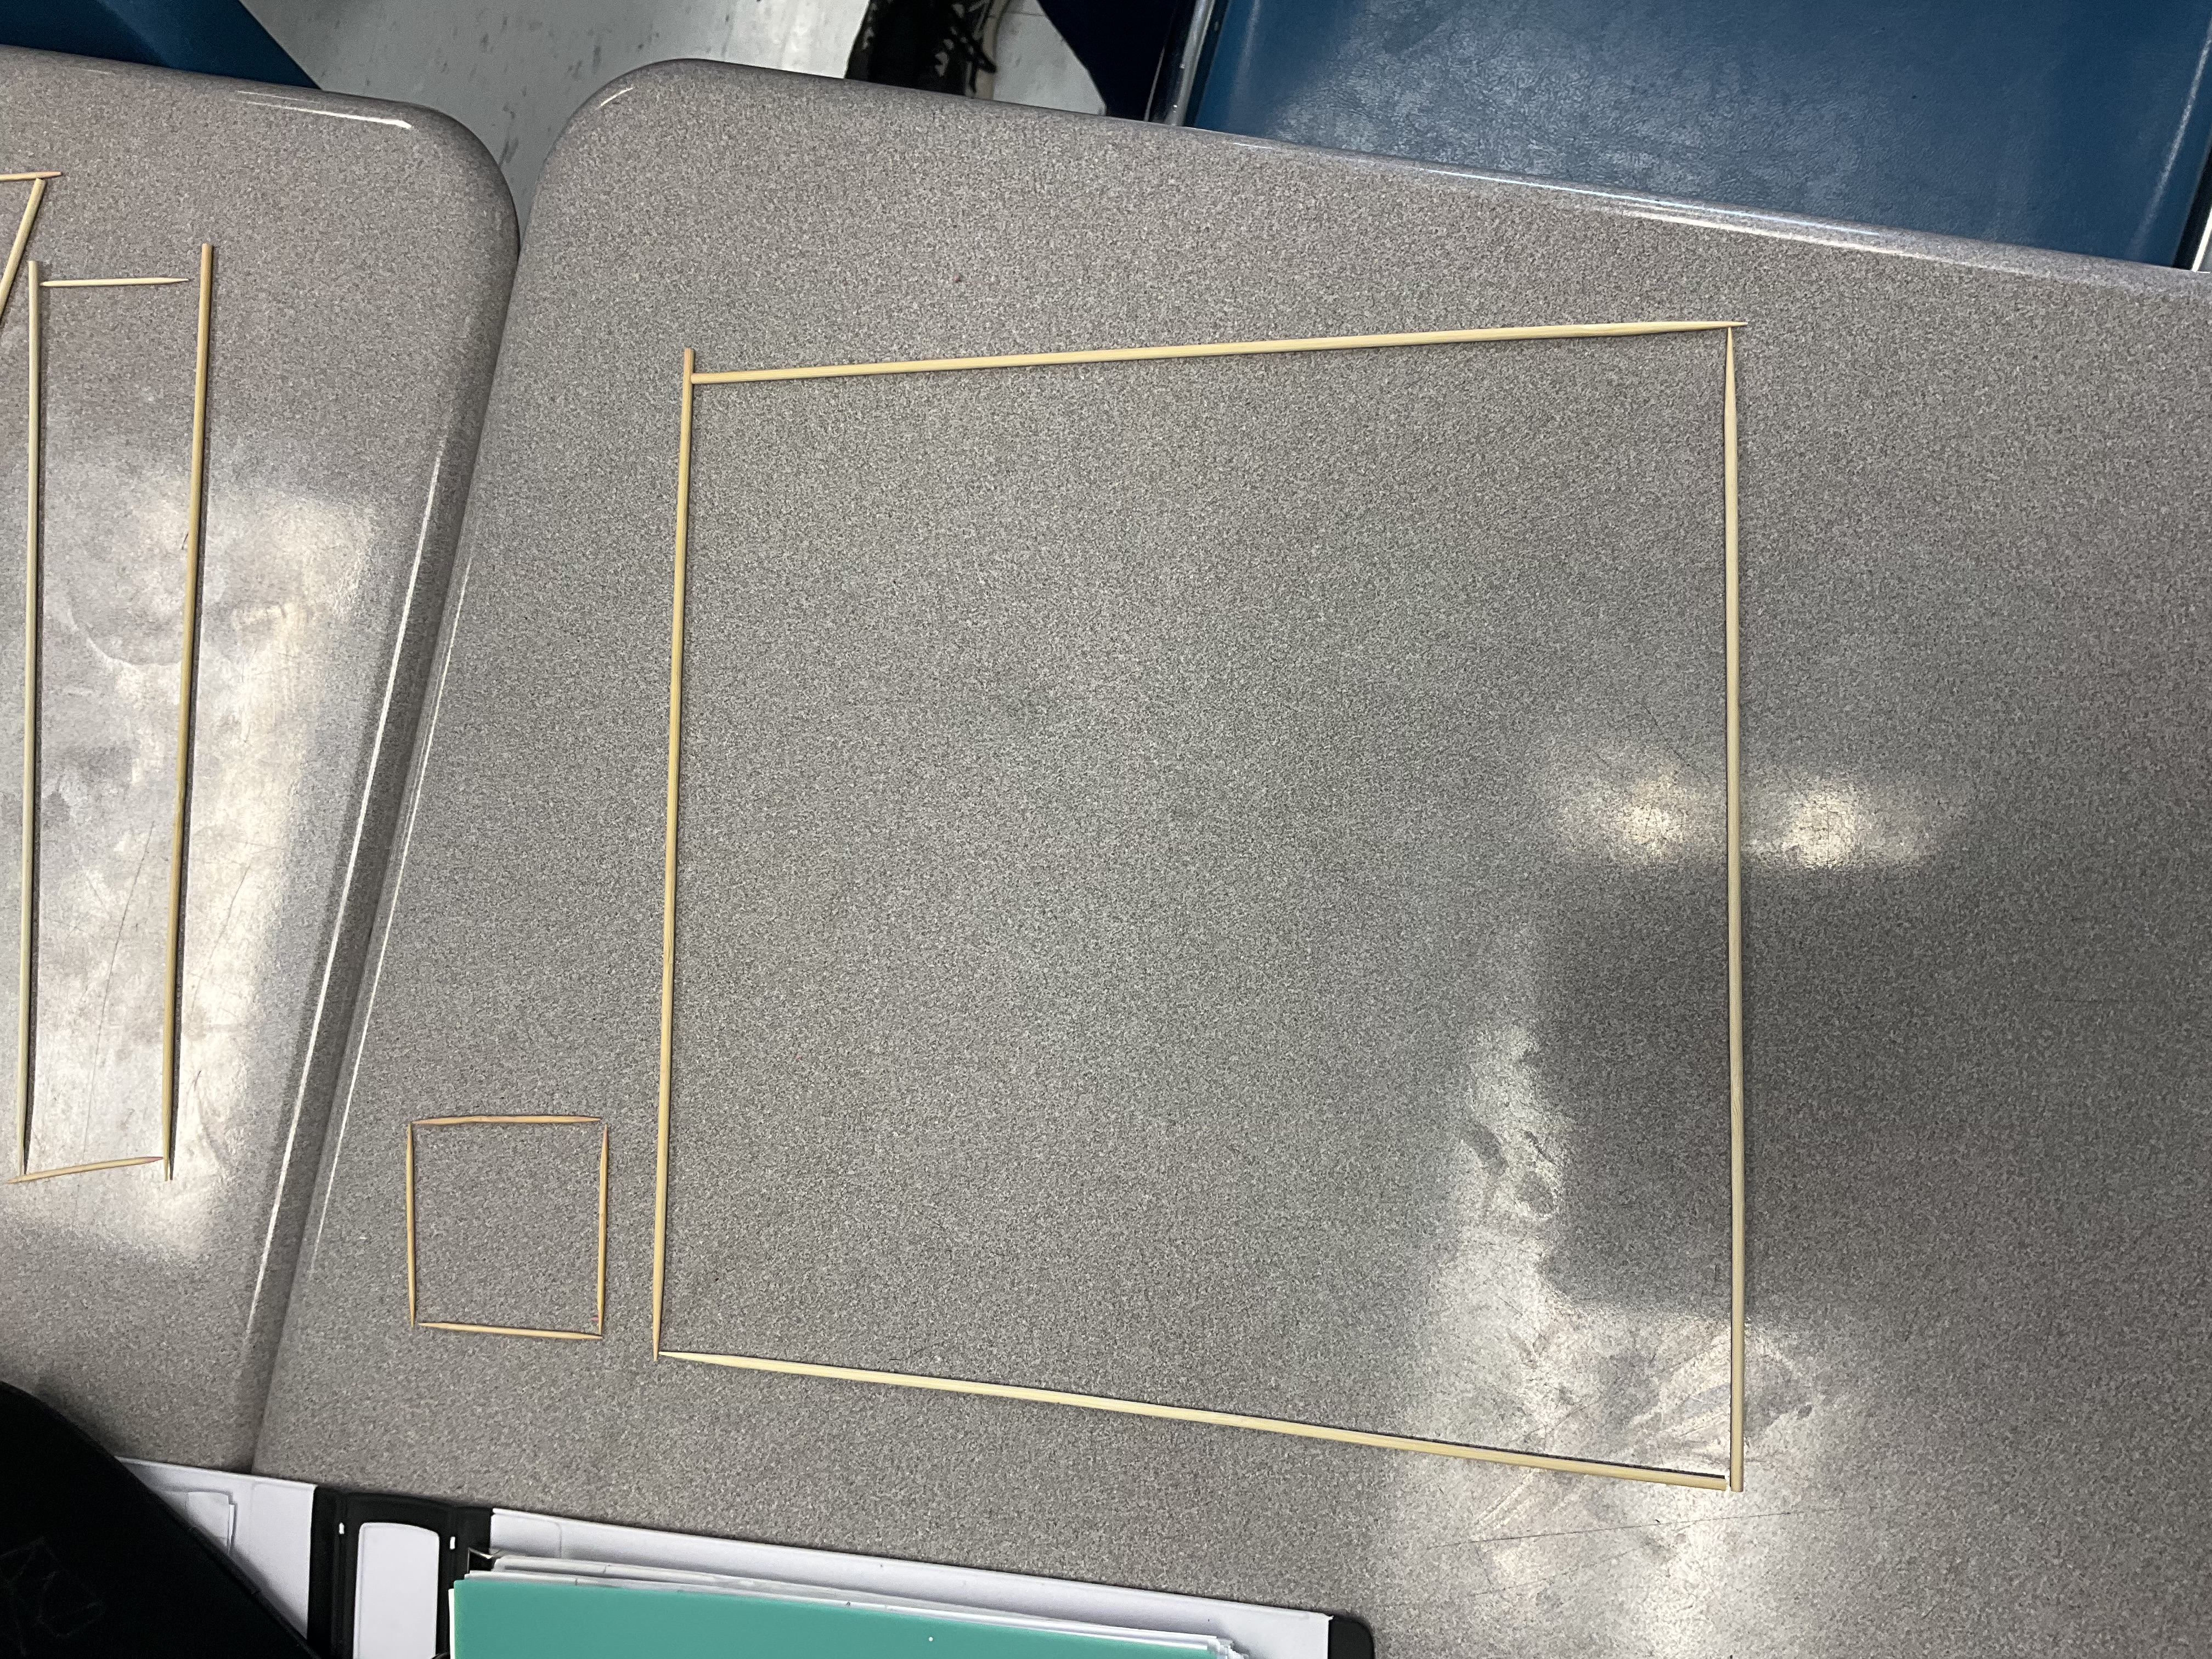
We started with representing multiplication with tiles. Here is an example of (2)(3), a 2×3 rectangle involving 6 unit tiles. The area is the product and the dimensions are the factors.

Next we tried 3x, which can be seen as 3 groups of x (below)

or we can make a rectangle with one dimension as 3 and the other as x.

The next interesting thing to try is to make as many rectangles as possible for 12x.
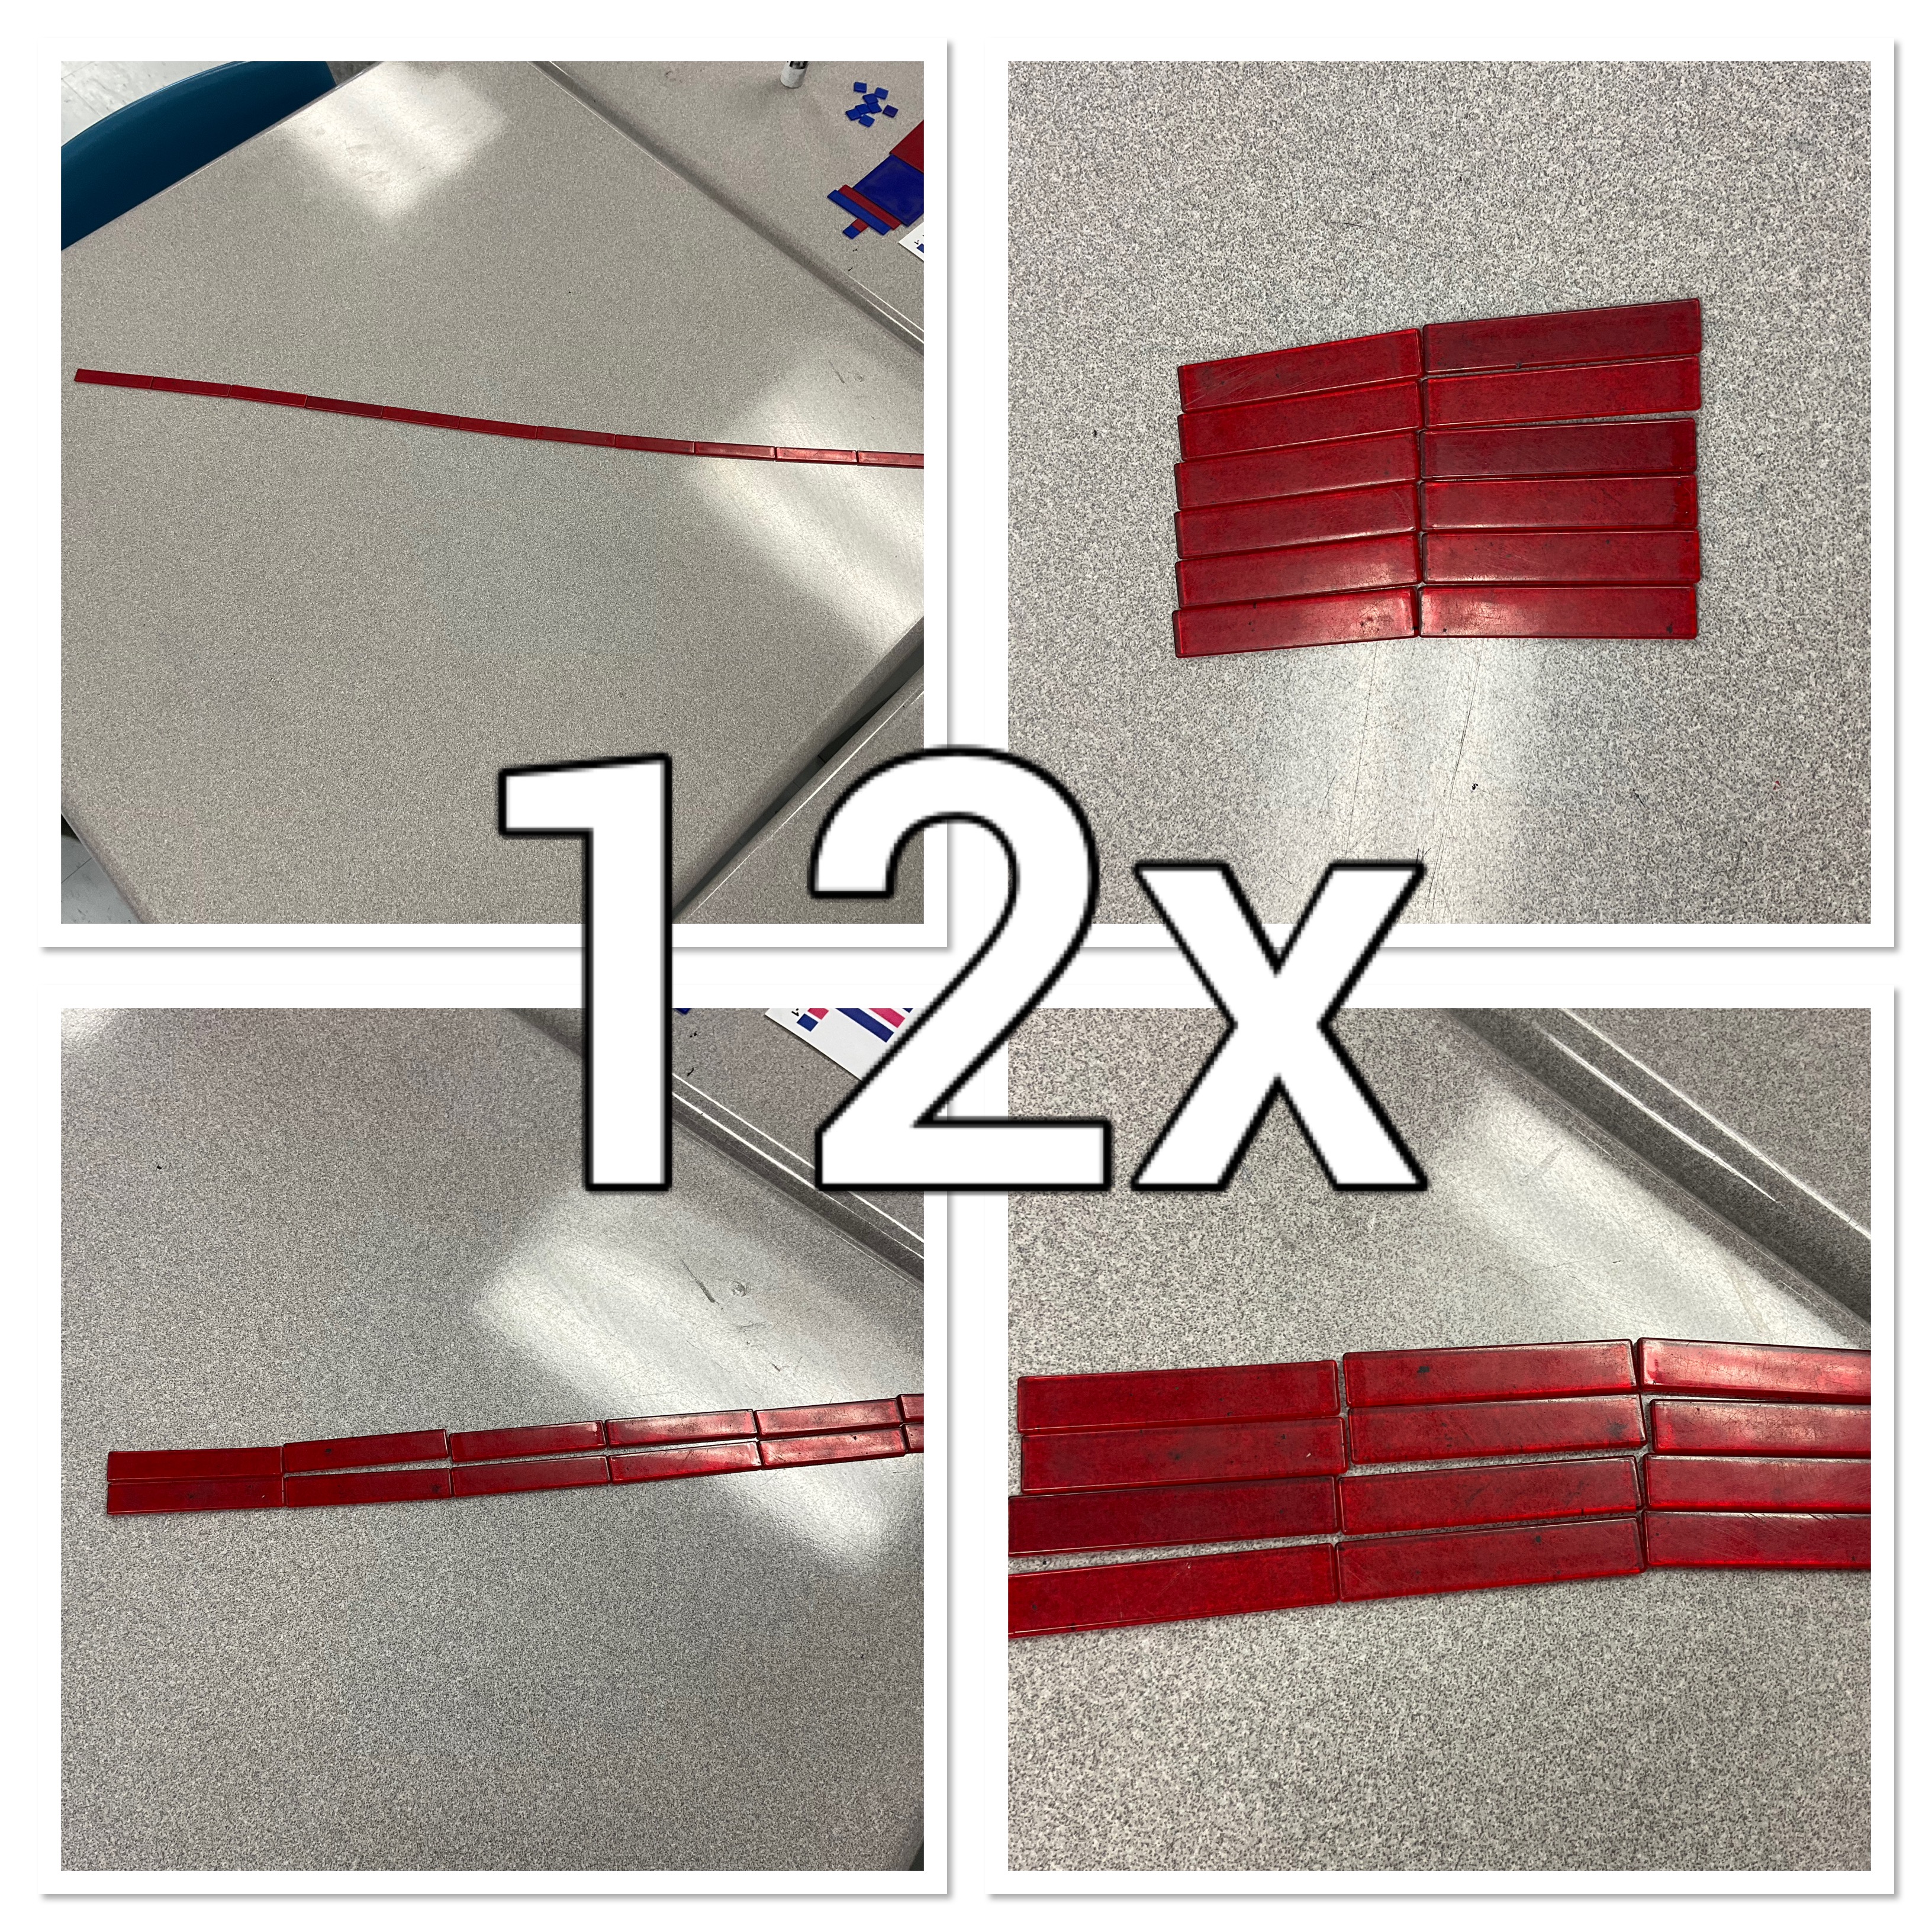
we can write these as products. (1)(12x) is the long thin rectangle (top left), then (2)(6x) which is bottom left, then (4)(3x) bottom right and (6)(2x) top right. There could also be (3)(4x) and (12)(x) which are not shown.
Here is another challenge. There are different ways of writing 2(3x+1)

many students see and understand this as 2 groups of (3x+1) which is great. We know there will be 2 groups of 3x, and 2 groups of 1. We can also show this as a rectangle with dimensions of (2) and (3x+1).
The rectangle idea is important when we get to a situation of x(x+2). We struggle to understand x groups of x+2, but we can create a rectangle with dimensions of (x) and (x+2).

We next cut up a puzzle and tried to match the sides that have equivalent expressions

We got them sorted out! It took a while, but our teams worked hard and mastered the challenge.

For more puzzles like this check out monclasseurdemaths
Introduction to Spreadsheets
We were working with spreadsheets today in grade 9 math. Students measured their foot size and their height and we put the information into a shared spreadsheet.
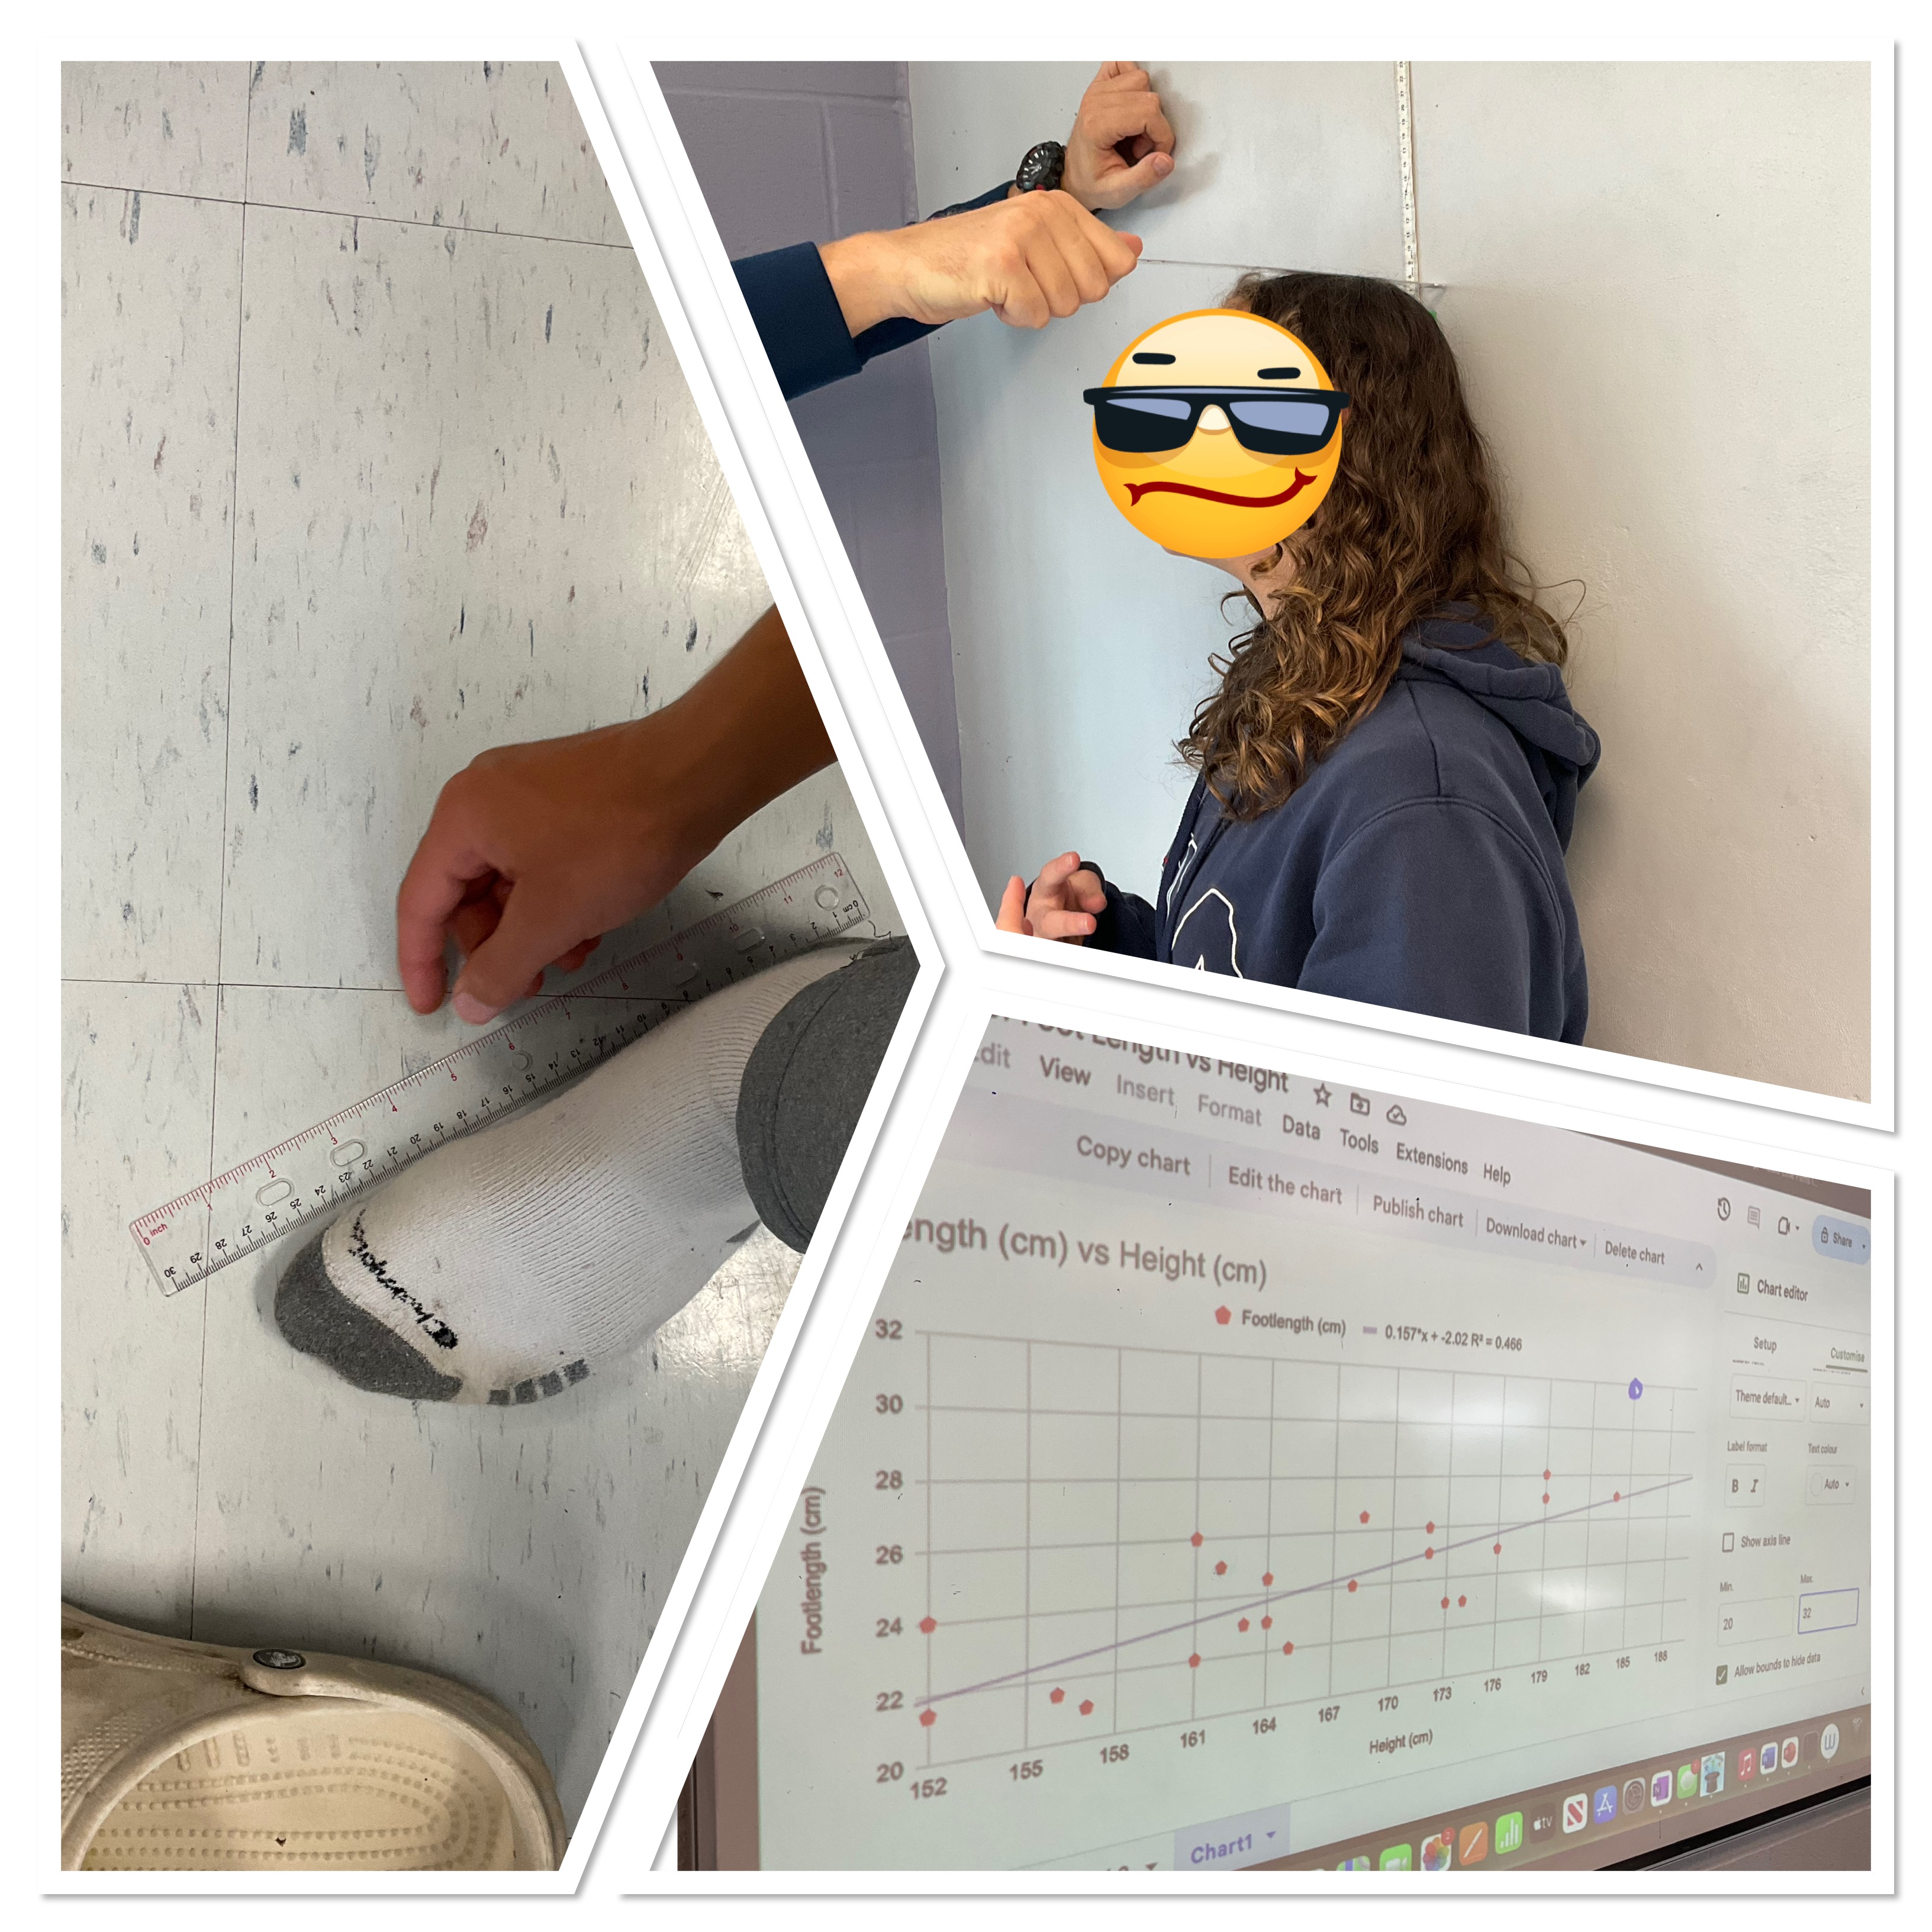
We looked at how google sheets can make a scatter plot, and add a trend line with an equation and R-squared value. We also used our graph to make some predictions.
We also explored how we can use coding to calculate the maximum and minimum values in a column of data. We also used coding to calculate the median, mode, and mean, and used the max and min to calculate the range.
Introducing Algebra
Today we started algebra in several grade 9 classes. We started by using algebra tiles to make some pictures.
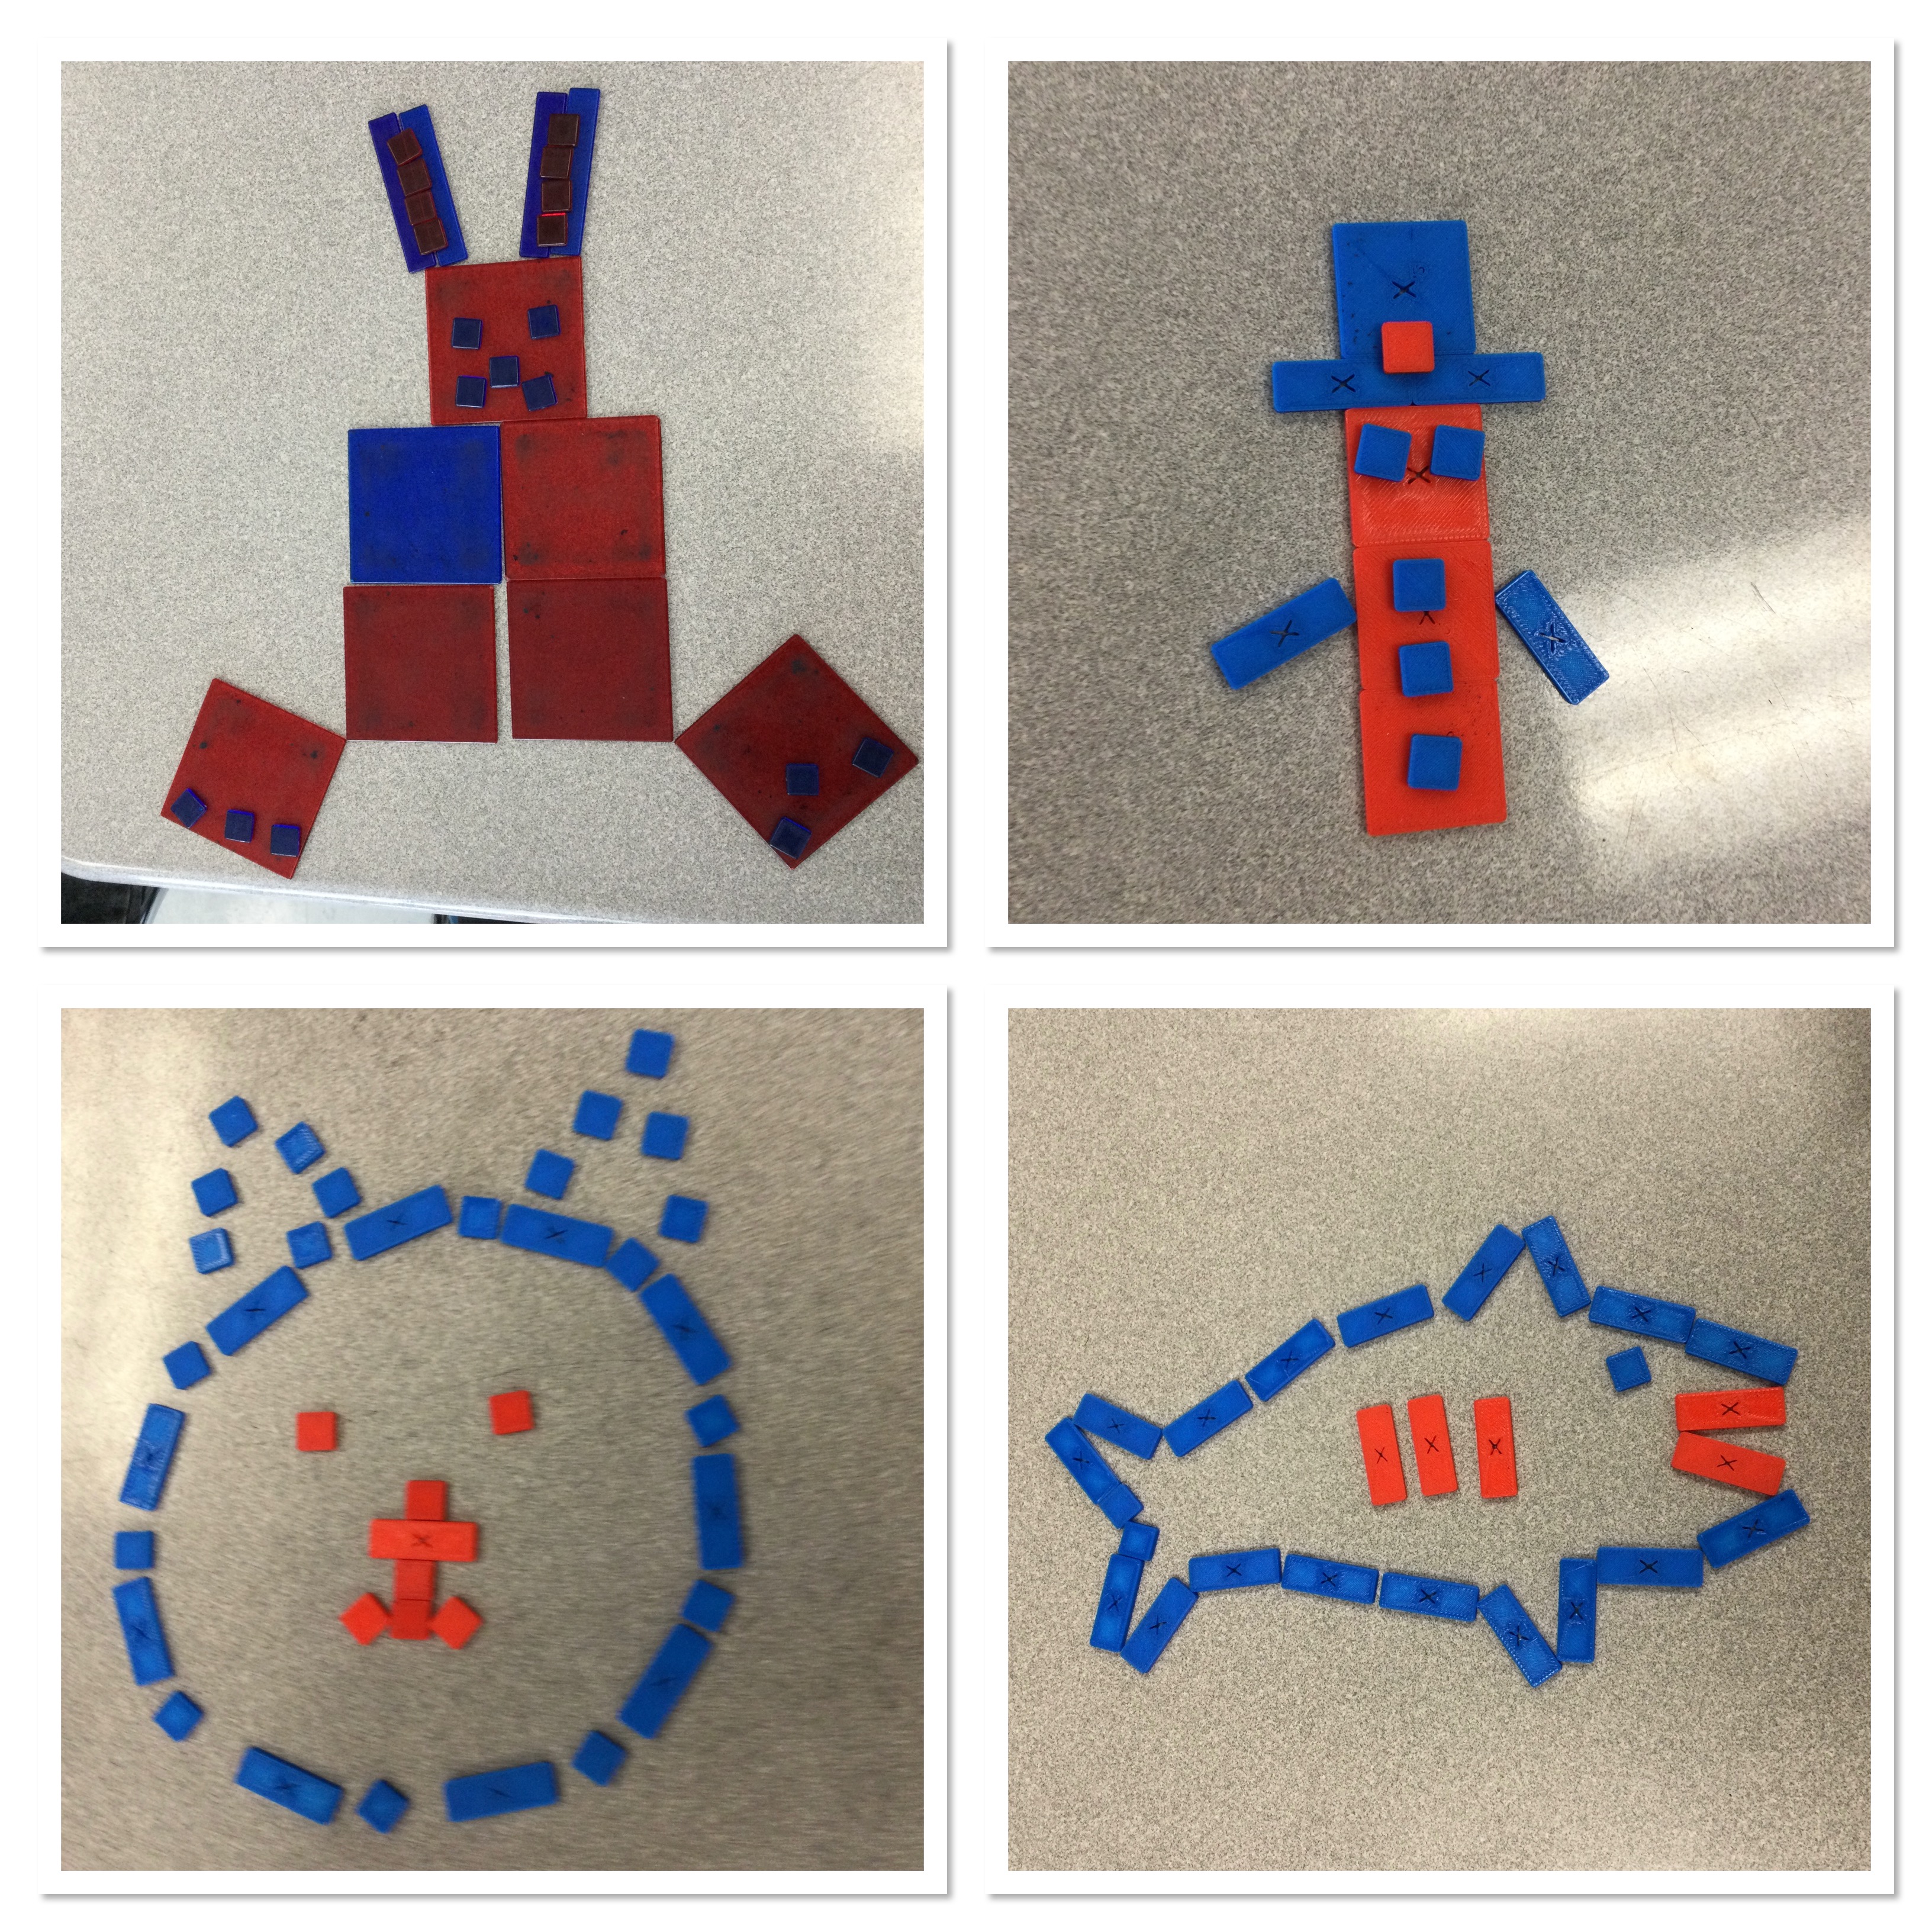
Next we eliminated all the zero pairs and simplified the expressions into polynomials.

We talked about the vocabulary of algebra, introducing the words “like terms”, “coefficient”, “constant”, “variable”, “exponent”, “trinomial”, “binomial”, “monomial”, “polynomial” and then started creating some polynomials, then adding polynomials together and combining like terms, and simplifying.
Later we had challenge questions to create the following:
(Binomial)+(binomial)=(trinomial)
(trinomial)+(trinomial)=(monomial)
With tiles the algebra is more tangible and less abstract.
Distance and Midpoint
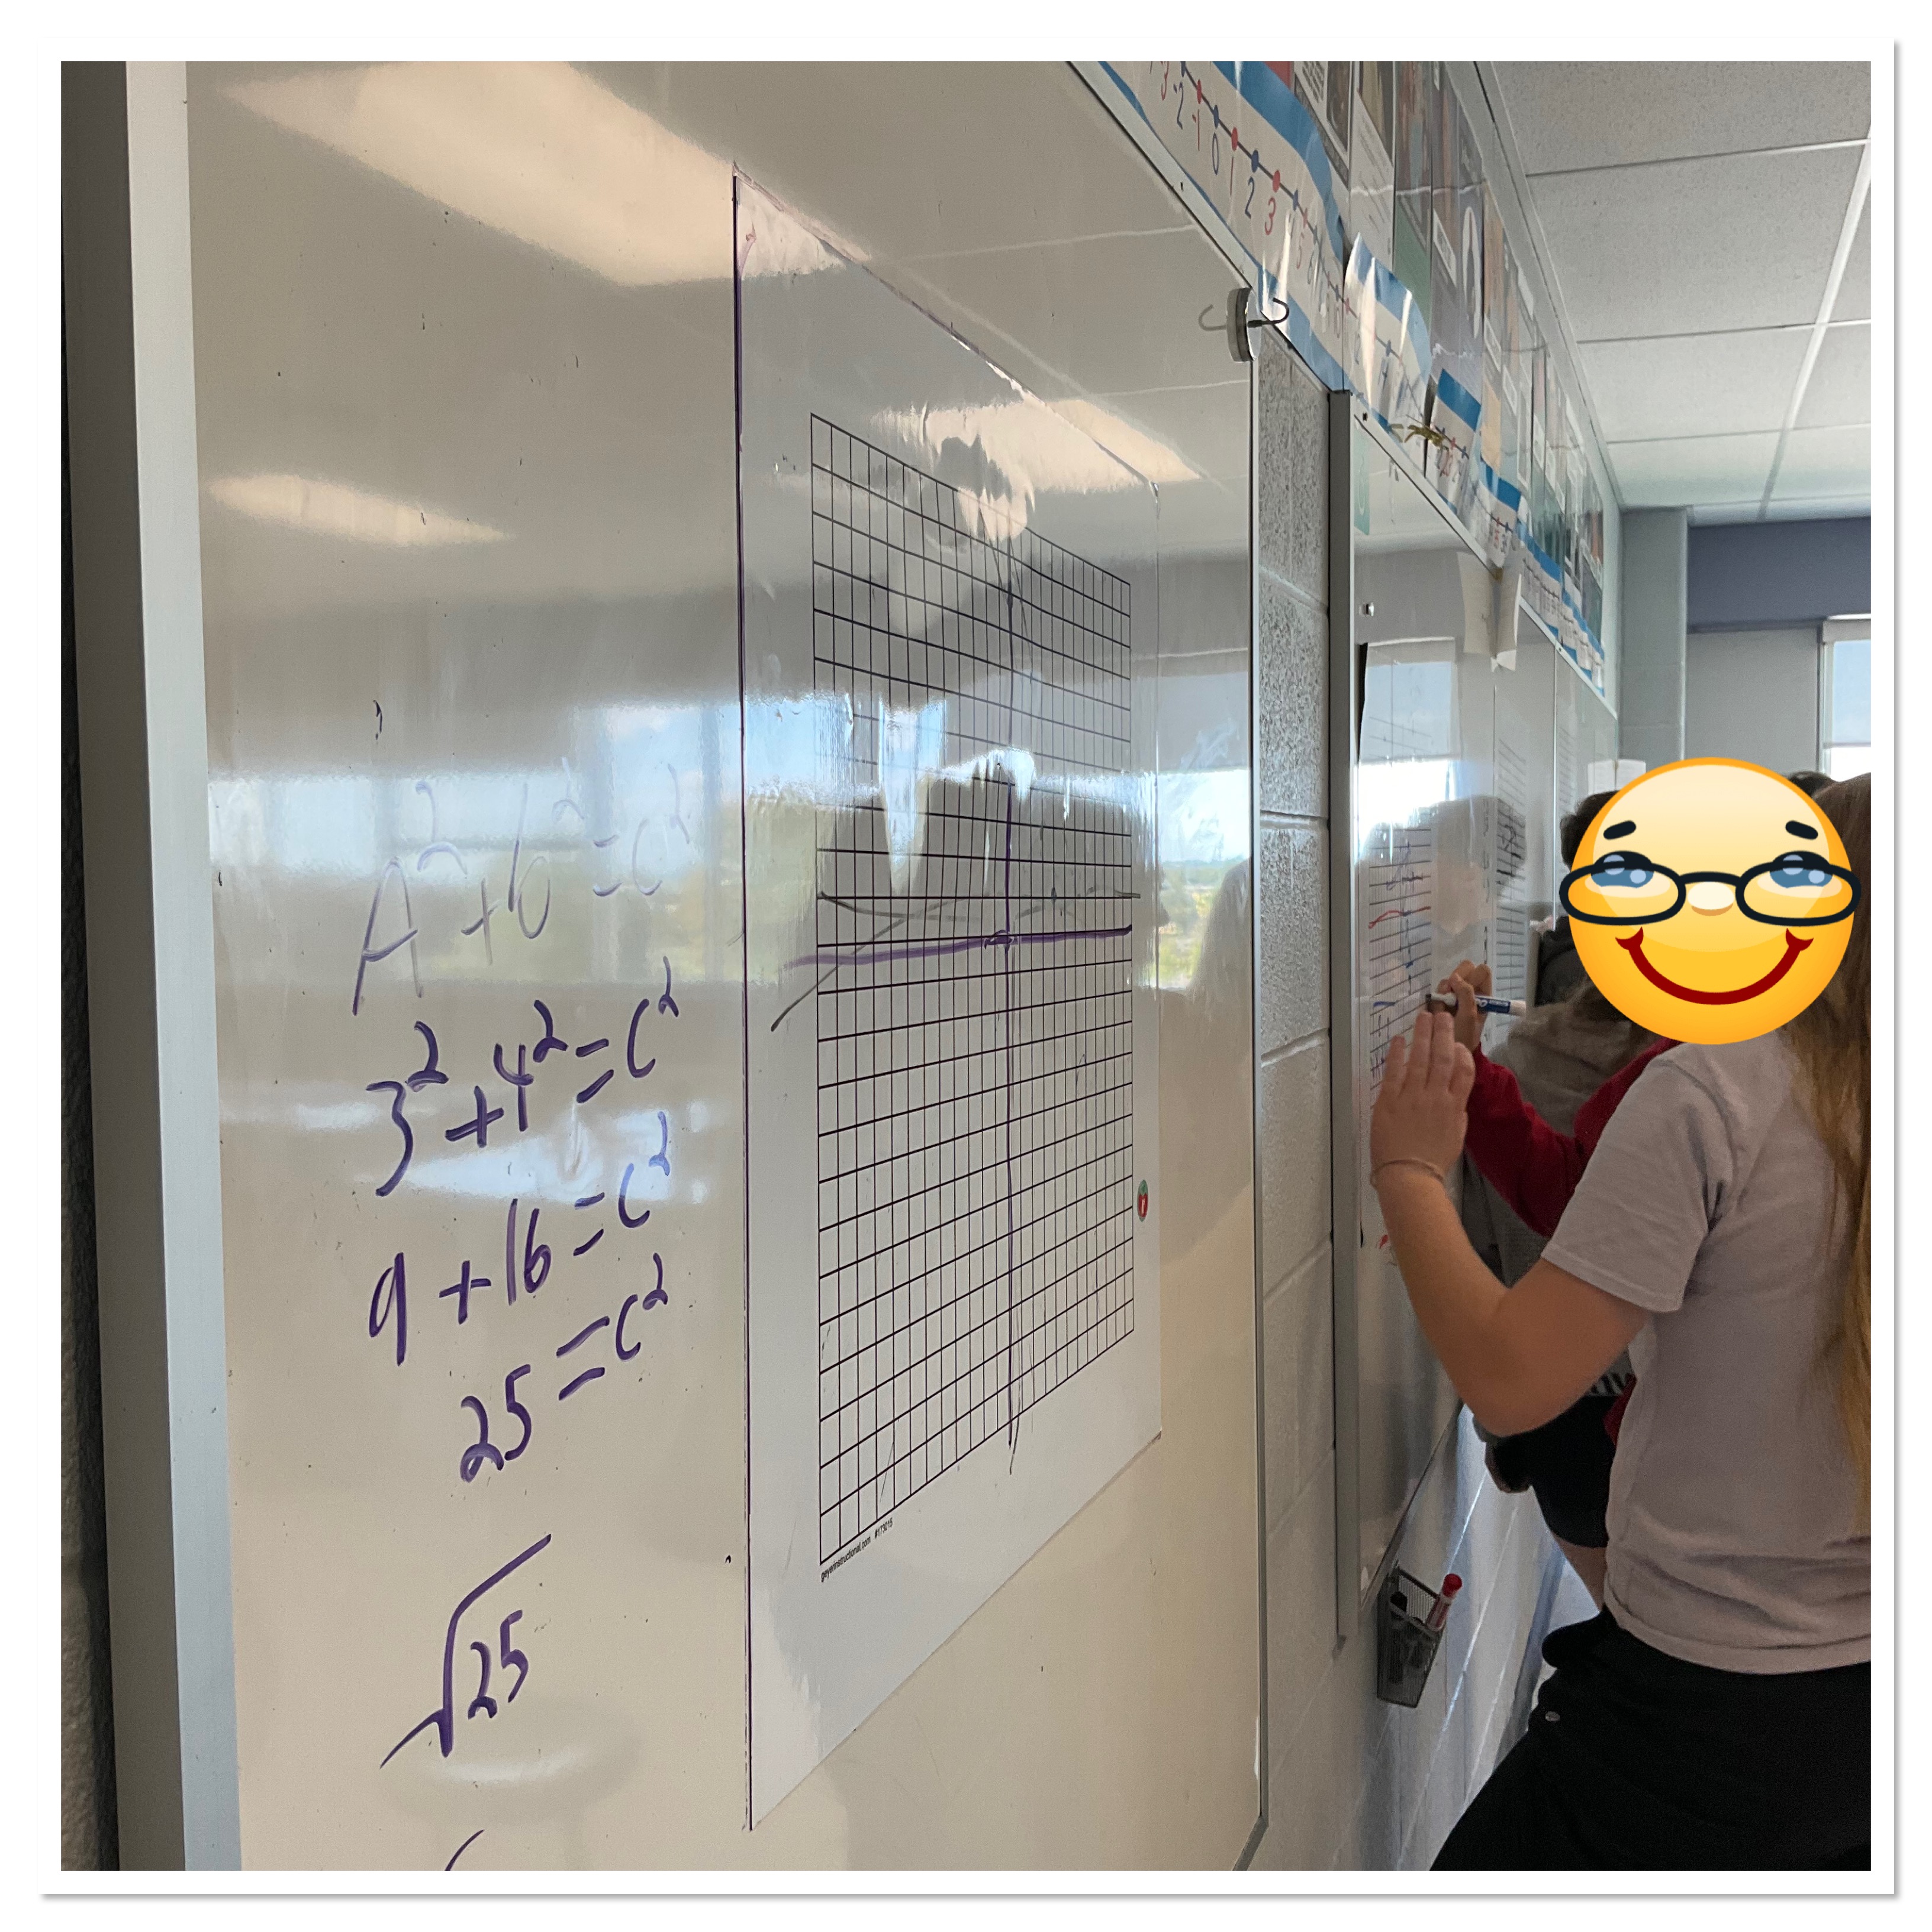
We were up at the walls working on determining length of a segment, and midpoint of a segment today.
The sequence I used is as follows:
Plot the points (0,2) and (8,2). Determine the length of the line segment. (This is pretty simple to do by counting).
Plot the points (-1,-2) and (-1,4) and determine the length of the line segment. I asked students to think of how they could calculate the distance with operations. They decided that subtracting works 4-(-2)=6.
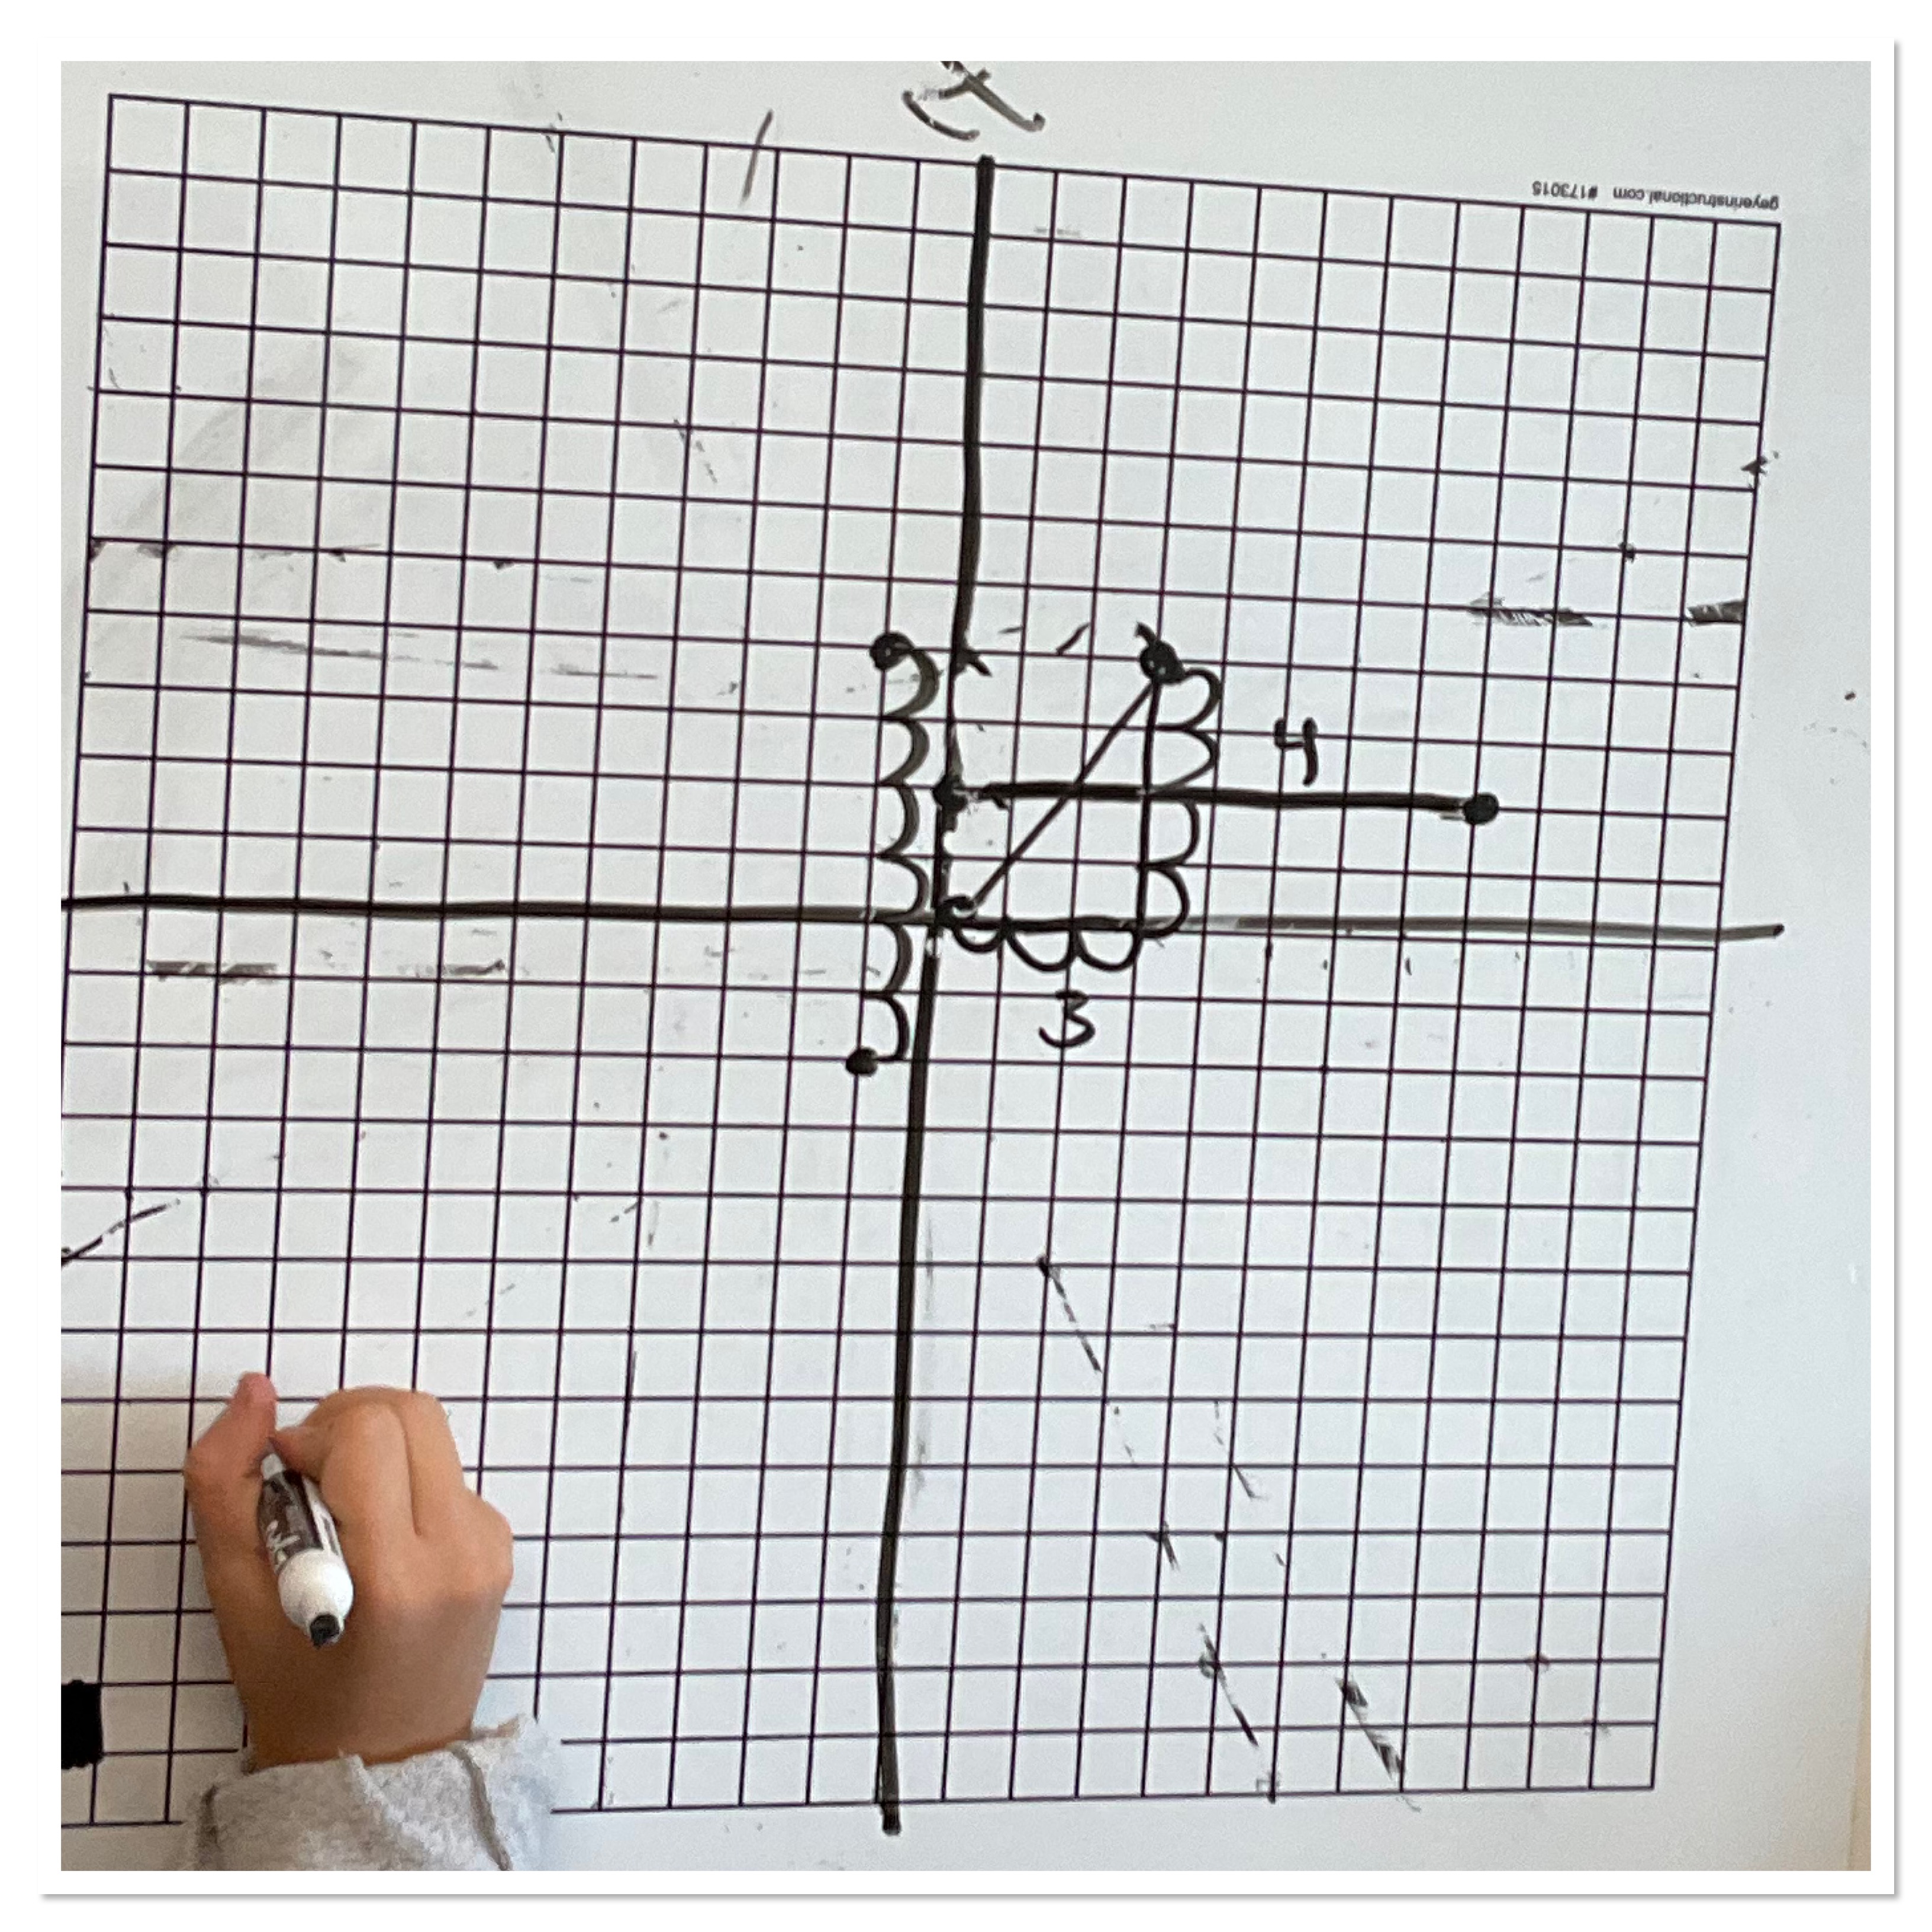
The next challenge was to find the length of the segment between (0,0) and (3,4). There was a bit of a struggle, until some students started to draw a right triangle to help.
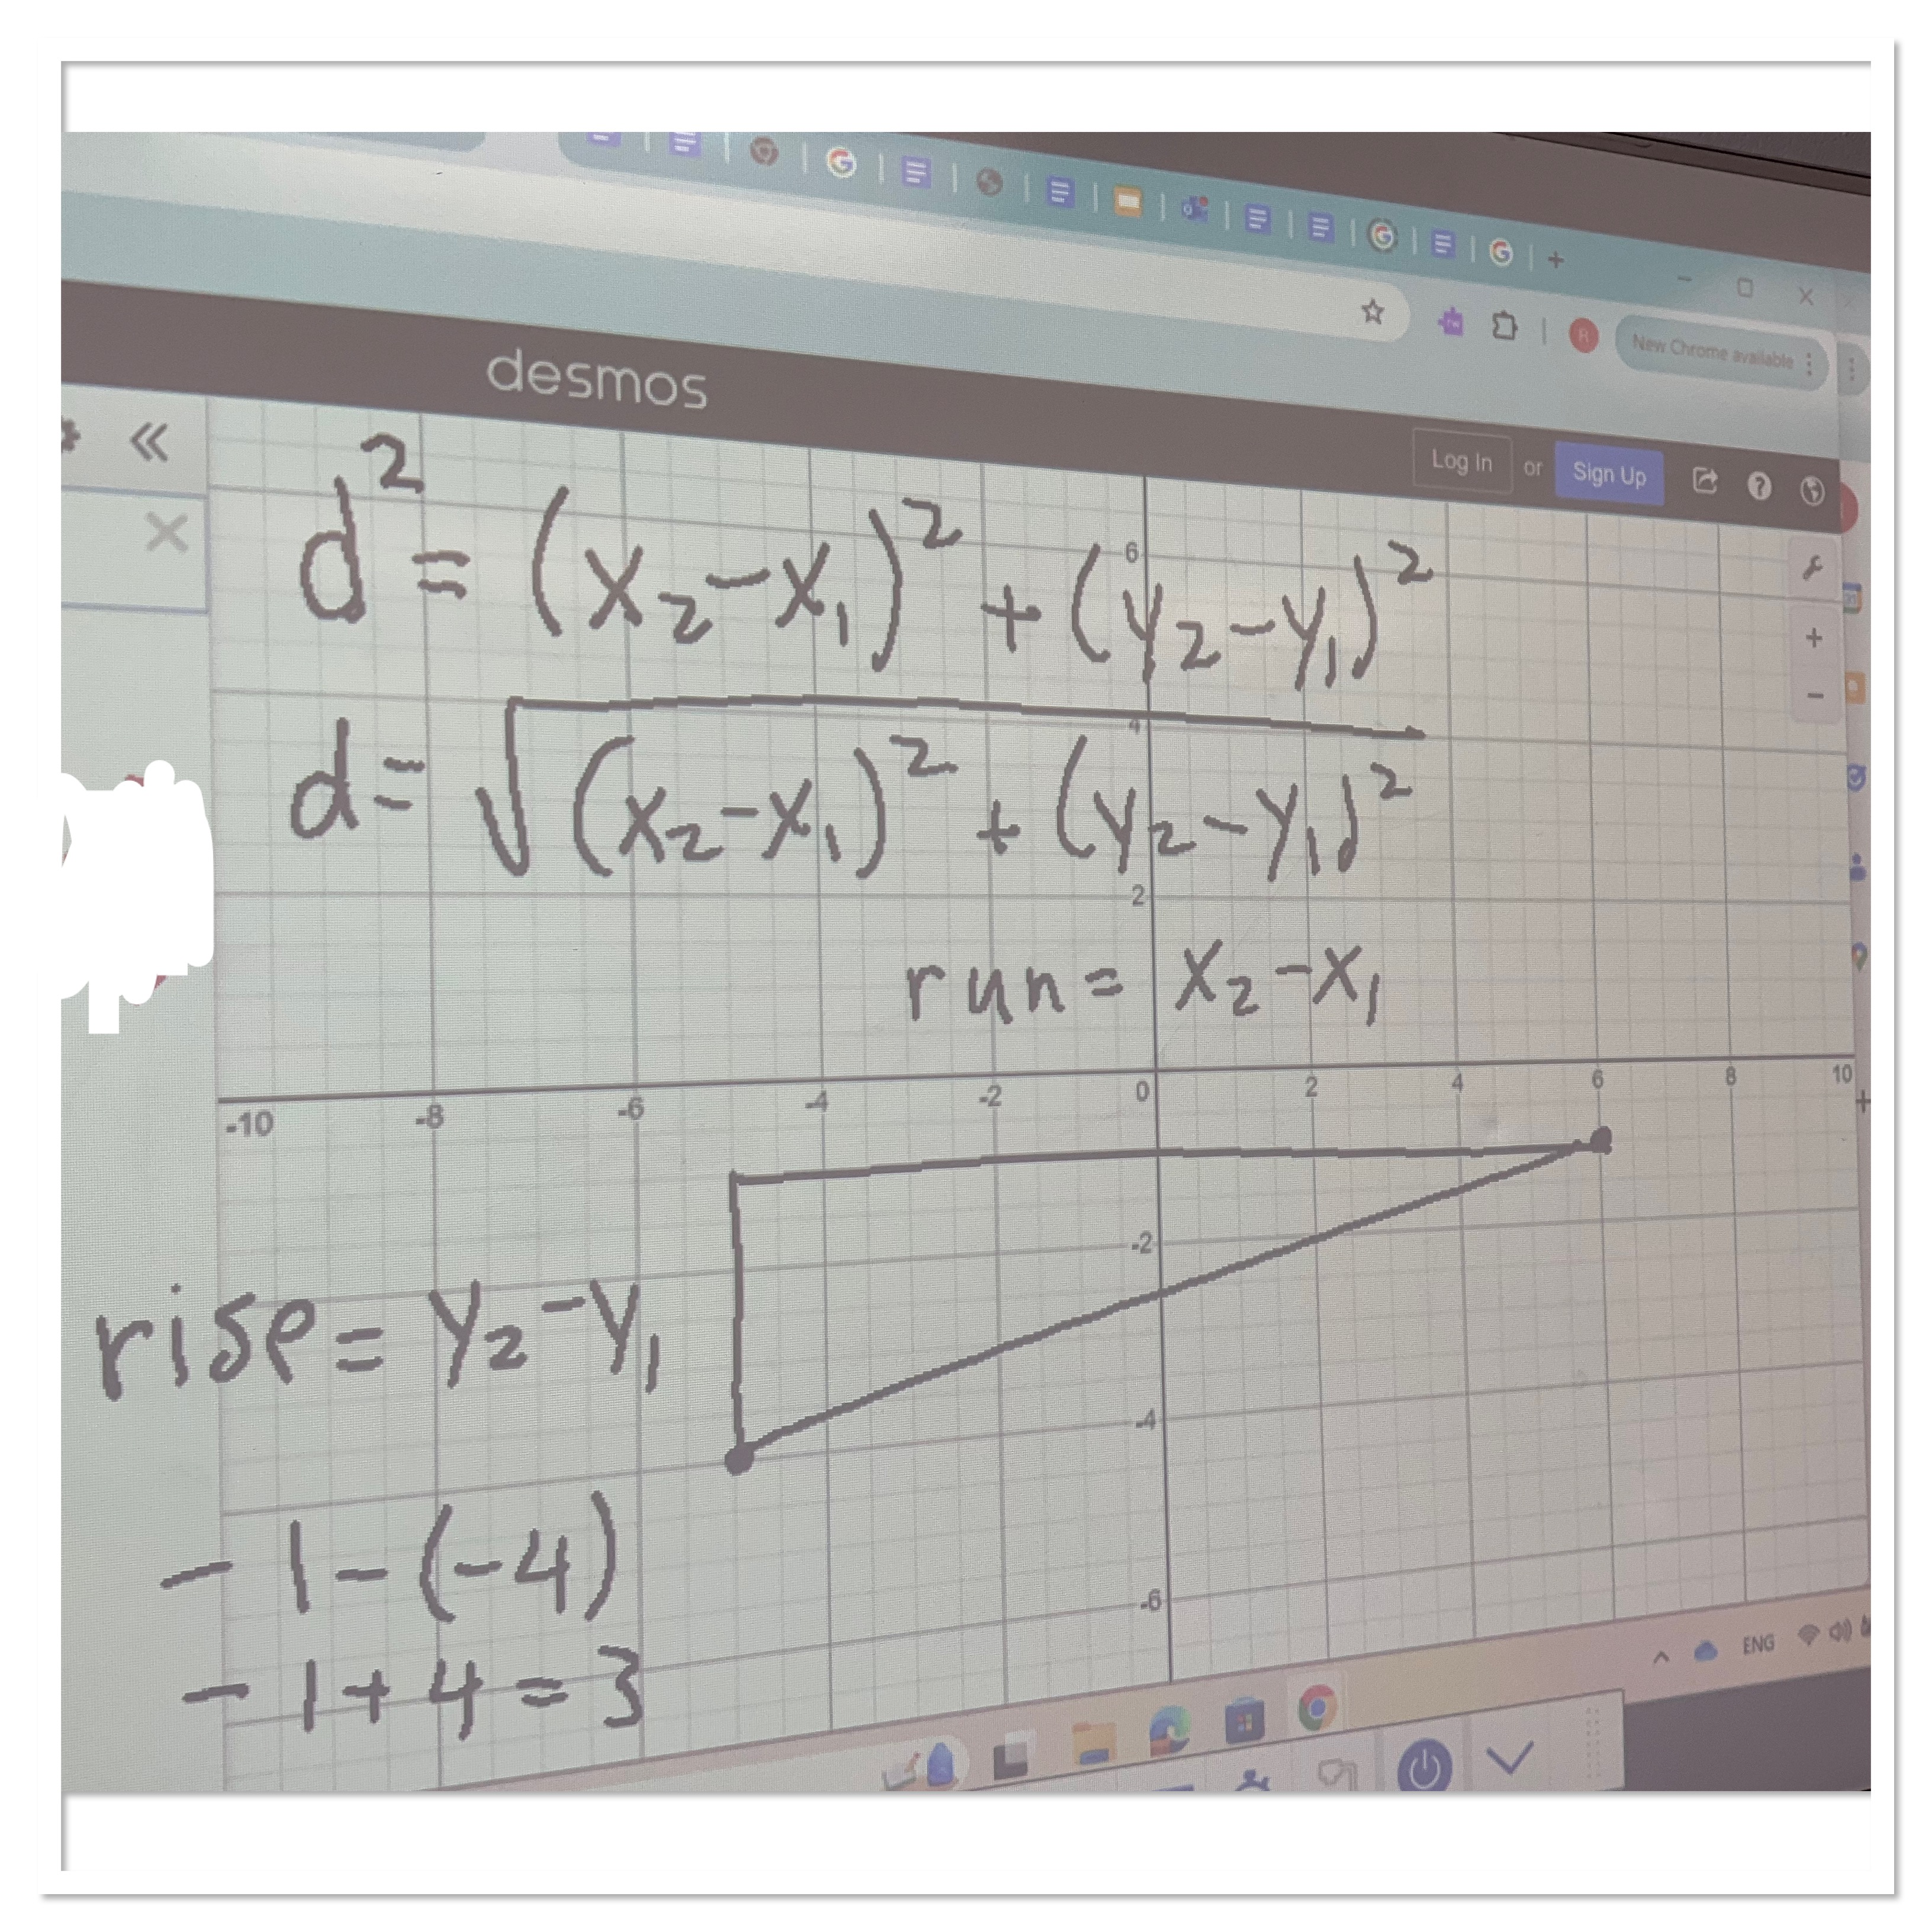
I asked some groups to try to find the distance between any two points (x1,y1) and (x2,y2). It was neat to see students use their idea of rise and run to create an equation.
We consolidated as a group and derived the distance formula that they will be given.
The sequence for determining the midpoint was similar. We looked at the midpoint of a horizontal segment, a vertical segment that had end points in different quadrants, and then for a segment that is on a slant.
It was interesting to see the connections that students made to their prior learning. Some were discussing the fact that a horizontal segment has a y value that is always the same, and a vertical segment has an x value that is always the same. Other students used the idea of finding the middle by taking the average. Pretty soon we were all taking the average of the x values, the average of the y values, and putting that in (x,y) form as the midpoint.
Introduction to Algebra
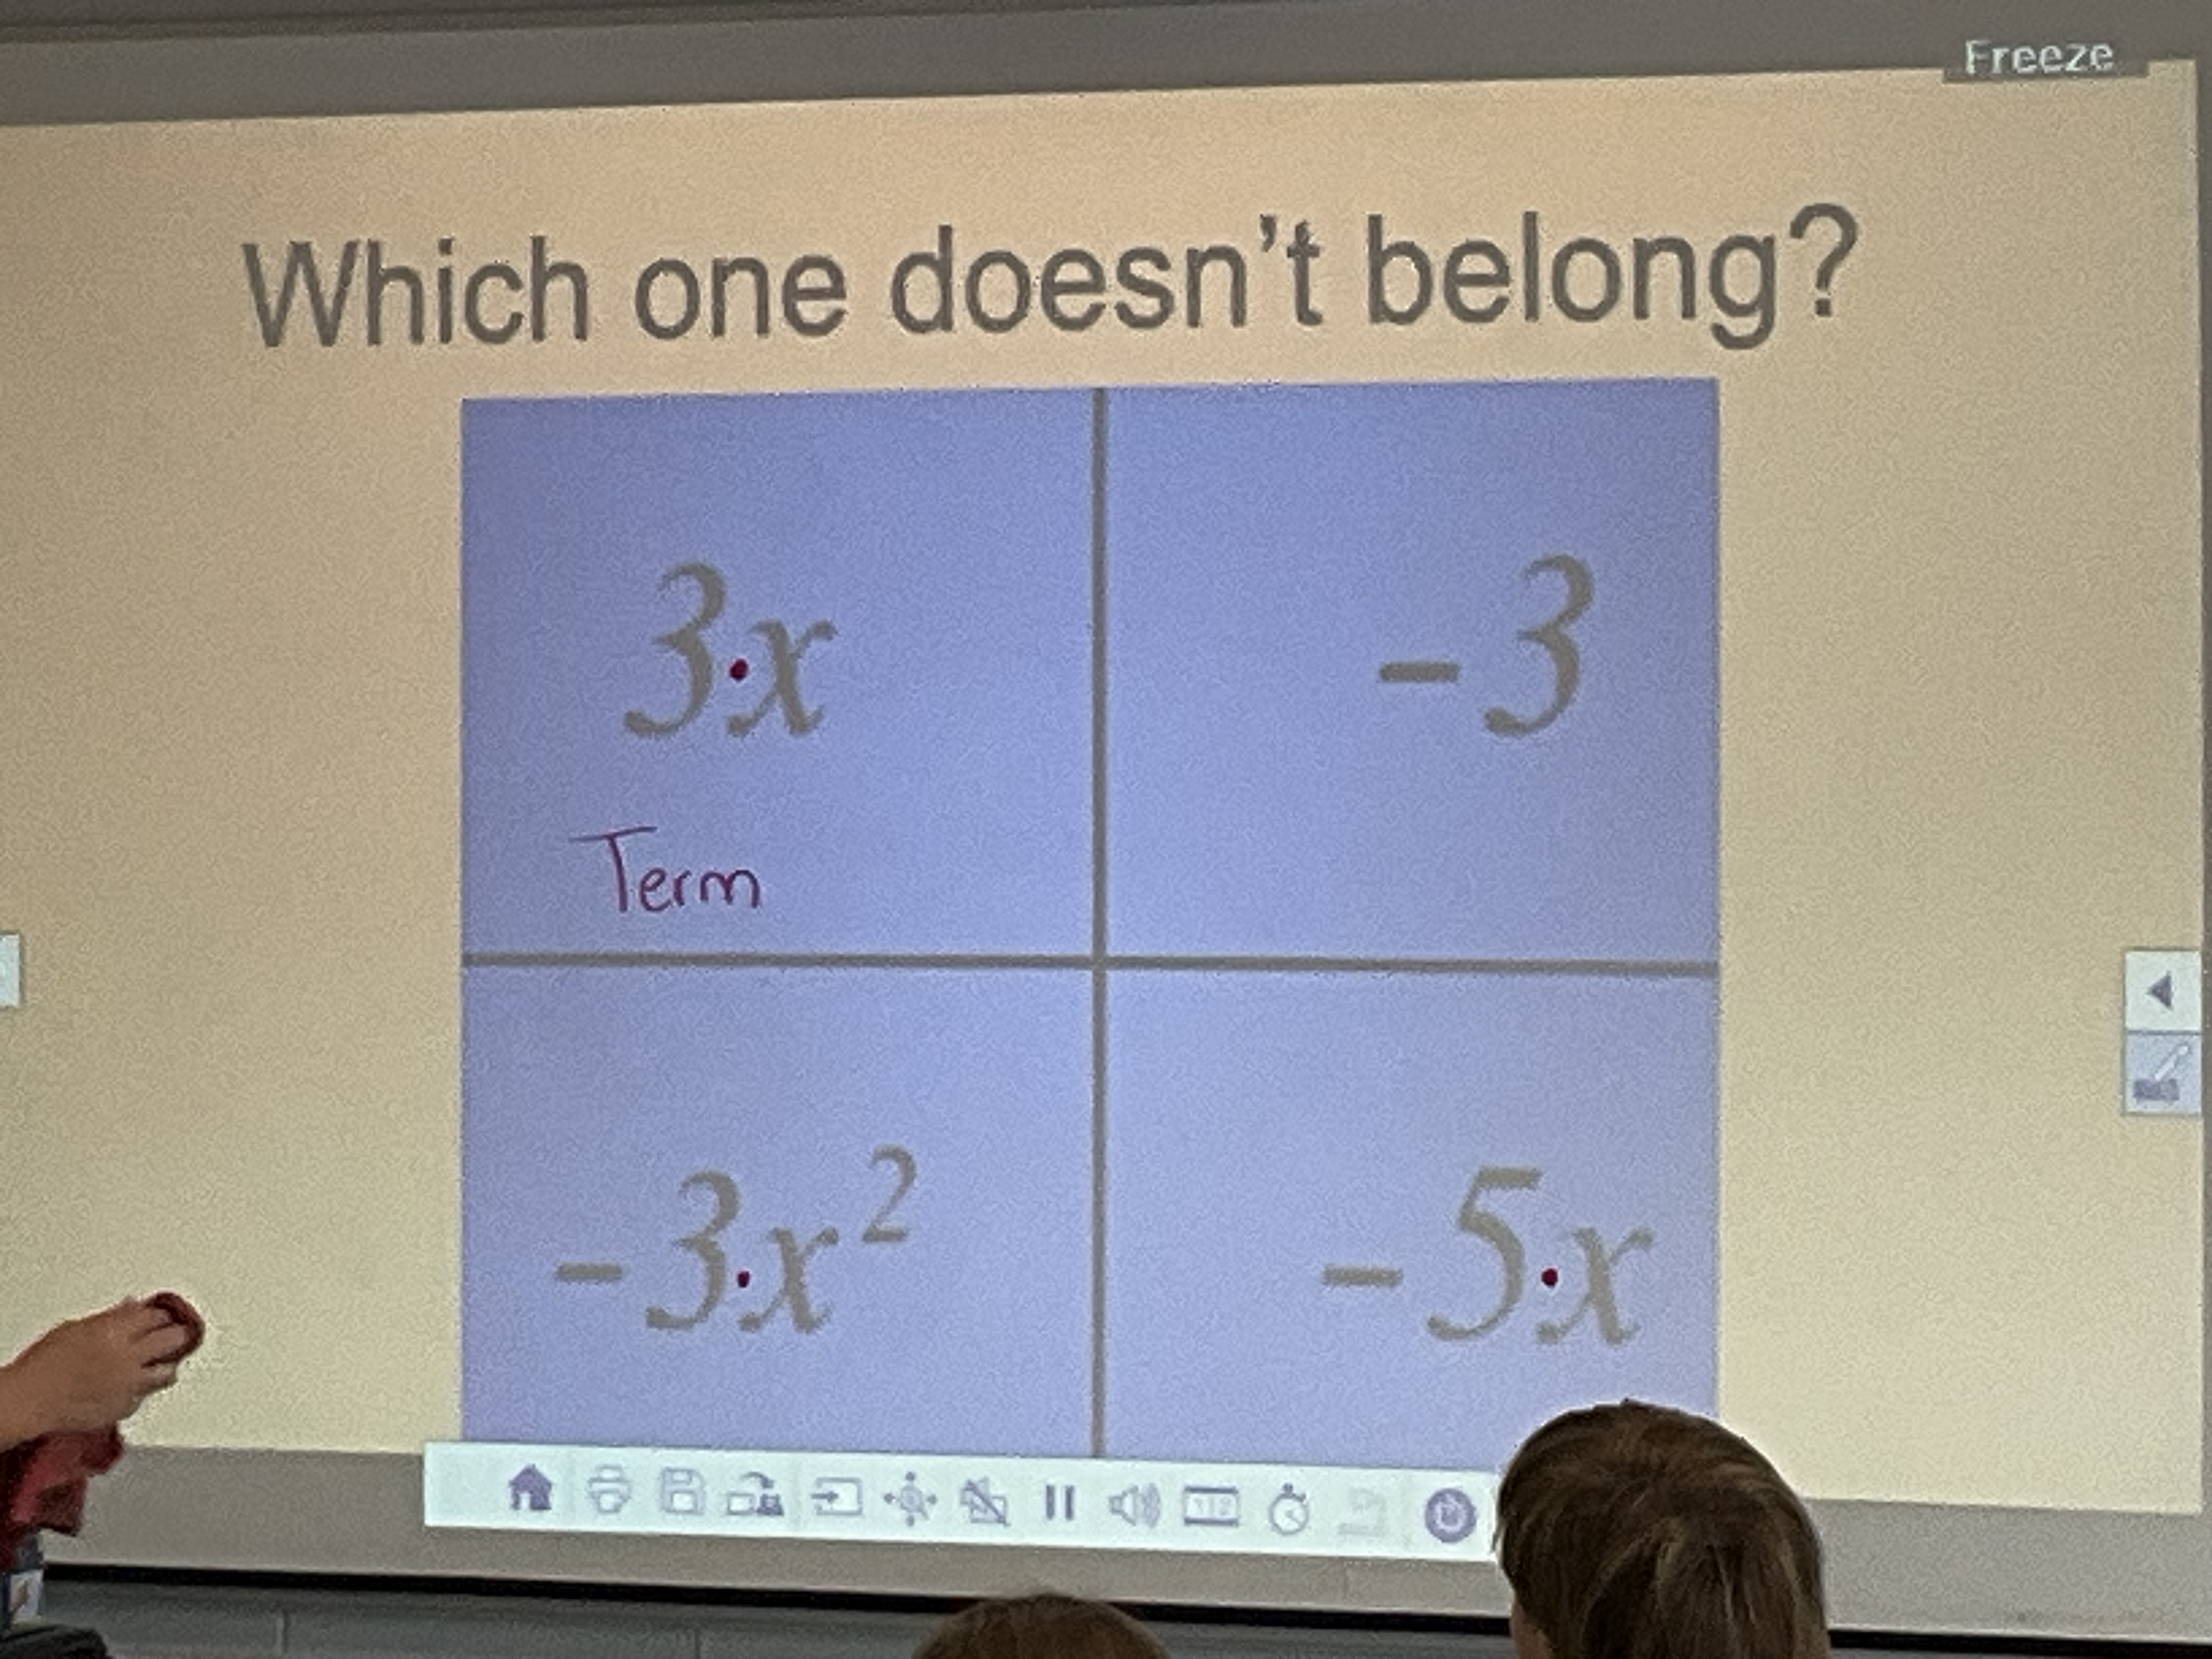
I had the pleasure of being in a grade 9 class as they started their algebra lessons. There was a “which one doesn’t belong” which helped to introduce the need for some vocabulary to discuss algebra. Terms, and coefficients, and constants, and like terms, and exponents were all discussed, and students had some neat ideas about what a variable is: something that holds value, but can change. One student suggested that -3 is the only number of the 4 that we actually know.
Following this, algebra tiles were introduced, and students built pictures.

After the pictures were built, they wrote expressions for their pictures, then simplified the polynomials into their simplest form. New vocabulary was introduced to talk about monomials, binomials and trinomials.
A concept that is sometimes intimidating for students can be much more approachable when starting in this gentle way.
Factoring and Expanding with Tiles
Today I had the pleasure of working with a grade 10 academic math class to help introduce factoring and expanding using algebra tiles.

To start with, students were working on recreating the rectangles provided and stating their areas and dimensions. Here is the sequence of questions we used.

We know the area is the insides, so that is x^2+8x+15, and the dimensions are (x+3) and (x+5). We know the long sides are x, and the short sides are 1, and we read the dimensions of length and width of the rectangle.

We looked at how negative times a negative is a positive, and that is why we need 10 red squares in the corner.

Here we looked at zero pairs, and how the +x and -x will cancel each other to make zero.

Students had to work on making rectangles from these given sets of tiles. The 2nd example allows us to talk about perfect squares. The 3rd and 4th require some zero pairs to make the rectangles work out.
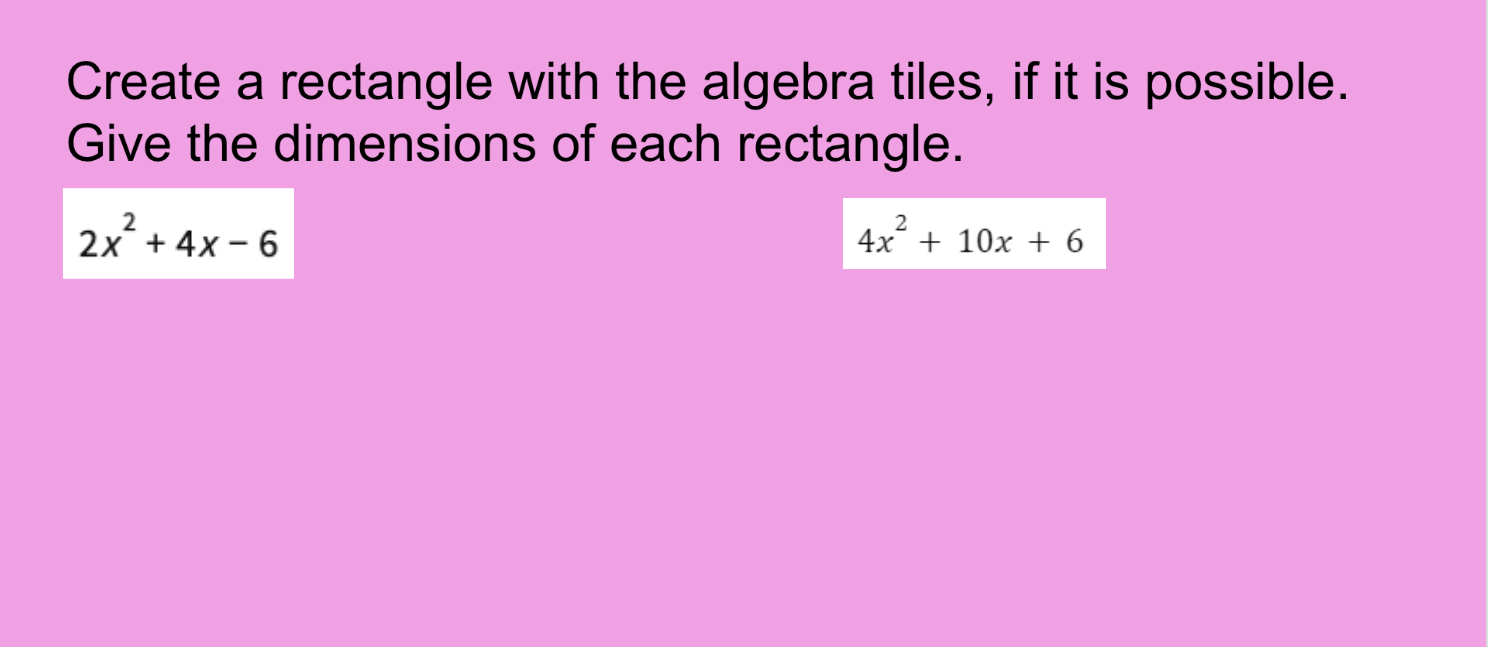
These examples have a few different ways to make rectangles. This is because there is a common factor of 2. We could split each polynomial up into 2 equal rectangles as well.
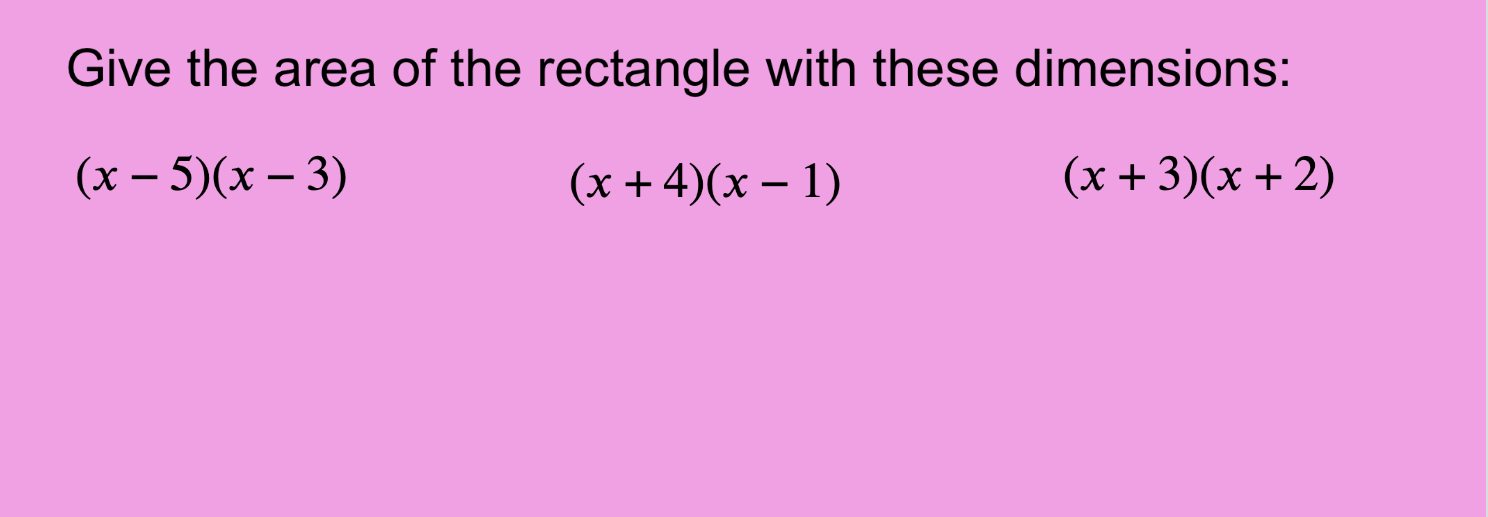
Finally, we tried giving dimensions, then building the rectangles to determine the area.

From these questions, students are essentially factoring and expanding using tiles. In spiral 2 we will go back and attach more algebra to these skills, and explore some patterns that are visible with the tiles.
Cookie Towers
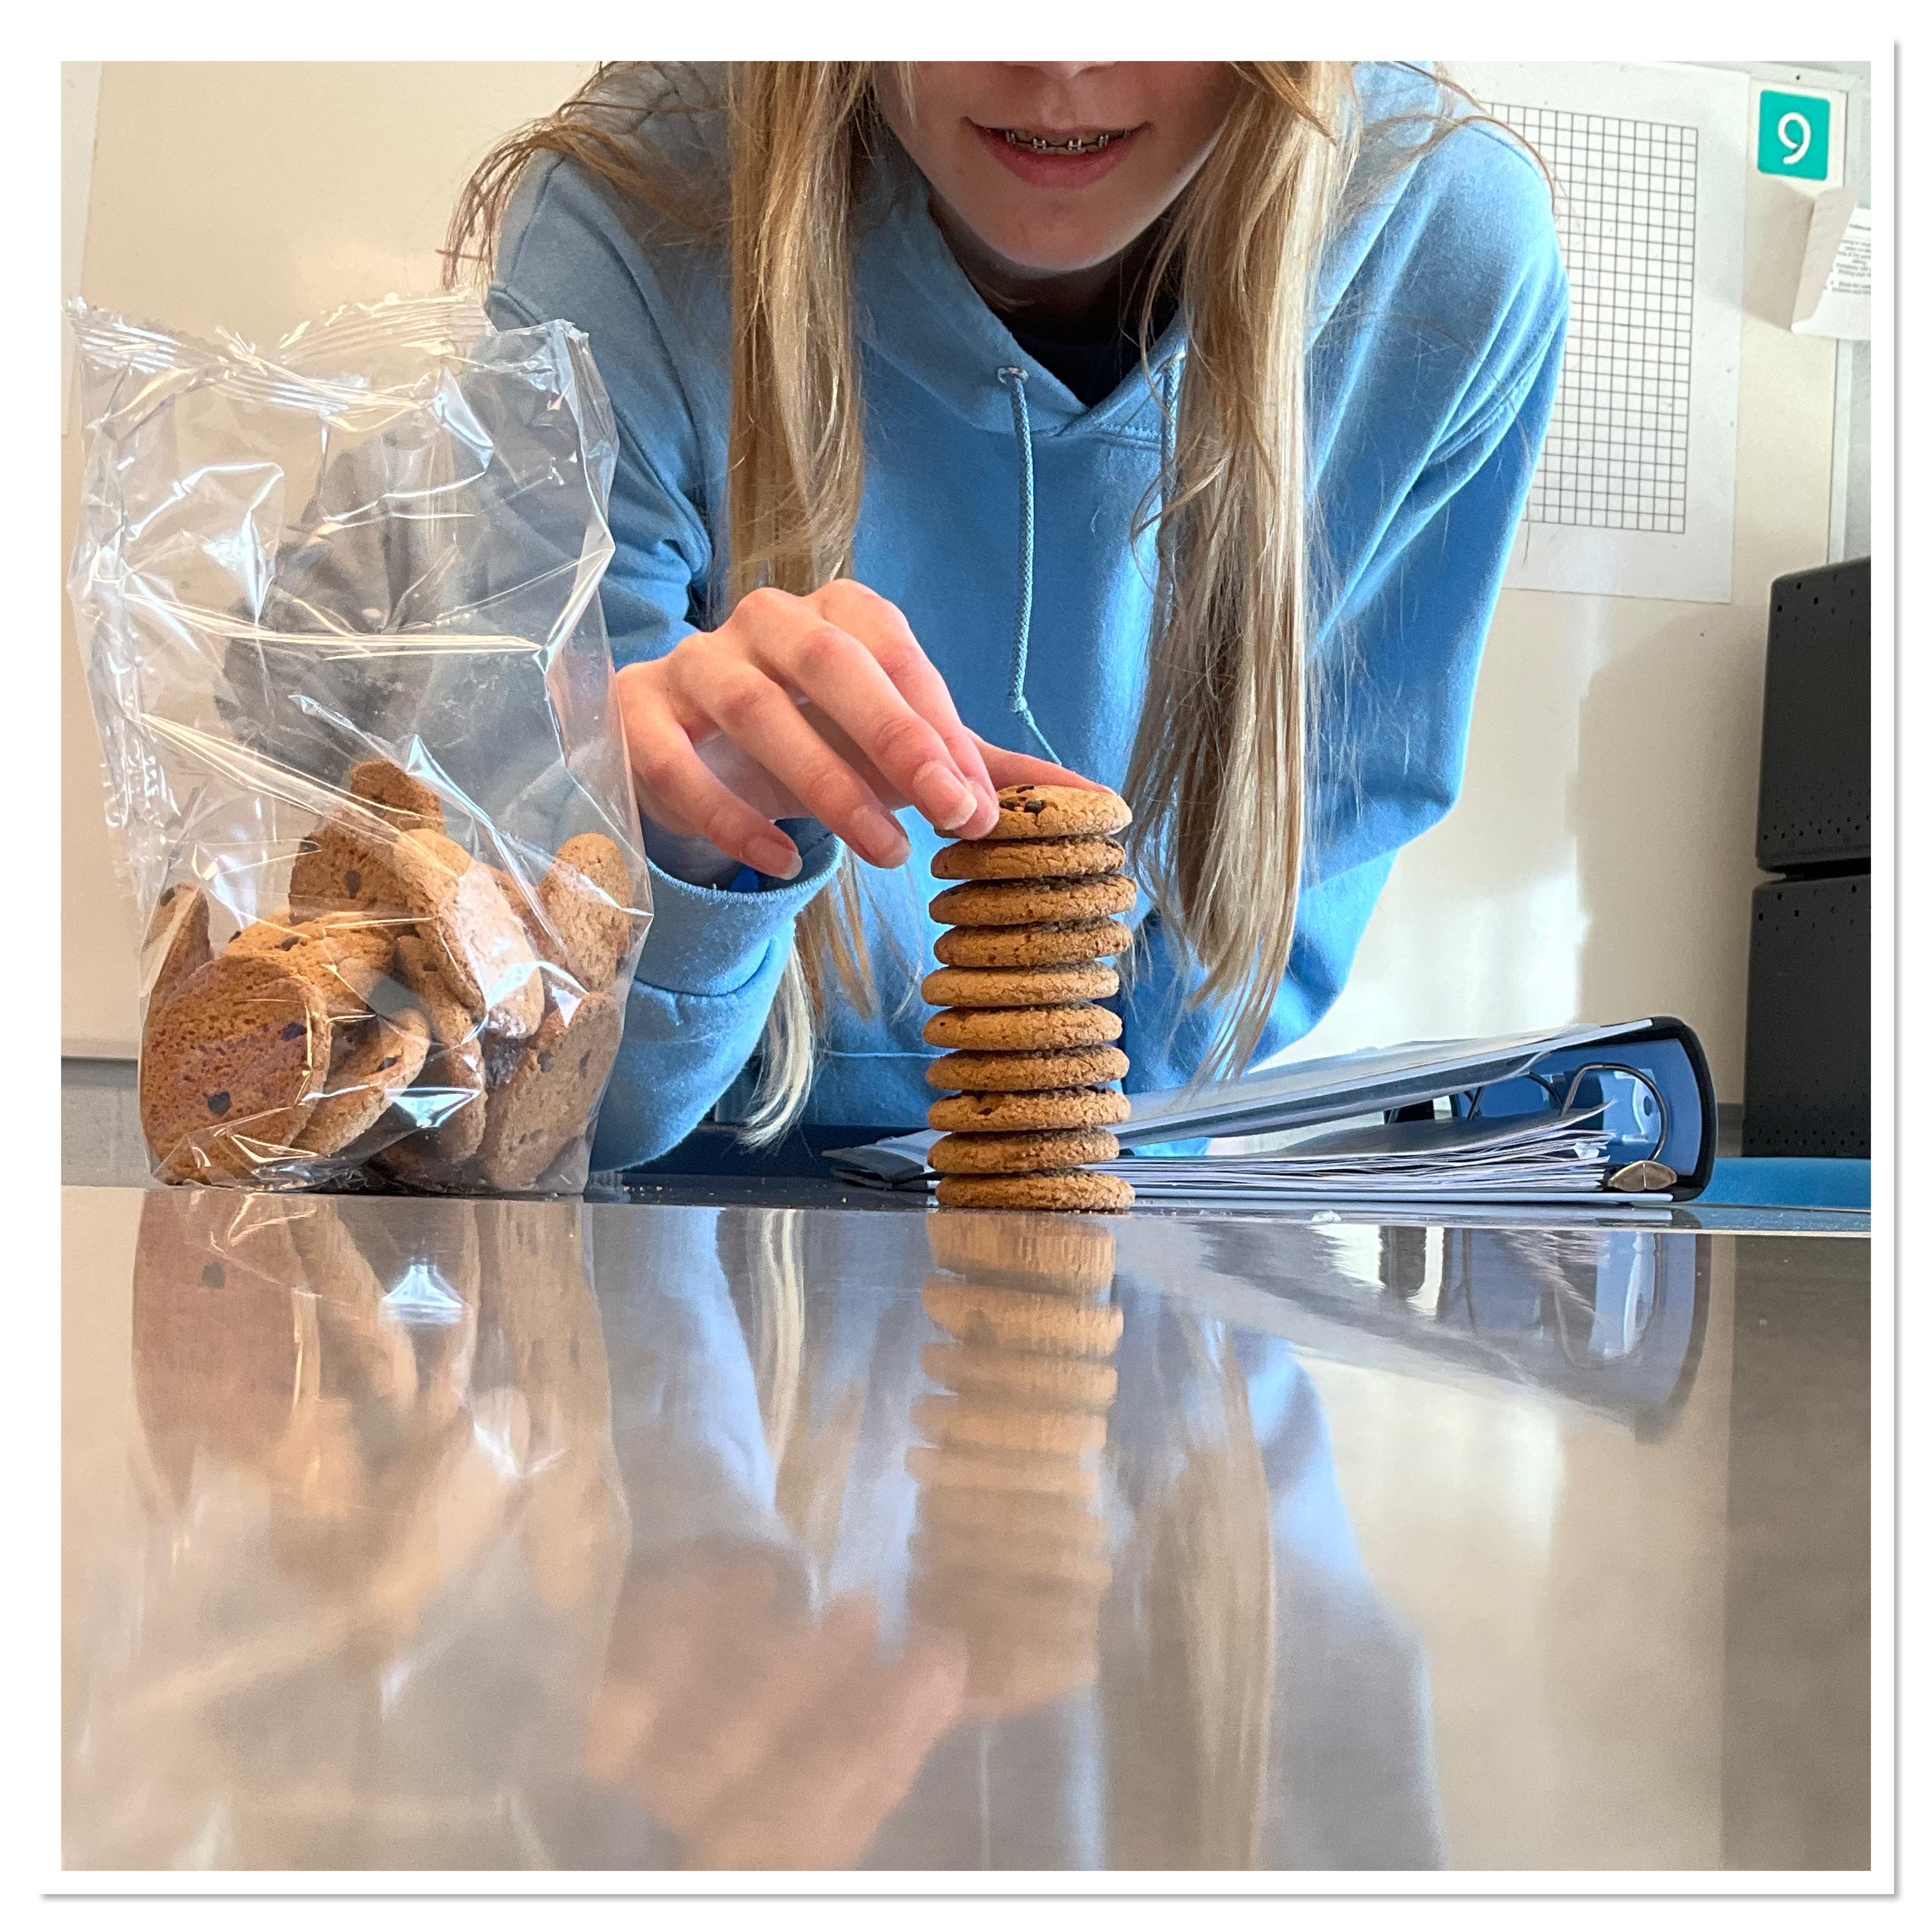
Grade 9s are working on data collection and representation. Today we gathered some single variable data by making cookie towers. The rules are: hold one cookie at a time and place it on the tower. Cookies are stacked one on top of the other. We want to create the tallest tower possible.

There were various strategies attempted. Our tallest tower was 16 cookies.
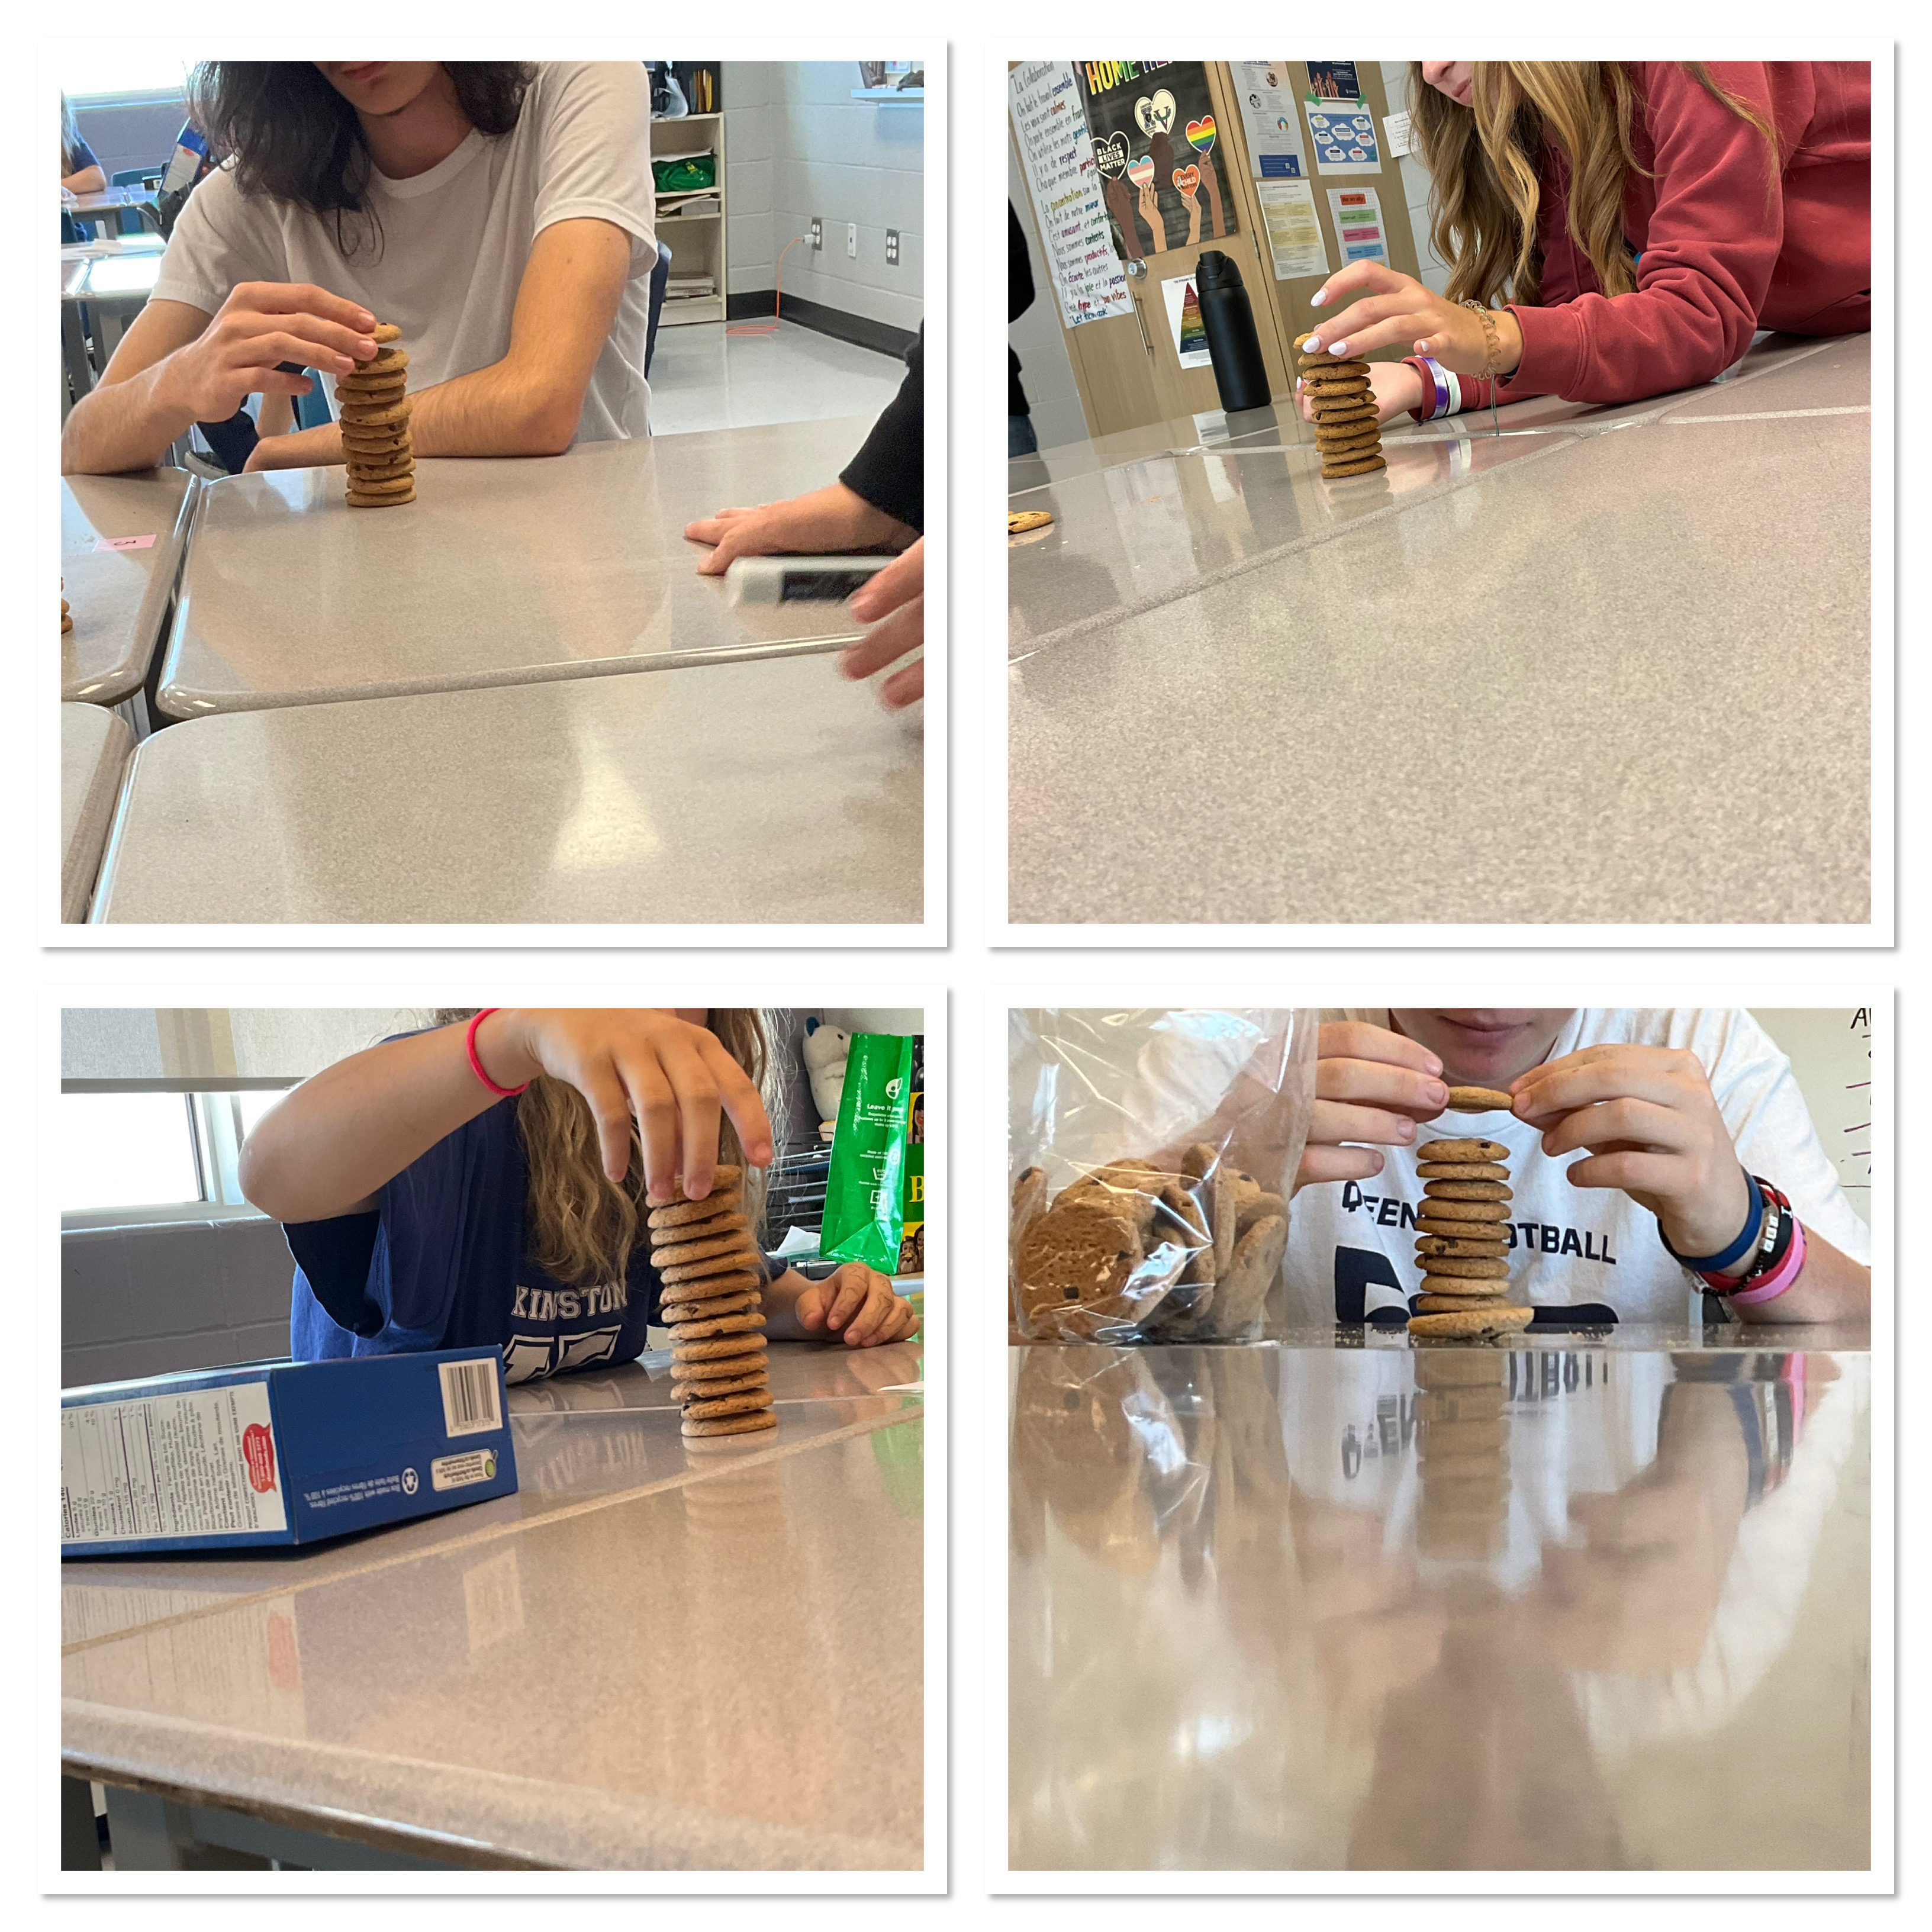
After each group had 12 attempts we calculated the mean, median, mode, and range. Then we learned how to represent data in a box and whisker plot.

It was a fun way to end the week.
