Catapults as a Culminating Task
In Grade 10 math we’re working towards our mastery of quadratics and problem solving, and are currently analyzing the trajectory of a pompom flung from a catapult as our culminating task for the course.
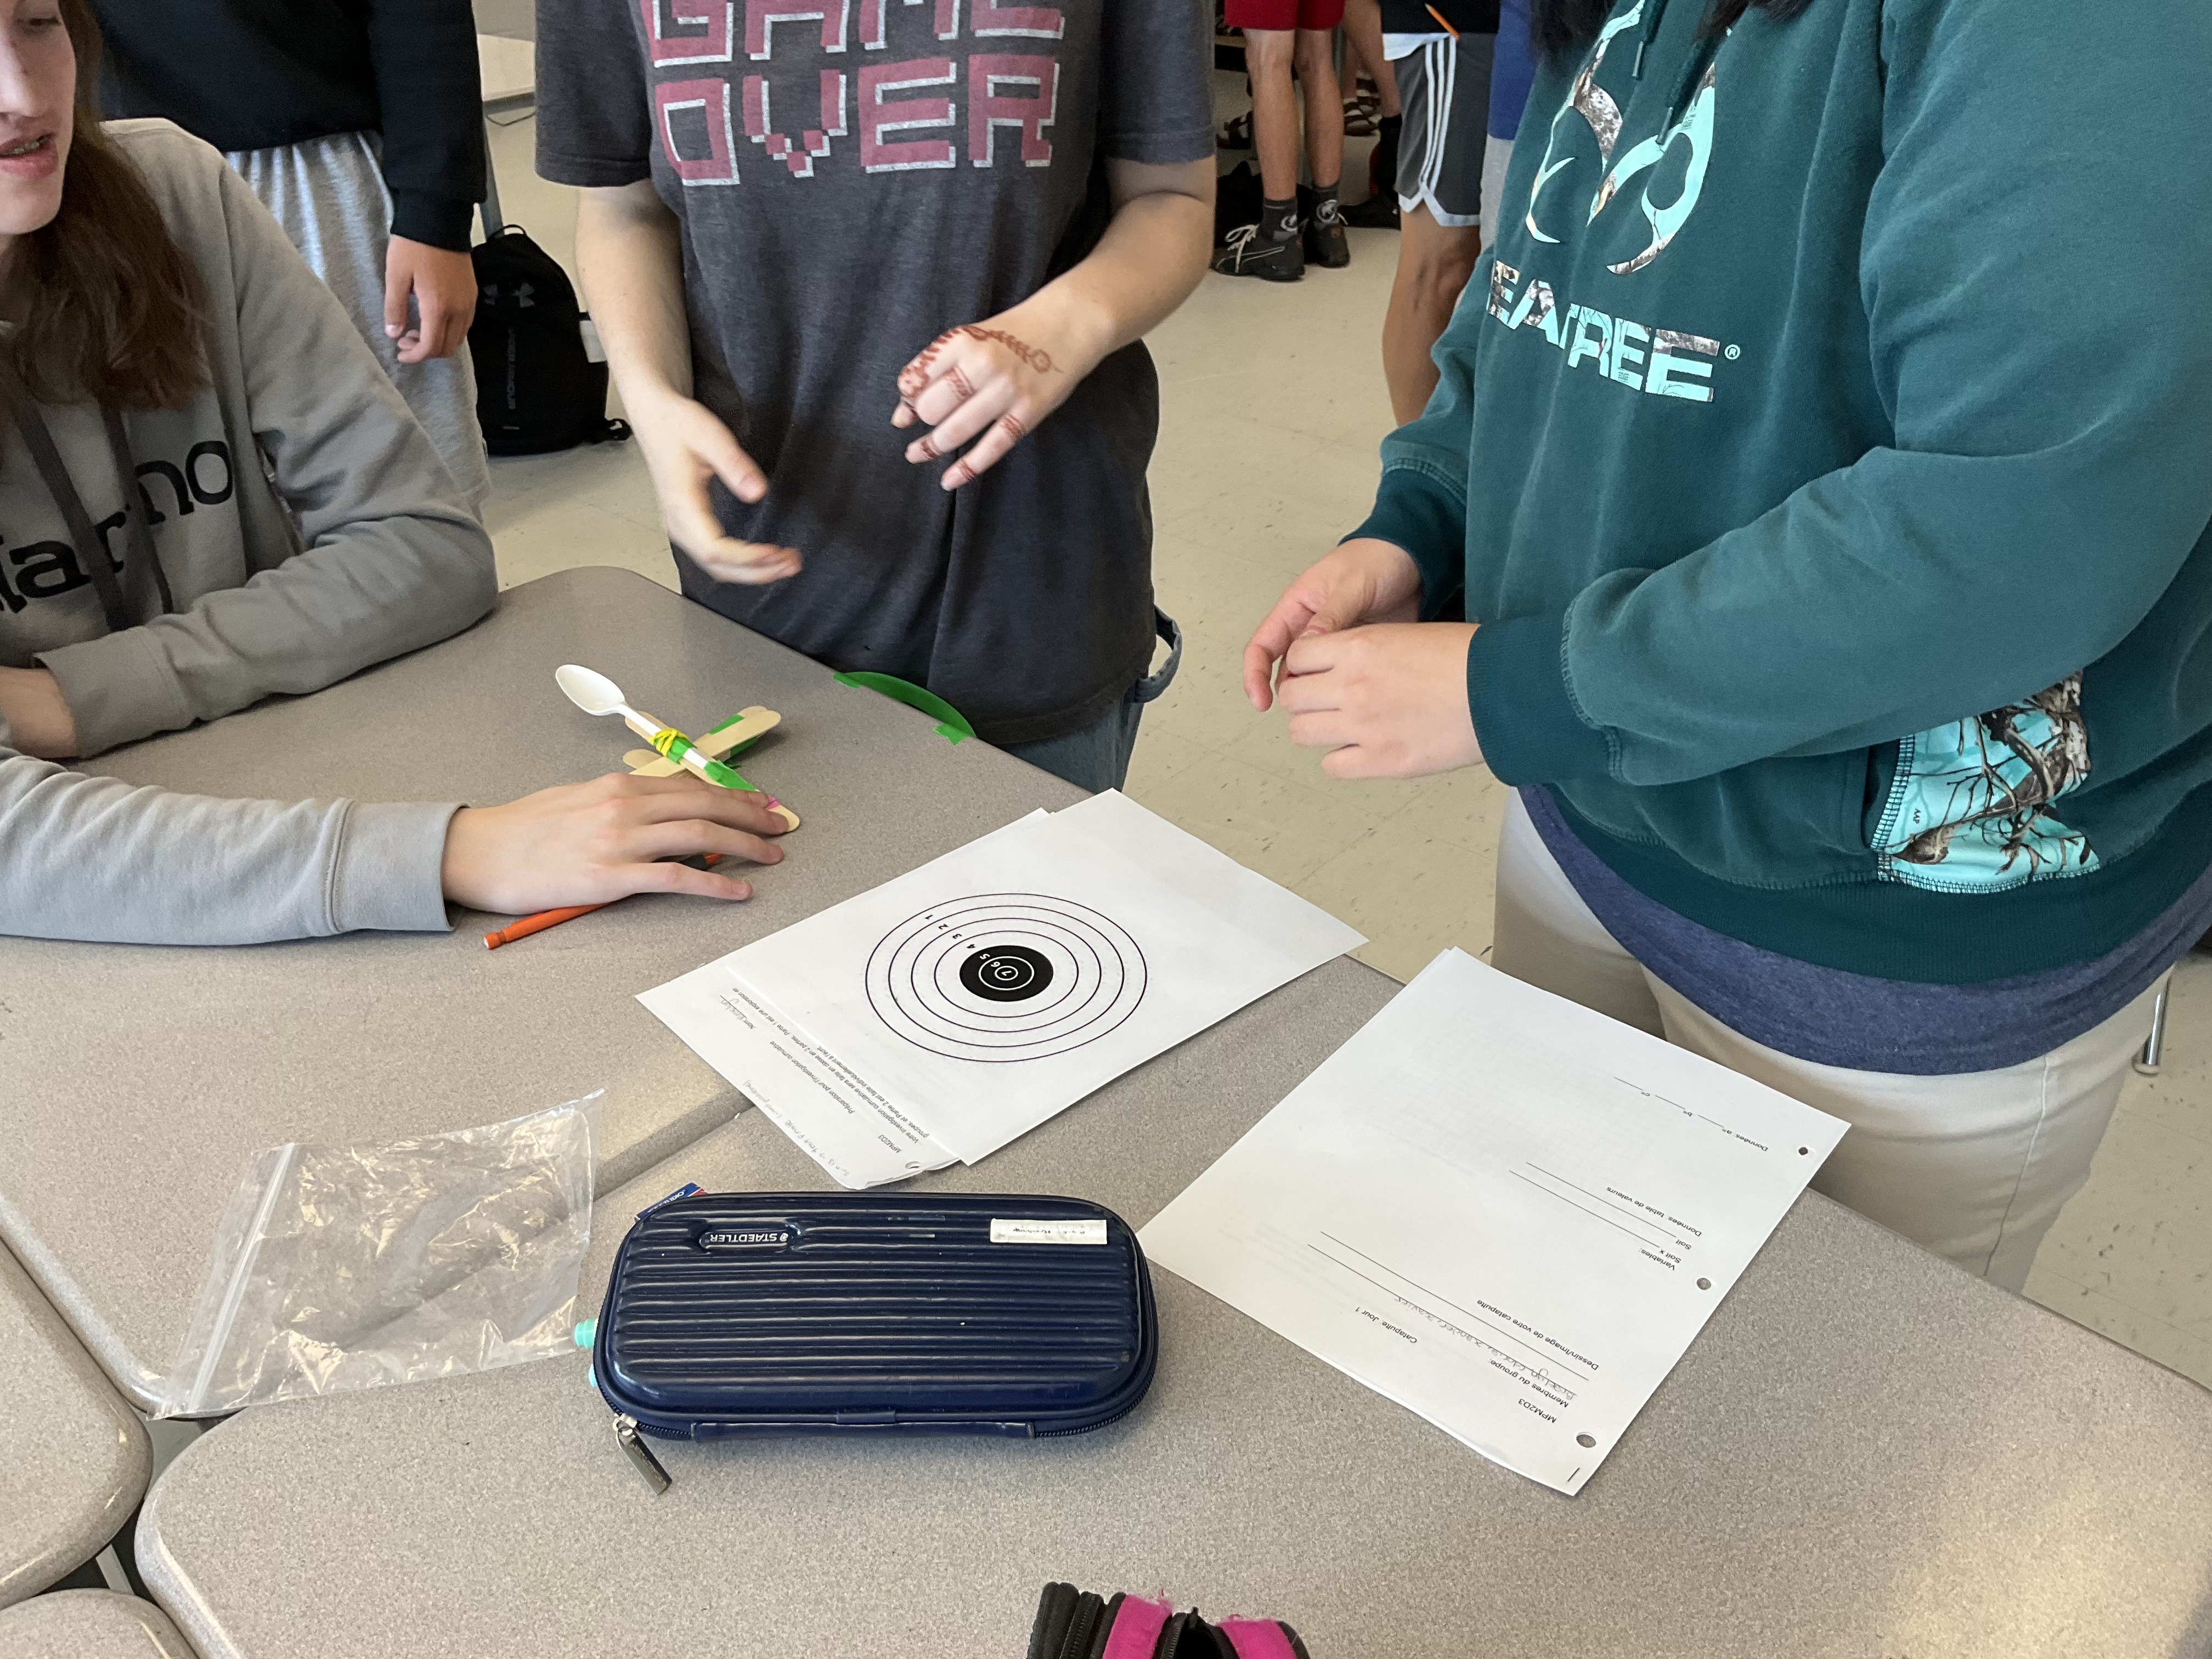
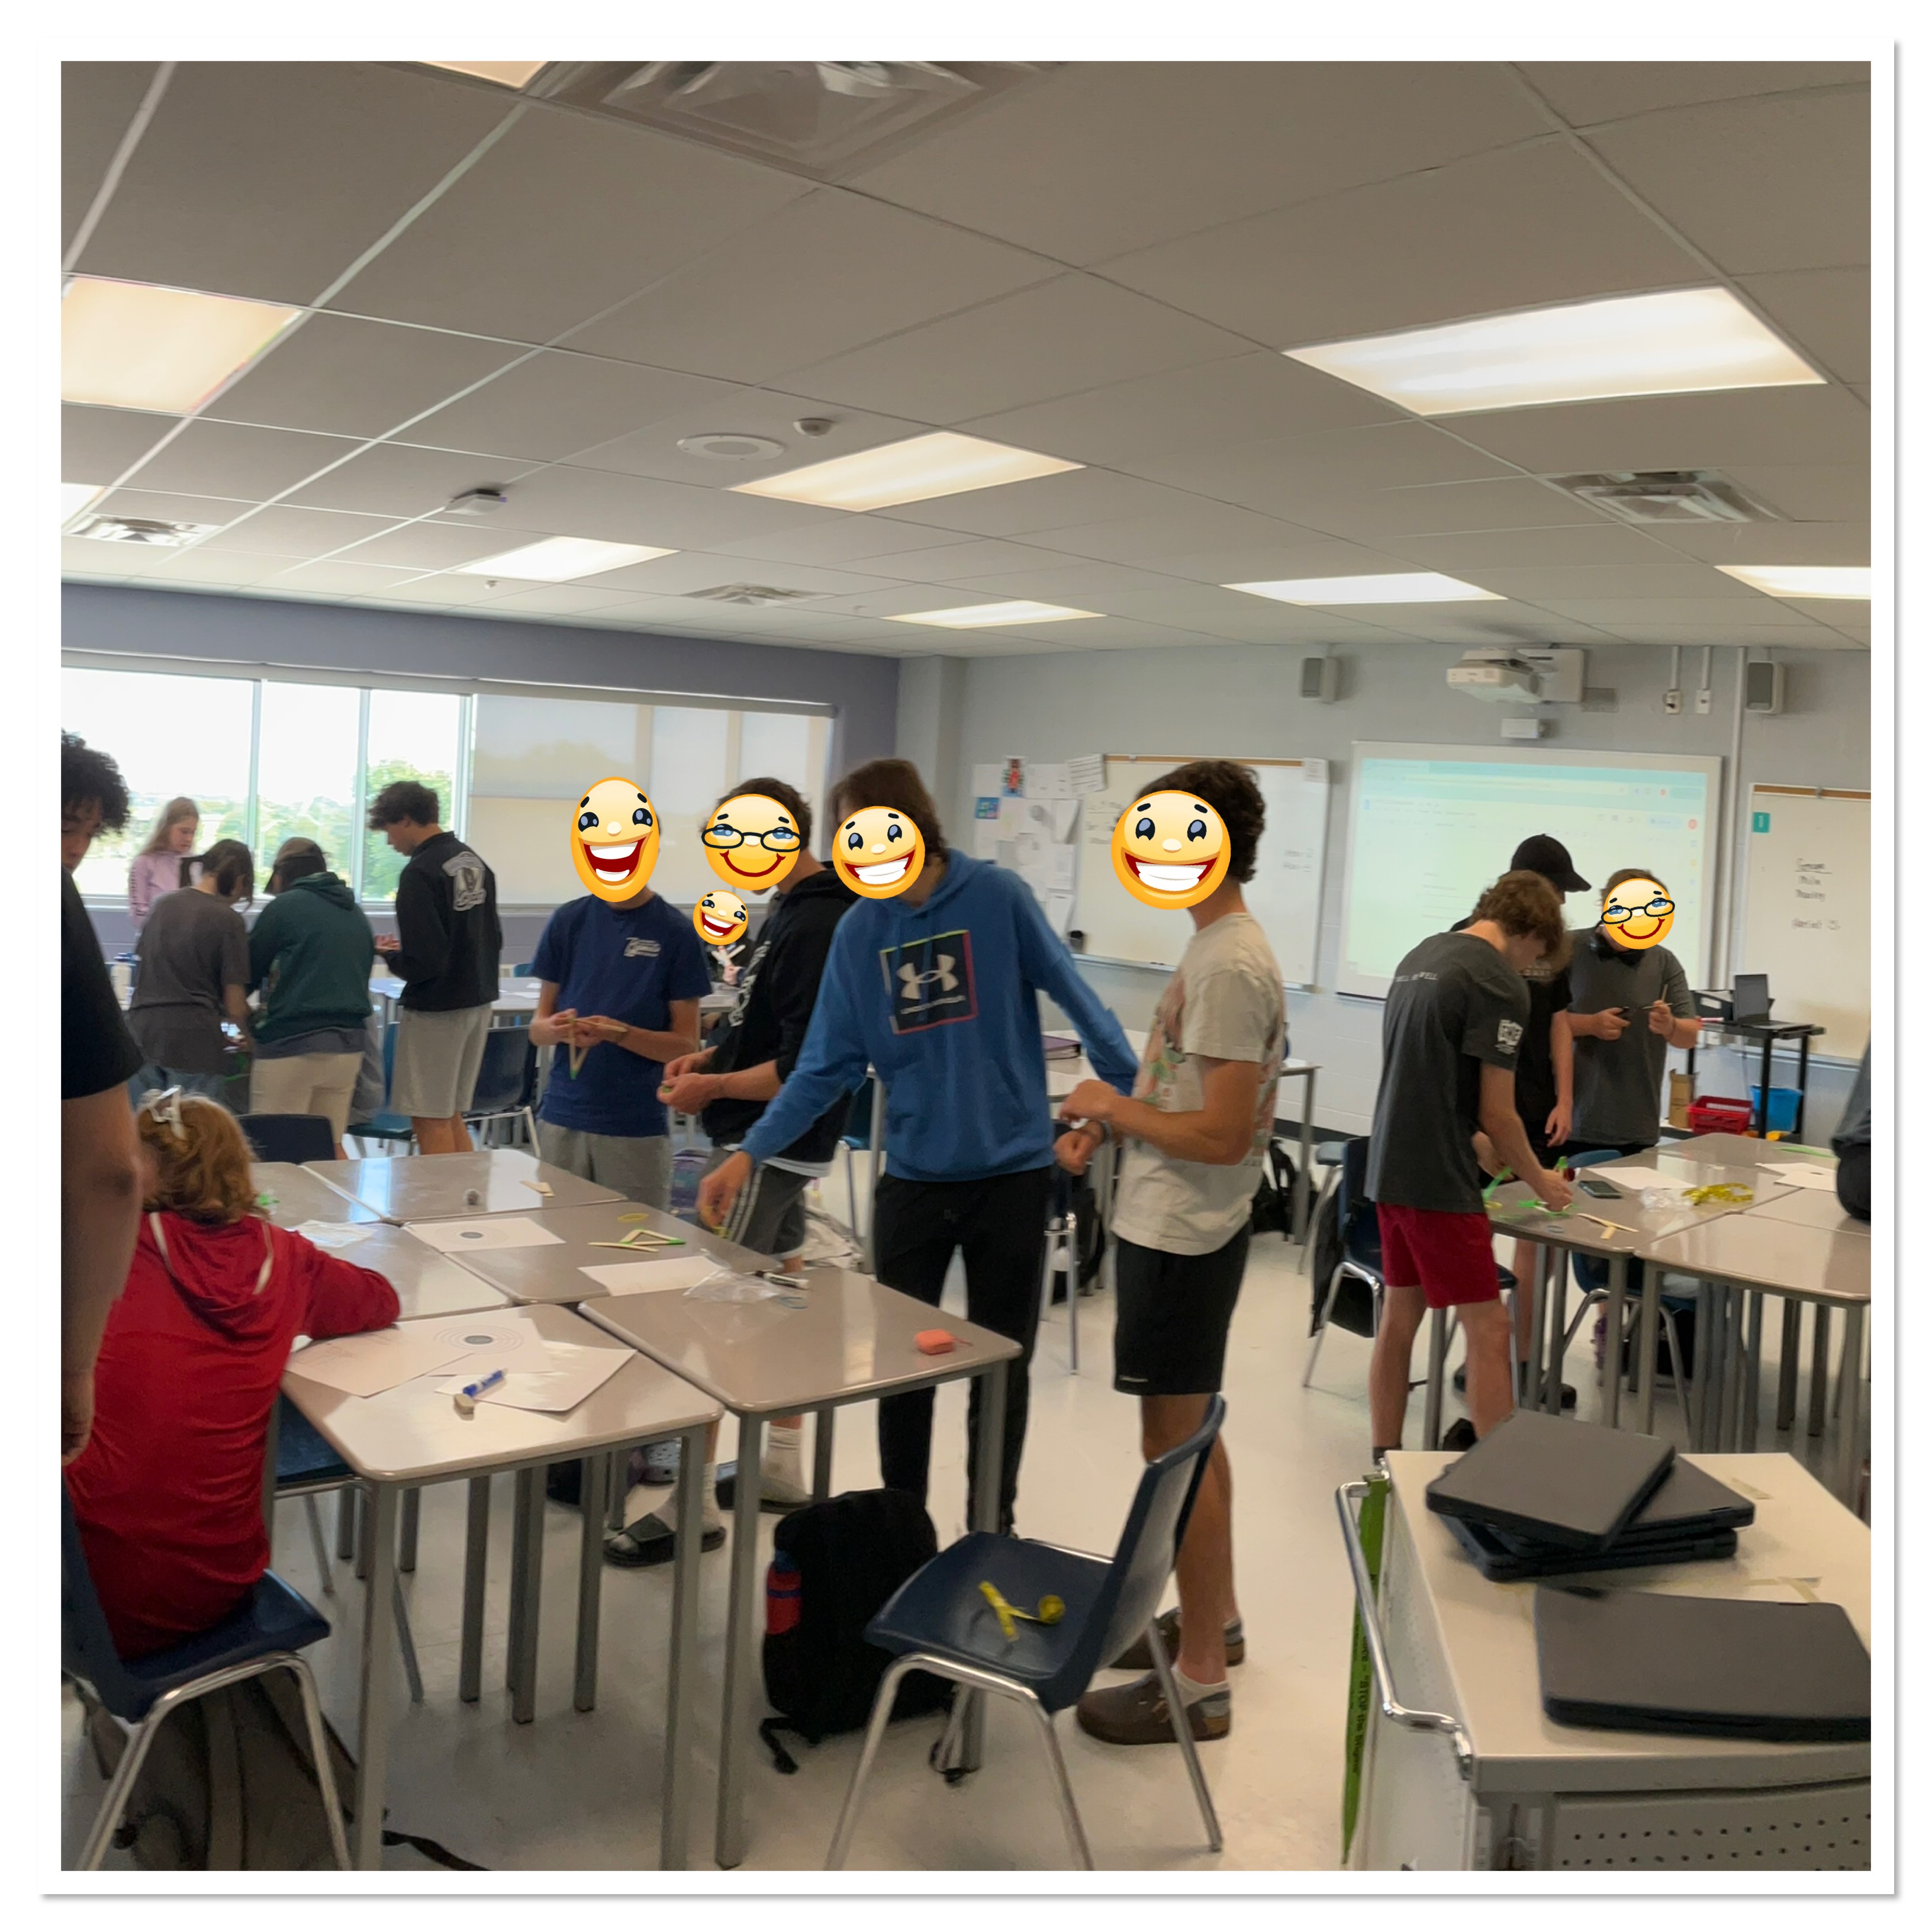
Each group of 4 students got a small sandwich bag with 10 popsicle sticks/tongue depressors, 3 elastics, a plastic spoon and a pompom. Each group also got some tape, a measuring tape, a print out of a target, and a work package to help them direct their learning and organize their information.
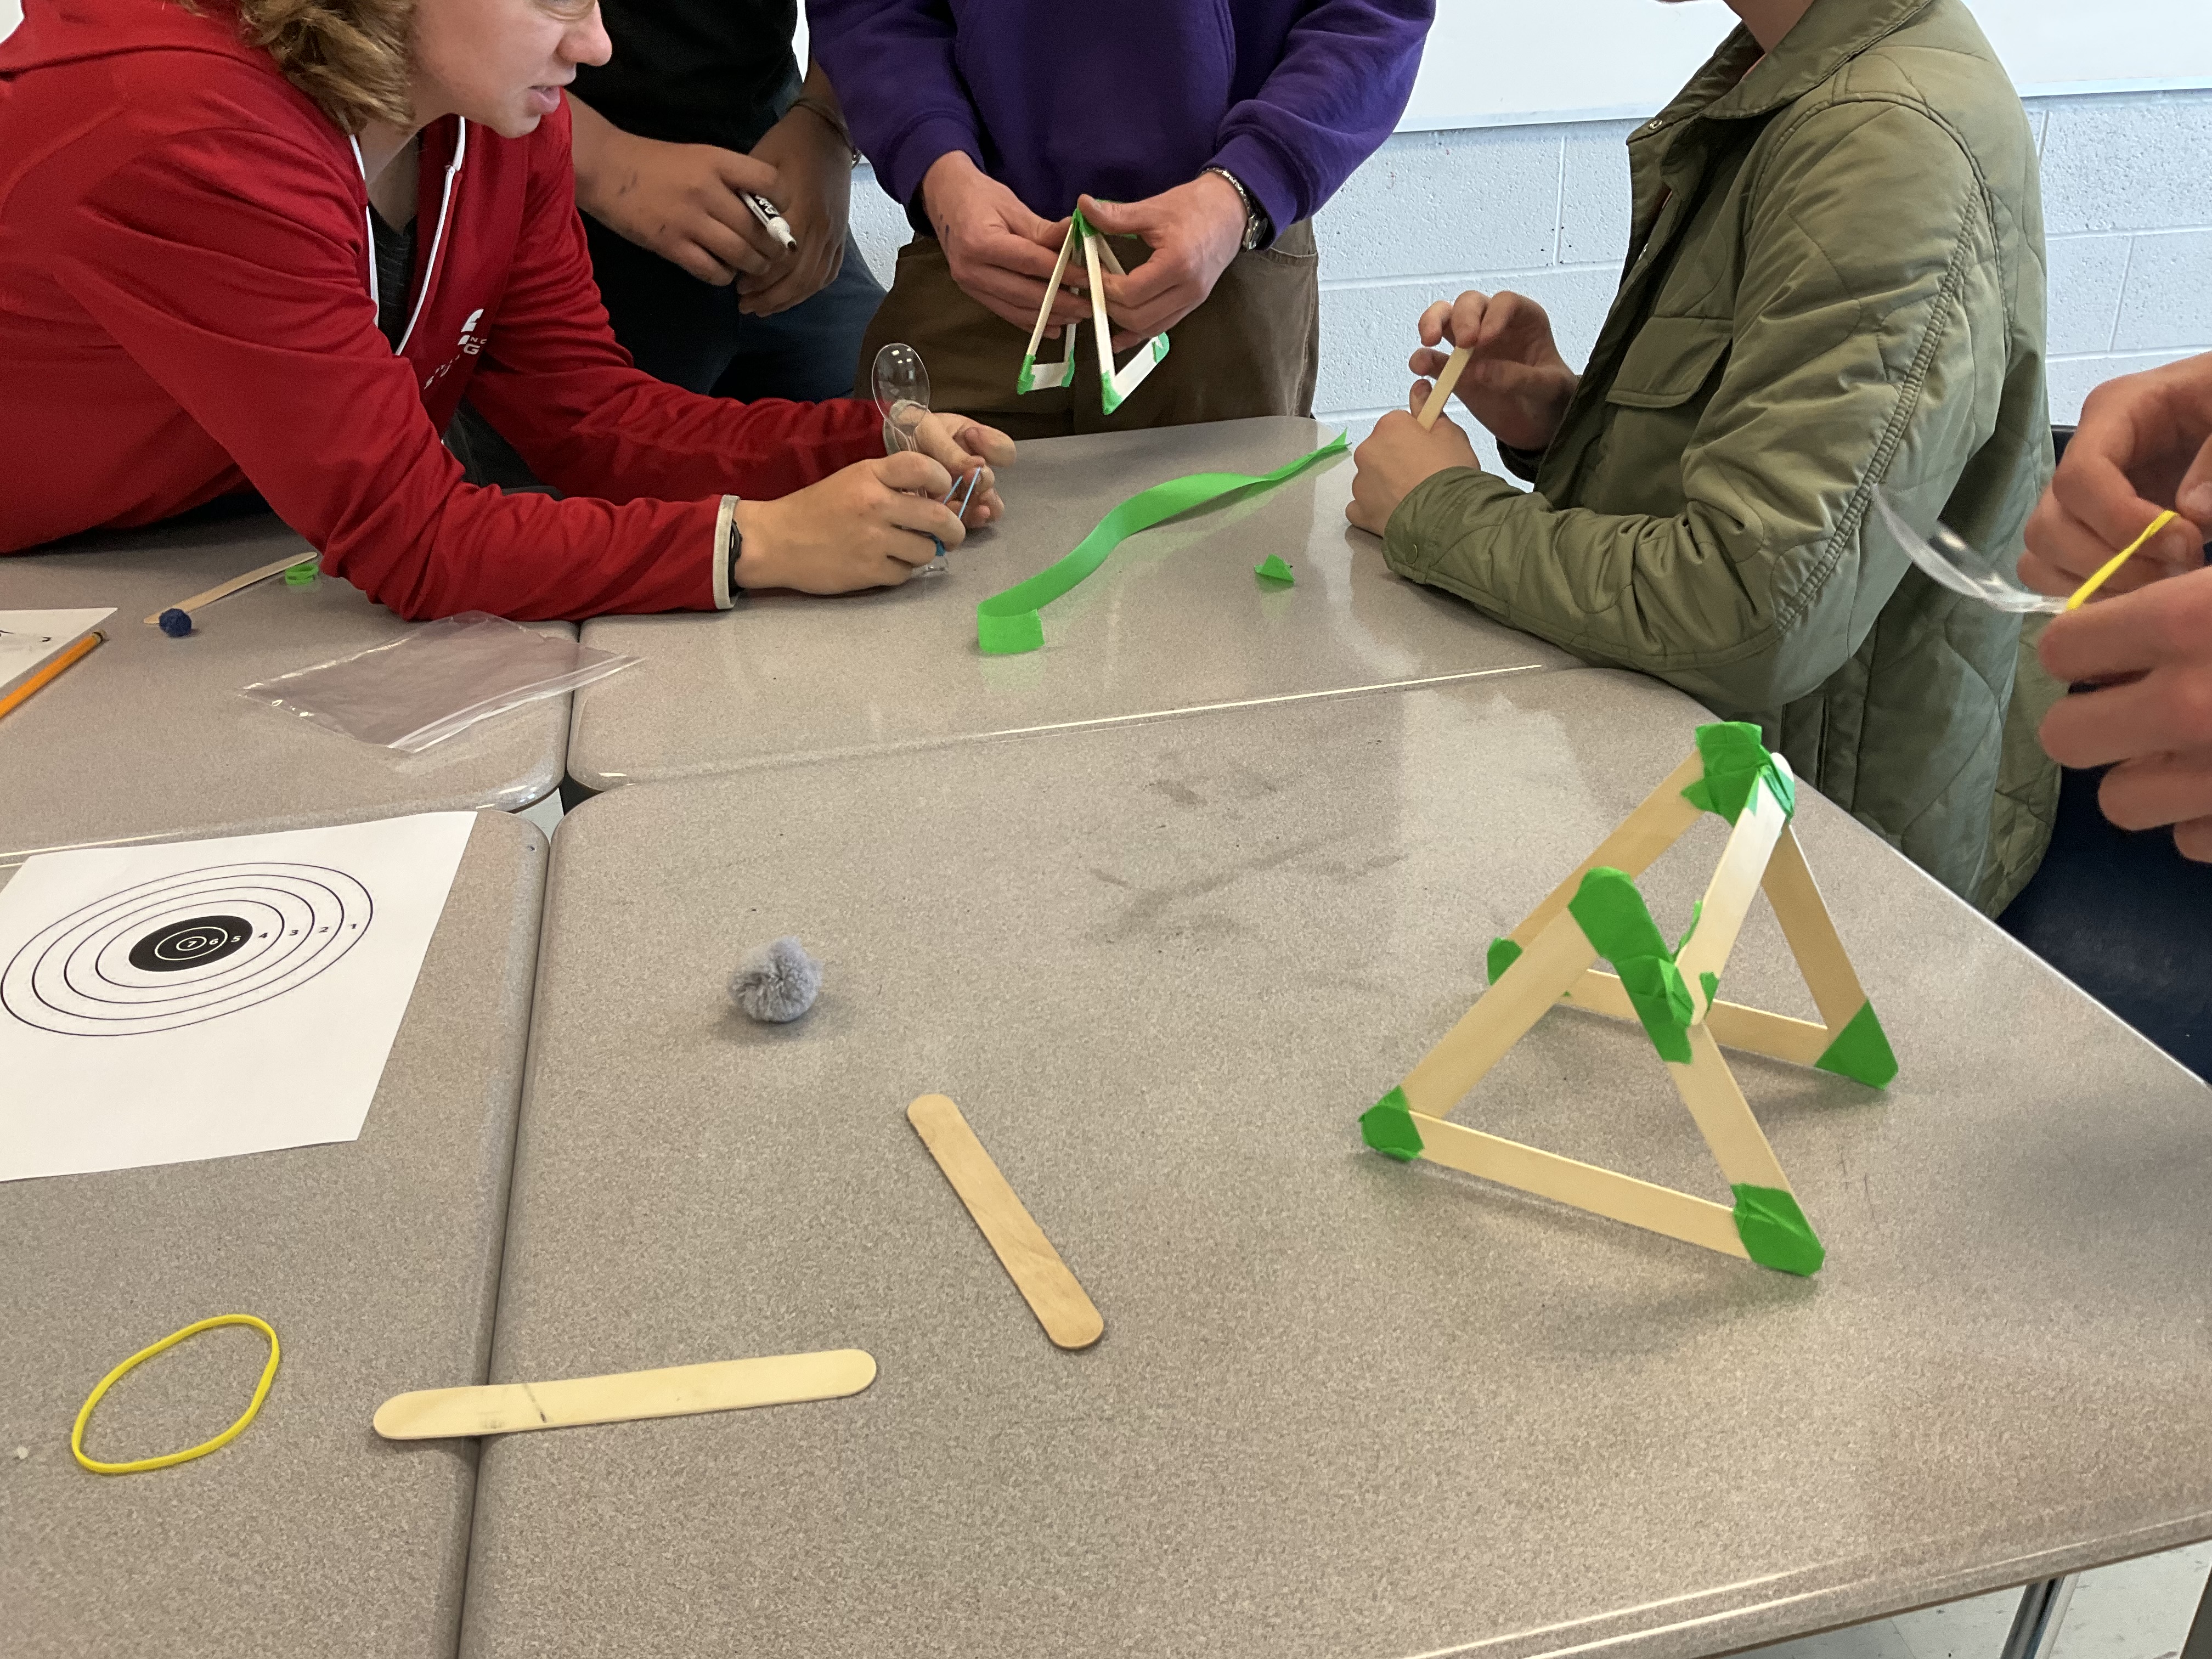
There were many different ways that groups designed their catapults. It is interesting to see how varied the trajectories were!
Groups came one at a time to the hallway to use the app “Visual Physics” to video their projectile.
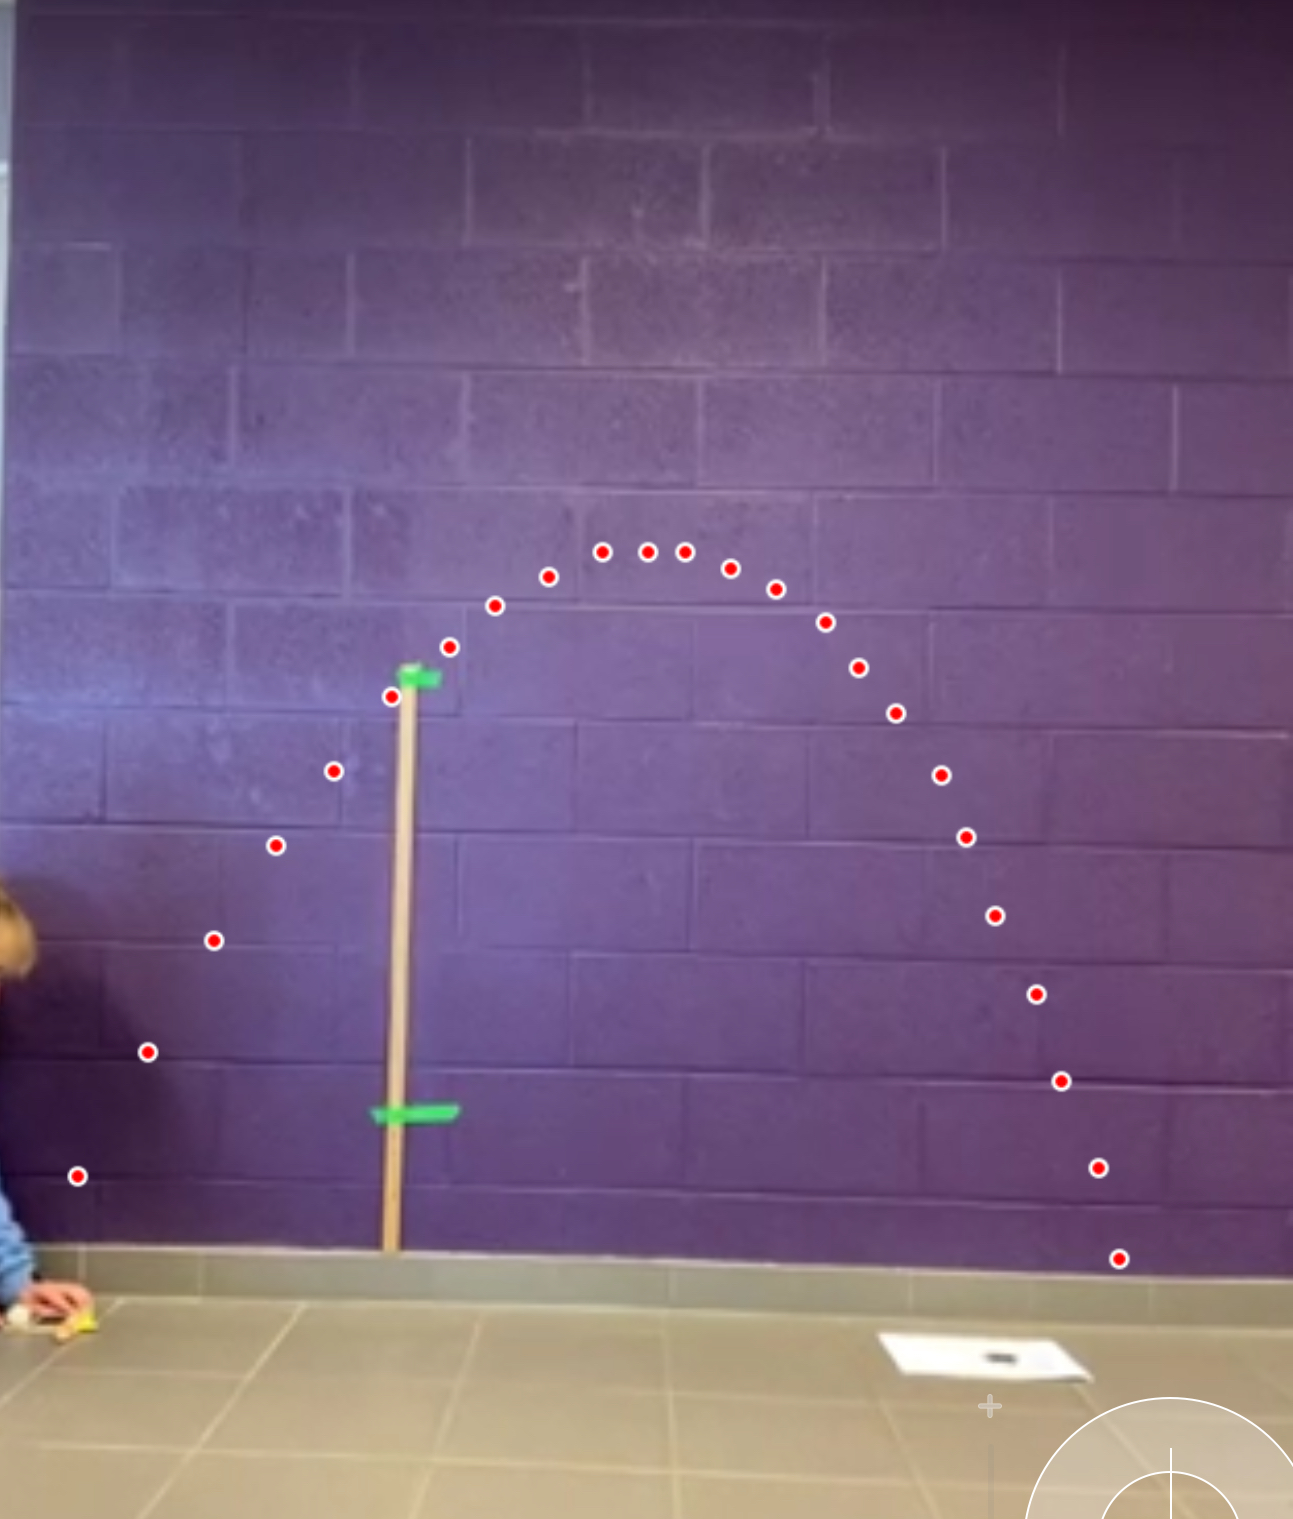
The app lets you step through the video frame by frame and locate the position of the pompom. We used a white pompom to see it against our purple wall. It’s important to use a meter stick to add a calibration scale so our data can all be reasonable and comparable when it is exported.
The video and data points are then exported to a different app called “Graphical GW” to be analysed. We can select different ways to show the data. We chose a table and a graph, comparing the horizontal and vertical distances as x and y. We can apply a curve fit too which will provide an “a”, “b” and “c” value for the standard form equation.
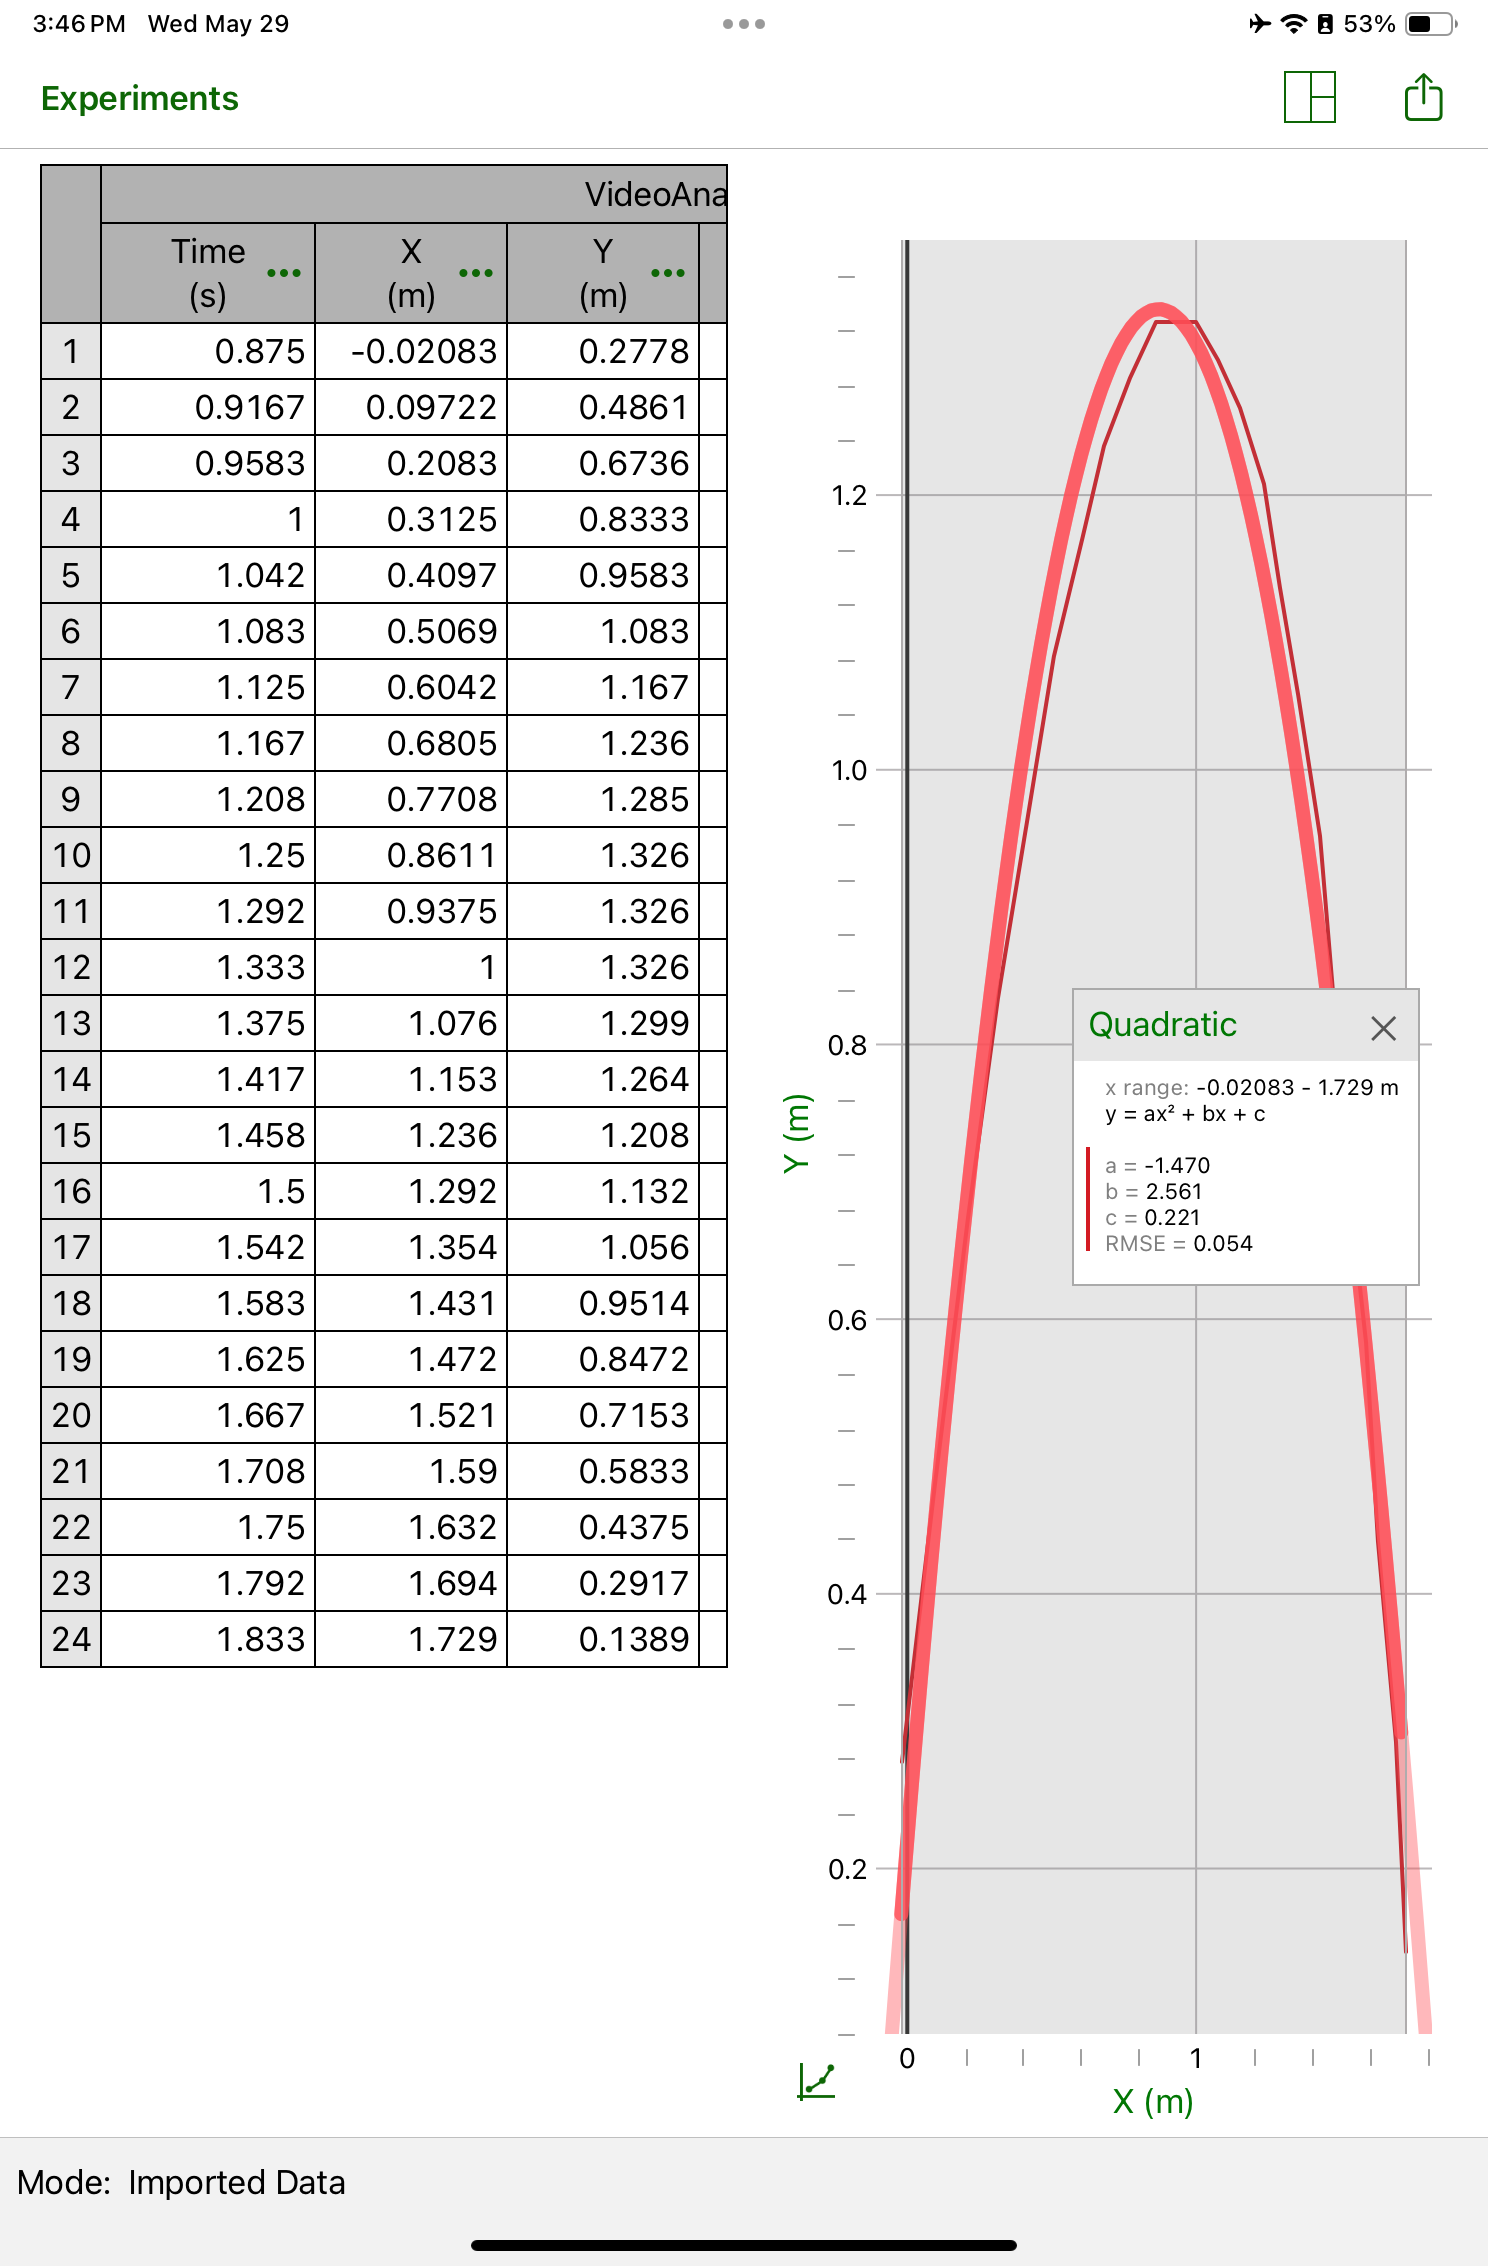
We can see that the table will let us create an equation in vertex form, and we can calculate the “a” value and compare it to what we have from the curve fit. We can use the equations to calculate the x intercepts and predict where the pompom will hit the ground.
All seven groups got their catapults made and data collected today. Tomorrow we will work on the analysis and get some feedback and think of some good extension questions to tackle.
Our final step will be to give students a set of data, similar to what they used today, and have them repeat the process individually, and answer some extension questions.
Each time we work through this process, I try to refine what I do. Last year, prepackaging the materials was my improvement. This year it was to give them a target and measuring tape, and to scaffold the collection of data and analysis with a work package. Next year it will be to establish a “how to clean up” process, as with all the excitement we ended up with a lot of debris around the room!
As with a lot of these tasks, it is important to let go of the reins a little, and let students take control of their learning and own the task. Since we have worked in groups all term, we have broken down many barriers, and students are getting very good at helping each other and asking each other good questions. At this point in the year they have learned a lot and are getting quite confident with their skills, which is great to see.
Area Model for Expanding and Factoring
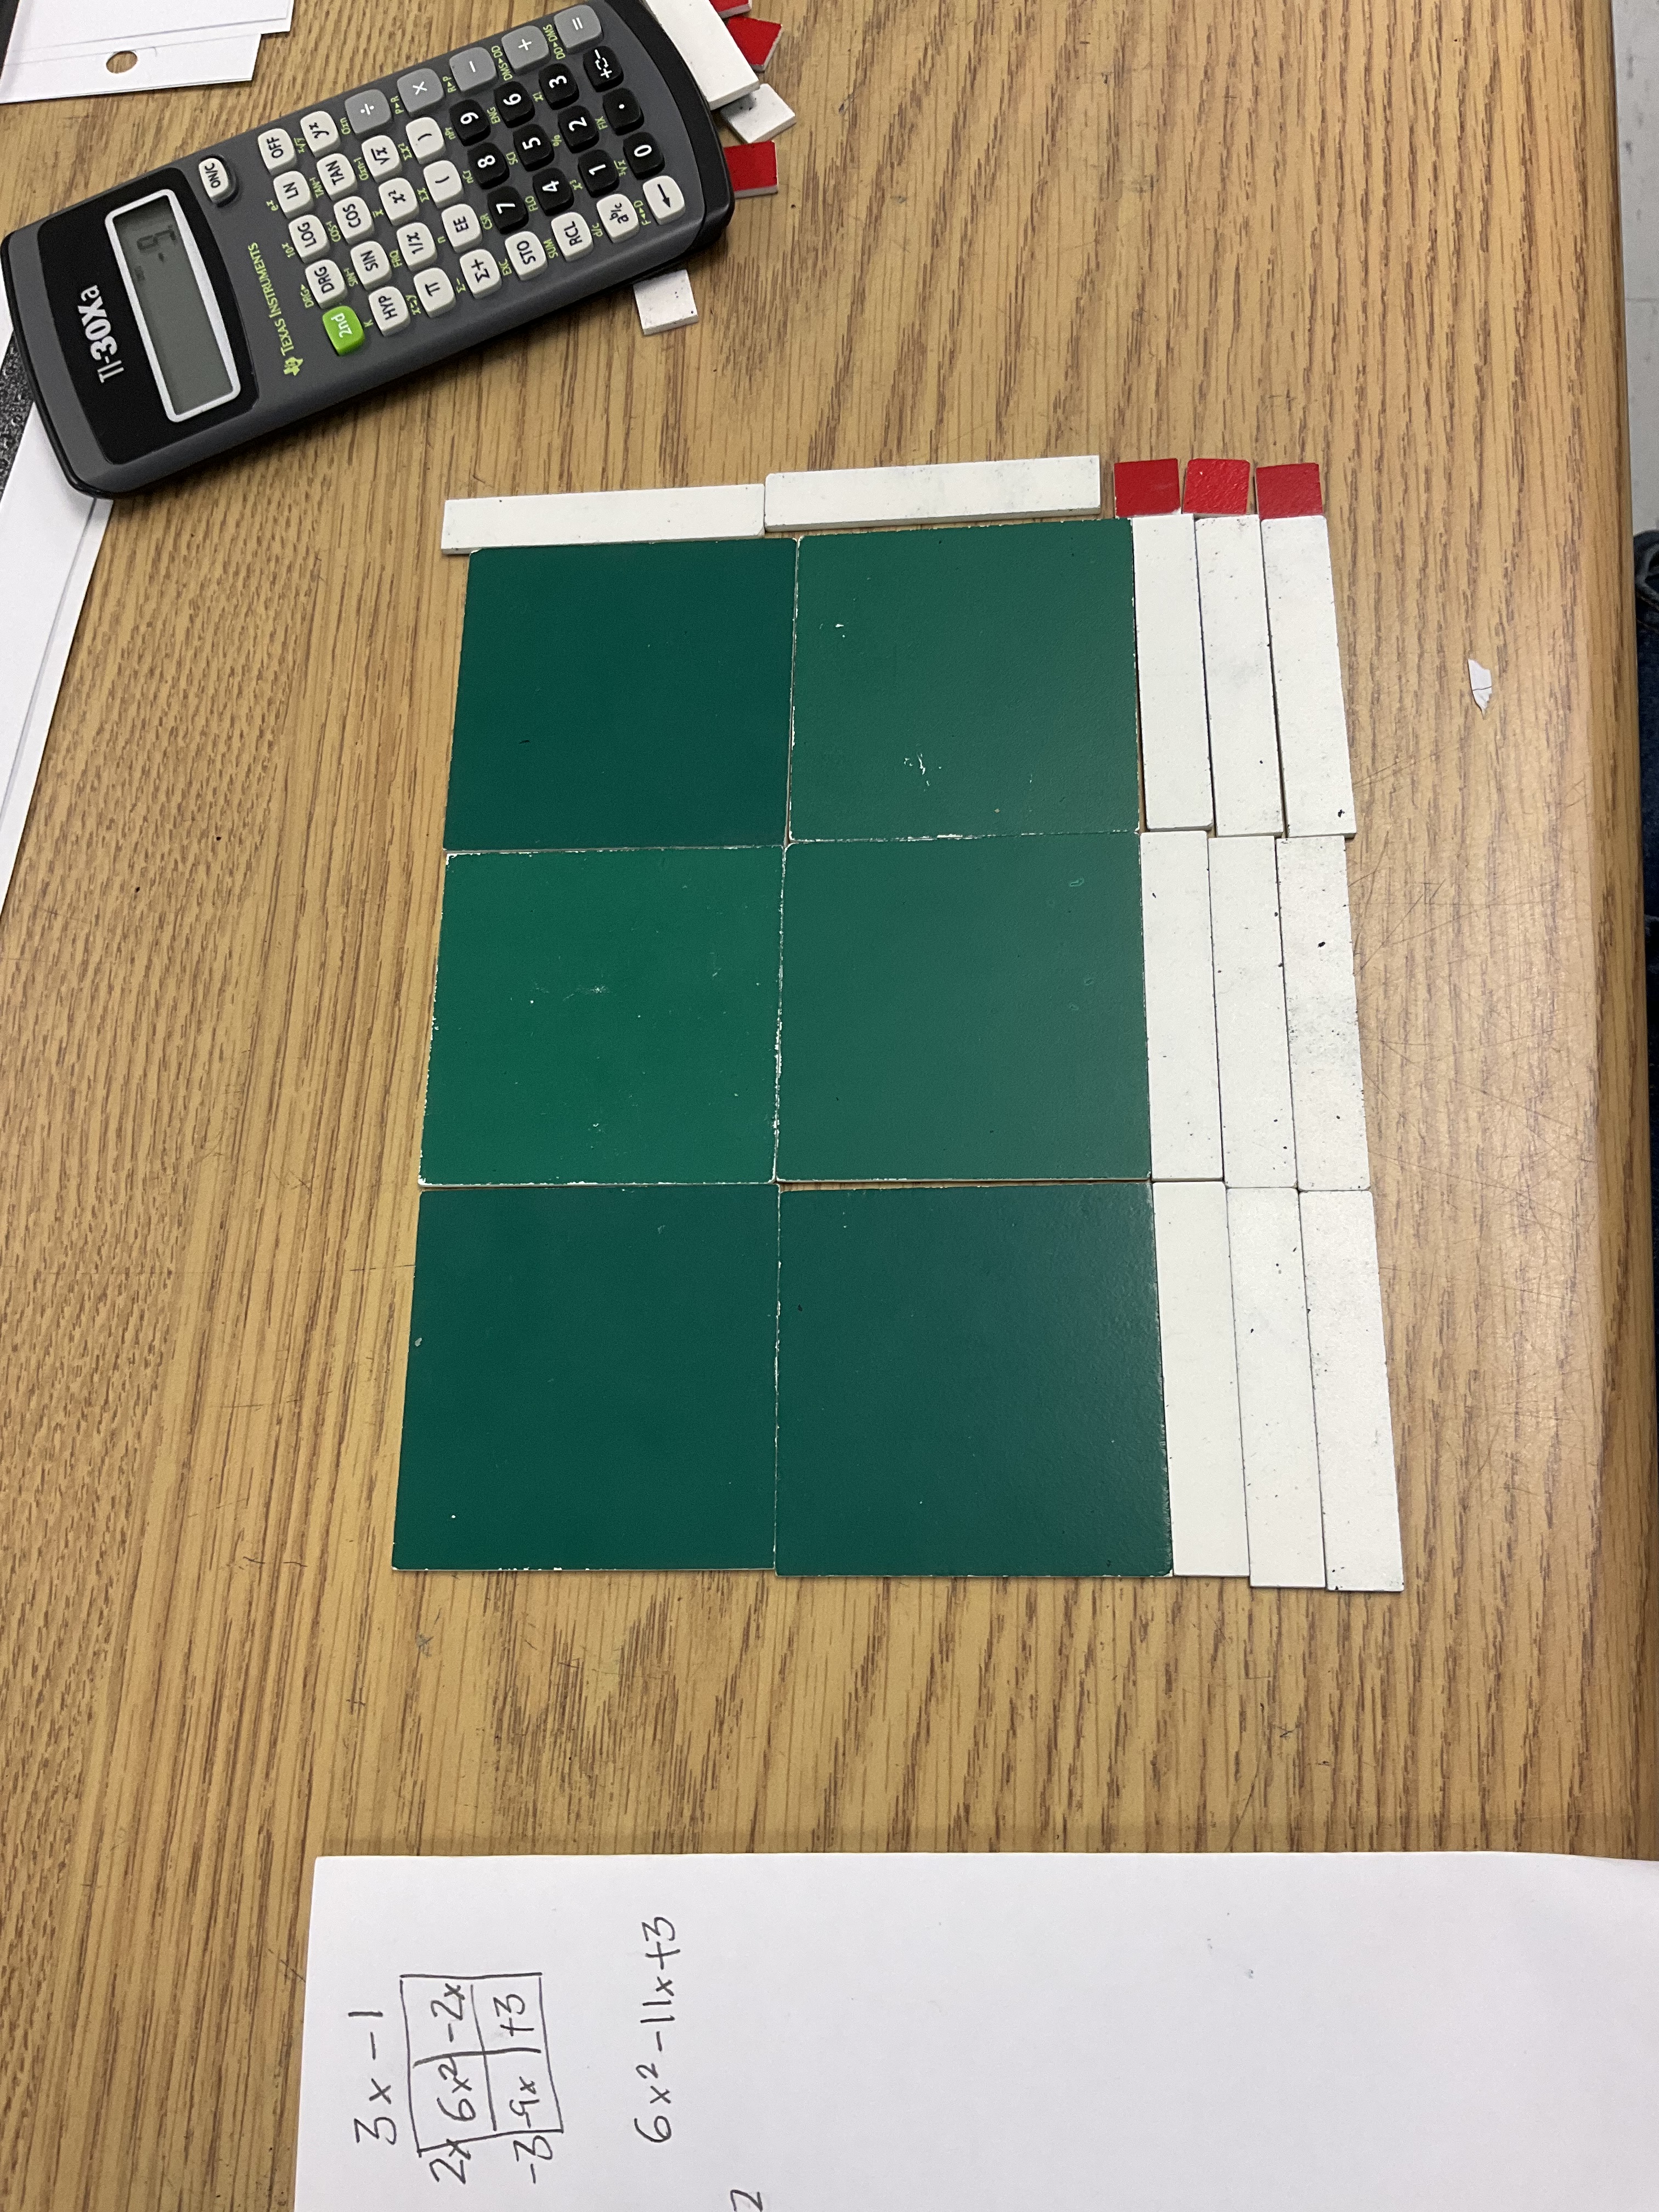
I’ve been helping out in a grade 10 applied math class during my prep time this month. One of the students I’ve been working with has become a master of algebra tiles for expanding and factoring quadratics.

We worked on expanding with the area model when it was not convenient to use tiles, and both processes are becoming quite natural.
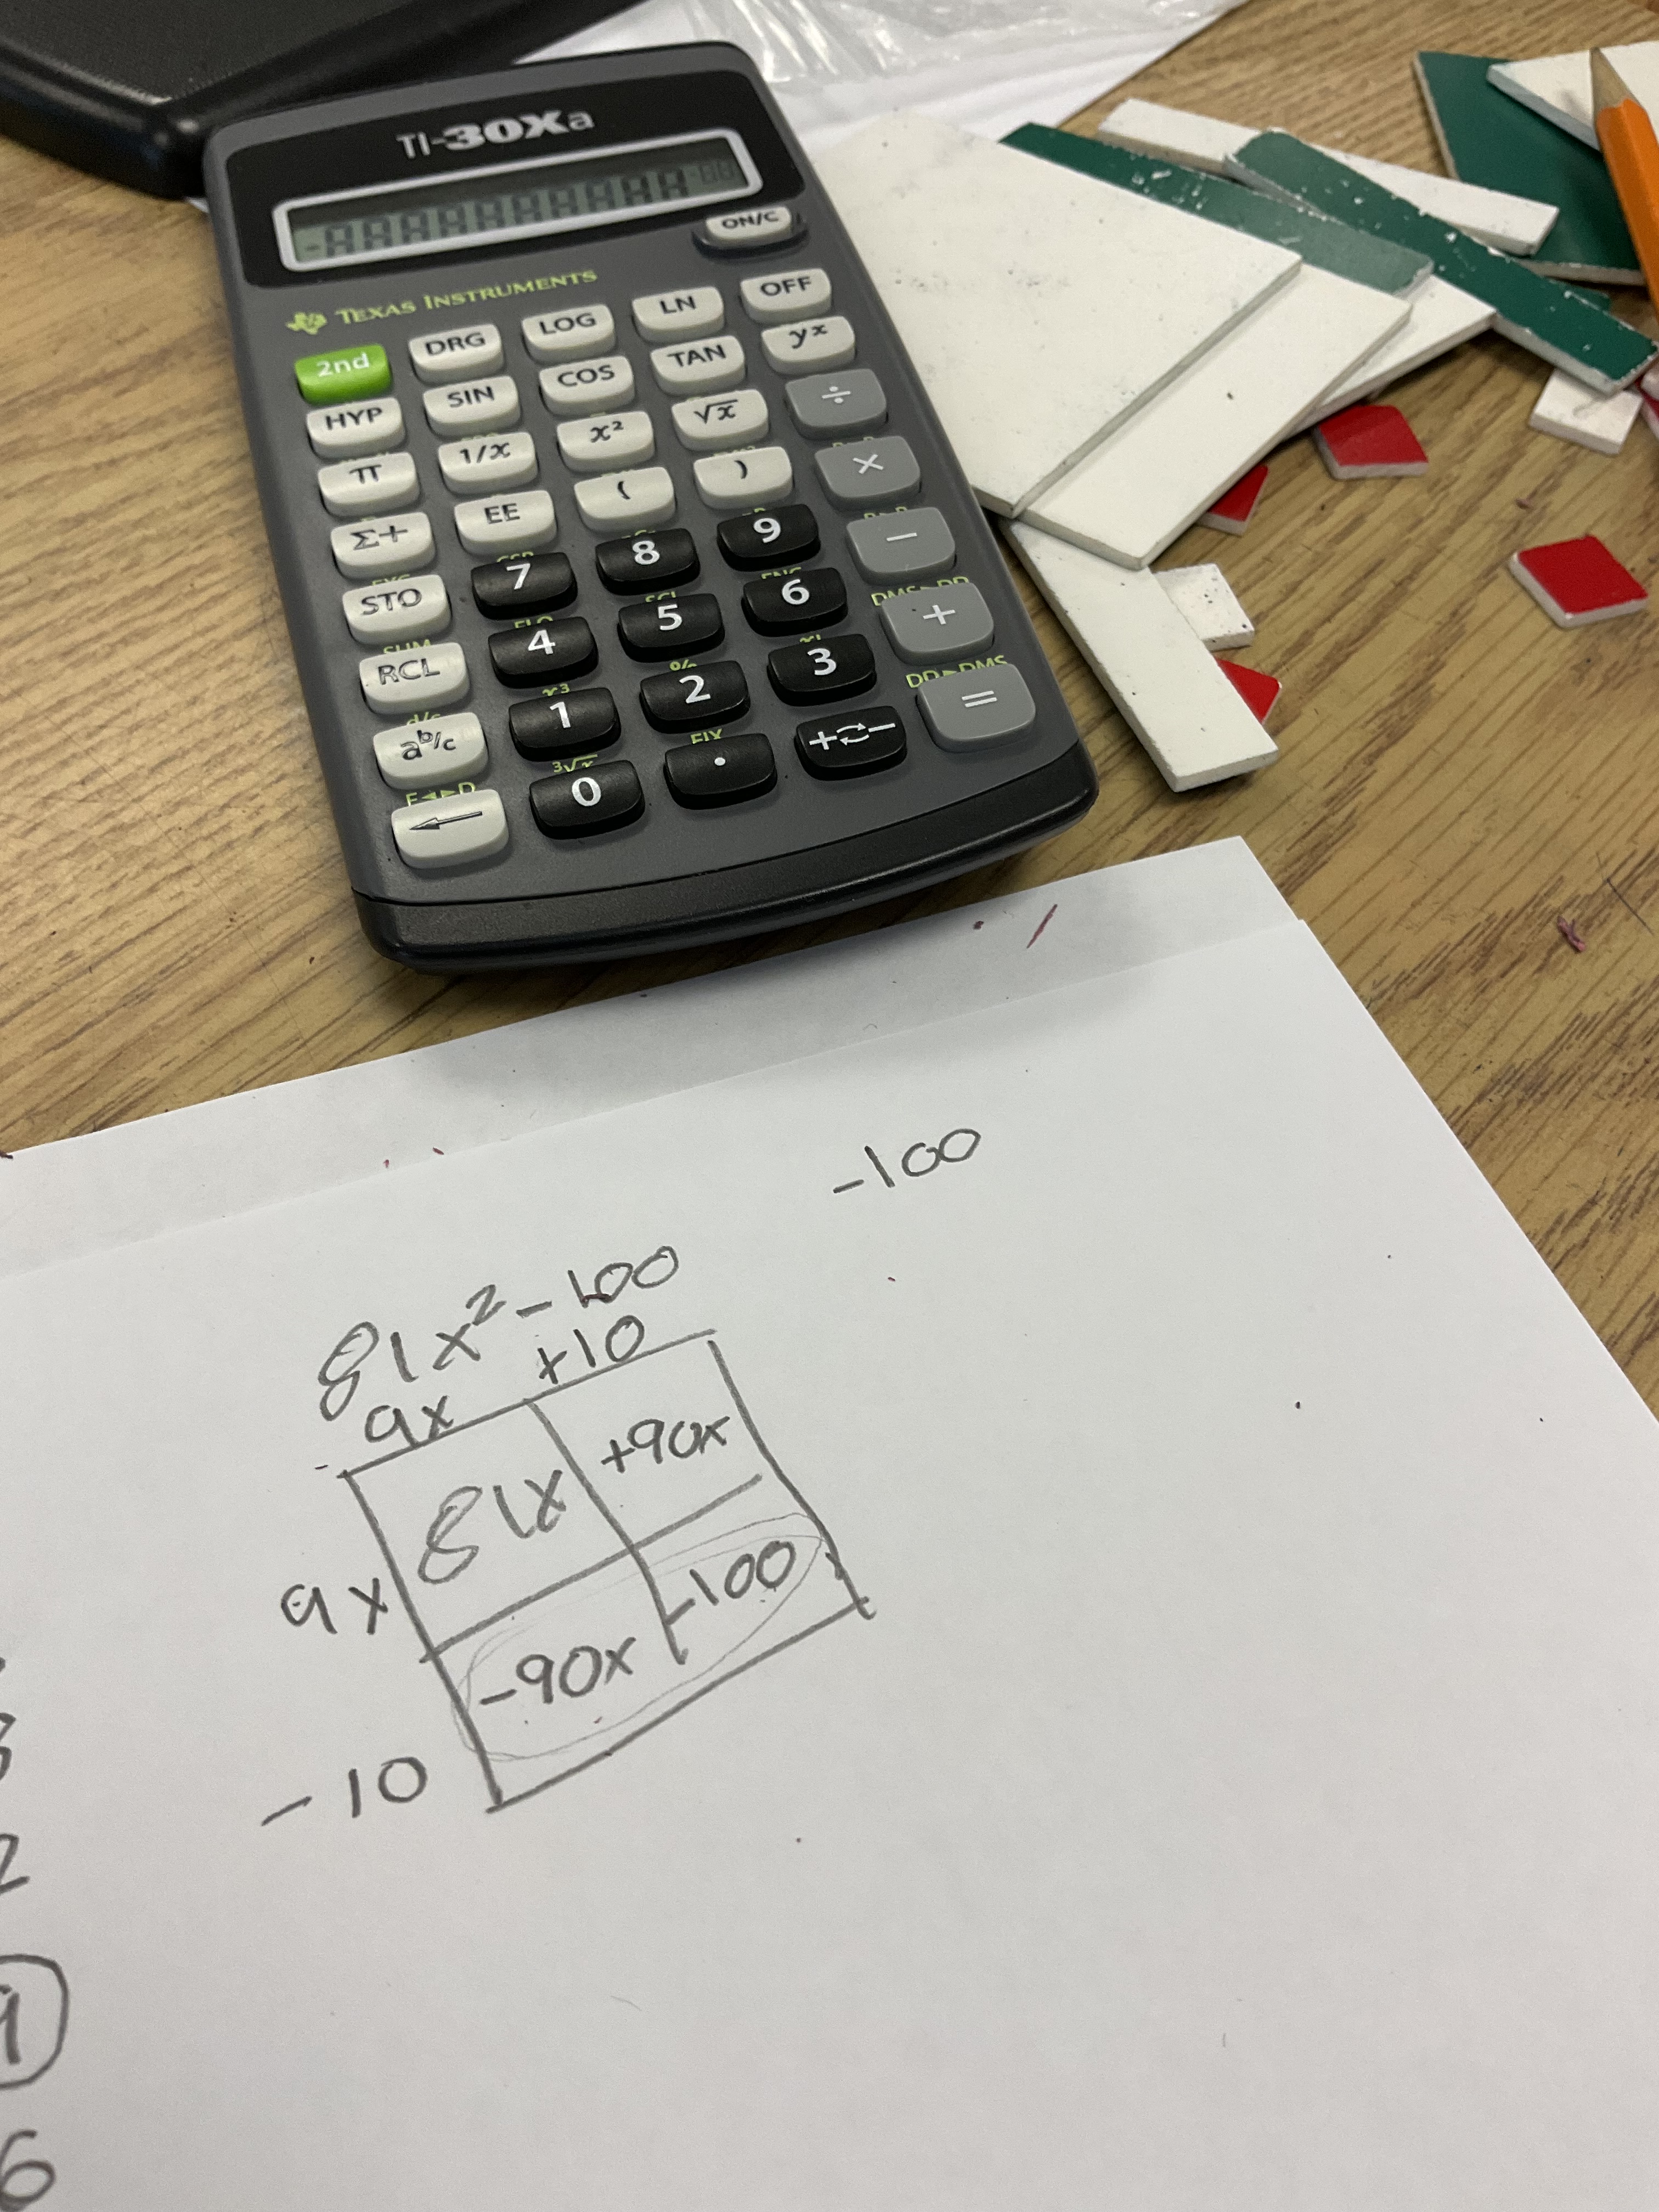
Even a difference of squares with a large leading coefficient is not an issue for someone who understands zero pairs!
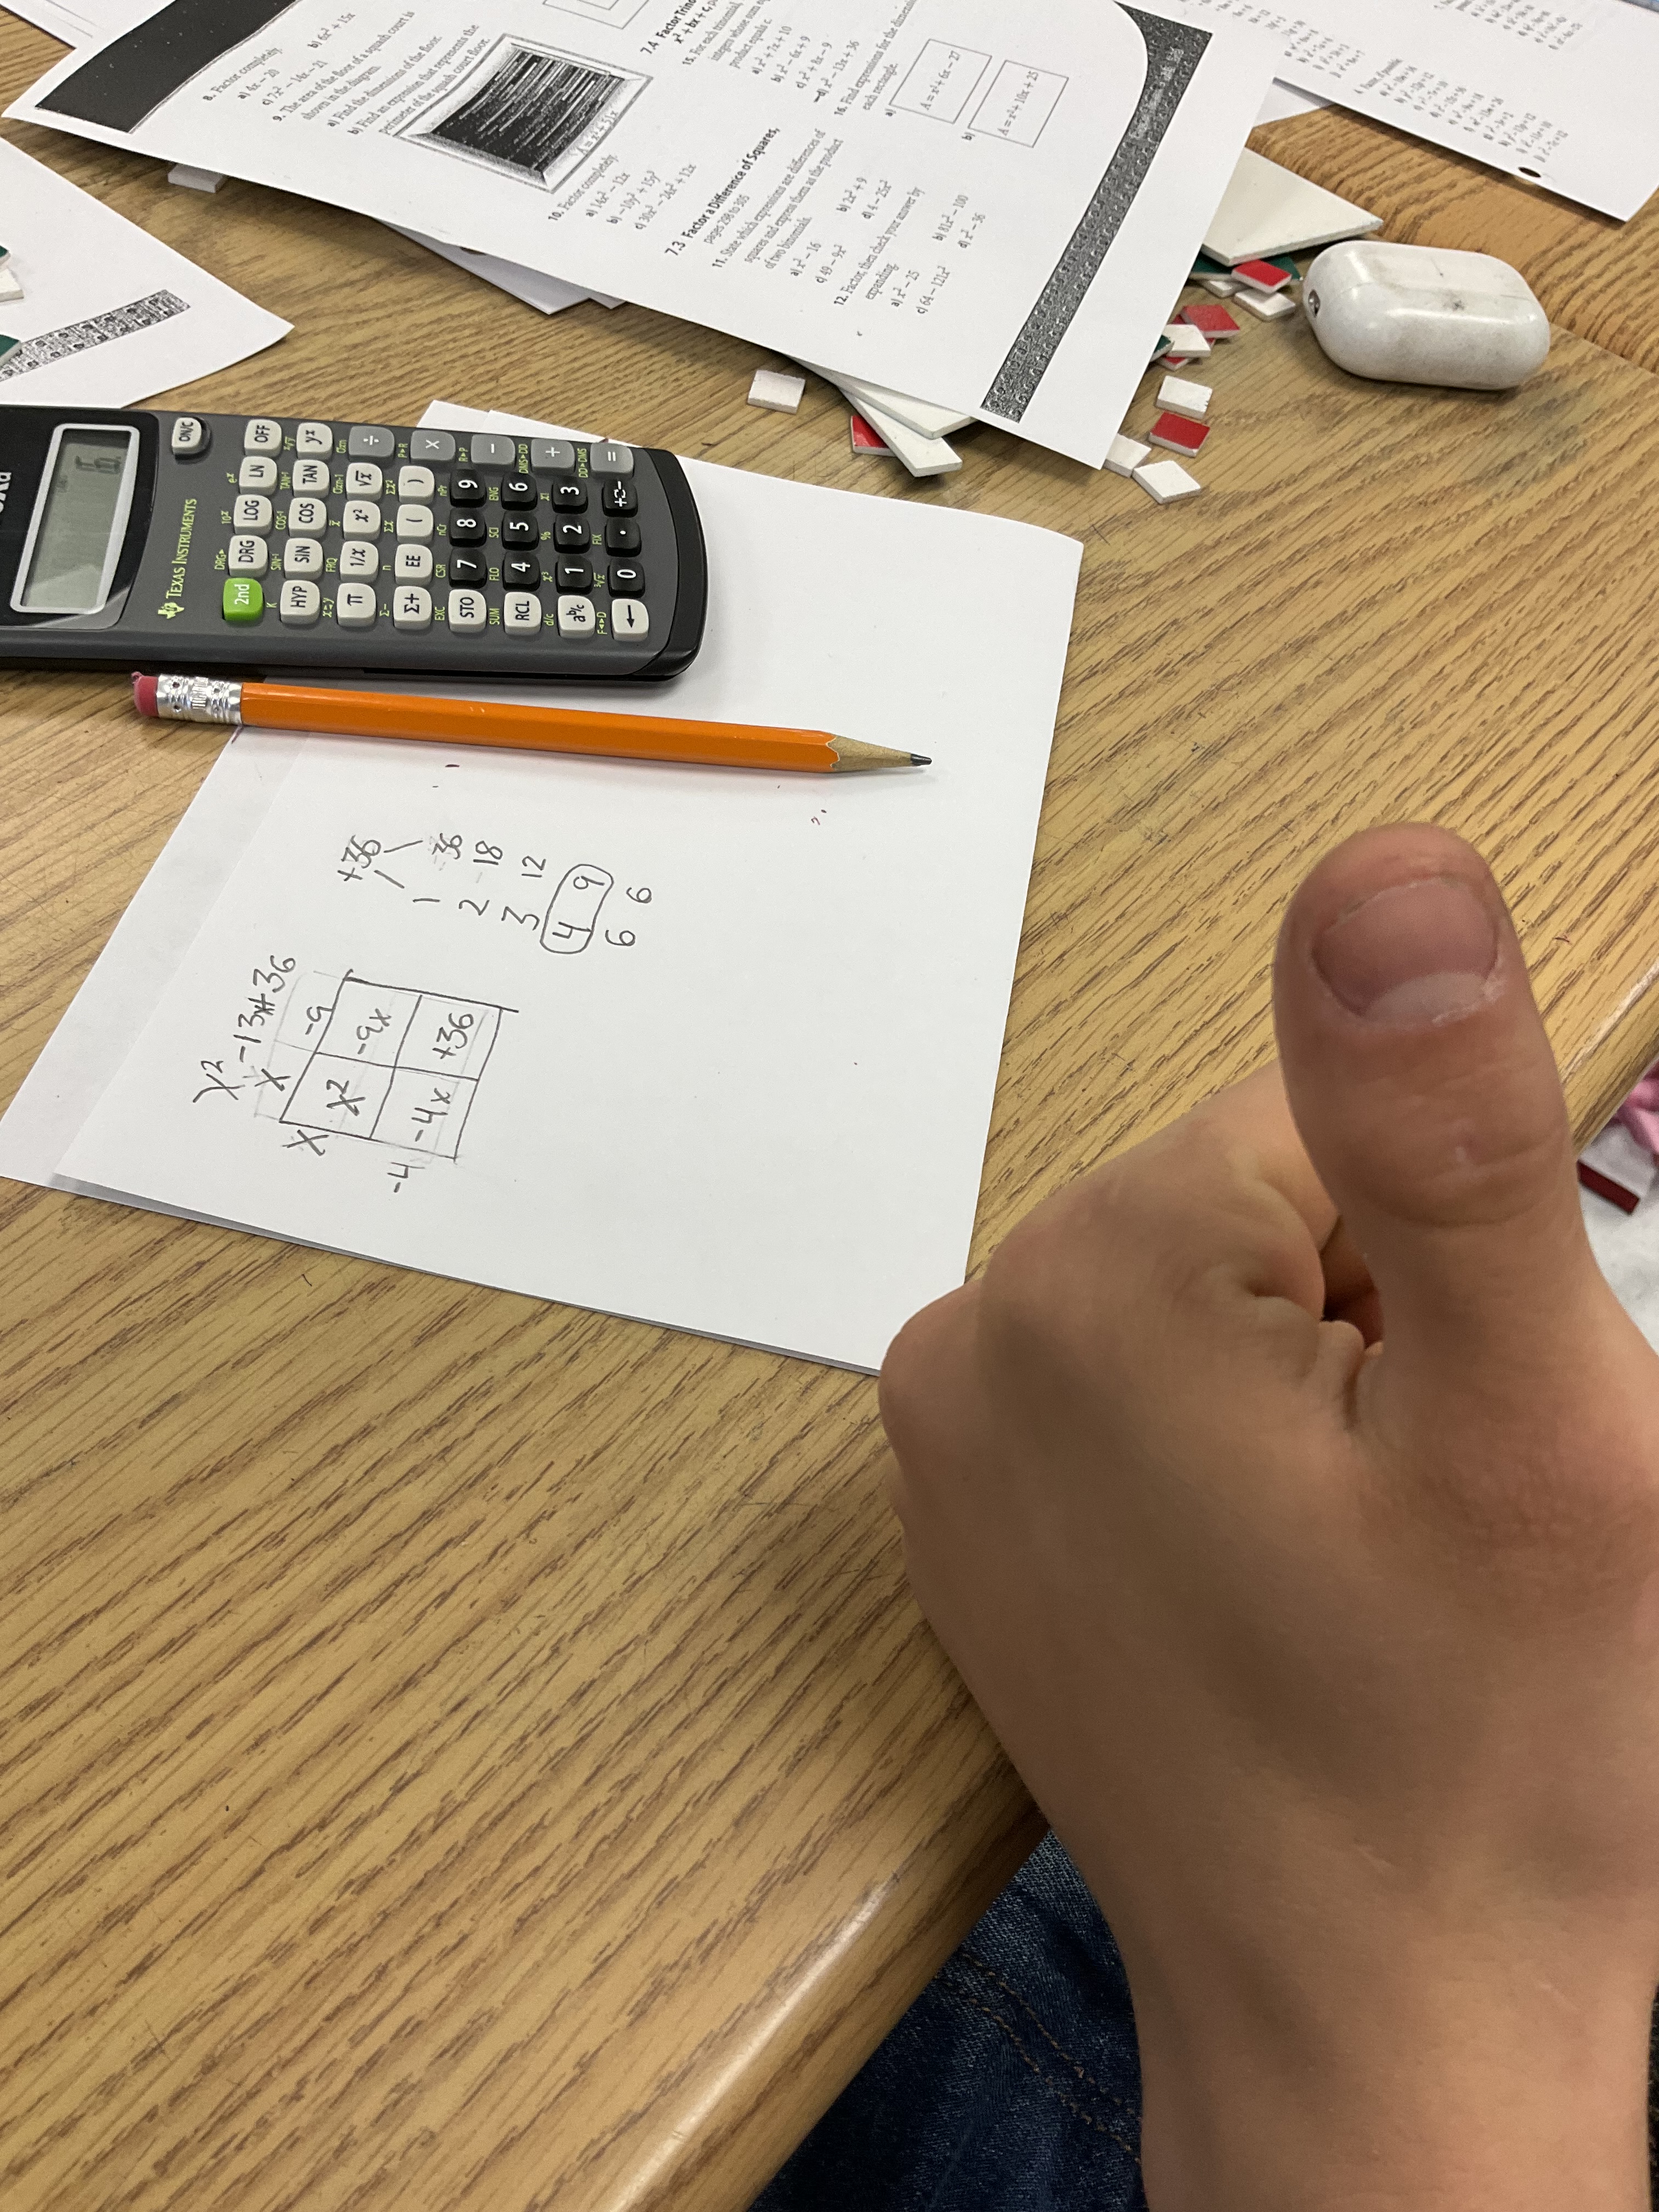
Confidence and skills are growing as we make more and more connections between concrete and visual representations.
I’m thankful for the opportunity to share my enthusiasm for tiles!
Angle Day
We got out the polygon tiles today in MTH1W and made some beautiful art. We can use our art to talk about a lot of math topics. In this image for instance, we can explore fractions, and see how we can use several different types of tiles to create hexagons. Each hexagon is made of 6 green triangles, or 3 blue rhombuses, or 2 red trapezoids.

We can use this image to explore some angle concepts. We can see that two of the triangle angles are equal to the obtuse angle on the blue rhombus and also equal the angle on the yellow hexagon.
we know that if we add up the angles in a triangle we get 180 degrees, and if it is equilateral, like the green, we know that the 180 degrees is split evenly among 3 angles. 180 divided by 3 is 60 degrees. We can conclude then that the obtuse angle on the blue or yellow is 120 degrees.
We can also explore opposite angles, as seen at the blue X. We know that angles that are opposite each other are congruent.
We can also add up the angles around a point (orange). We have 120 degrees (yellow), we have 2 green, each with 60 degrees, and 2 blue acute angles each with 60 degrees. If we add them all up we get 360 degrees. This is true around every point! The sum of the angles is 360.

I challenged my class to determine the angle measurements of each of these blocks. We can use the “sum of angles around a point” strategy to calculate the missing values.
At the centre of the design we have 12 beige rhombuses which make a full circle. We know that we can calculate the acute angle of the rhombus if we divide 360 by 12. That gives us an acute angle of 30 degrees. We can try to calculate the sum of the angles around the green dot to calculate the missing obtuse angle. We have a 120 degree yellow angle, and a 90 degree orange angle, and the remaining degrees needed to make 360 must come from the obtuse beige angle. 360-120-90=obtuse angle, 150=obtuse angle.
Another way to explore this is understanding that the sum of the angles in a quadrilateral is 360 degrees, so if you have two angles of 30 each, that leaves 300 degrees for both obtuse angles, and each obtuse angle must be 150 degrees.

We can explore supplementary angles too as a way to prove that the obtuse angle in the beige rhombus is 150 degrees. We know that the sum of supplementary angles is 180 degrees. These angles make a straight line when put together. Examine the yellow supplementary angles, we see 60+60+60=180. If we look at the blue supplementary angles we see that the acute angle is 30 degrees, so the obtuse must be 150 since they are supplementary angles and add to 180 degrees.
We got interested in figuring out what the interior angles of polygons were, and we built a table of values to check for patterns.
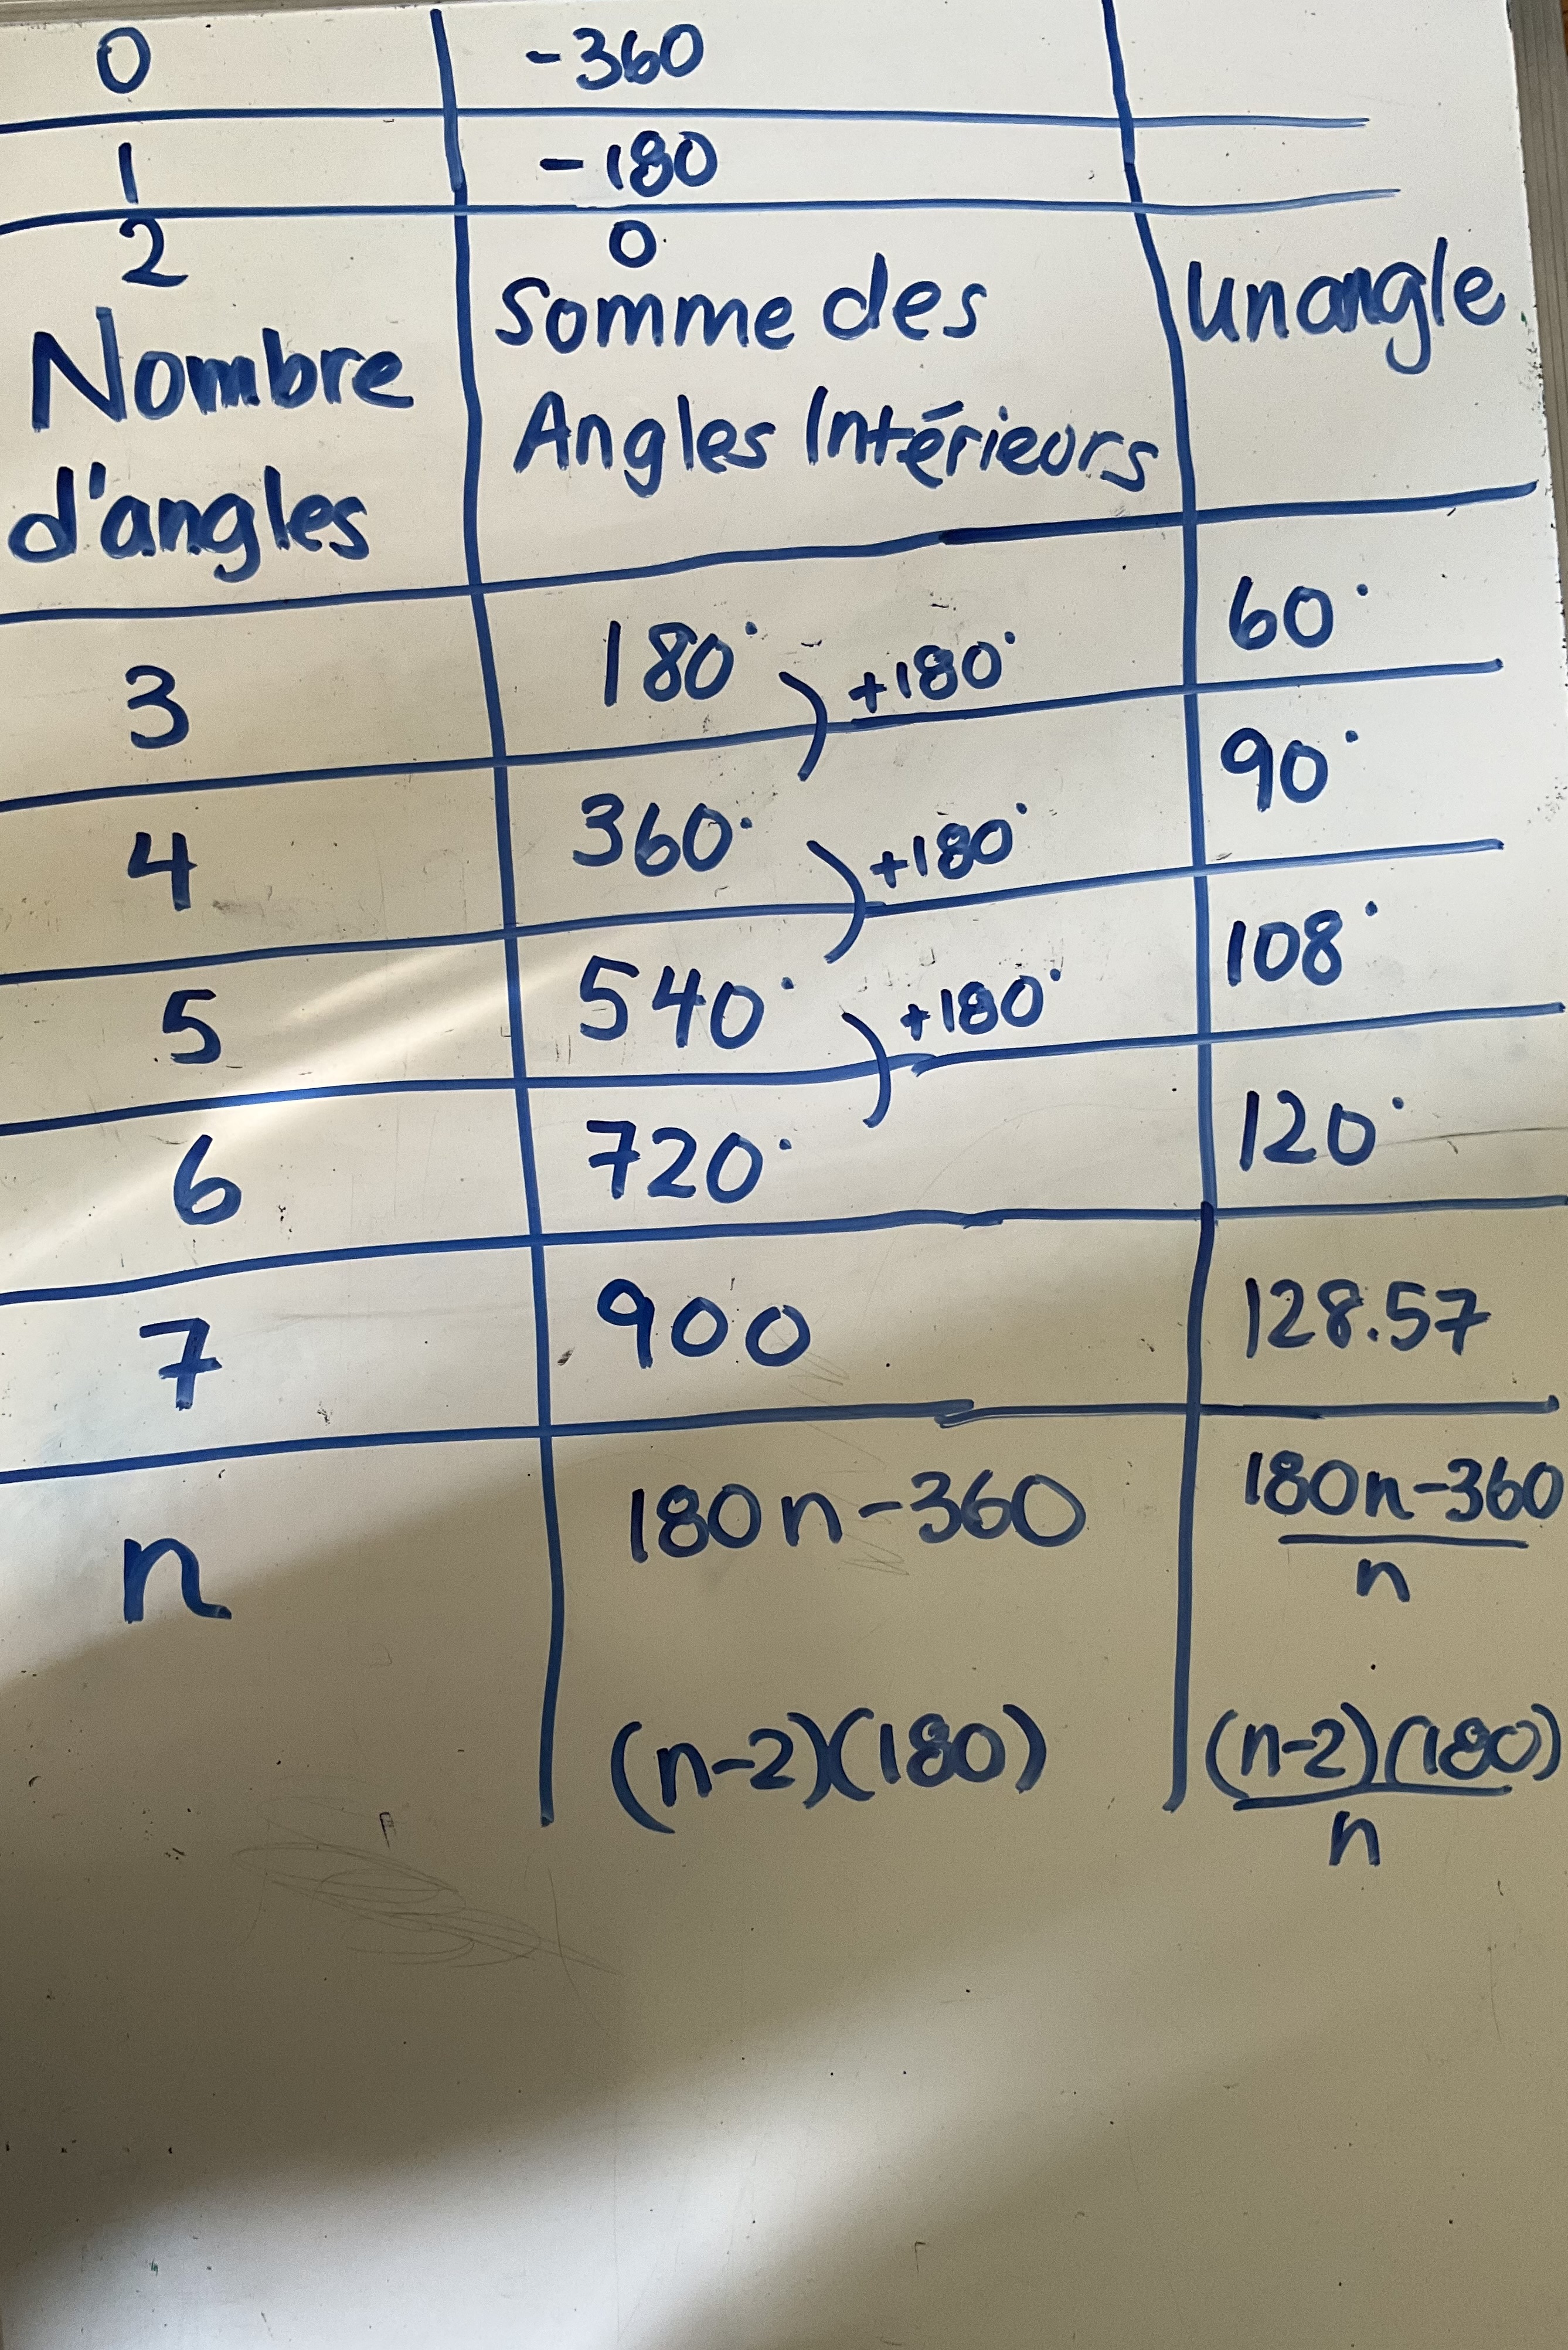
We noticed that the sum of the interior angles column increases by 180 degrees each time. We know that the rate of change (slope) is 180. We went back in the table to find the constant, which is -360. The equation for the sum of the interior angles in any polygon is SIA=180n-360
We noticed that the angle column doesn’t increase linearly since the first differences are not the same. We got the values by dividing the sum of the interior angles by the number of angles. We had an enthusiastic participant who explored what happens when we had a million sides on our polygon, and calculated that the interior angle would be 179.99 degrees. The class agreed that the polygon would look pretty circular.
To explore further, we graphed the angle values on desmos. We noticed that there is a limit to the value of the angle. It approaches but never reaches 180 degrees.

Our next steps are to explore the sum of the exterior angles, and also the value of exterior angles. More to come tomorrow!
Experimenting with Sound
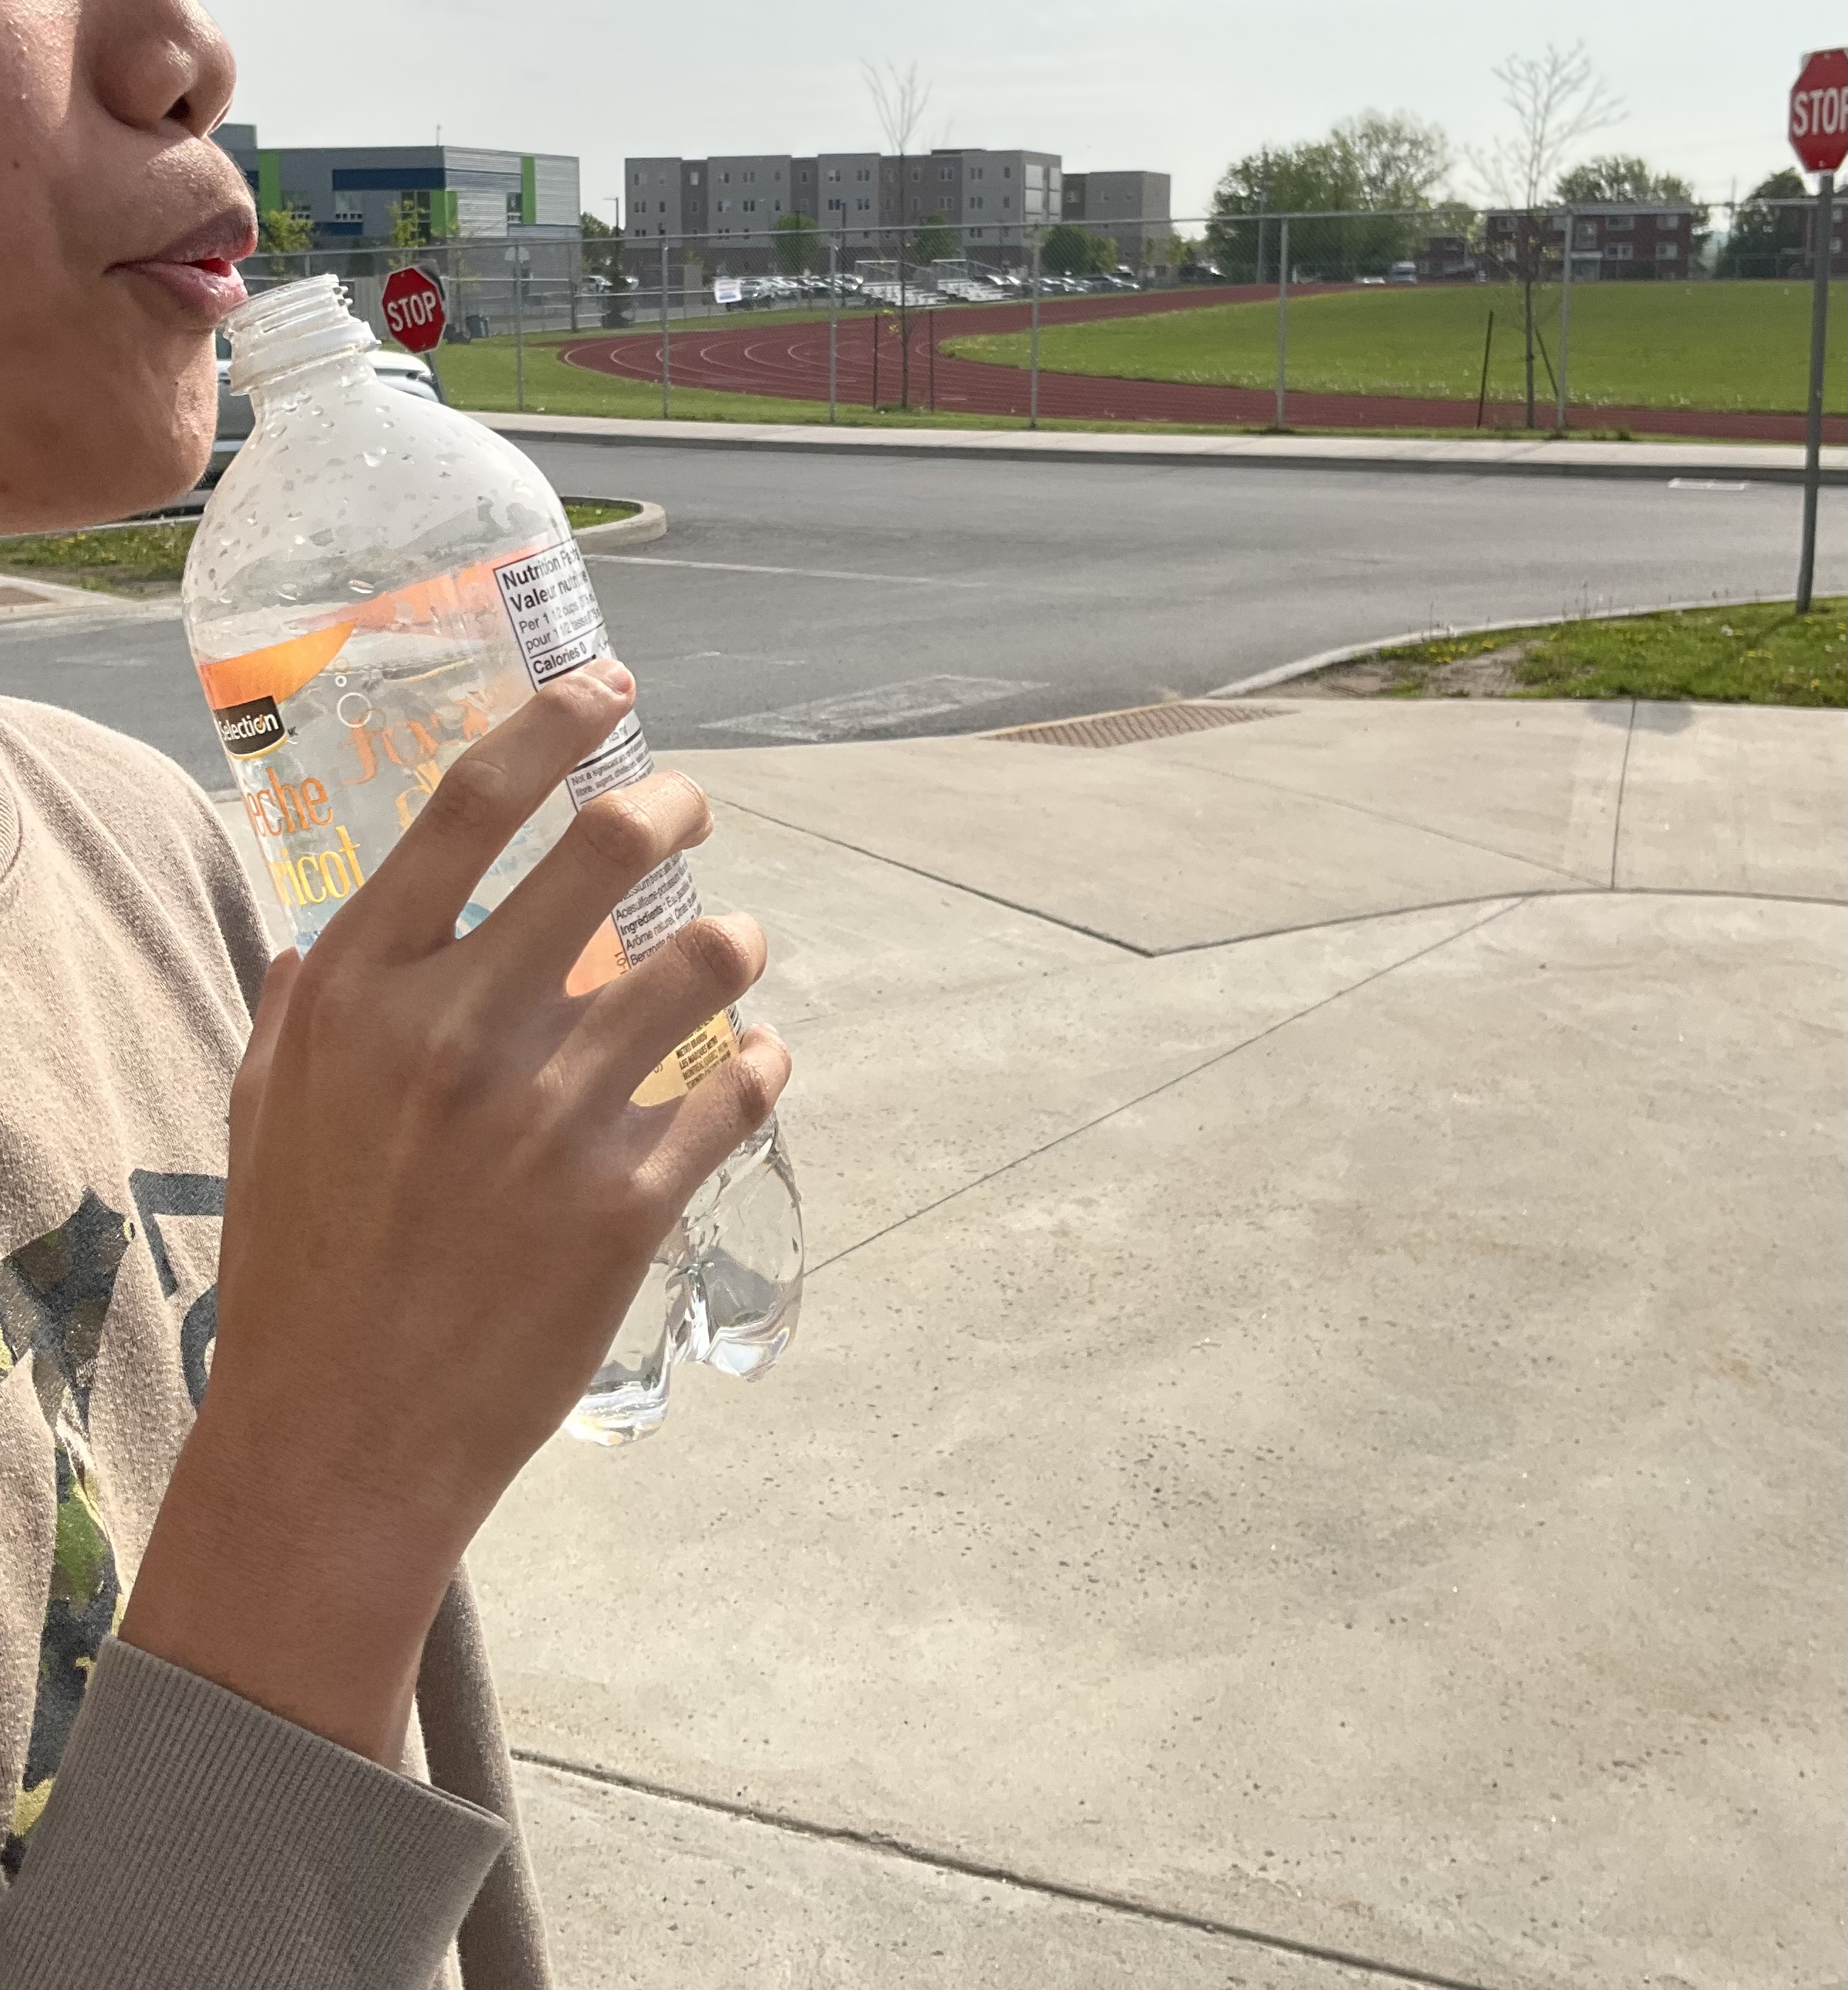
Today grade 9s experimented with the sound that is produced when you blow over the neck of a bottle and create resonance within the bottle. This sound changes as the water level in the bottle changes, and we were investigating that relationship.
We used the free app “sonic tools” which uses a phone/ipad’s microphone and will show the frequency of sound that it detects.

We measured the height of water in the bottle, and the height of the air column in the bottle, and then we measured the frequency of sound produced.

It was a lovely day so we could work outside and space out our groups so the sound we made didn’t interfere with others. We could also easily dump out some water between trials.
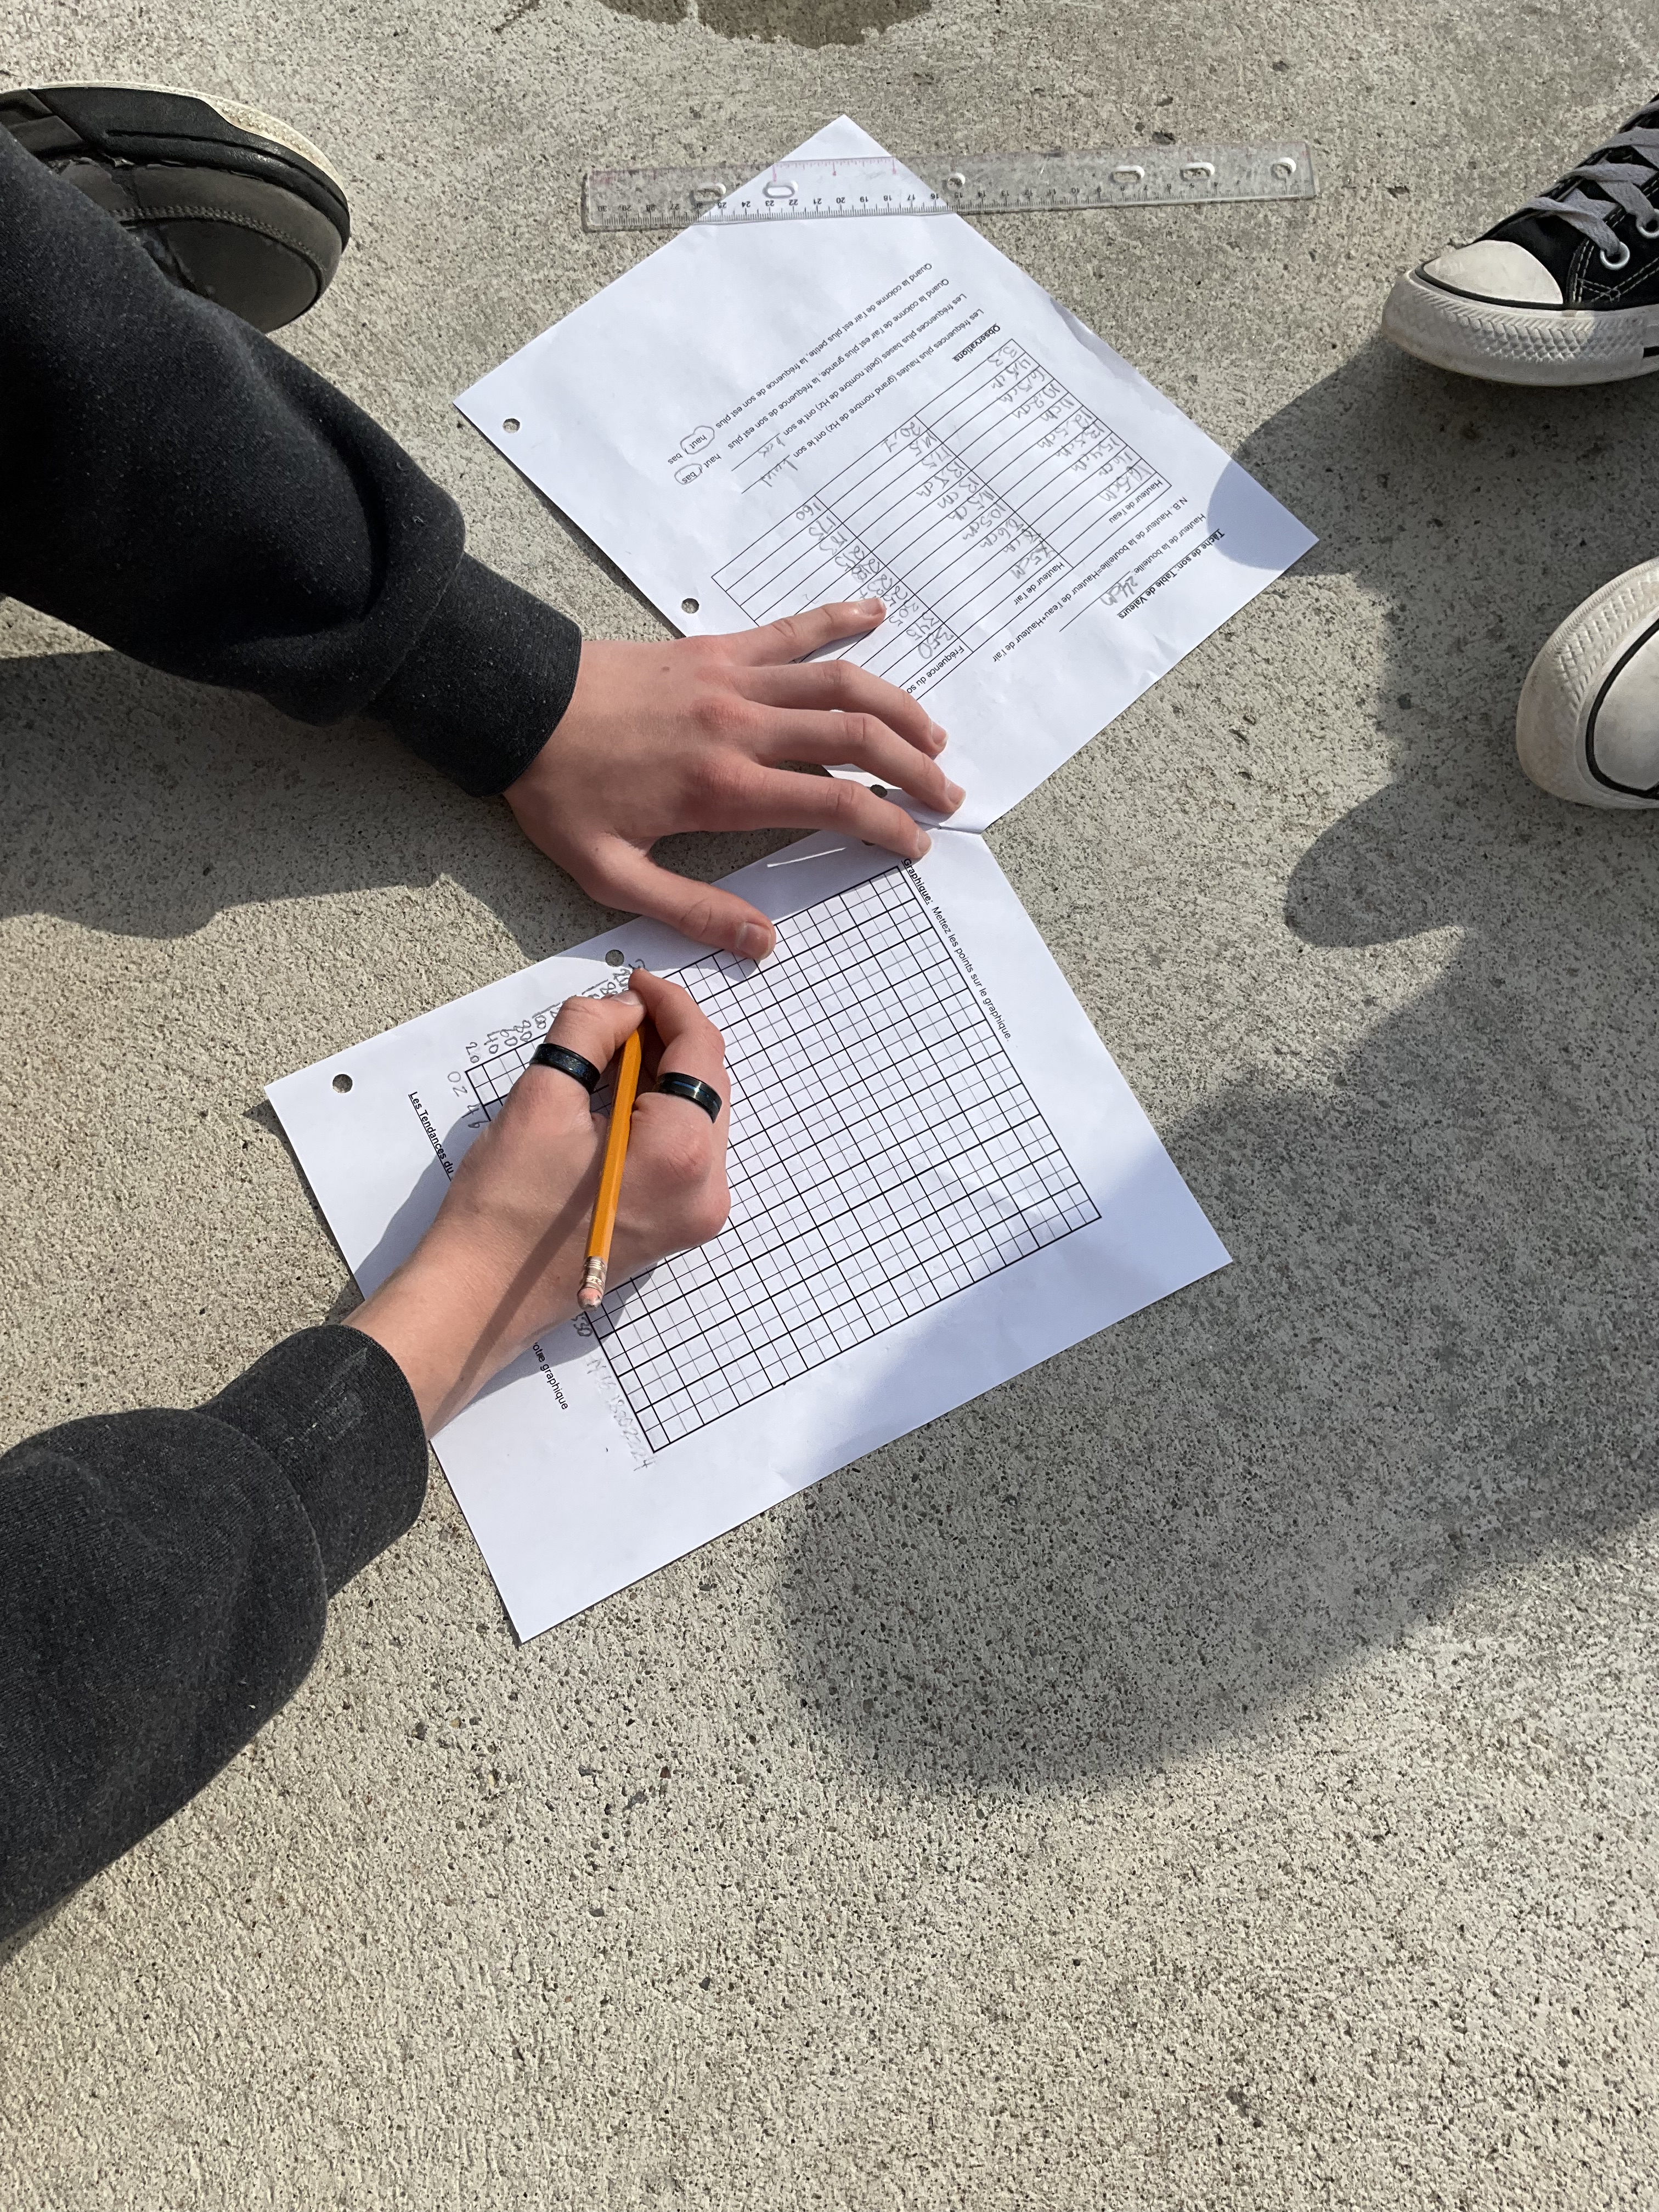
We scaled our axes to fit our data. We know that the dependent variable is the frequency, because that is what we are measuring, and the independent variable is either the height of water in the bottle, of the height of the air column in the bottle.
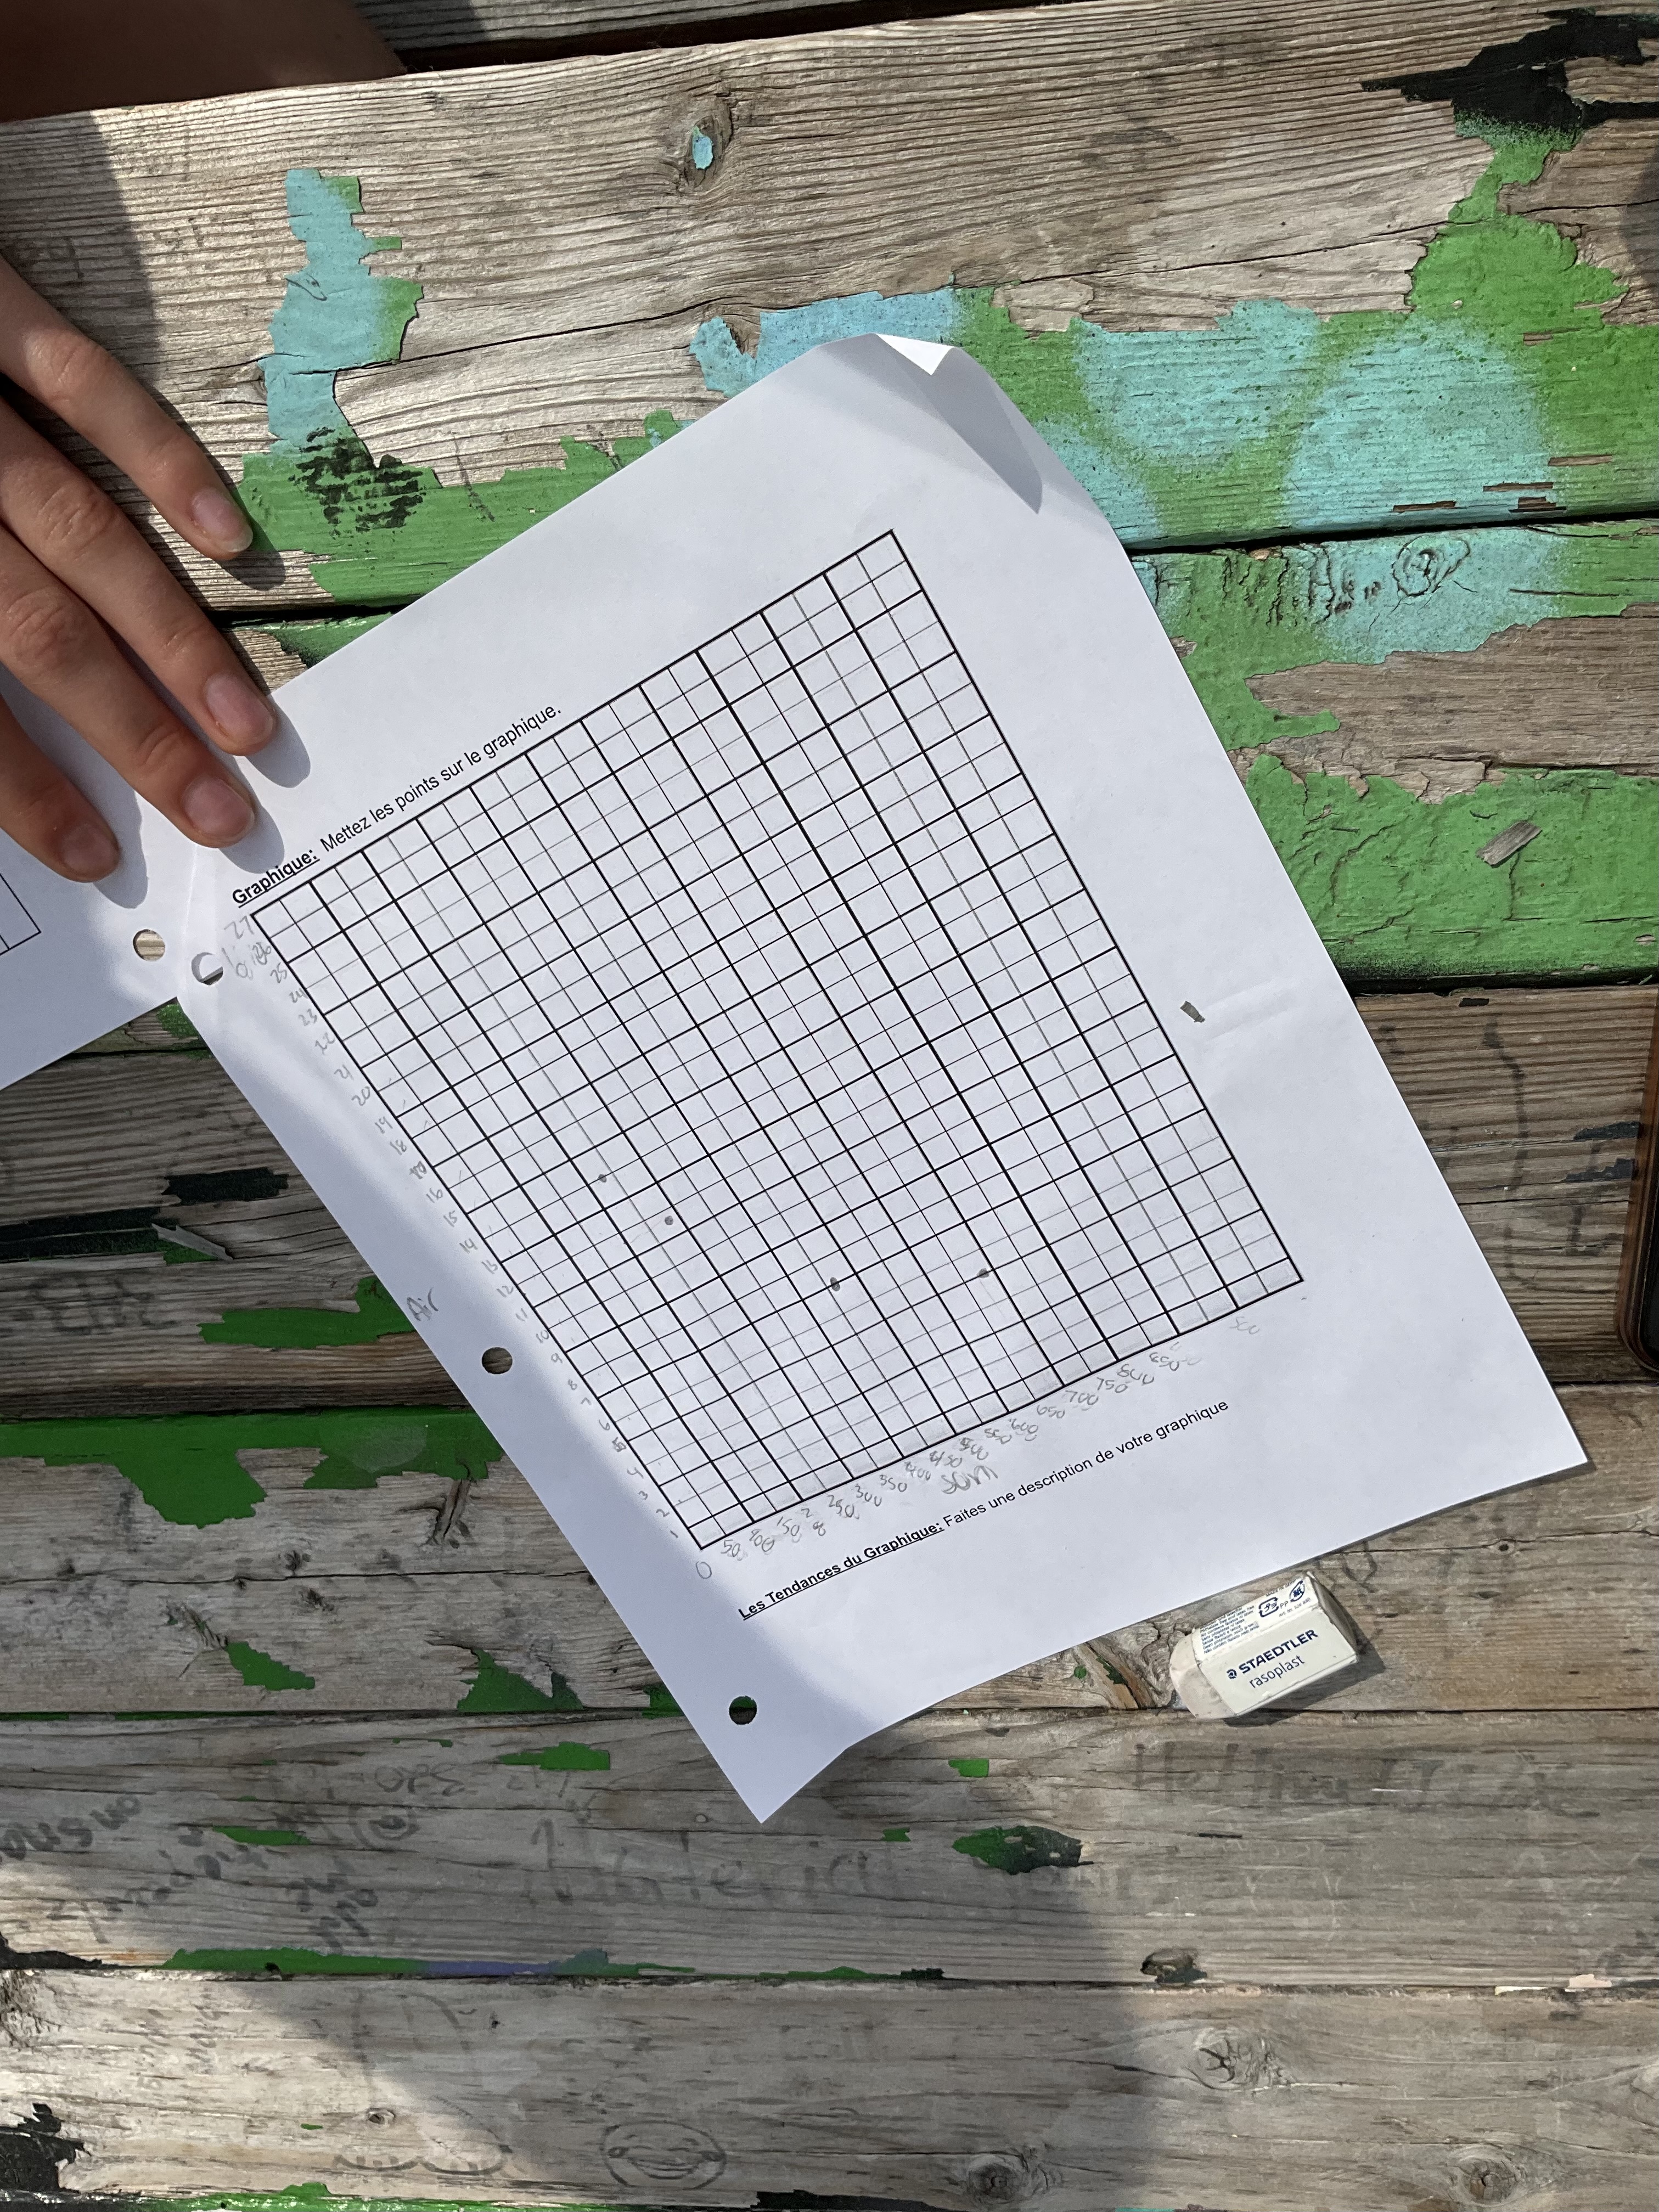
We noticed a non-linear trend, and used the graph to make some predictions. Some extensions could be to research the frequency of various musical notes, and attempt to create a bottle based instrument, like what we can see the “Bottle Boys” playing.
We could also dive deeper into the resonance in an air column, and explore the physics behind the results of our graph. The equation relating frequency and wavelength is f=v/(lambda) where lambda is the wavelength of the sound. We know that a bottle like this will resonate with a wavelength that is 4 times the height of the air column.

Some of this is best kept for grade 11 though where the students will be exploring graphs of y=1/x and sinusoidal graphs (like sound waves), and exploring acoustics in more detail in physics classes.
For us, in grade 9, we used this task to perform an experiment, collect data in a table, then display it in a graph. Students answered questions about the graph, made predictions and described the trends. We learned a bit more about dependent and independent variables too.
update:
Today we compiled some of our data, noting that some difference we saw were likely due to measuring error, or measuring to different points on the bottle (the top of the neck, or the shoulder of the bottle).
We noticed that the data made a curve, and that we could do a curve of best fit.

We researched the frequency of middle C, which is 261.63Hz, and used interpolation to estimate that if the bottle had about 10cm of air column the pitch would be middle C.
I’m not sure if anyone is motivated to play bottle instruments, but at this point they could!
Math Buddies
We had an exciting morning today where we paired up a calculus and vectors class with a grade 10 class to work through a rich task that explores both sets of curriculum.
We have been using thinking classroom techniques and rich problems in both classes all term, so this approach was not novel, but this was the first time we had combined classes. We have been working on building positive classroom communities, and this allowed students in both classes to shine.
We’ll walk you through the task here and give photos at the end (spoiler alert).
This task is from Al Overwijk who presented a deep dive OAME session last week, and were inspired to give this a try.
The task engages students to think about the number of ways to win at tic tac toe. First in a plane (the classic game) and then in 3 dimensions.
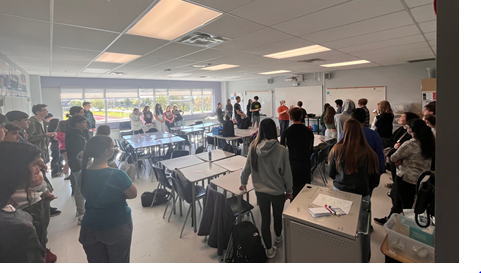
The two classes were in one room, in visibly random groups mixing the grade 12s with grade 10s by choosing cards from a deck. There were stations around the room for groups to go, each labeled with their card value. Some groups ended up with only grade 10s, and some with only grade 12s, and many with a mixture.
To start we challenged a student to a game of tic tac toe. Once a few games had been played, and everyone understood the game, the student groups decided how many winning lines there can be in a standard game of tic tac toe.
Next, the we introduced the idea of 3D tic tac toe, and how many winning lines can be made in a 3 by 3 cube of tic tac toe. (think Rubix cube)
Students worked in groups to determine the number of winning lines. Teachers were purposefully not so helpful, and just answered the “keep thinking” questions or clarified the task.
In the room we had a big bin of linking cubes, and if groups were looking to model in 3D they had access.
As groups worked through their solution they needed to communicate on the whiteboards enough to convince themselves, their peers and the teachers that their answer was correct.
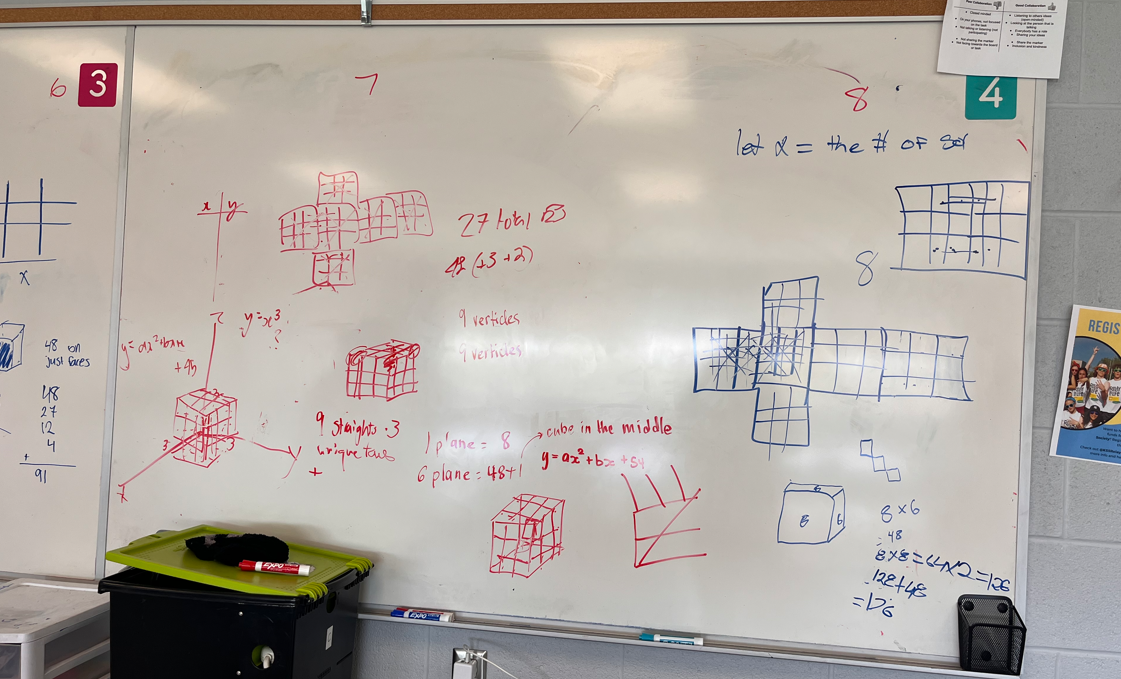
Helpful prompts were to consider if they had over-counted any winning lines, or missed any winning lines.
Many students were stuck with the idea of tic tac toe being played on the surfaces of a cube, and not using the cube to play tic tac toe, so we had a quick reset partway through to discuss that the tic tack toe was happening within the cube.
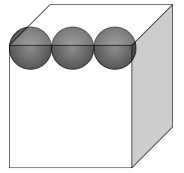
We encouraged them to imagine a sphere taking up space in the cube so that they don’t end up over counting winning lines.

Once groups had succeeded in modelling the number of winning lines in a 3 by 3 cube, the extensions are to explore how many winning lines are in a 4 by 4 cube, and then 5 by 5 and then x by x.

Extensions can be varied, and some students stumbled upon them by their own inquiry
- Make a table
- Explore patterns
- Make a general equation
- Graph the relationship
- Explore the rate of change
Our consolidation involved:
- Going around the room looking at how everyone represented the question, to get everyone on the same page and value the diverse thinking and representation.
- Pointing out various grade 12 ideas (vectors and planes, and x y and z axes) as well as grade 10 ideas of modeling quadratics, building the grade 10s up while congratulating the grade 12s for their collaboration and mentorship.
- Noticing and naming the strategies of using tables and equations and graphs.
- Consolidation did not focus on what the answer was, but rather on the methods and strategies used.
- The task led to a nice review of quadratic modeling and key features of quadratic functions.
- At the end, one group had a graph, and students were asking about if the problem could extend to negative x values. The quadratic model does work well to show completing the square, visually, and we explored vertex form.
It was really fun to collaborate with a colleague, and to try something new. We will definitely try it again!
OAME Family Math Morning

OAME was an excellent opportunity to network with other math teachers from all over the province, and also to share ideas and best practices. This morning was my moment to share, as part of the Family Math Morning sessions.

My topic was about how to use polygon blocks in MTH1W classes. These blocks are often associated with primary grades, but there is an impressive amount of math that can be explored, if you take time to play and explore.

My first prompt is usually: Build me some art. After seeing what is created, we can explore ideas of symmetry, rotation, reflection, translation, fractions, angles, area, perimeter, and so much more!
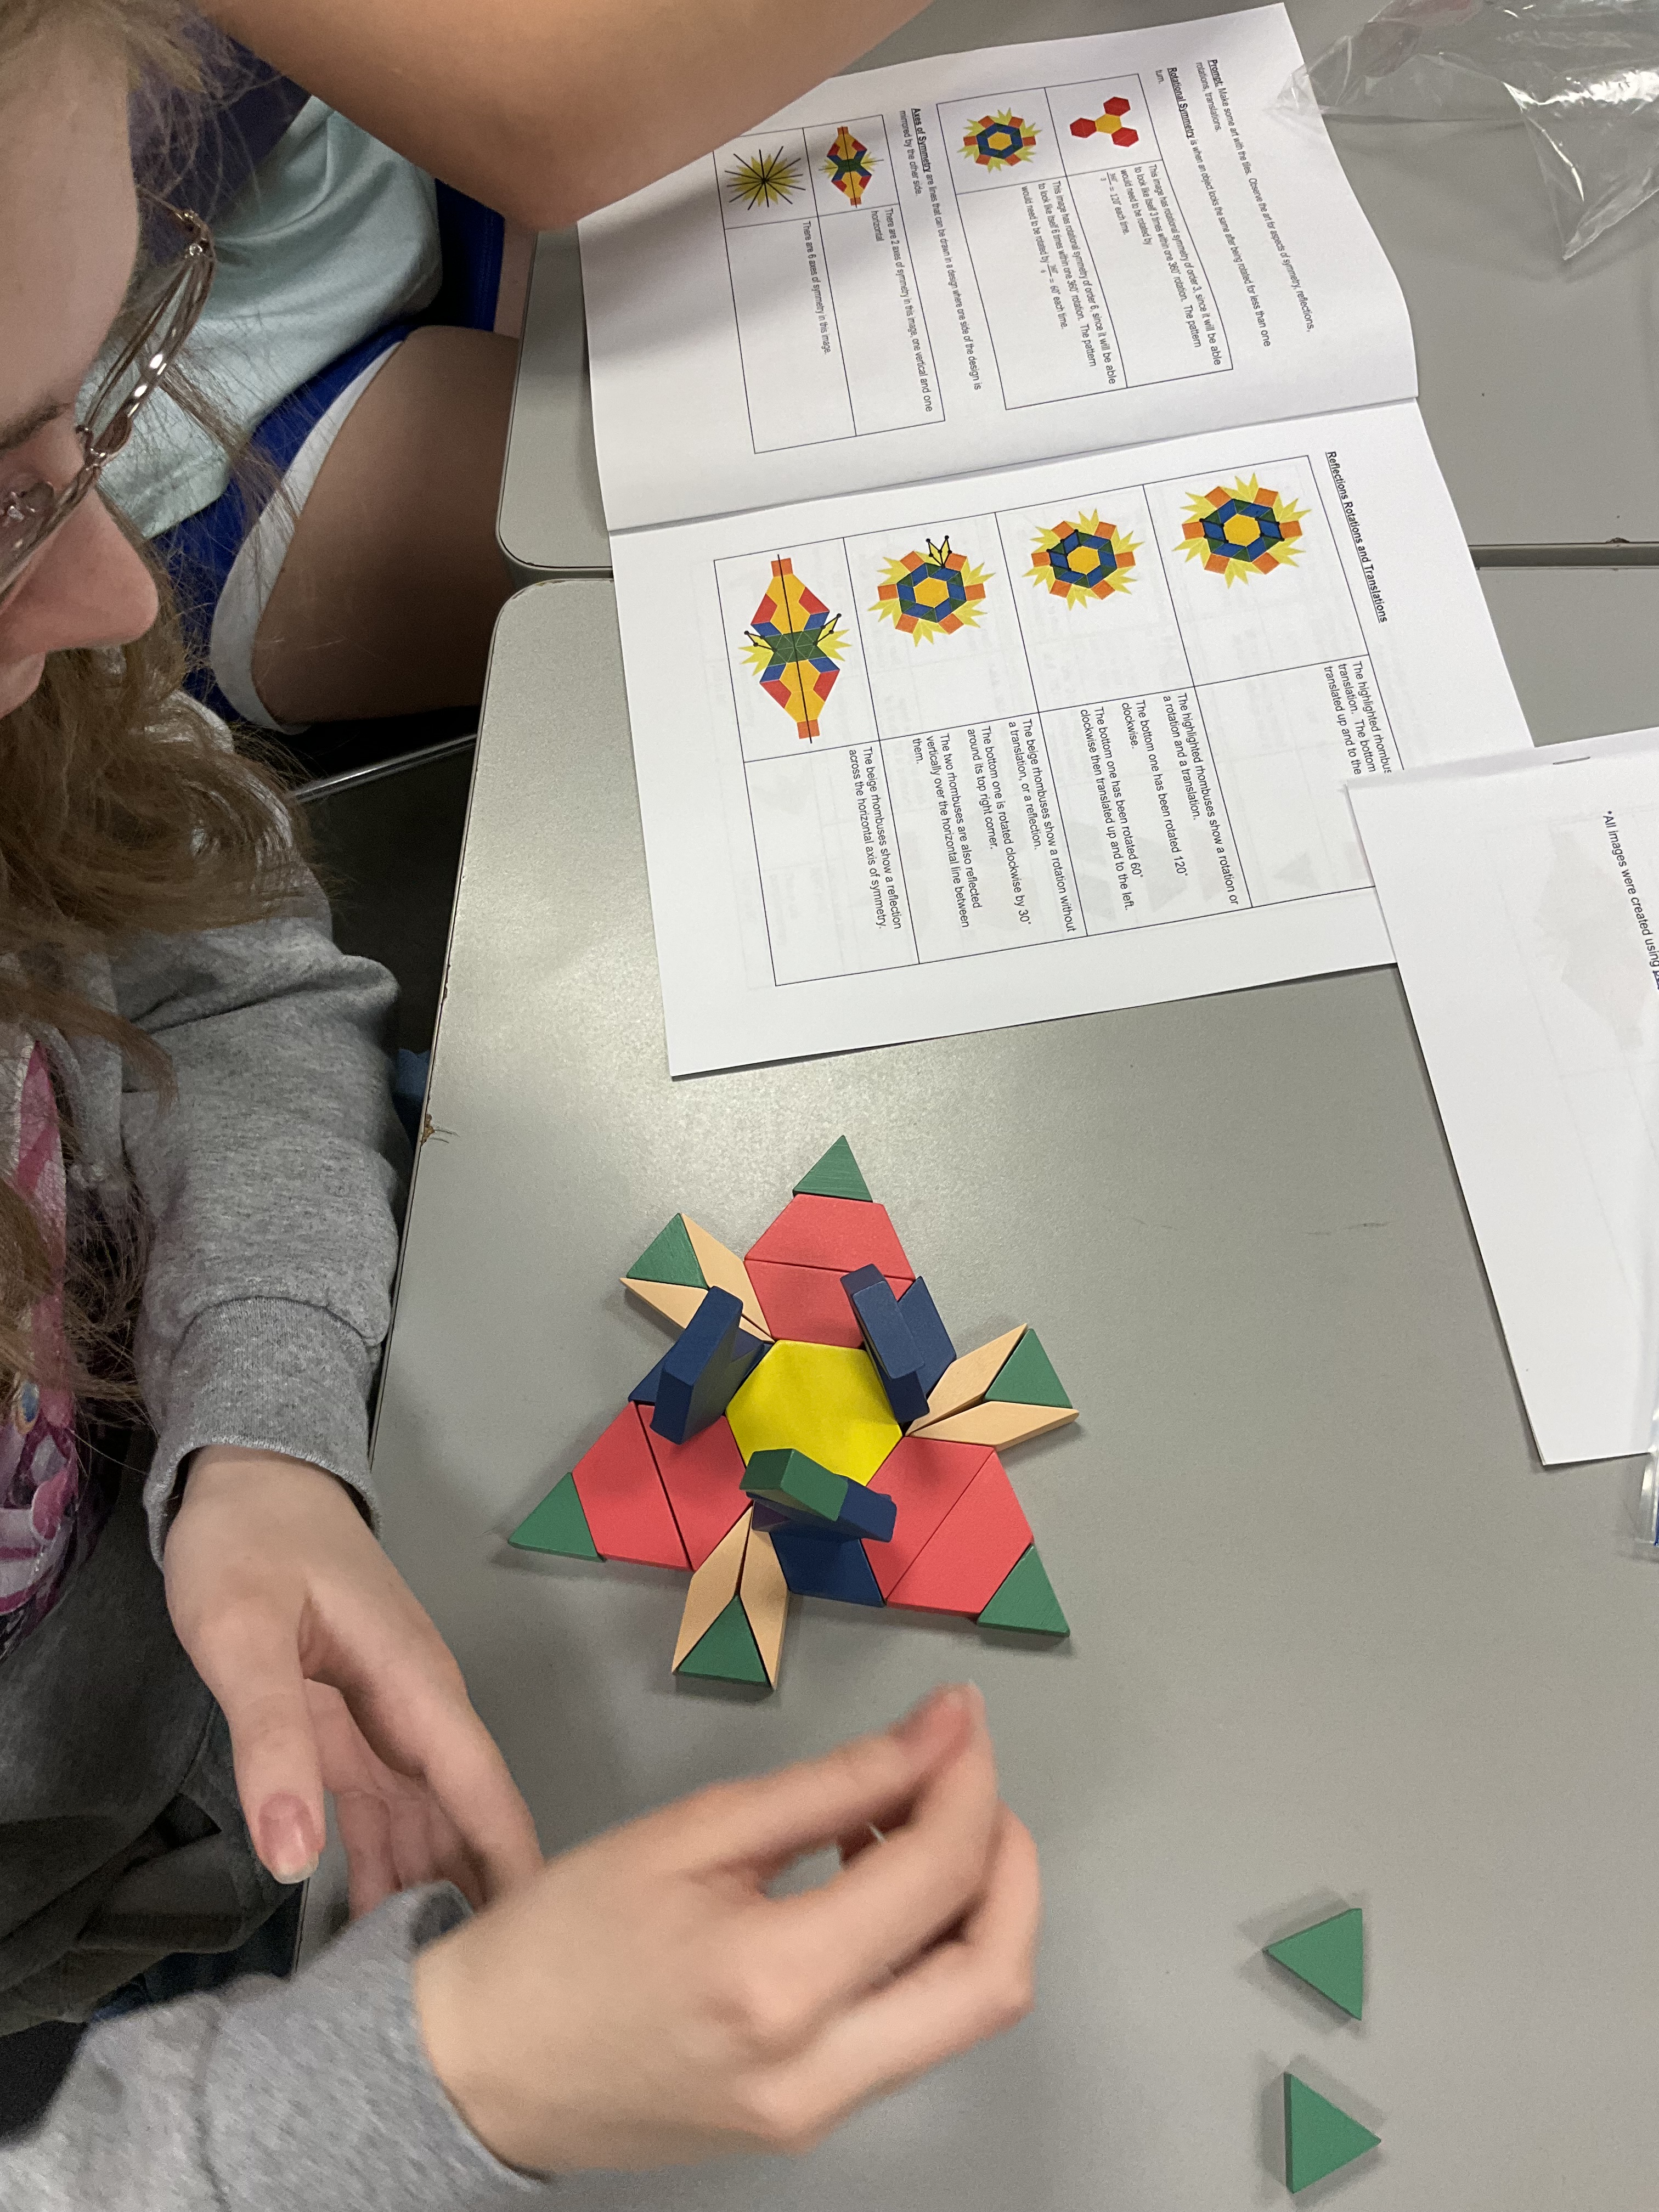
Something new that I stumbled upon while creating my resource package was using these blocks to explore similarity and how side length and areas are scaled in similar figures. Here is an example of two similar trapezoids. The large one has side lengths that are triple the side lengths of the smaller one. The large trapezoid has an area that is 9 times the area of the smaller one. When the side lengths scale by 3, the area scales by 32

We can explore this art in a few ways. We could look at similarity between the small yellow hexagon, and the large composite hexagon. The large hexagon has side lengths that are triple the side lengths of the small hexagon. The area of the large hexagon is 9 times the area of the small hexagon. We can prove that by using 3 rhombuses to create a hexagon (like what we see in the centre).
We can also explore what fraction of the large hexagon is yellow. Since there are 9 hexagons total, and 6 of them are yellow, we know that it is 6/9 yellow, or 2/3 yellow. That means it is 3/9 or 1/3 blue.

Another person made another hexagon of the same dimensions, but with different blocks. We can see that the same scale factors apply.

The sides are scaled by 3 and the area by 9. But this one is different because it is 7/9 red and 2/9 green. Here it is decomposed to prove the ratio.

My resource package has some other ideas about math that can be accessed using these manipulatives. I created all of the images using polypad.
Fraction Decimal Percent Clothesline
This morning we worked on understanding the connection between fractions and decimals and percents.
I prepared some cards (I cut index cards in half) and put decimals on some, fractions on others and percents on others. The values ranged from 0 to 2.5, and I tried to include equivalent representations, and also some interesting things like repeating decimals.
I split each pile of cards up so each table group had a different mix of cards and I instructed each group to sort the small pile on their table and to be sure that they have them in order from smallest to biggest.
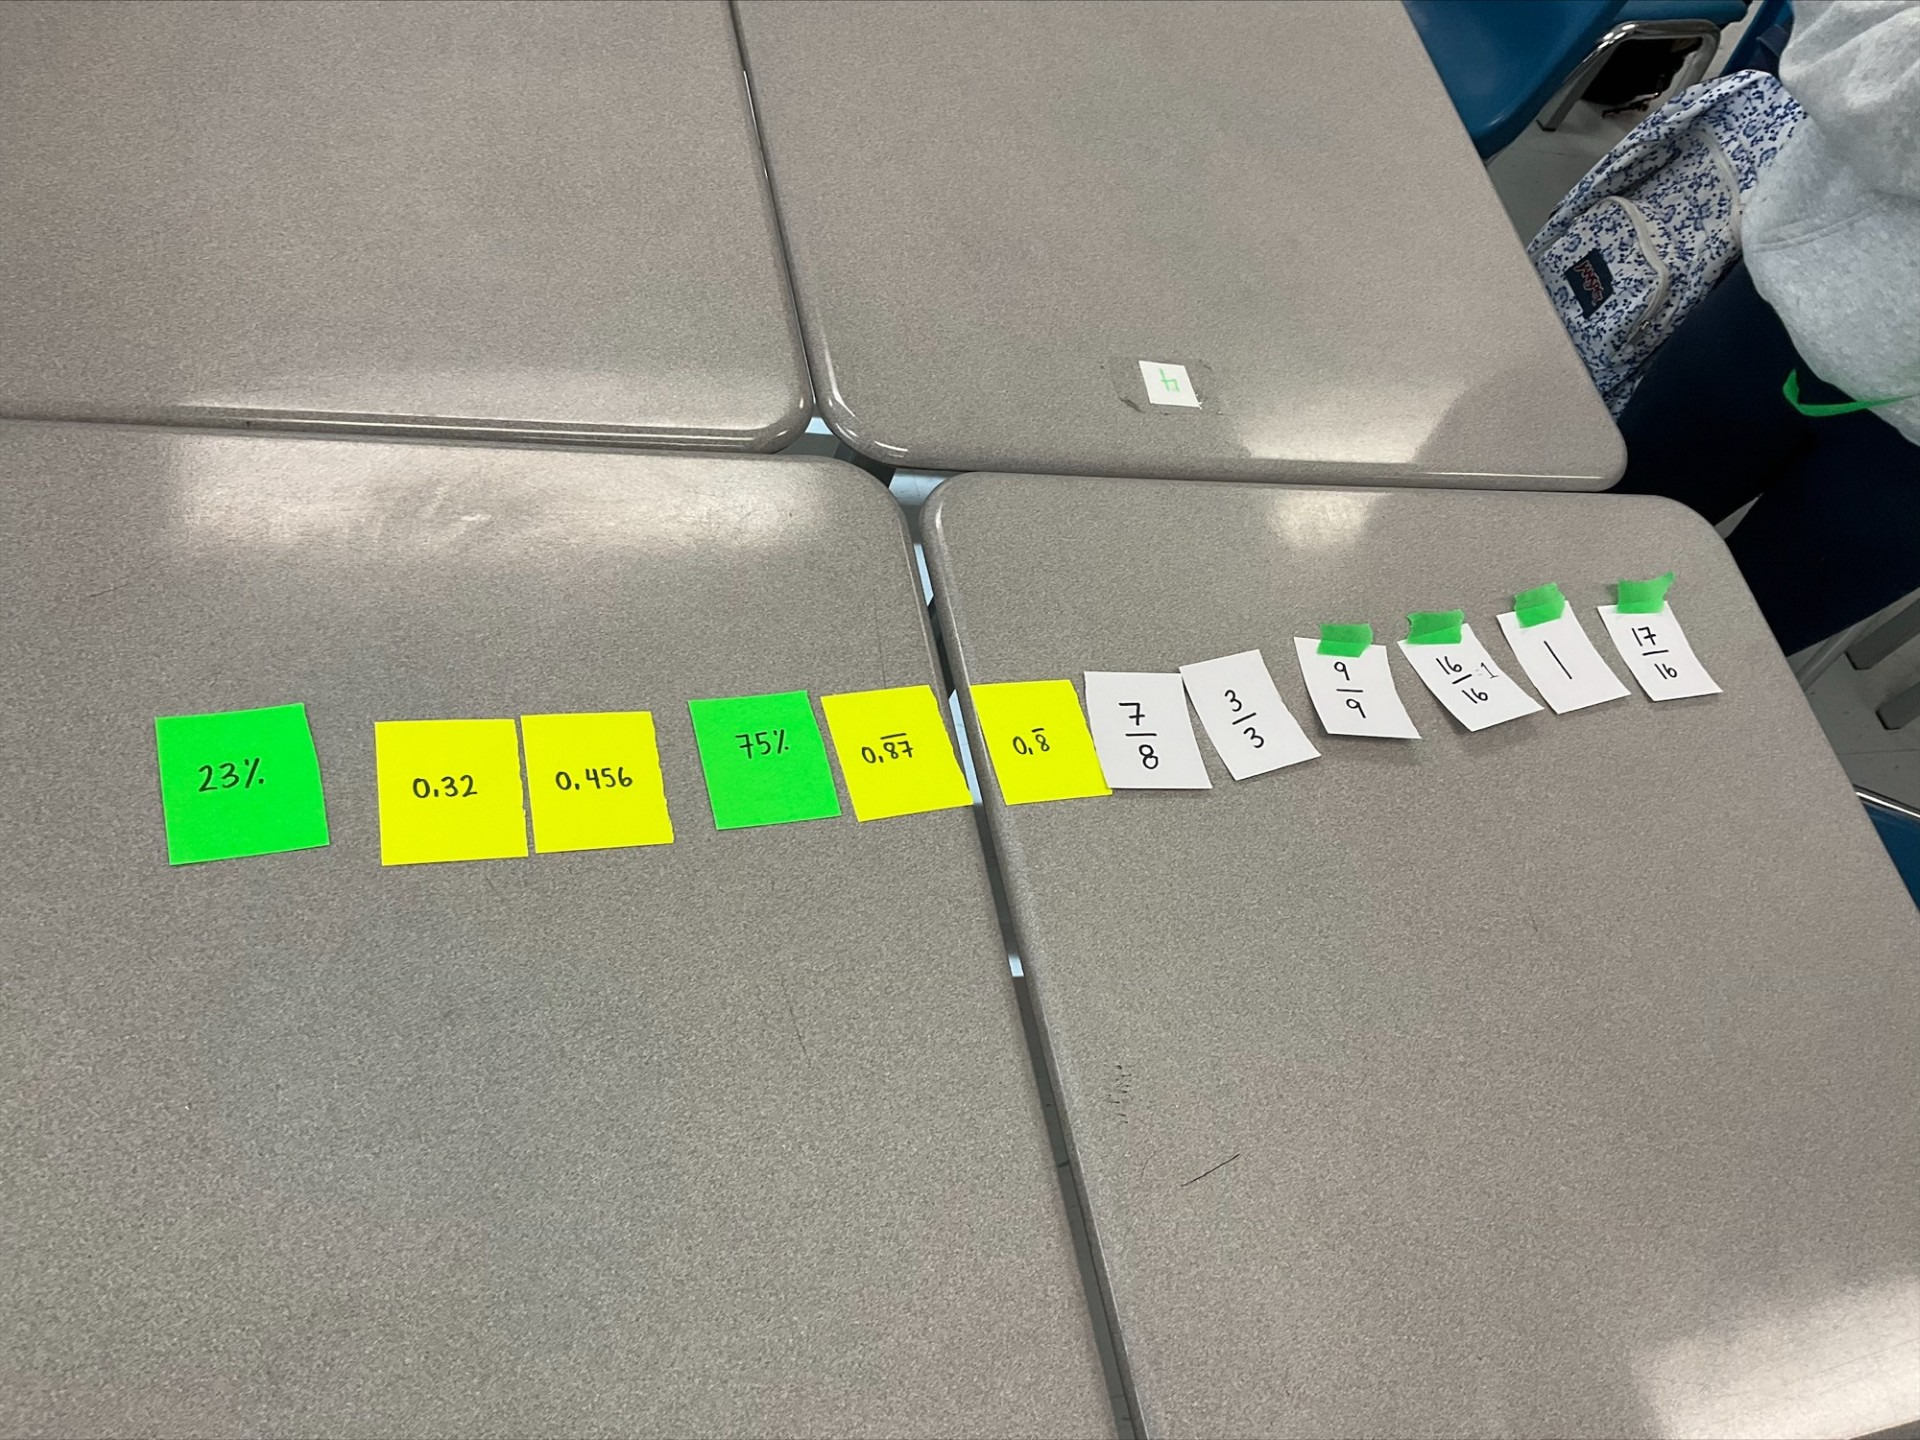
Next I asked for a volunteer from each group to bring their biggest value up to the board and decide what was the biggest of the big values, and we established one end of our continuum. We did the same with another volunteer from each group comparing the smallest values to determine the other end of the continuum.
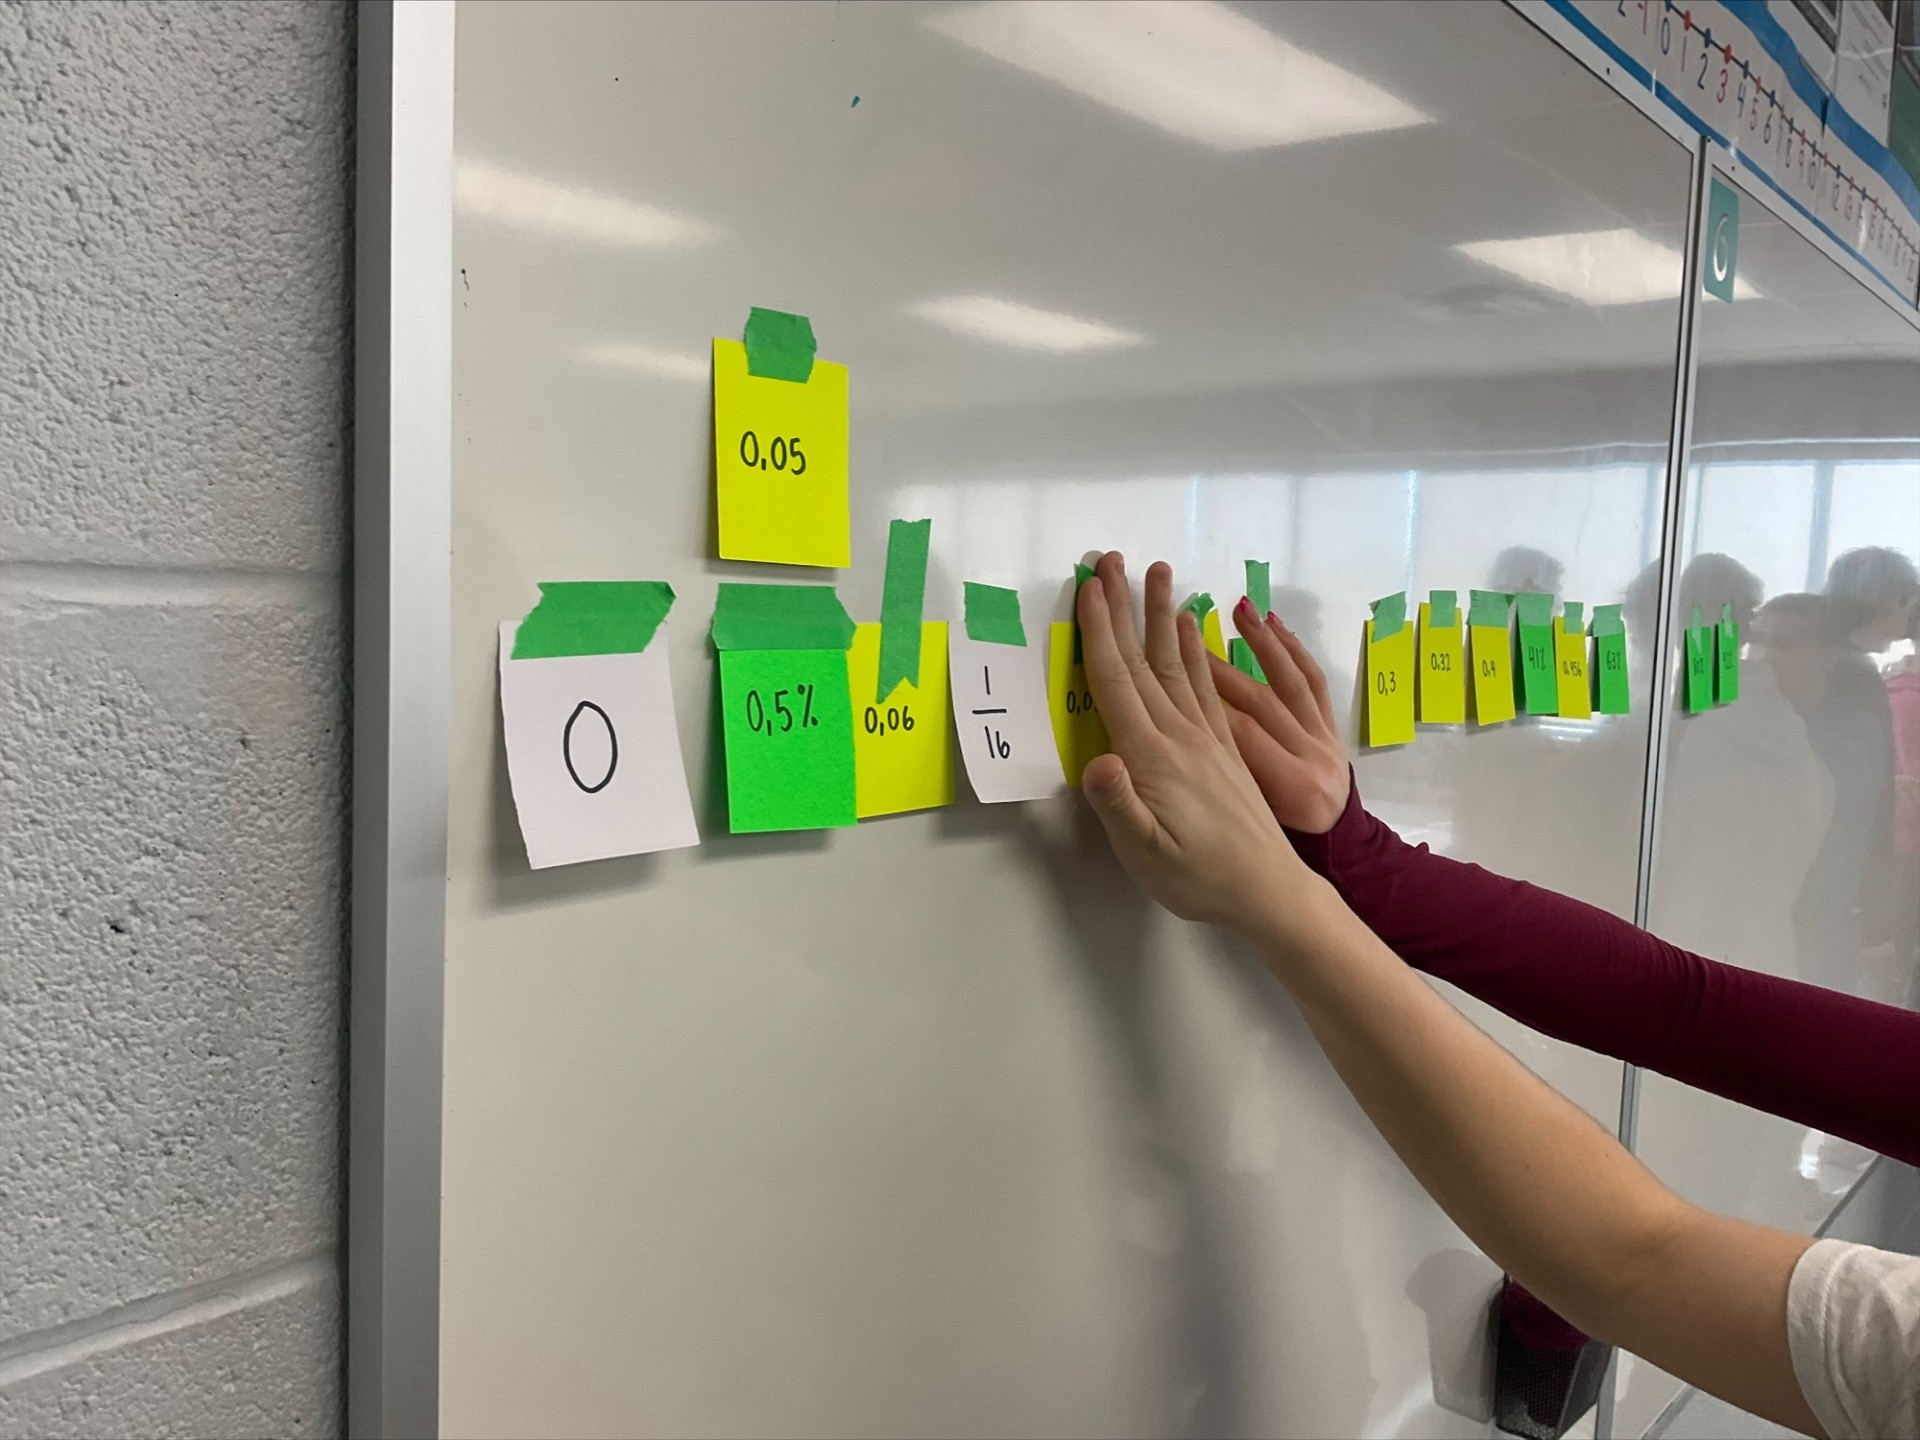
Next we had the entire class up organizing all of the cards into the right order on the whiteboards across the room. Students placed things that they thought were equal in a vertical list. We needed to do some discussing about whether 0.5% and 0.05 were the same thing.
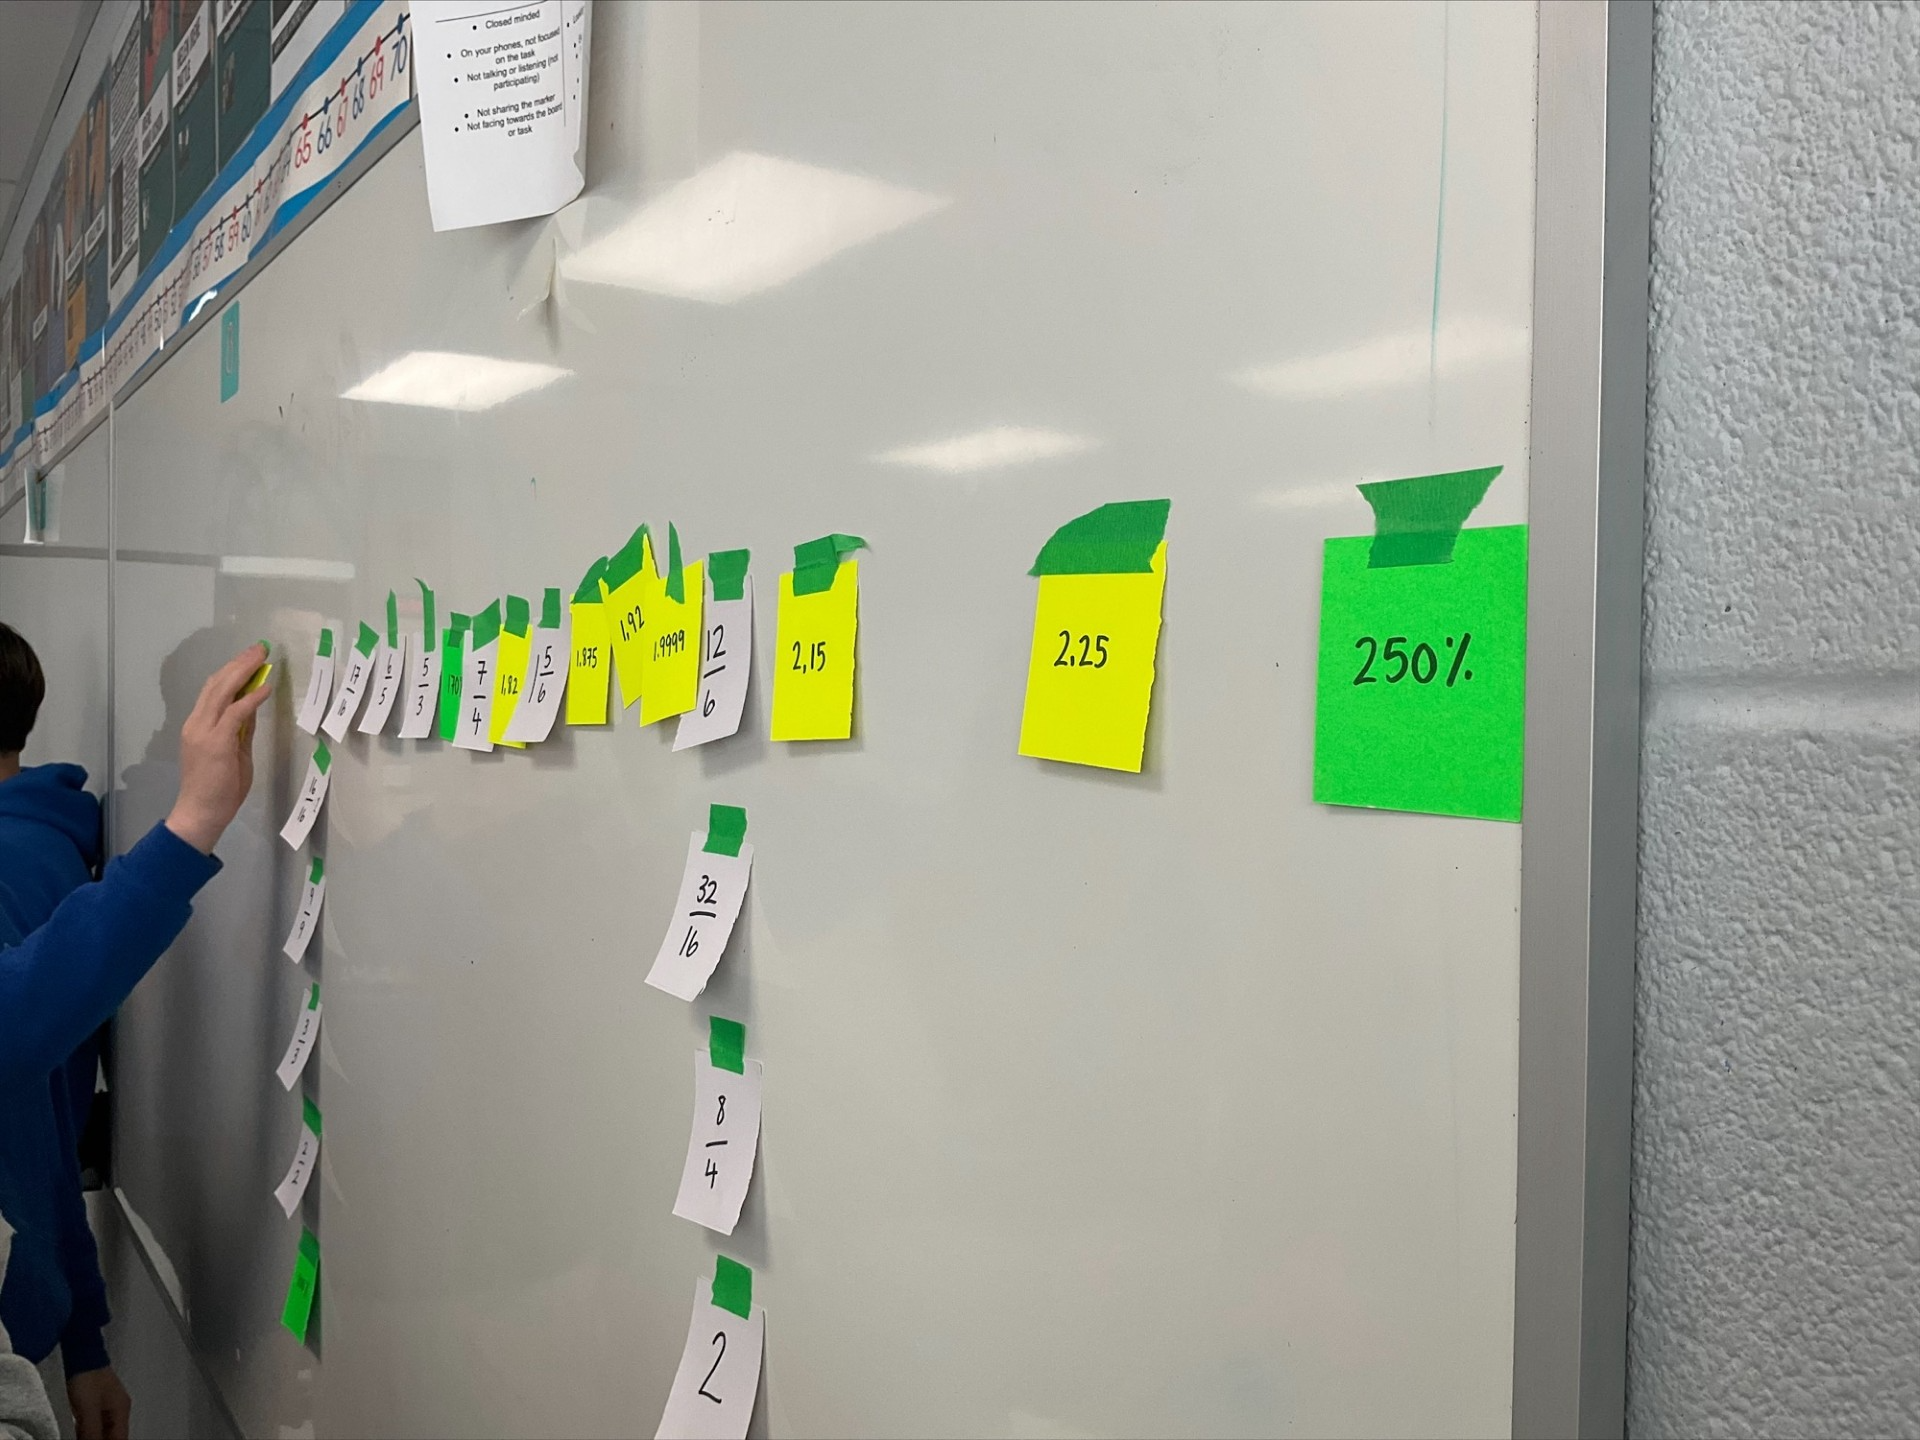
Finally we worked on spacing out our values well, so we set some benchmark values of 0.5 and 1 and 1.5 and 2 and 2.5 equally spaced on the board, and tried to assemble a scaled version of our list.

I was impressed that there were some great conversations happening as students were comparing values. Many converted things to decimals to compare, but some were using their knowledge of percents and looking at fractions with the same numerator and different denominators, or same denominators and different numerators to compare.
It took about half a period including a lot of discussion. This type of activity could work well for doing place value, or scientific notation too. I have done something similar looking at radians in a 4U advanced functions class, where we made the clothesline on an actual string which we took down off the board then assembled into a circle, and we could see how good our spacing was since 2π radians should be a full circle.
Beading Progress
We have been working with our school board Indigenous Program team to work on a math project. We have been doing loom beading based on designs that students made. They need to be able to talk about the math that they use in their designs once they are finished.
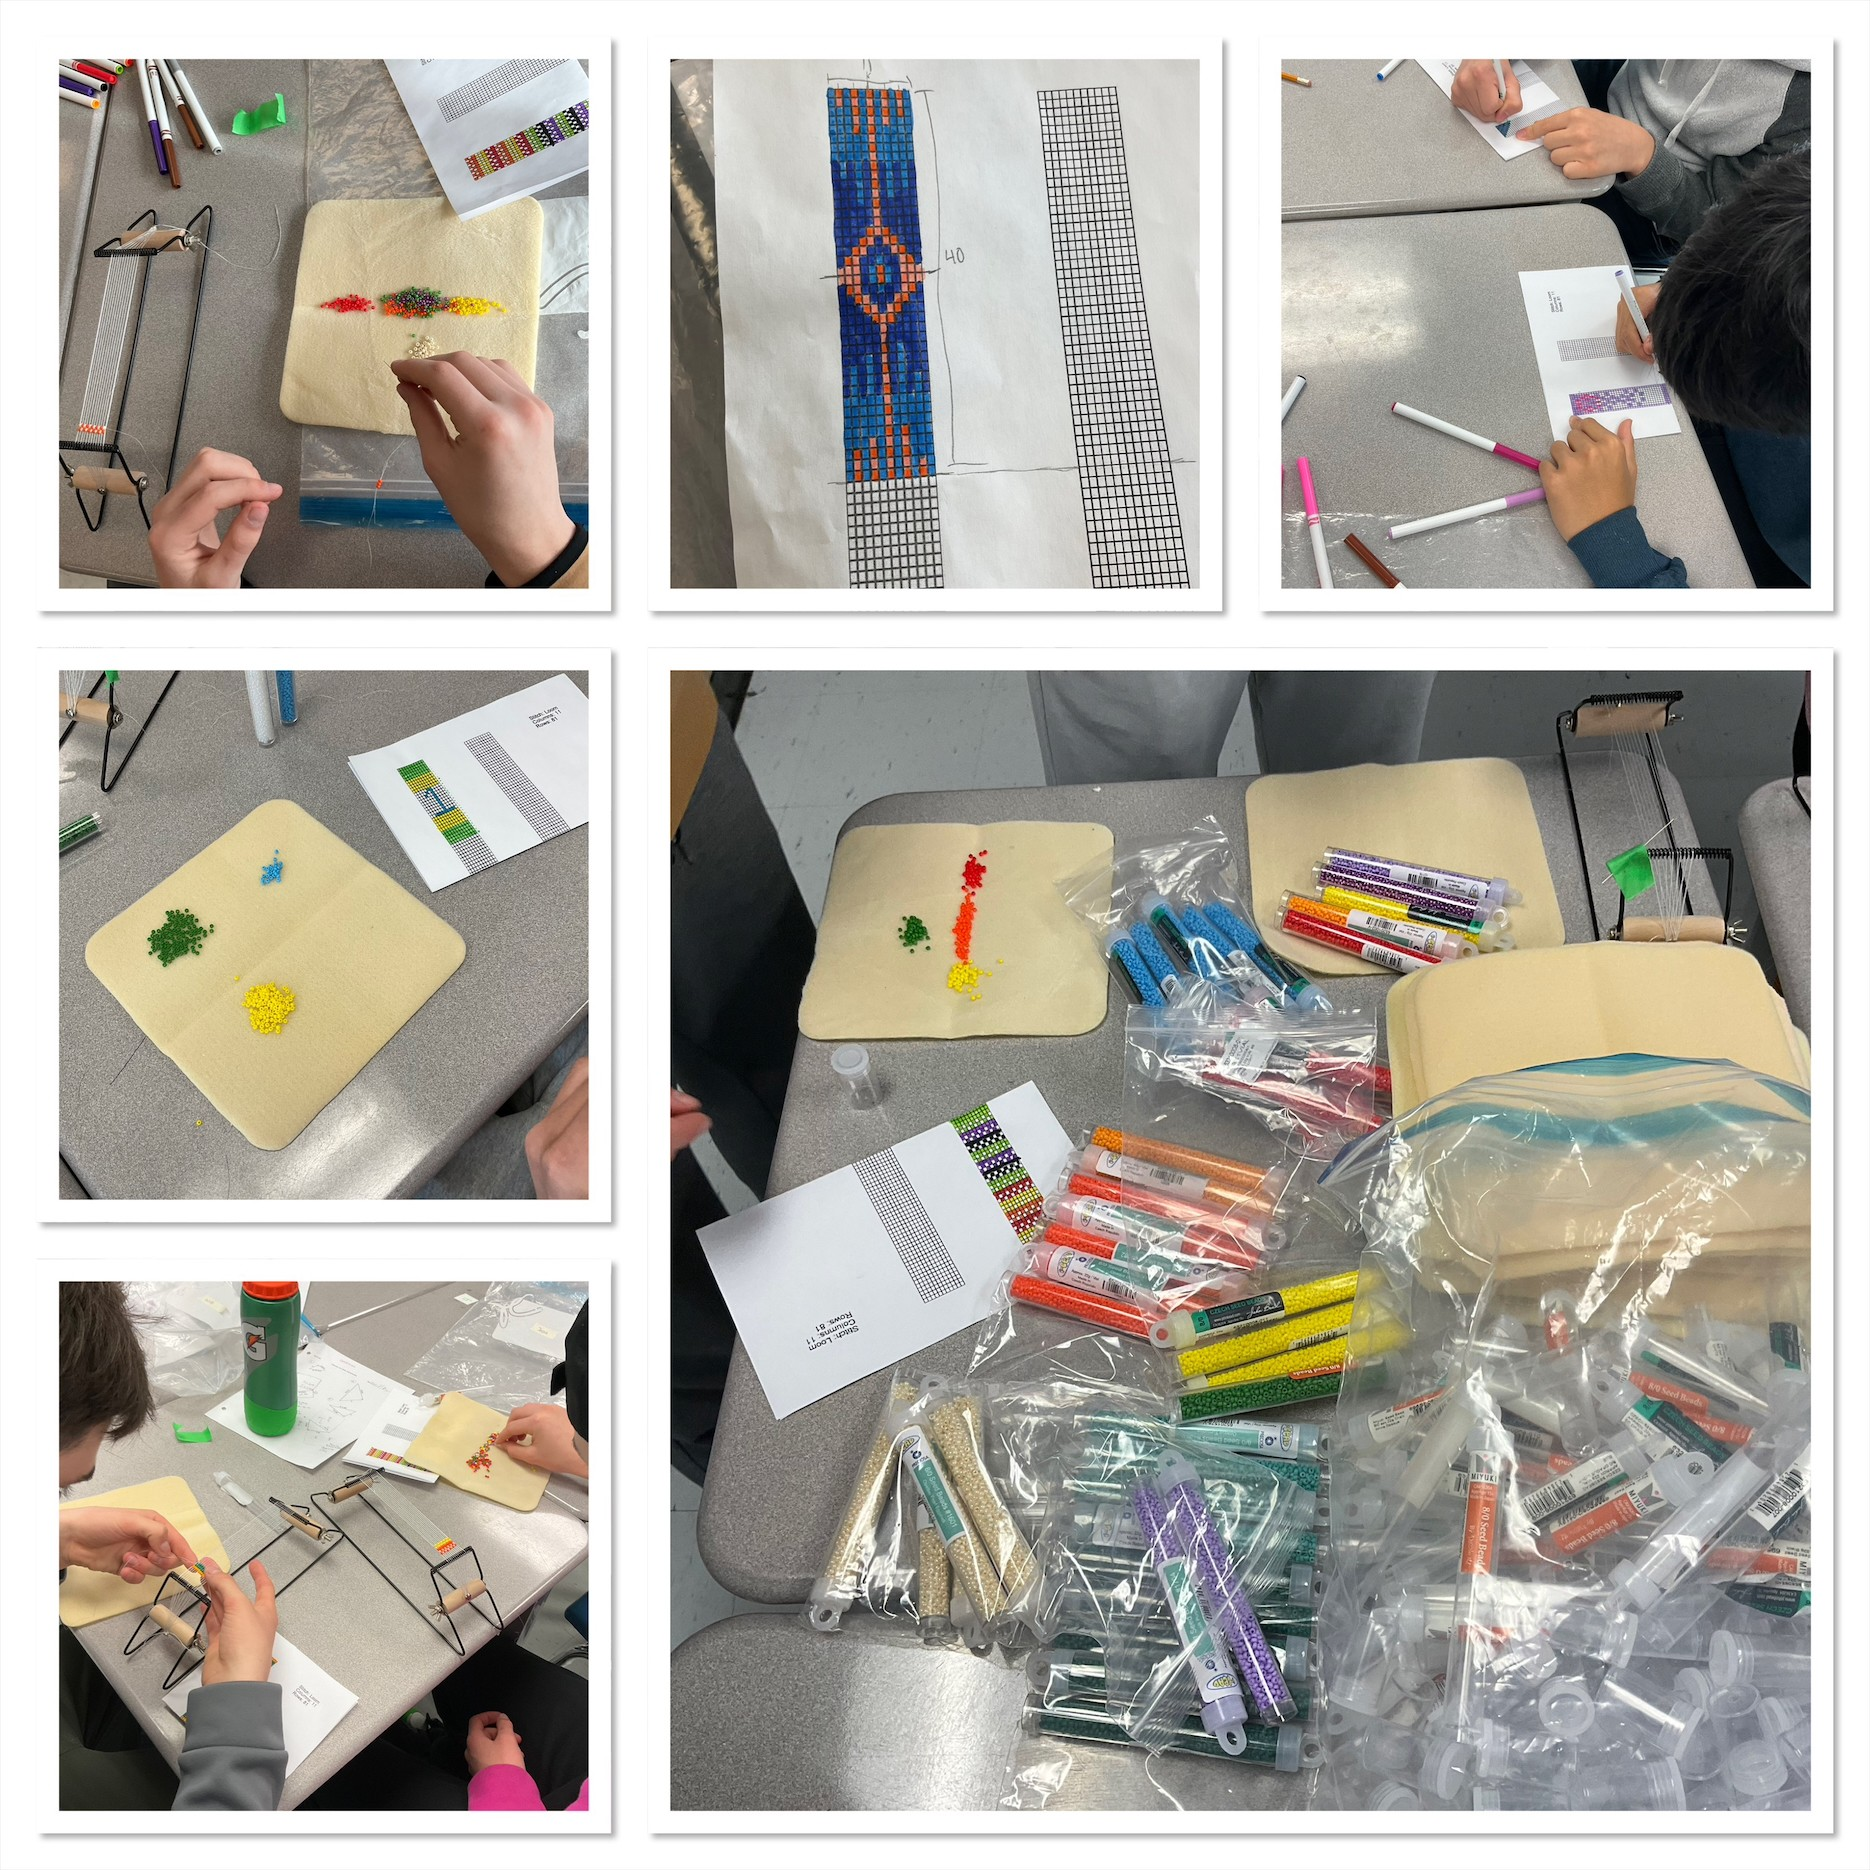
Some of the math that we can see and talk about are:
- number of beads used (area model)
- fraction (ratio, decimal, percent) of beads of a certain colour
- symmetry
- reflections or rotations
- angles
- slopes
- proportional reasoning (e.g. for every pattern repeat of 4 rows we need to add 5 red beads)
- shapes
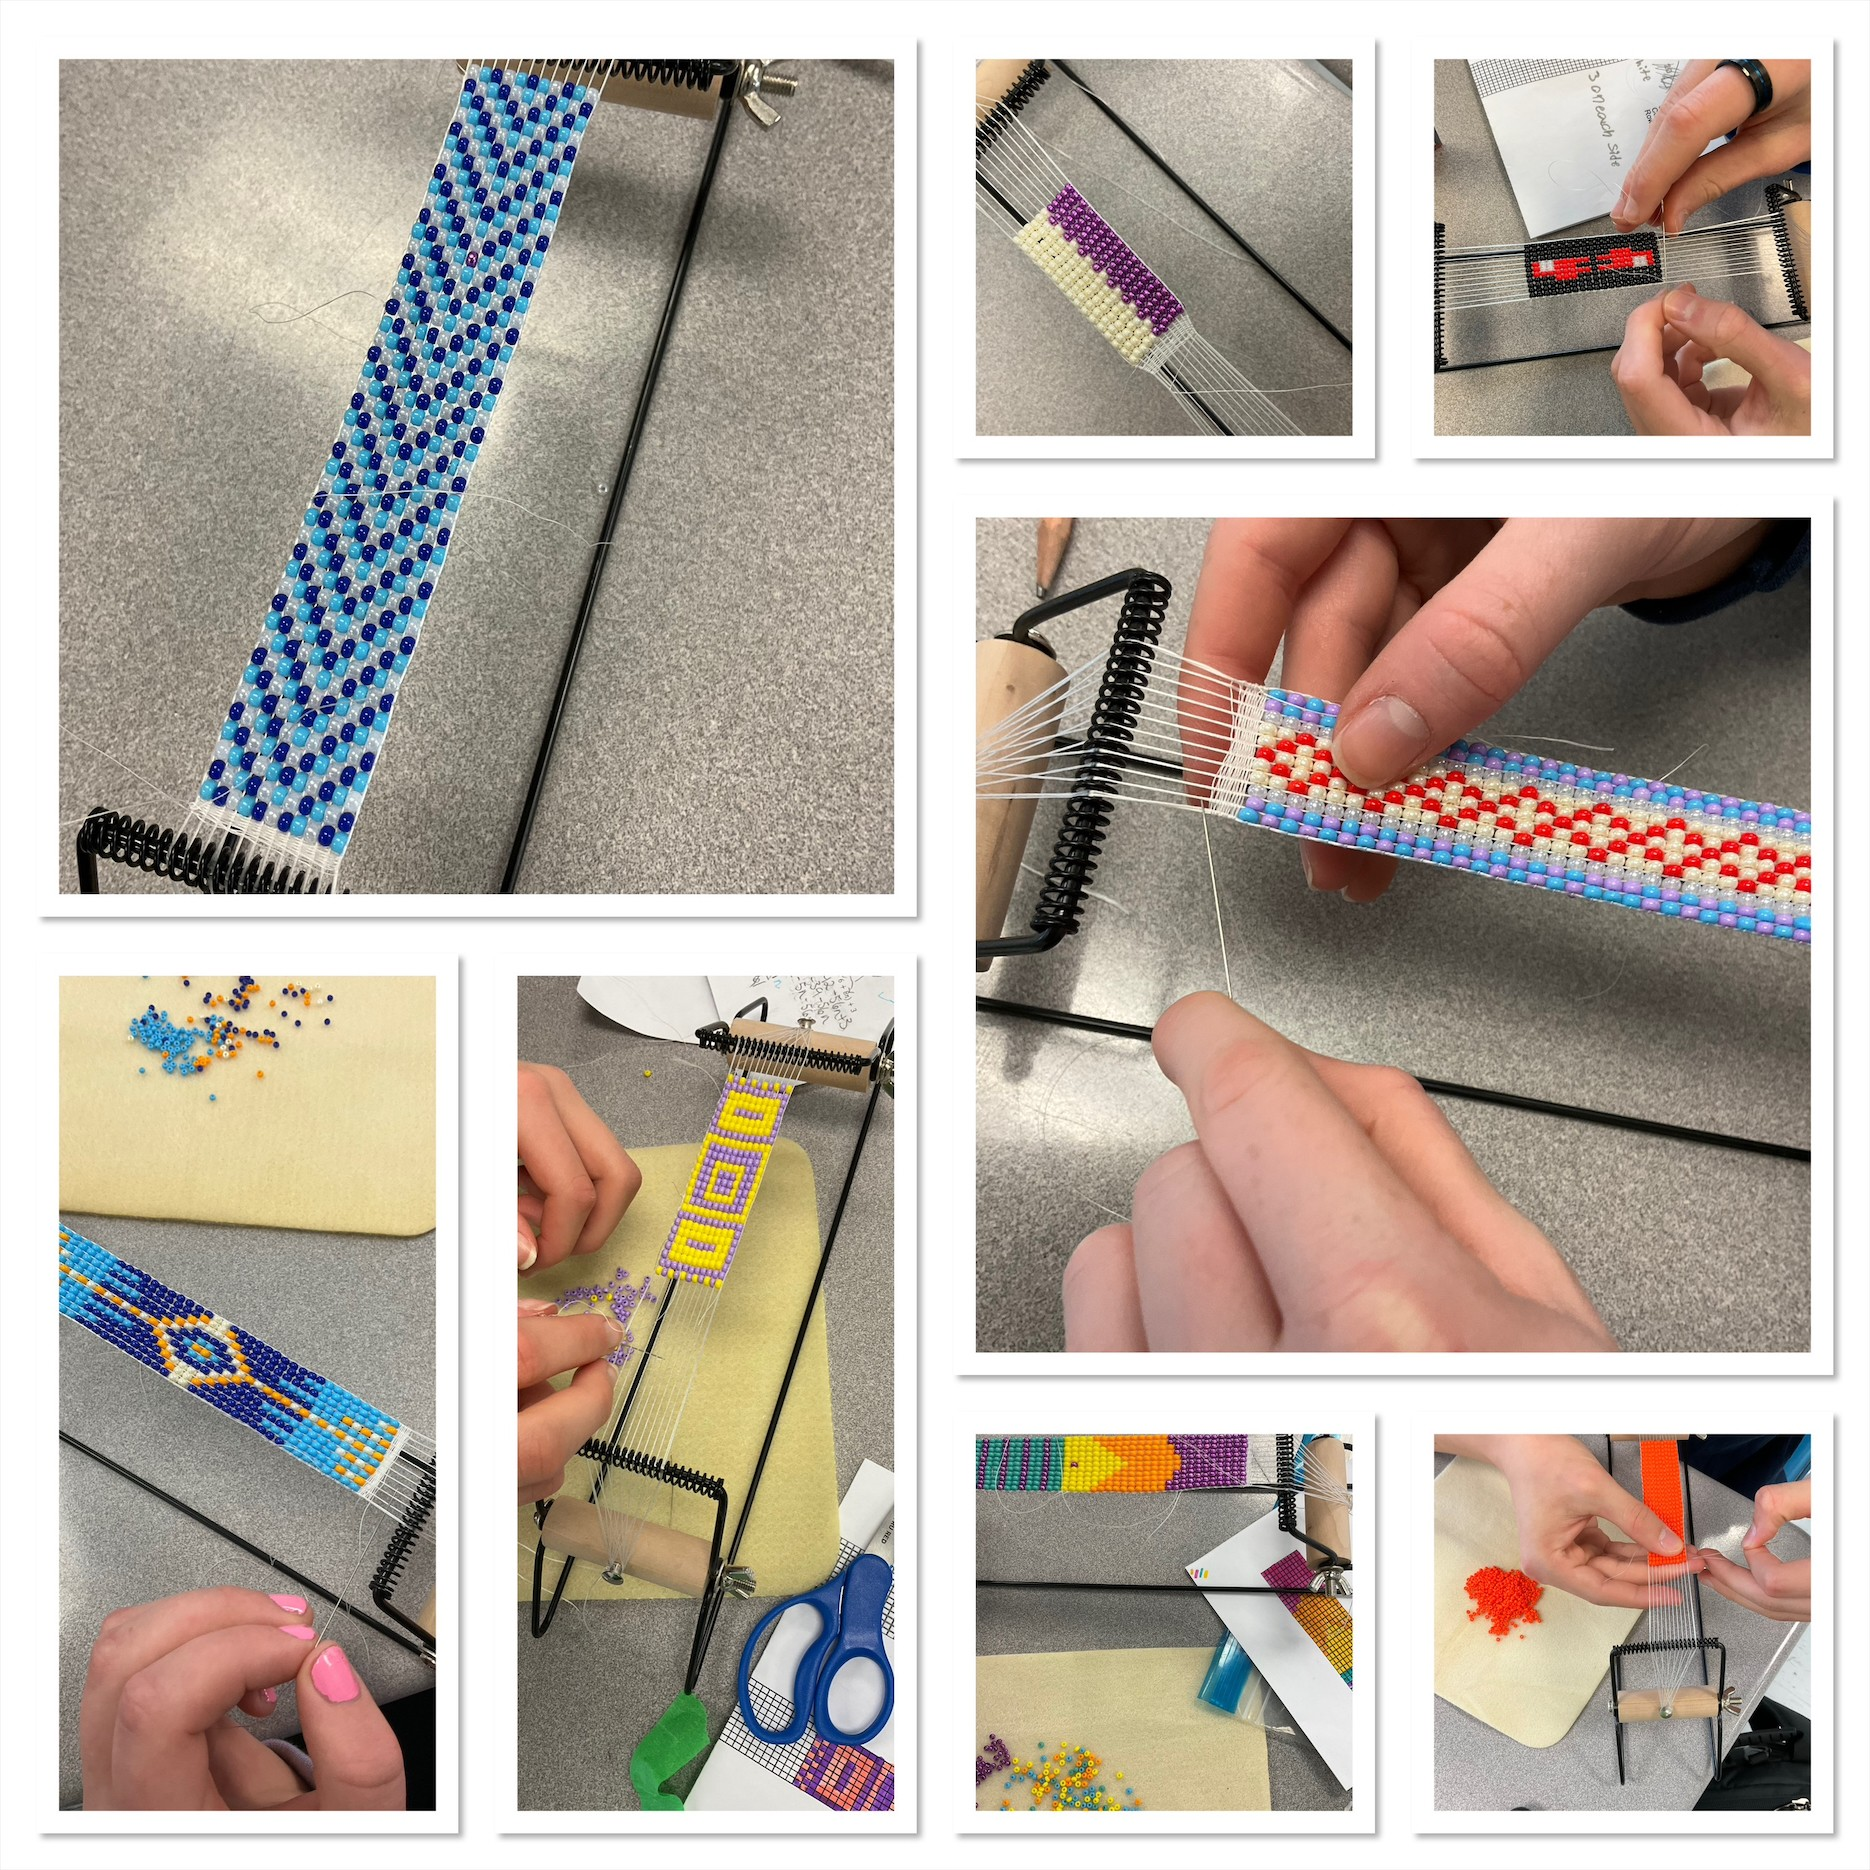
One student gave each digit from 0-9 a different colour, and then used their beading to express the value of pi. There are so many possibilities with this task!
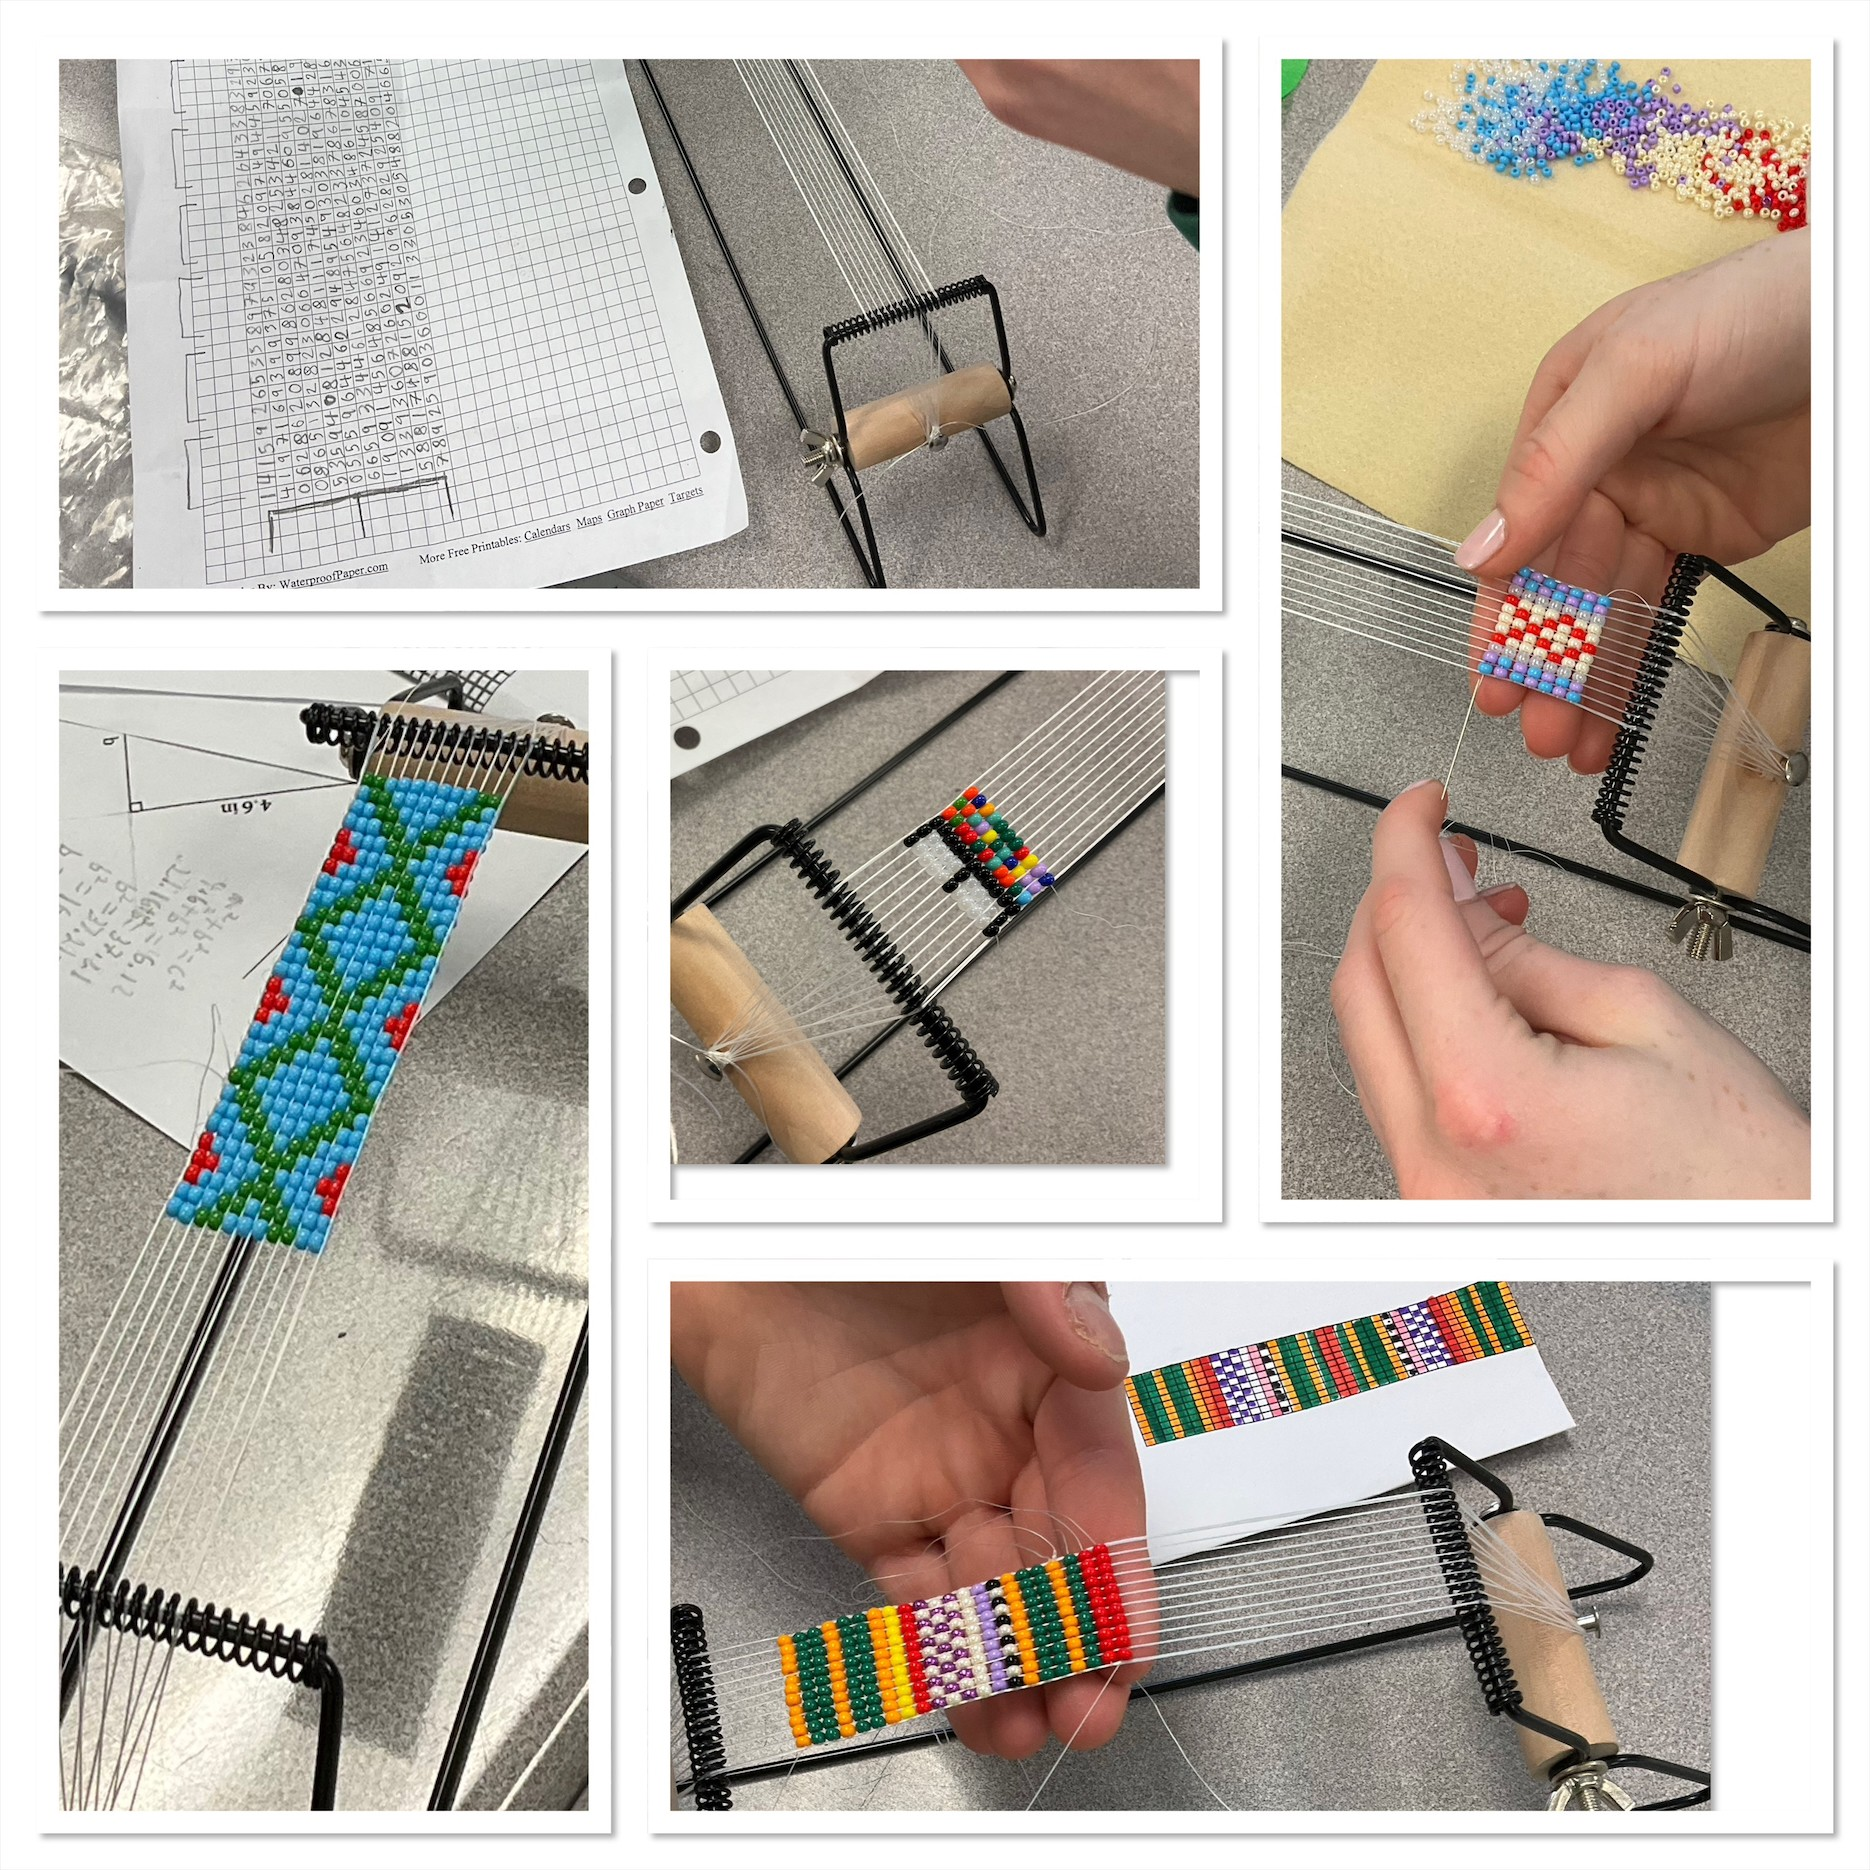
While working, students are also reminded of teachings shared with us by an Indigenous beader, who spoke about how we need to put good thoughts and intentions into our work, and if we are feeling frustration we need to take a step back and take a break. This skill and self awareness is important for math too, as sometimes we will need to take a break if feeling frustrated.
We also appreciate the teachings about including a spirit bead in our work, either by chance or on purpose. Having a bead out of place is not a disaster, but rather celebrated as a feature to be sought out and discovered, as a way to encourage people to look closely and appreciate the details in the work. In math too we are working to not view mistakes as a disaster, but rather a moment for learning, and something that can be looked at more deeply.
We will need to return to this task in a while to remove our beading from the loom and glue hide to our finished products.
Concept Circles for Exploring Exponents
We’re working on understanding what exponents mean, and how to represent them. To explore this topic today we used a concept circle framework at mild, medium and spicy levels of challenge.
Inside each concept circle, a manipulative is given, which will be used to create the models. We used toothpicks for x, skewers for y, and plasticine to connect them all together


Here are some photos of what students showed. The ideas to tackle with this circle is the idea of brackets, and how 2x2 and (2x)2 are different. What is in the brackets becomes the side length of the object. We also explore the difference between having an exponent of 2 and 3. We can explore visually how (2x)2 = 4x2, and how (2x)3=8x3.


For the medium level, we introduce “half”, we talk about half an x, and half an x2 and half an x3. We can talk about how the hypotenuse of the (1/2) x2 needs to be longer than 1 toothpick. We reinforce the idea of what is in the brackets is the dimension of the object. We can explore visually how (1/2x)2=1/4x2, and how (1/2x)3=1/8x3. We also review distributive property, and show how x(x2+x) can be represented as x3+x2.

For the spicy level, students explored how to represent an x2y and an xy2 as rectangular prisms, and also looked at (x+y)2 and how it is not equal to x2+y2.
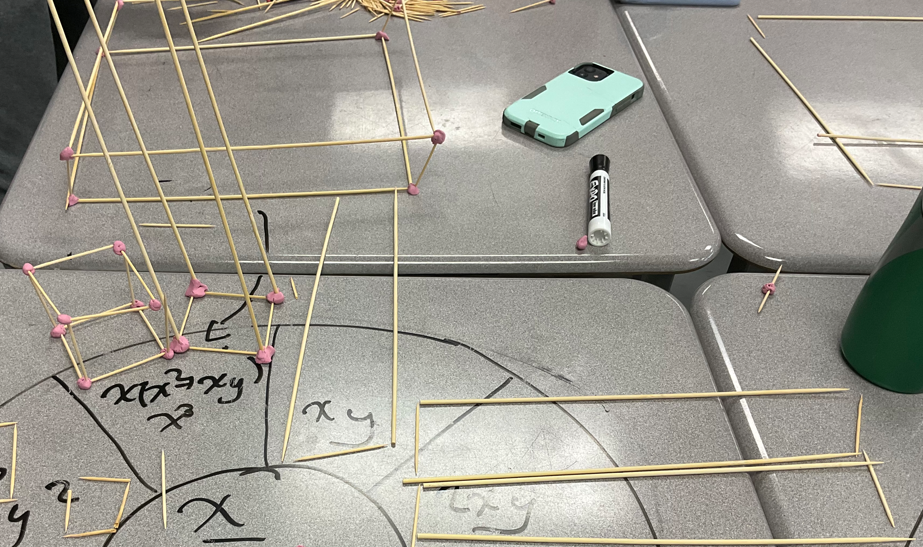

At the end of the class, some students used their creativity to build a super mega cube, a (2y)3.

It has been pretty powerful for students to understand the difference between algebraic expressions using algebra tiles and now these toothpick figures. Students have a very solid idea about what like terms are, which will come in handy in future equation solving problems, as we move to more symbolic representations.
We’re back!
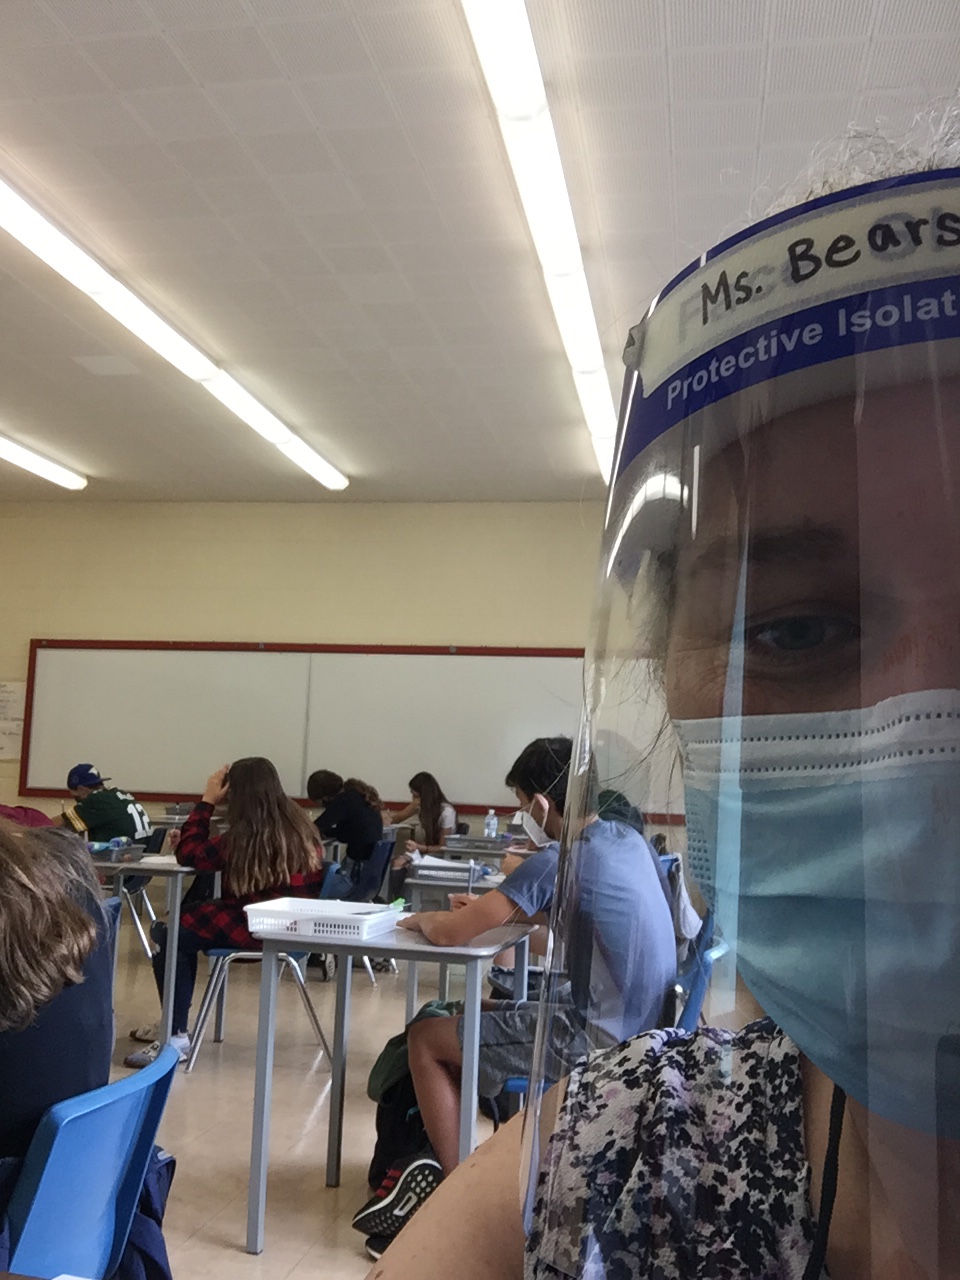
School’s back on, and we’re working hard.
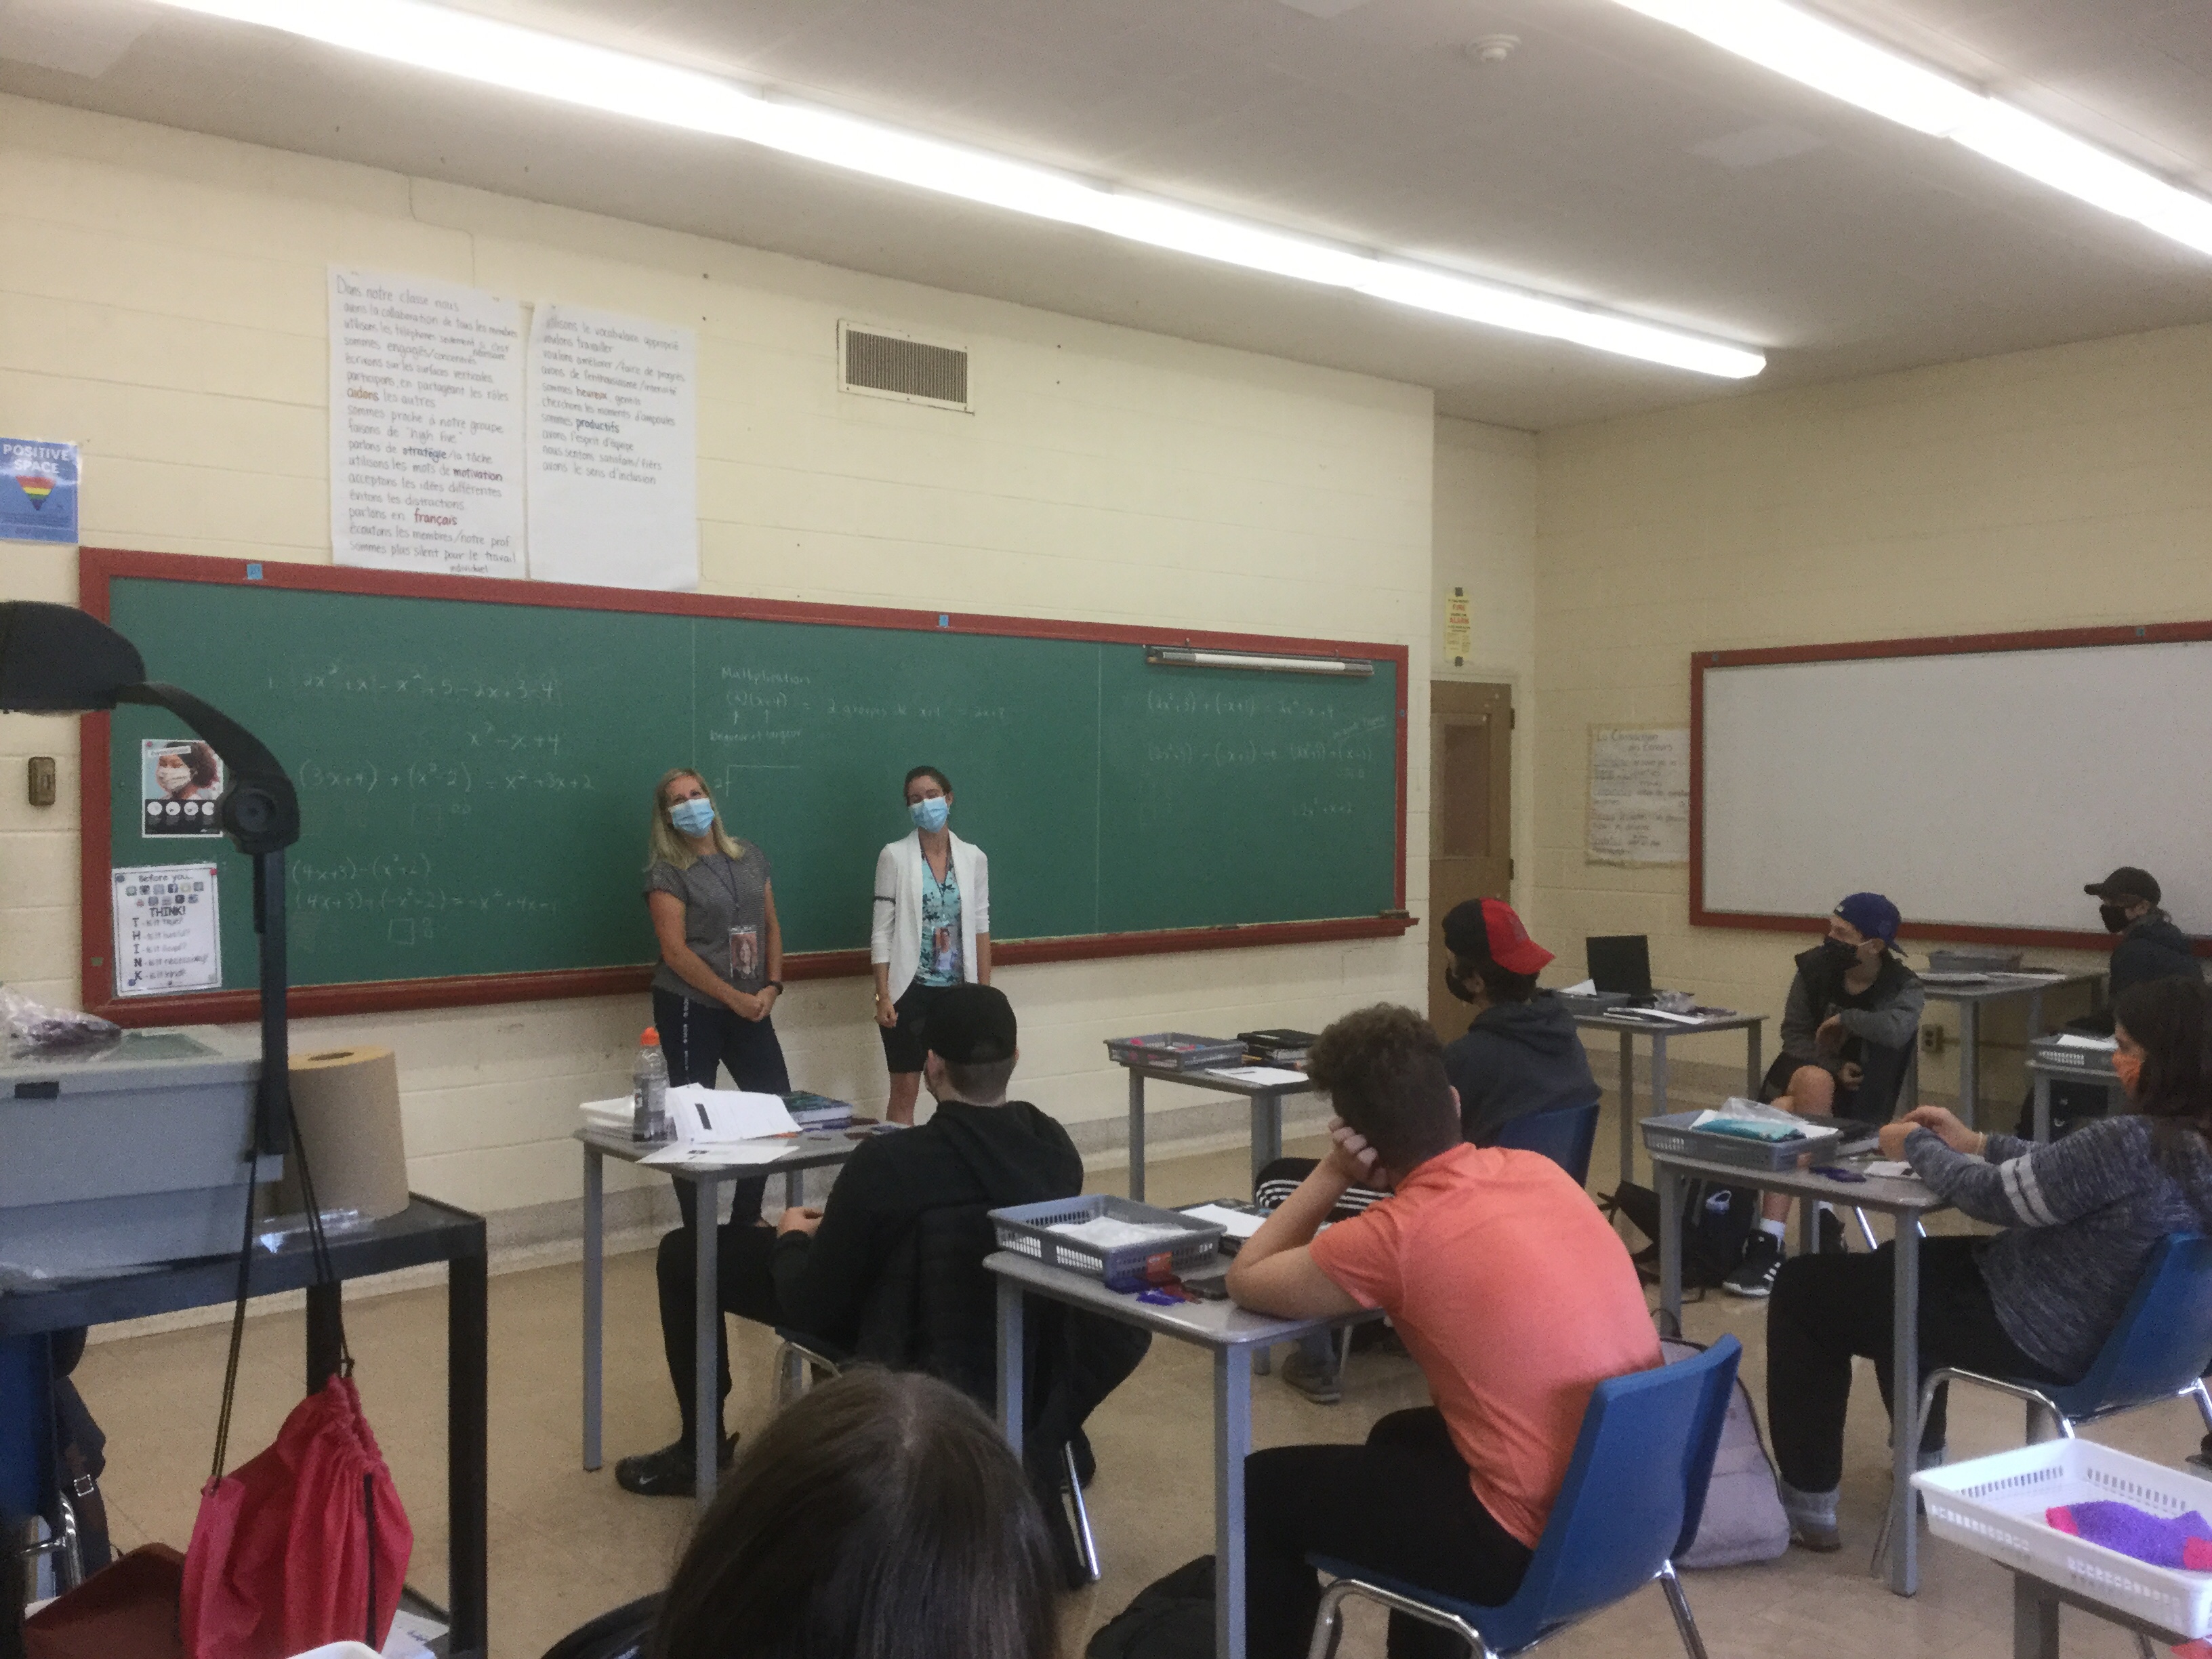
We’ve got our adolescent care workers in talking to us about the supports that are available for everyone this term.
