Expanding, Using The Area Model
Today my grade 10 class worked on multiplying binomials using tiles and again using the area model.

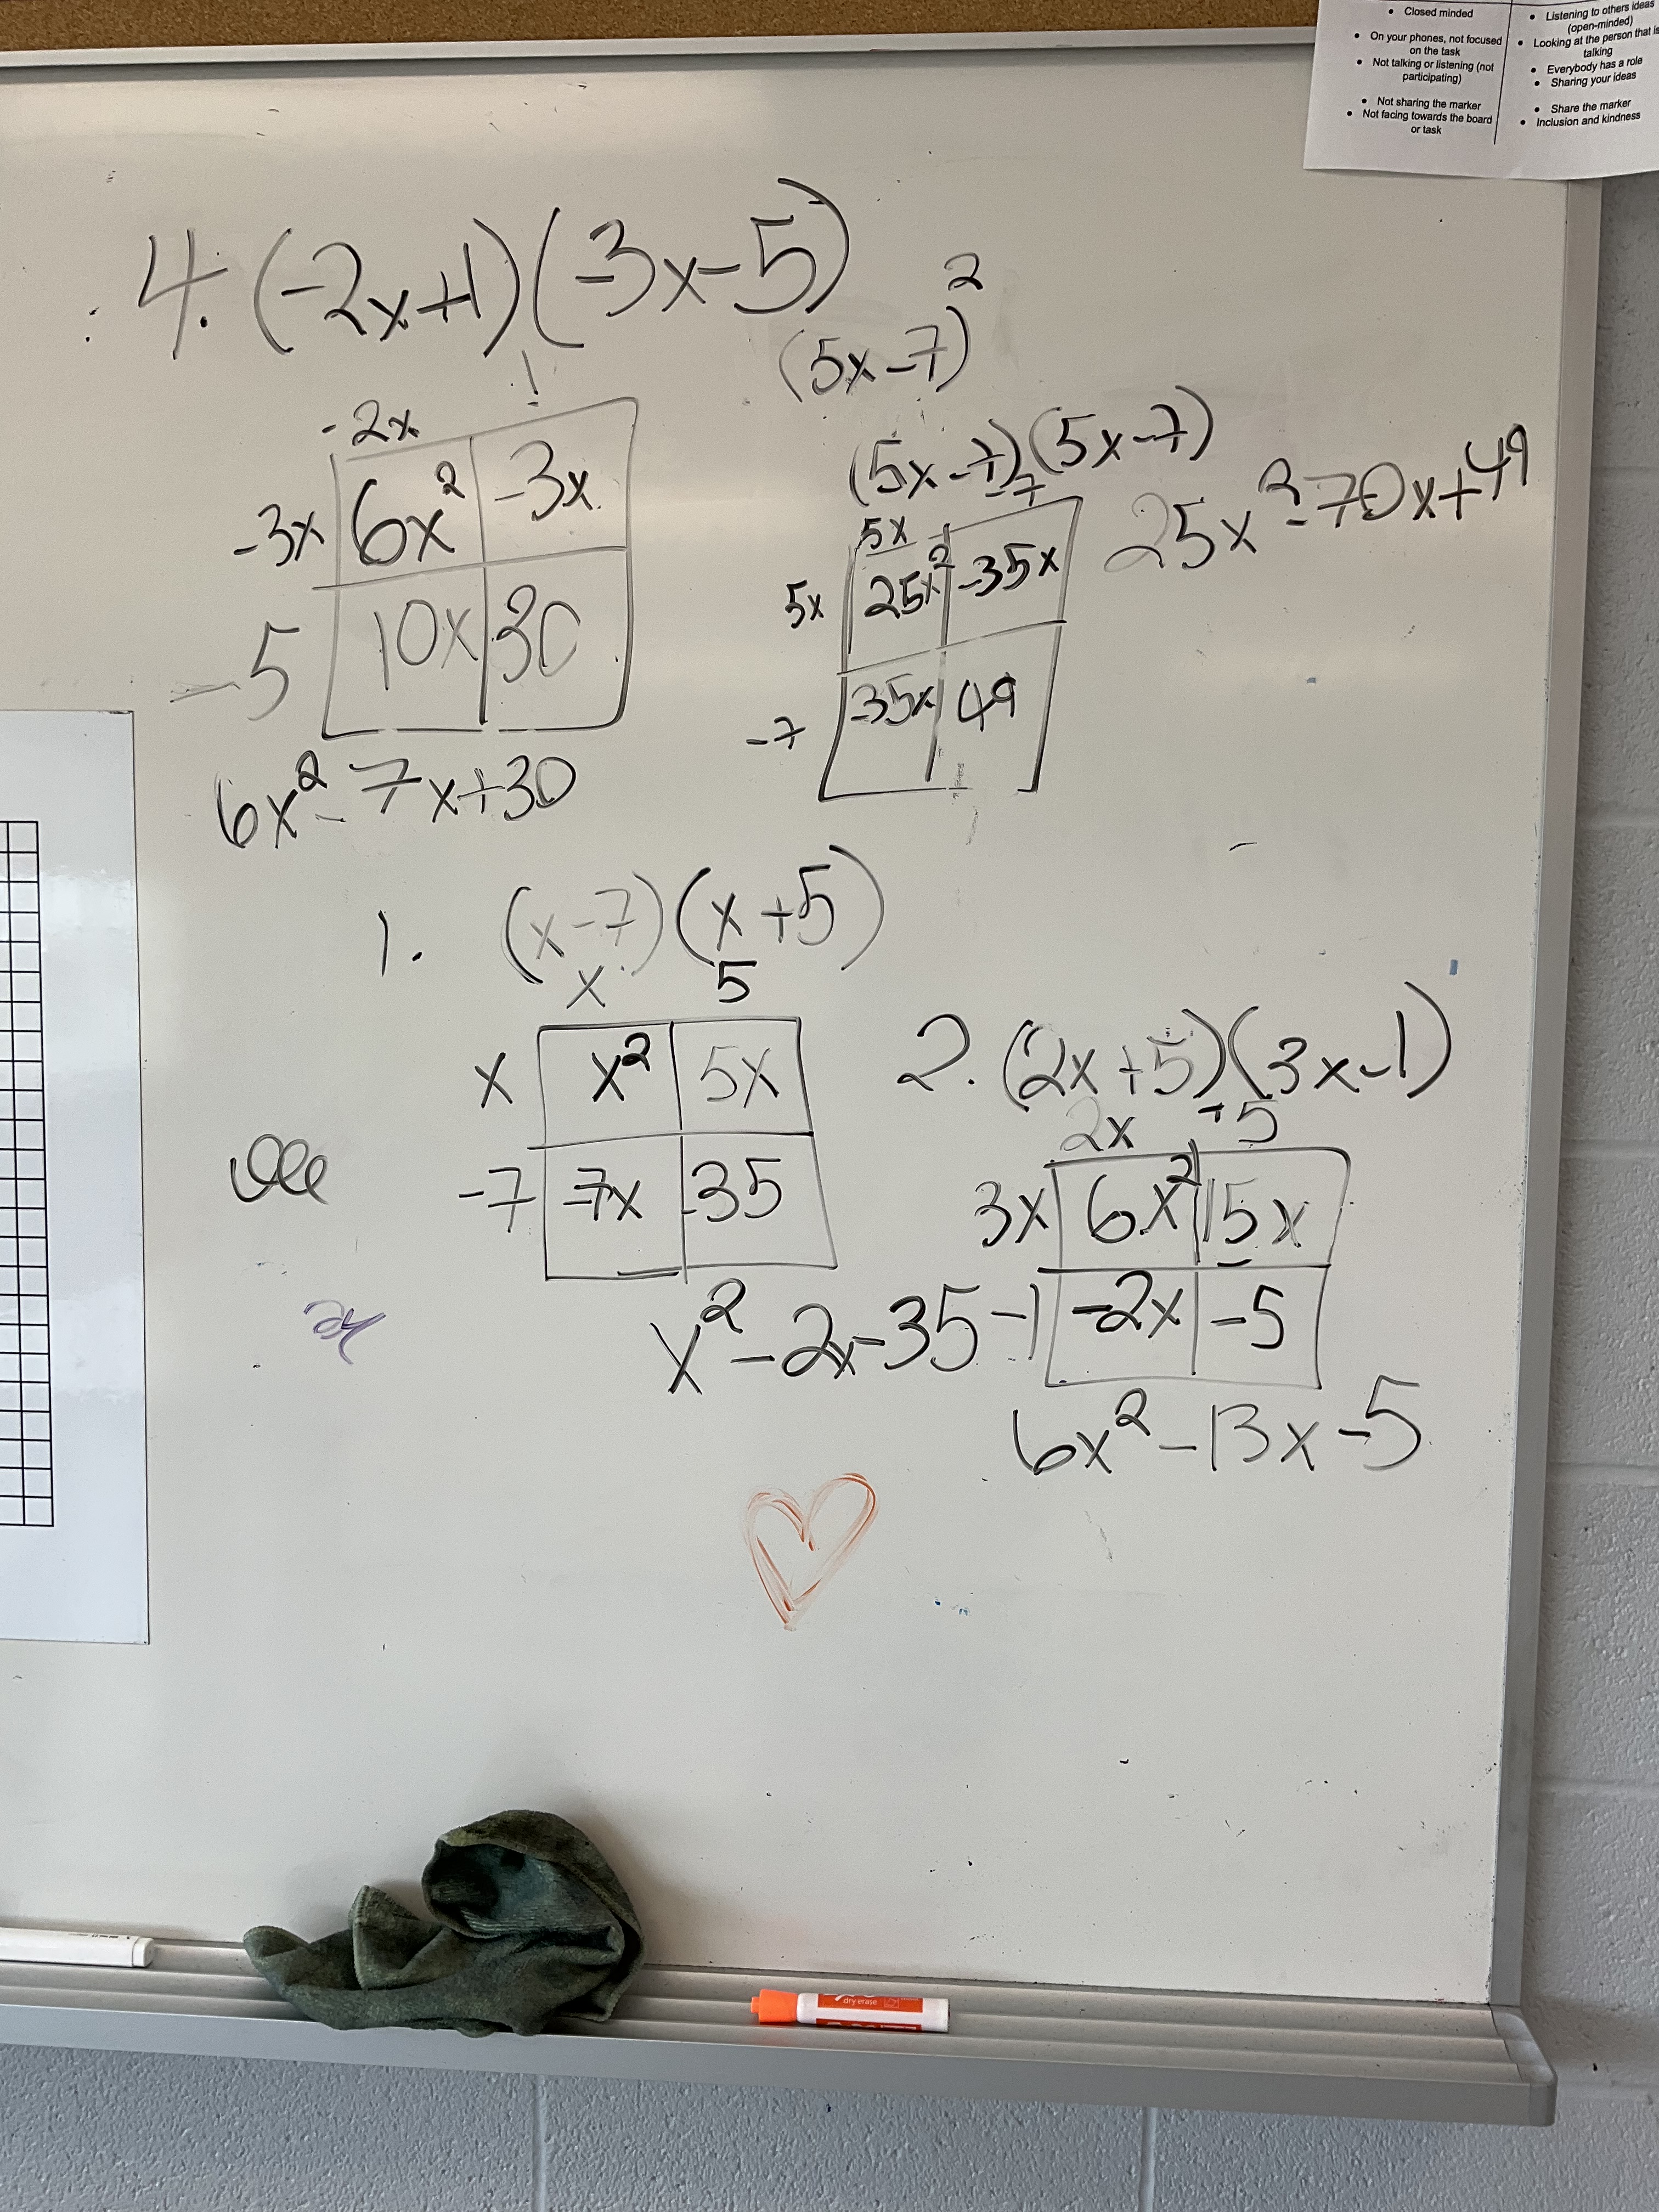
Instead of drawing all the tiles each time, we can notice that there are quadrants that form. We have the x squared terms in one corner, and diagonal to that we have the unit squares. On the other diagonal we have all of the x terms. We could draw out the tiles each time, or we can use the area model or the box method to multiply.
One interesting thing to observe is that the diagonals in the box have the same product. This will be important later!

We did a lot of multiplying today, including expanding a binomial squared.
It’s heartwarming to see these kinds of doodles! Glad we are all enjoying the math!

Algebra Tiles, Factoring and Expanding
Grade 10s are working hard to factor trinomials and to multiply binomials using algebra tiles.
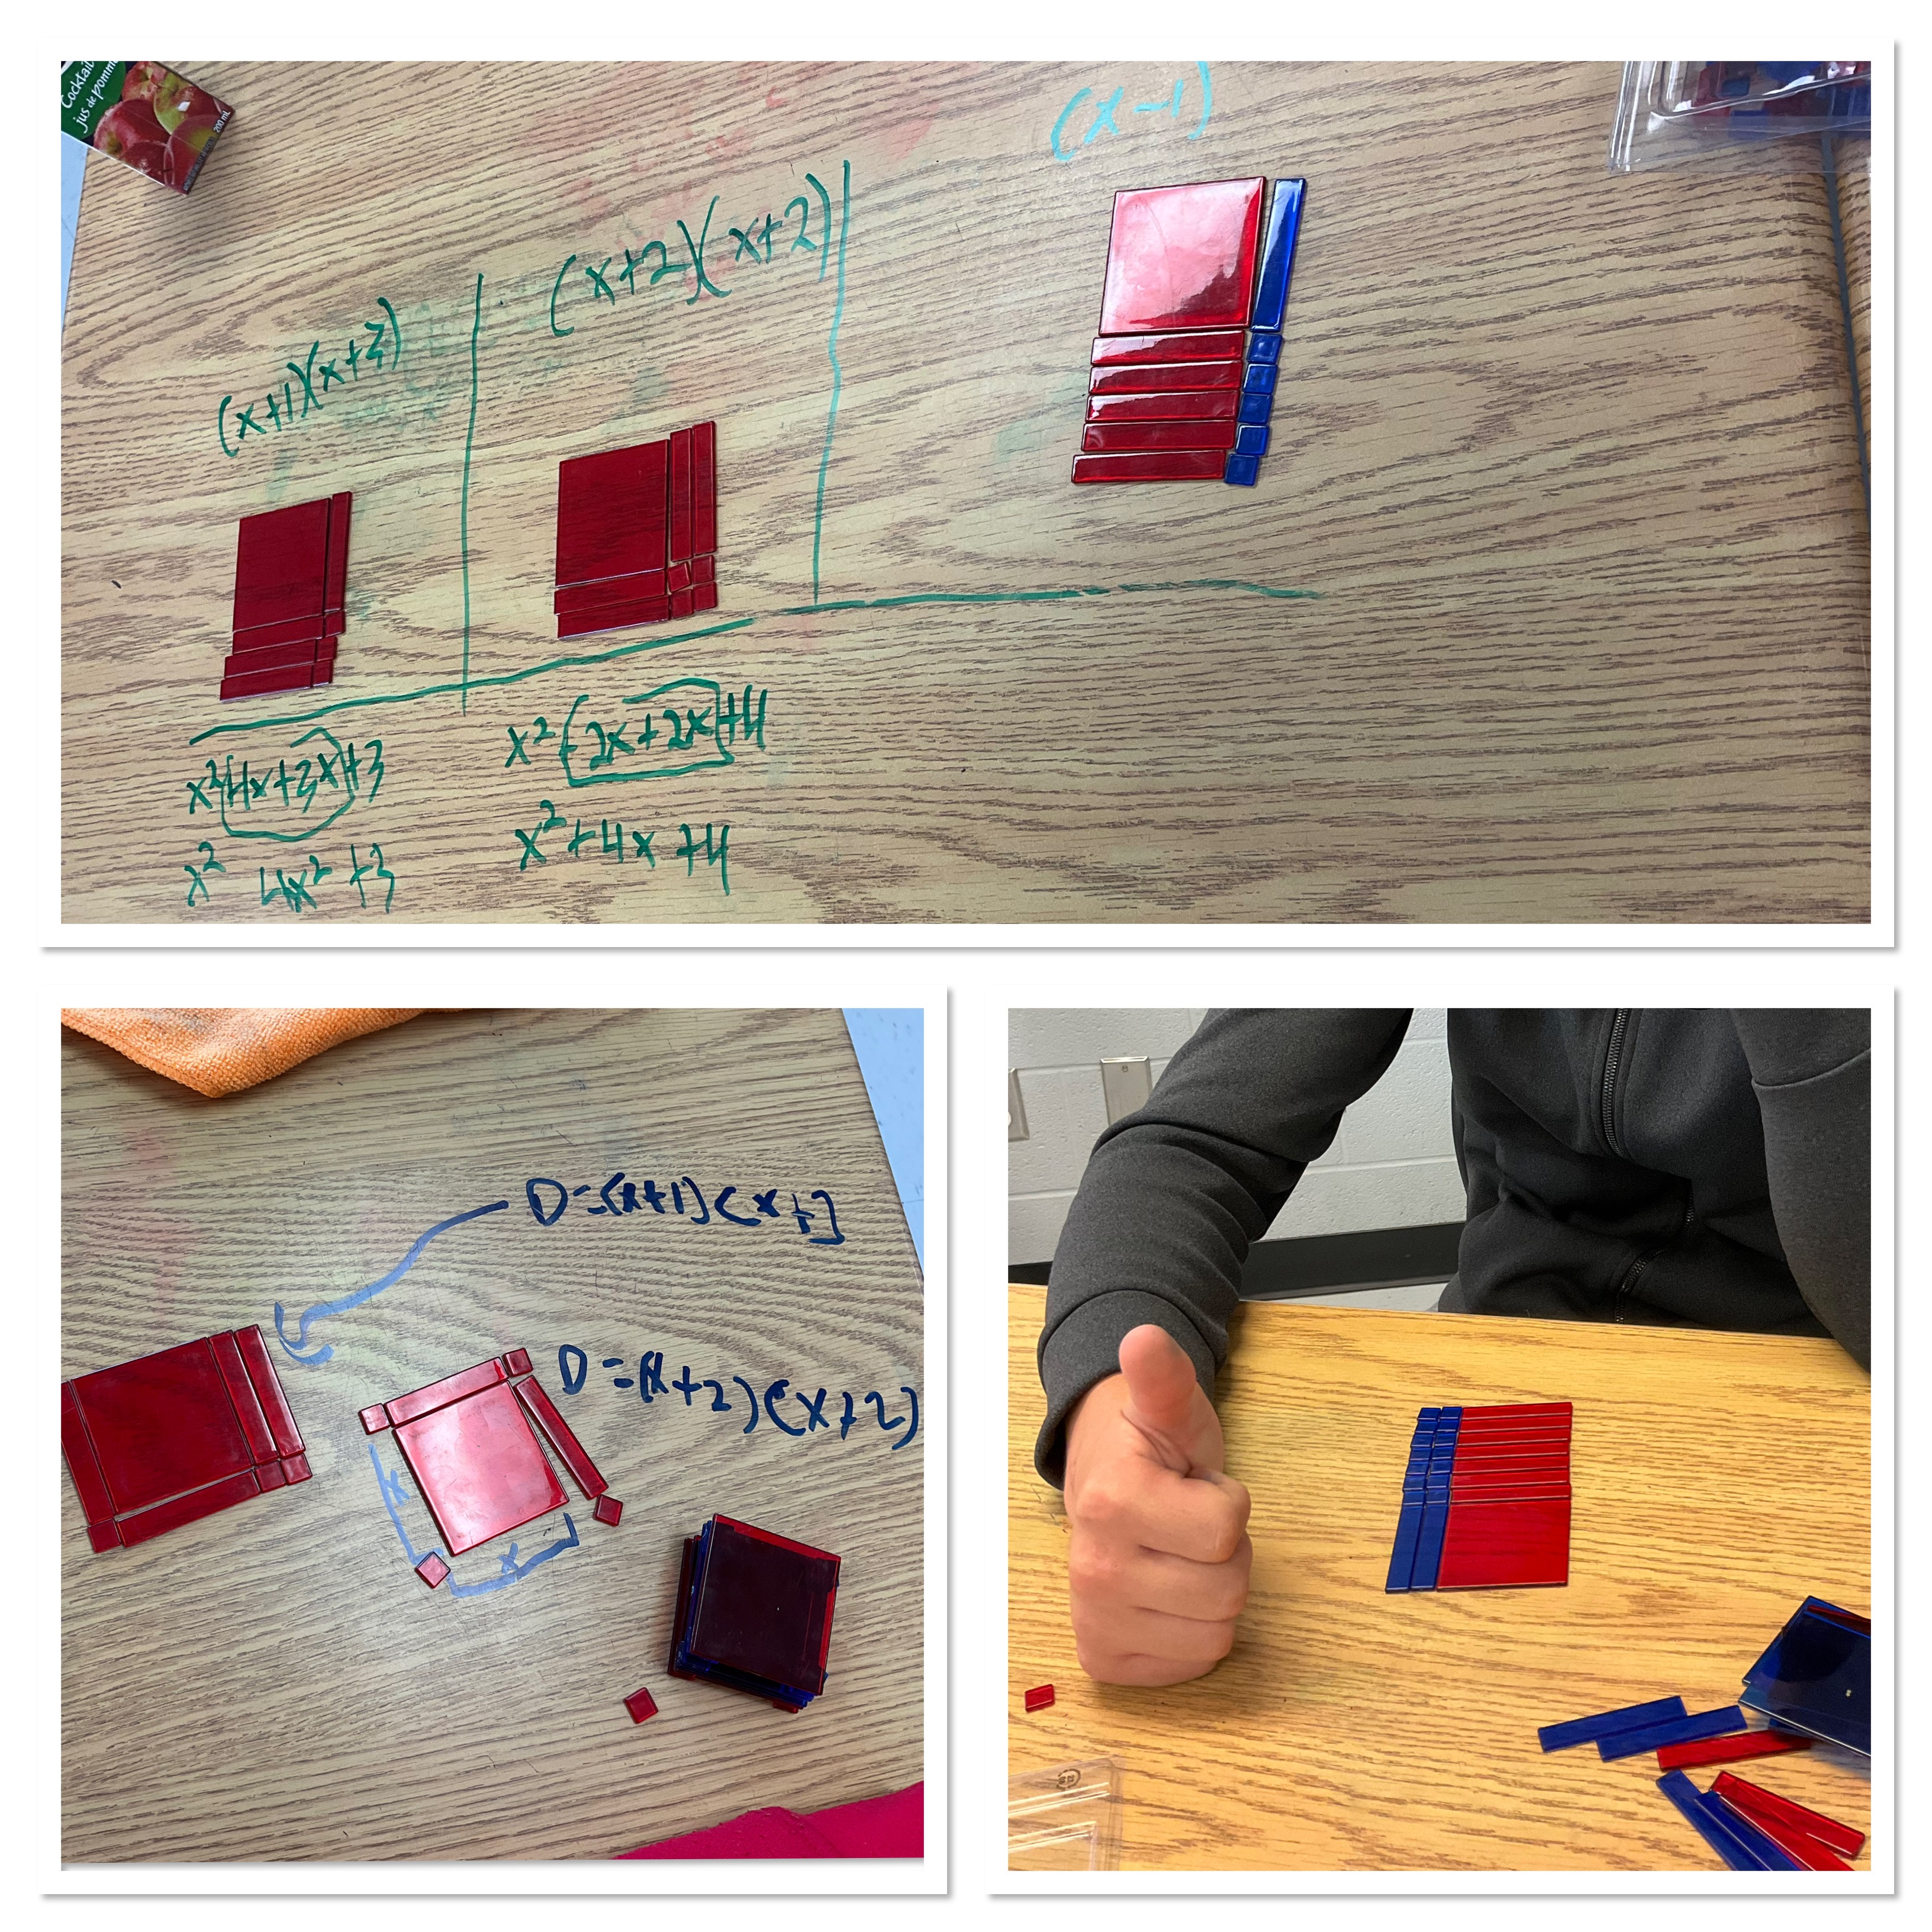
Students are becoming proficient at building rectangles with given tiles, including cases where they need to add zero pairs (of x and -x tiles) to complete the rectangles.
Confidence is growing with each day!
Measuring, Perimeter and Area
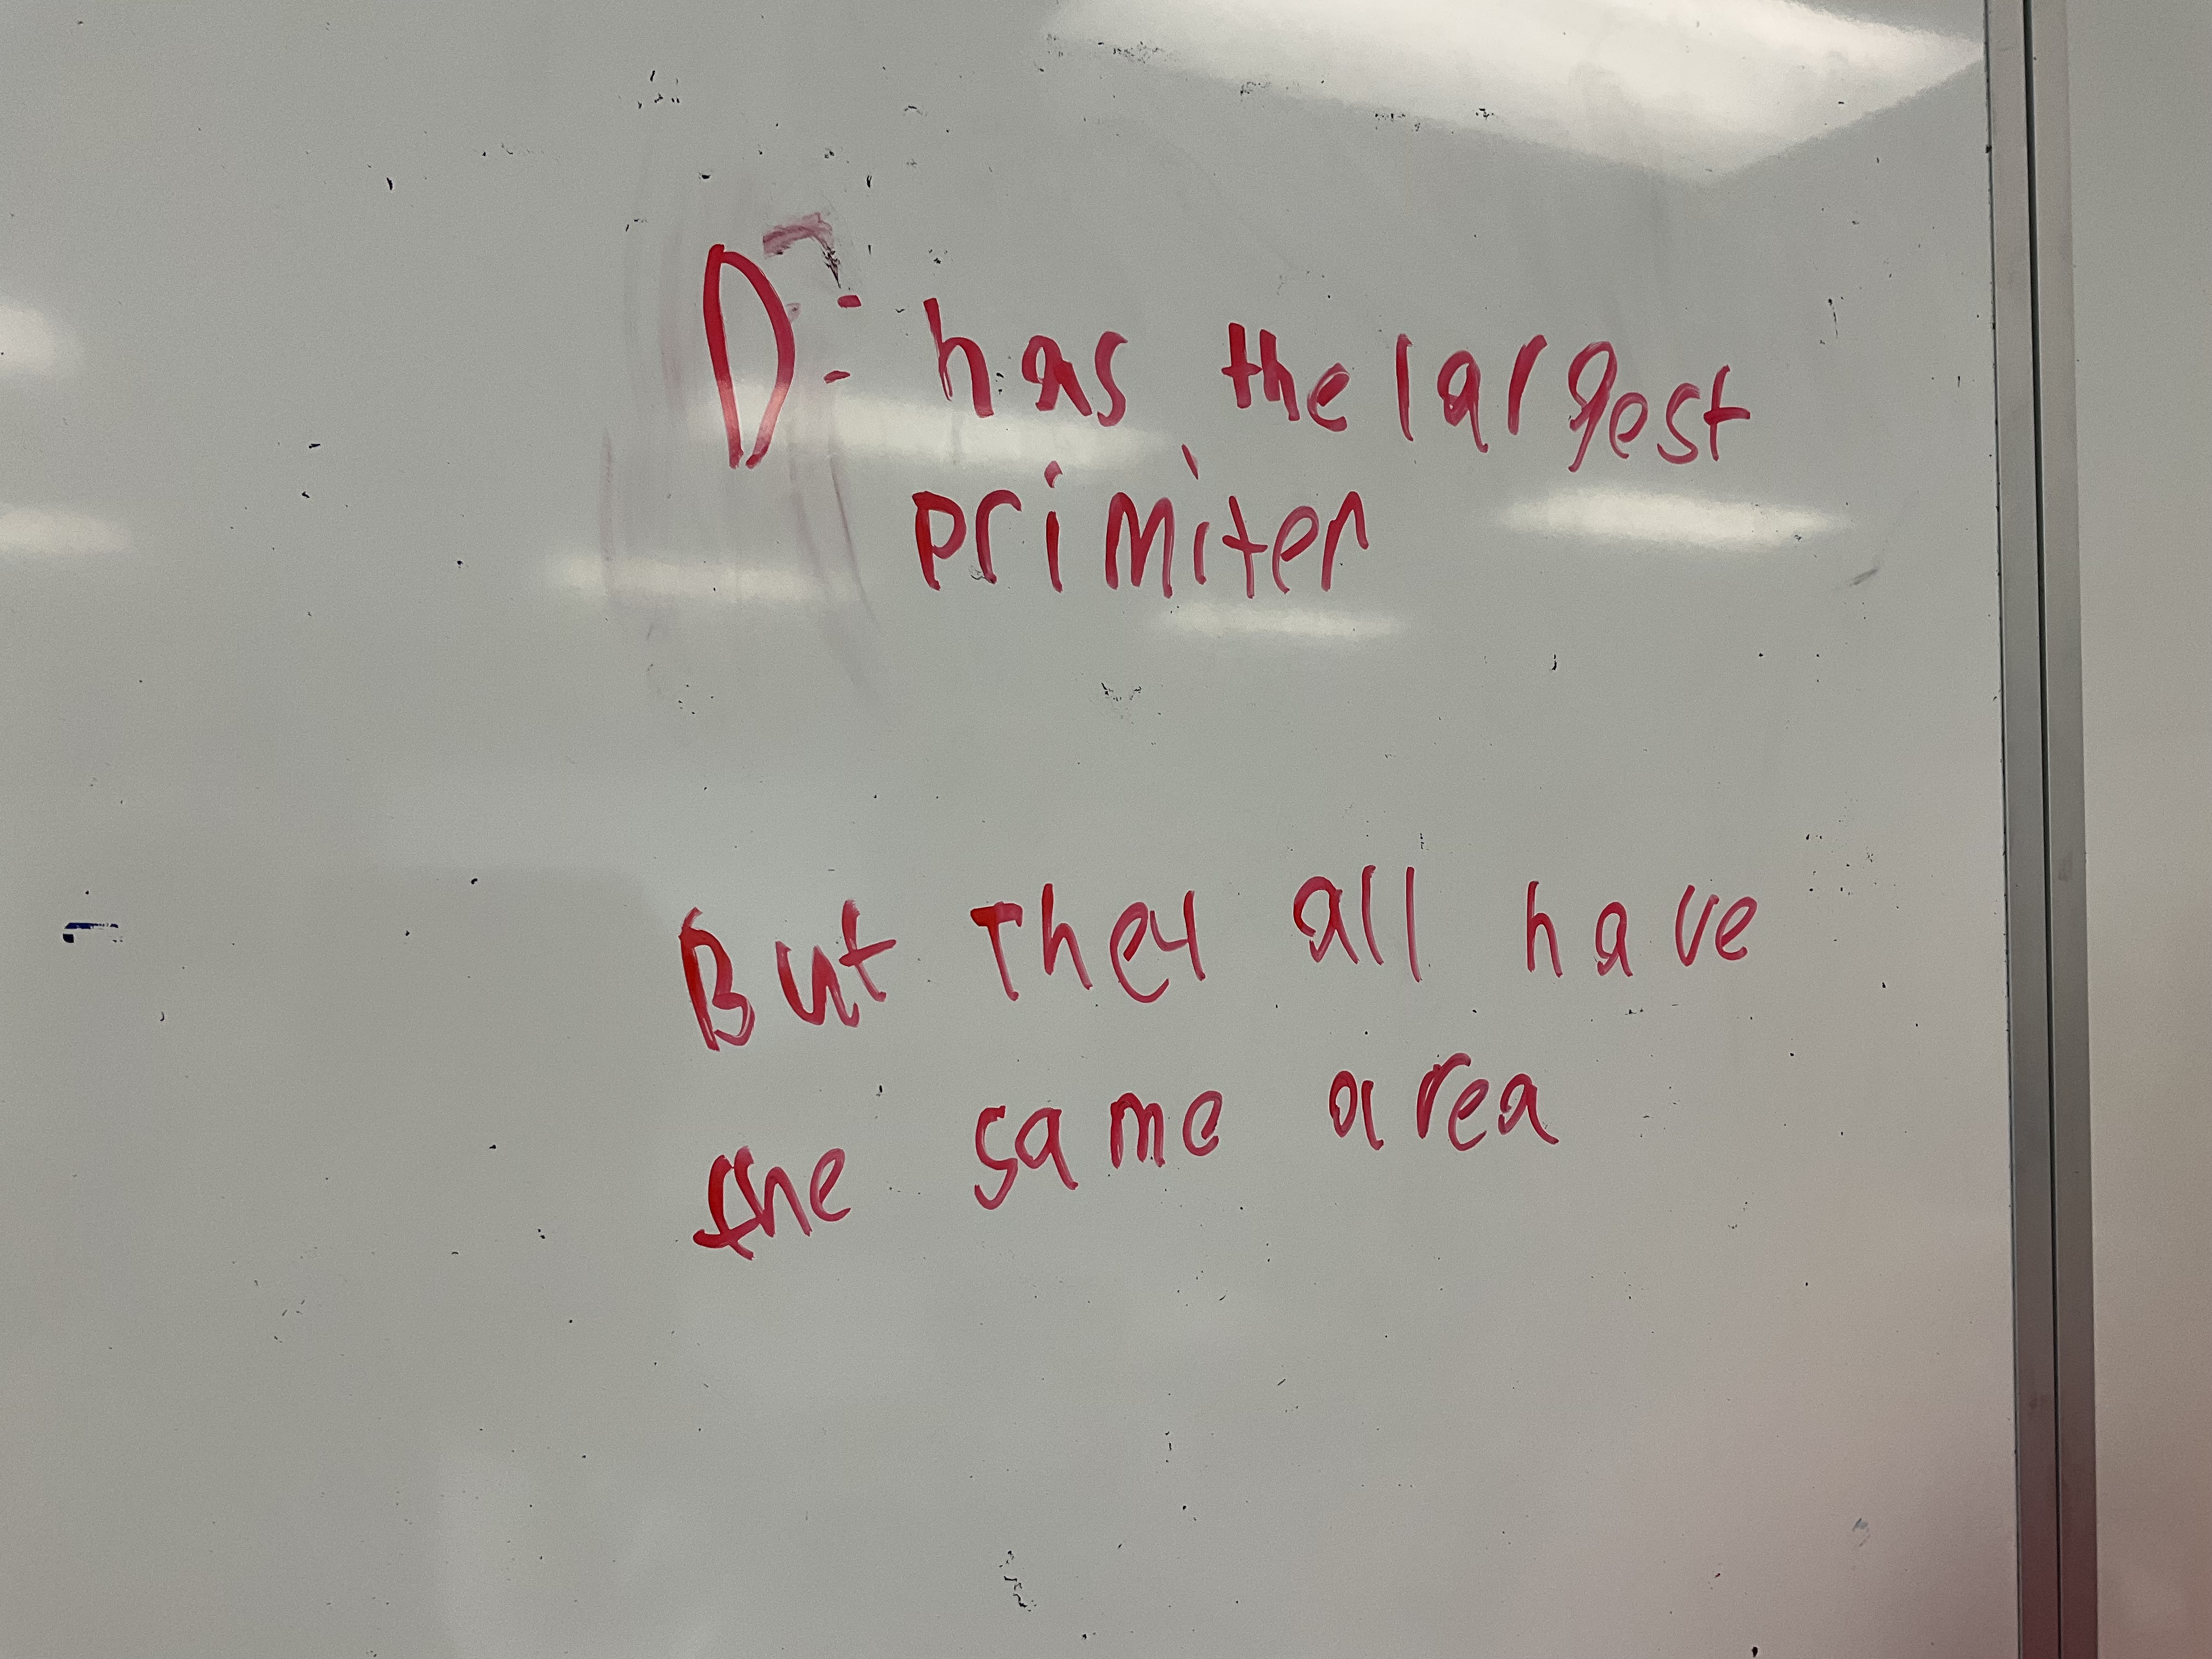
A grade 9 class I was in today was working on perimeter and area. They started by looking at these triangles and working out which one had the largest perimeter and largest area.
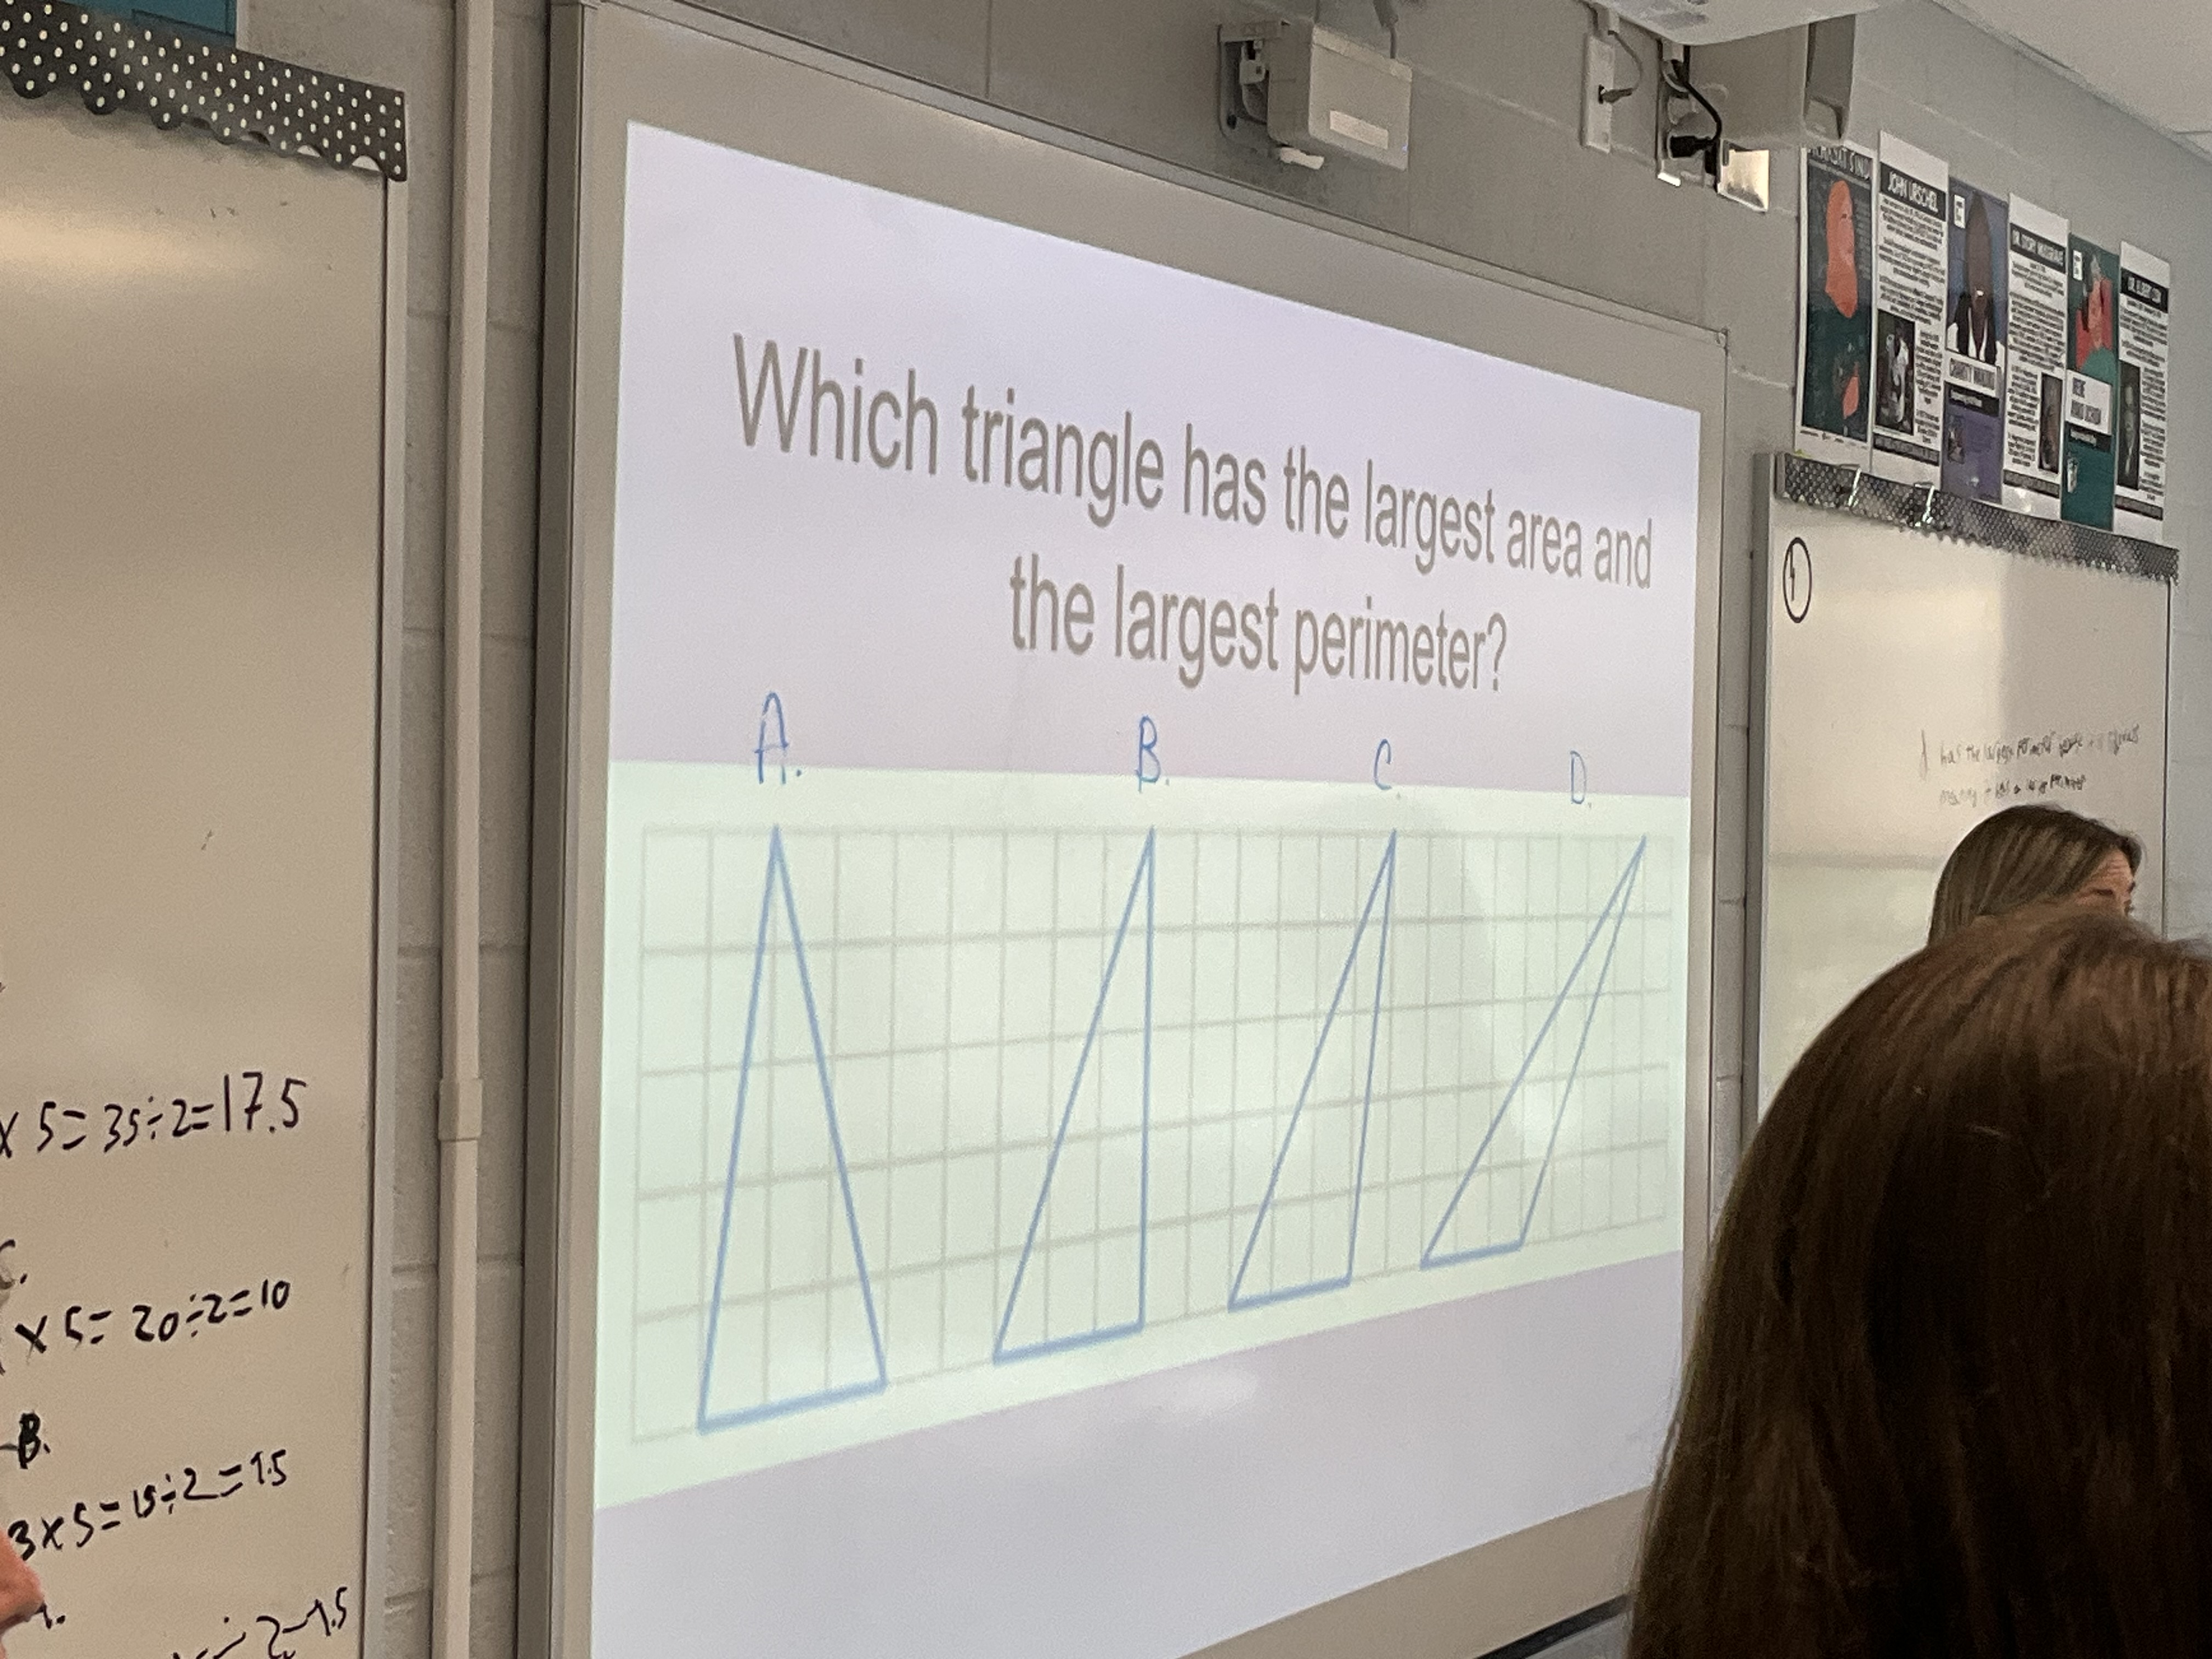
There was some good discussion about how to determine the area and perimeter, and some students used logic, while others measured on the screen using a variety of measuring tools (some conventional, and and some less so).
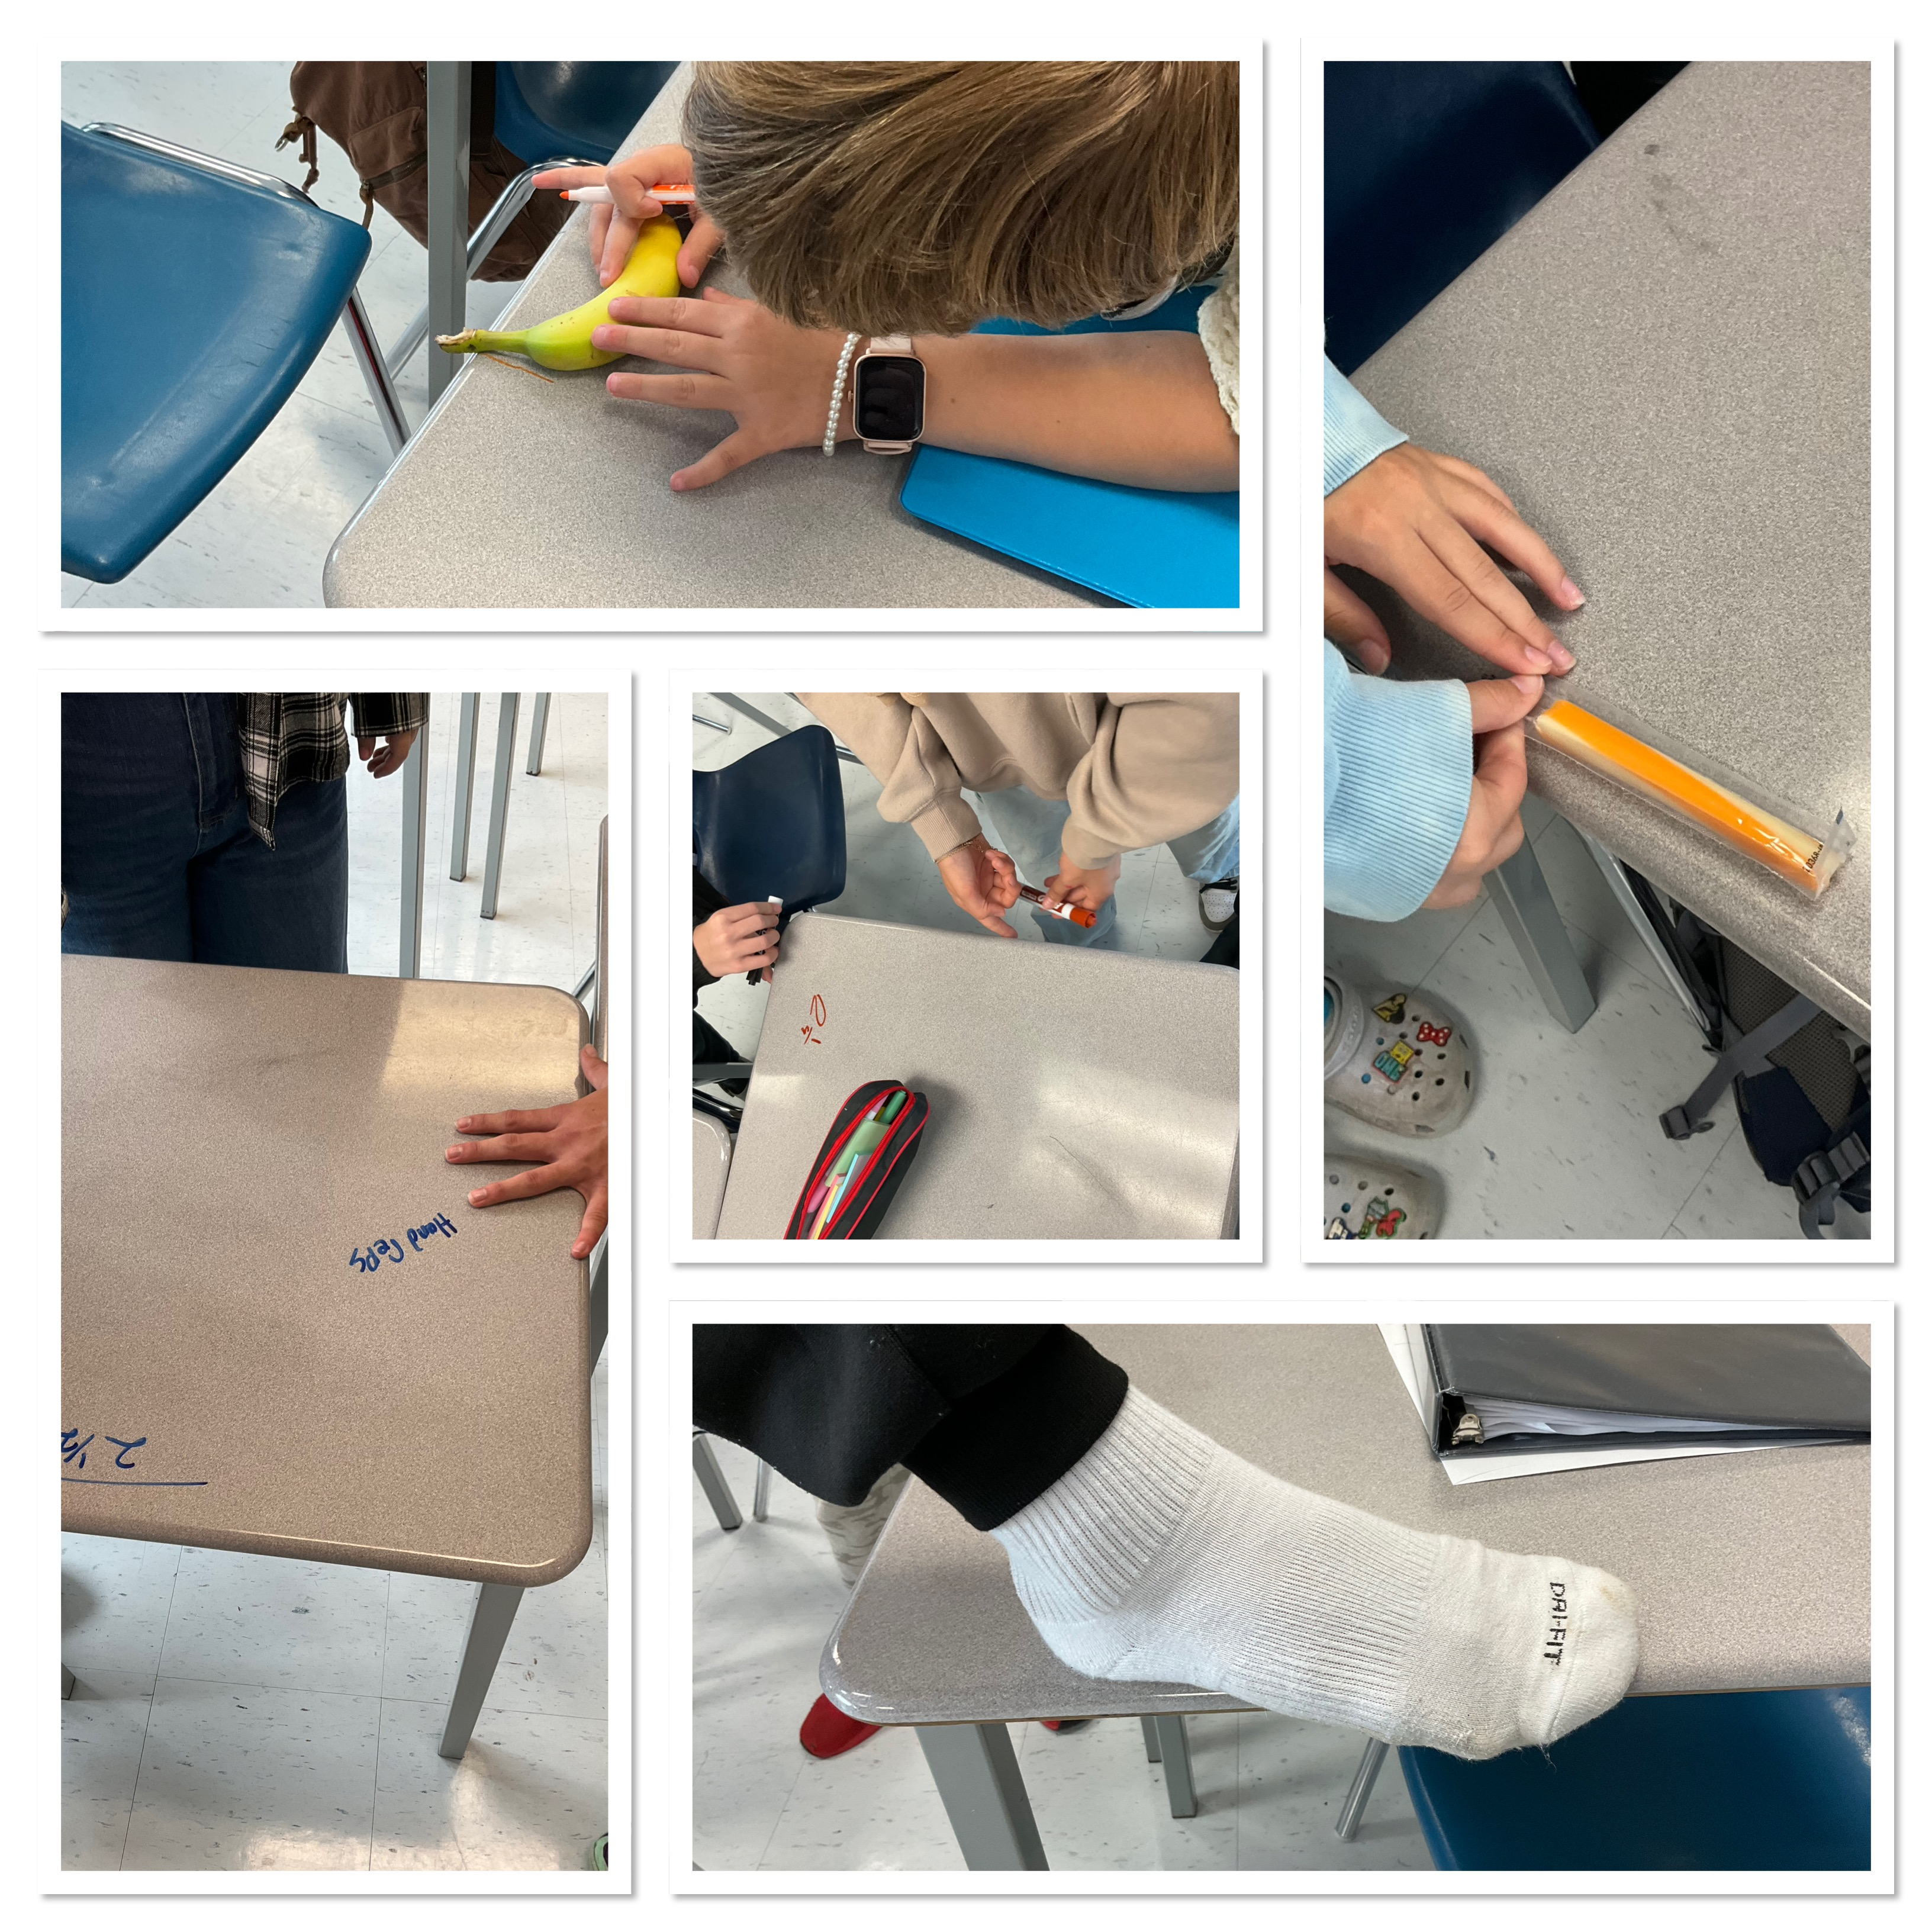
The next part of the lesson was to arrange desks according to the prompt on the screen, and measure the desks using unconventional items, and then to try it again and measure with more conventional tools.
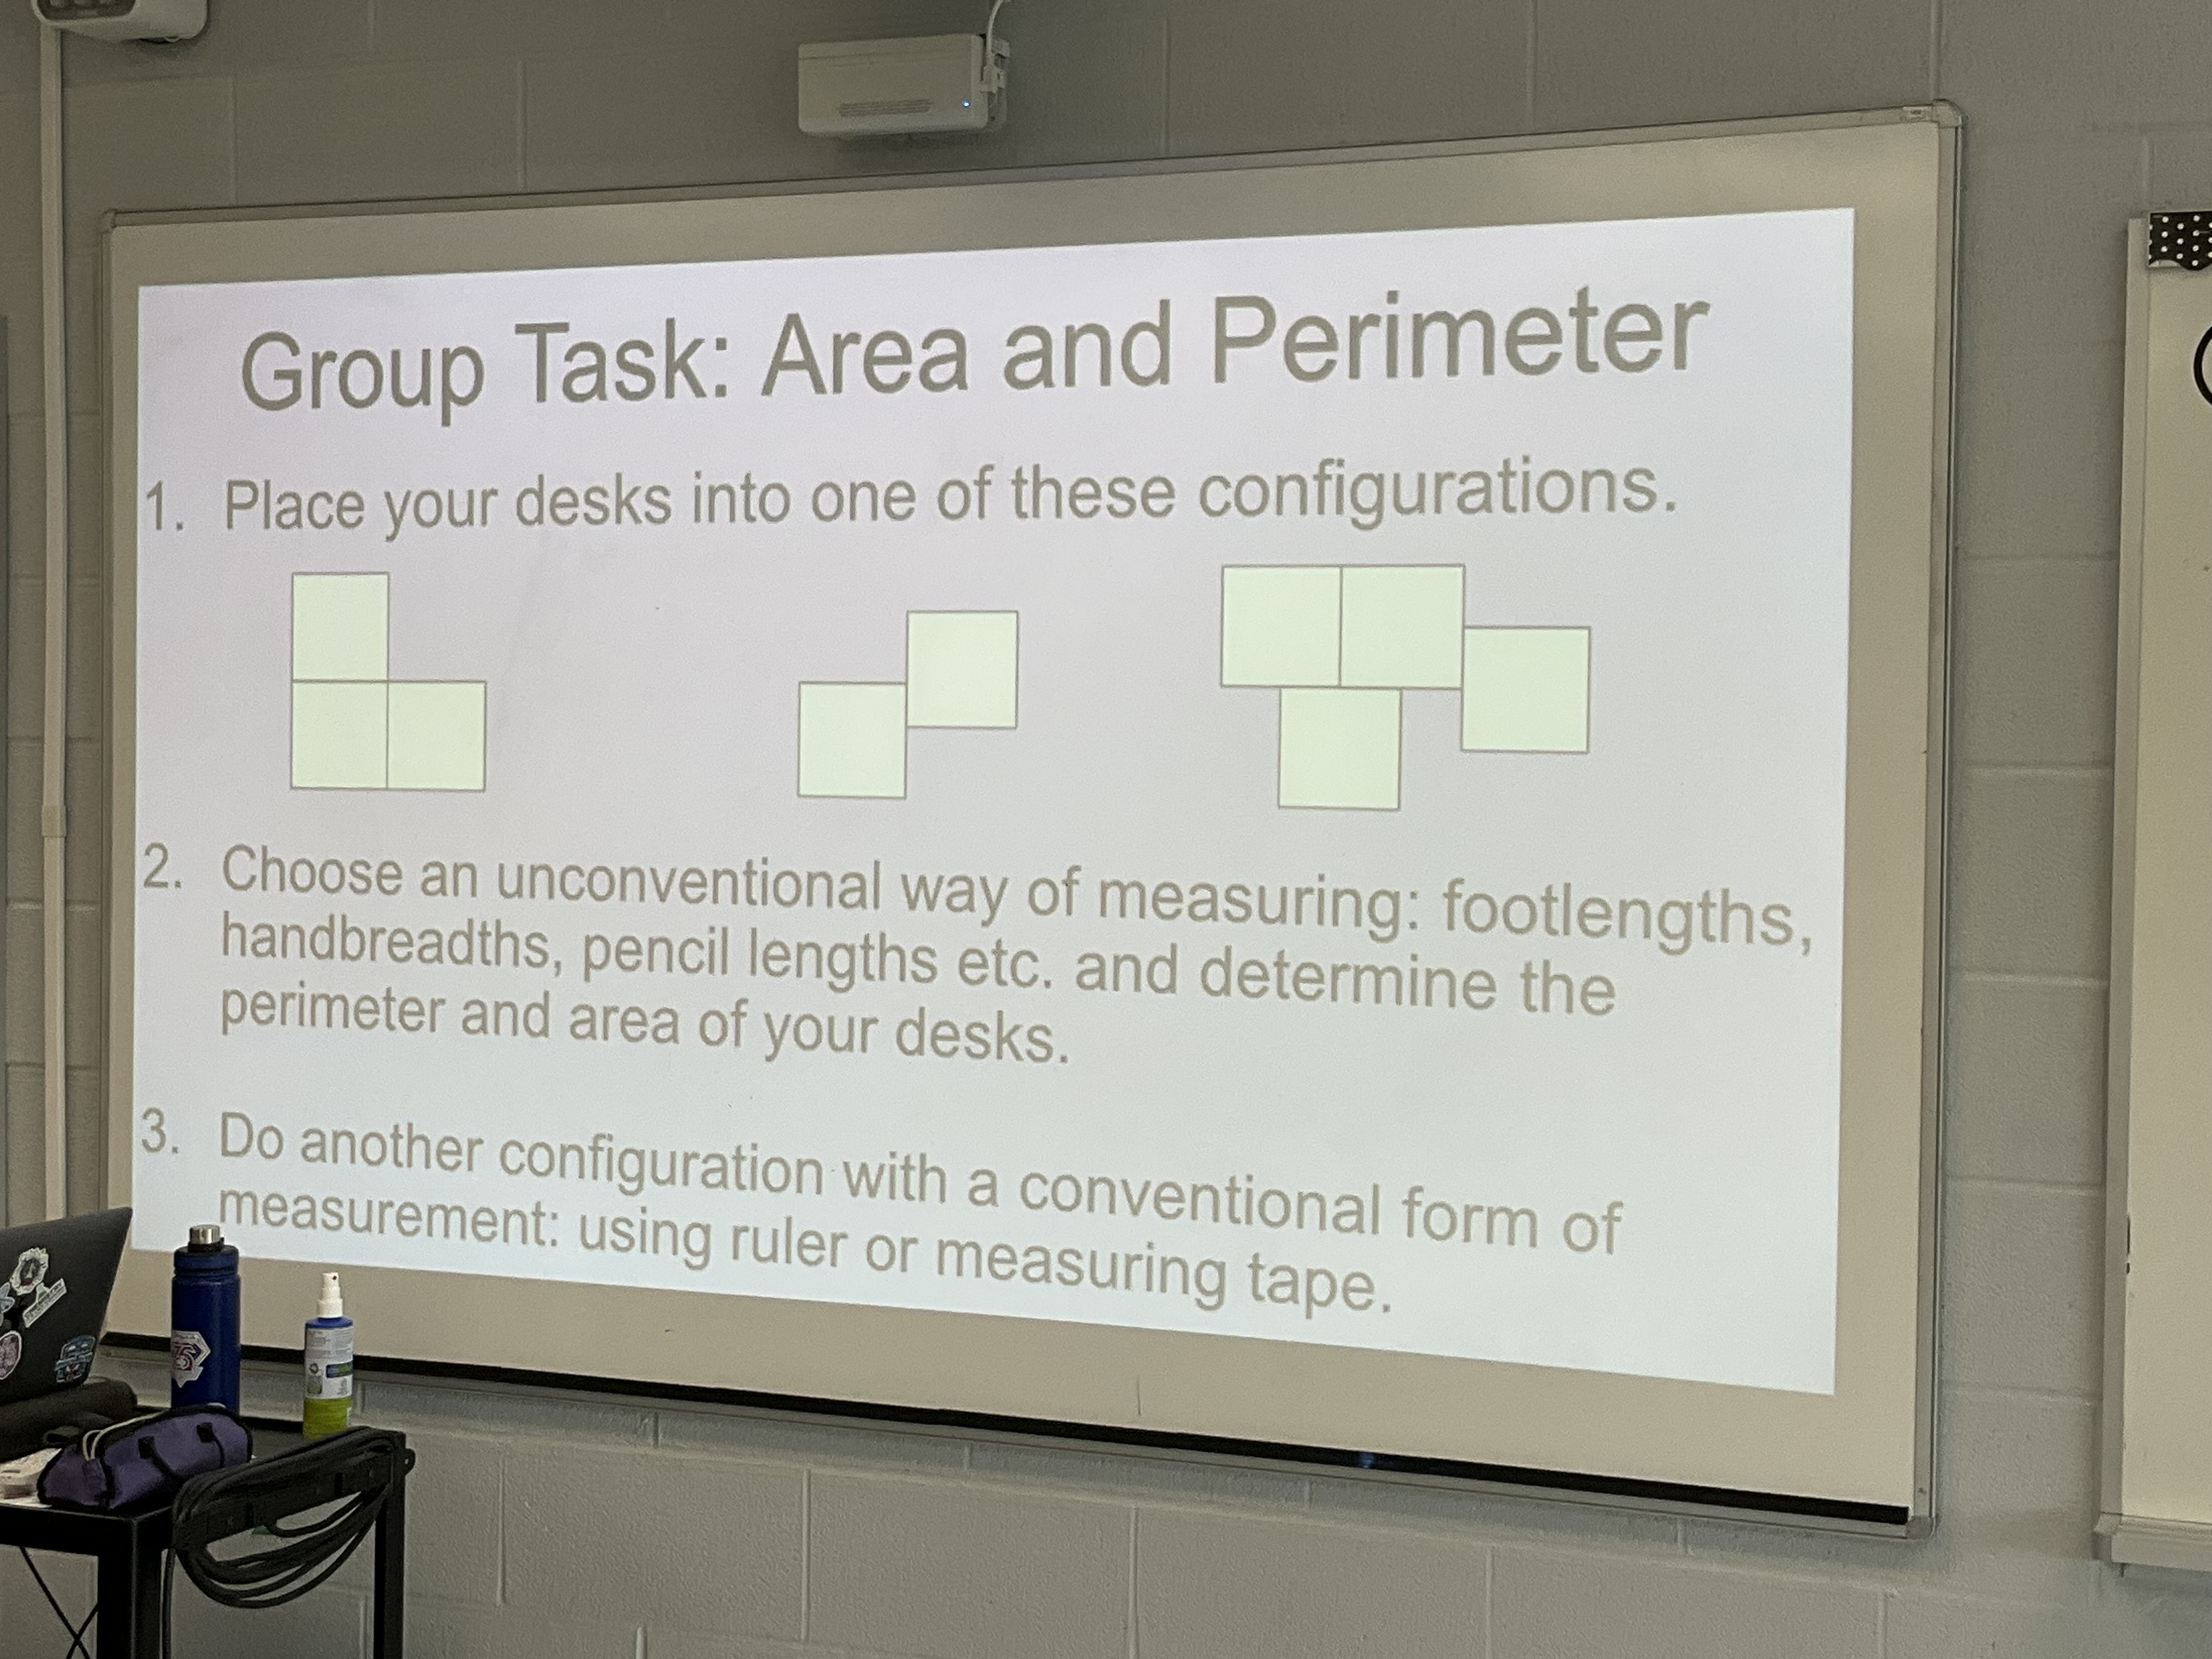
Students got right into measuring! Some used bananas or cheese strings or markers, or hands, or feet to measure.
They wrote their work on the desks as they proceeded. There was a lot of great discussion about which sides contributed to the perimeter—only the outside edges!
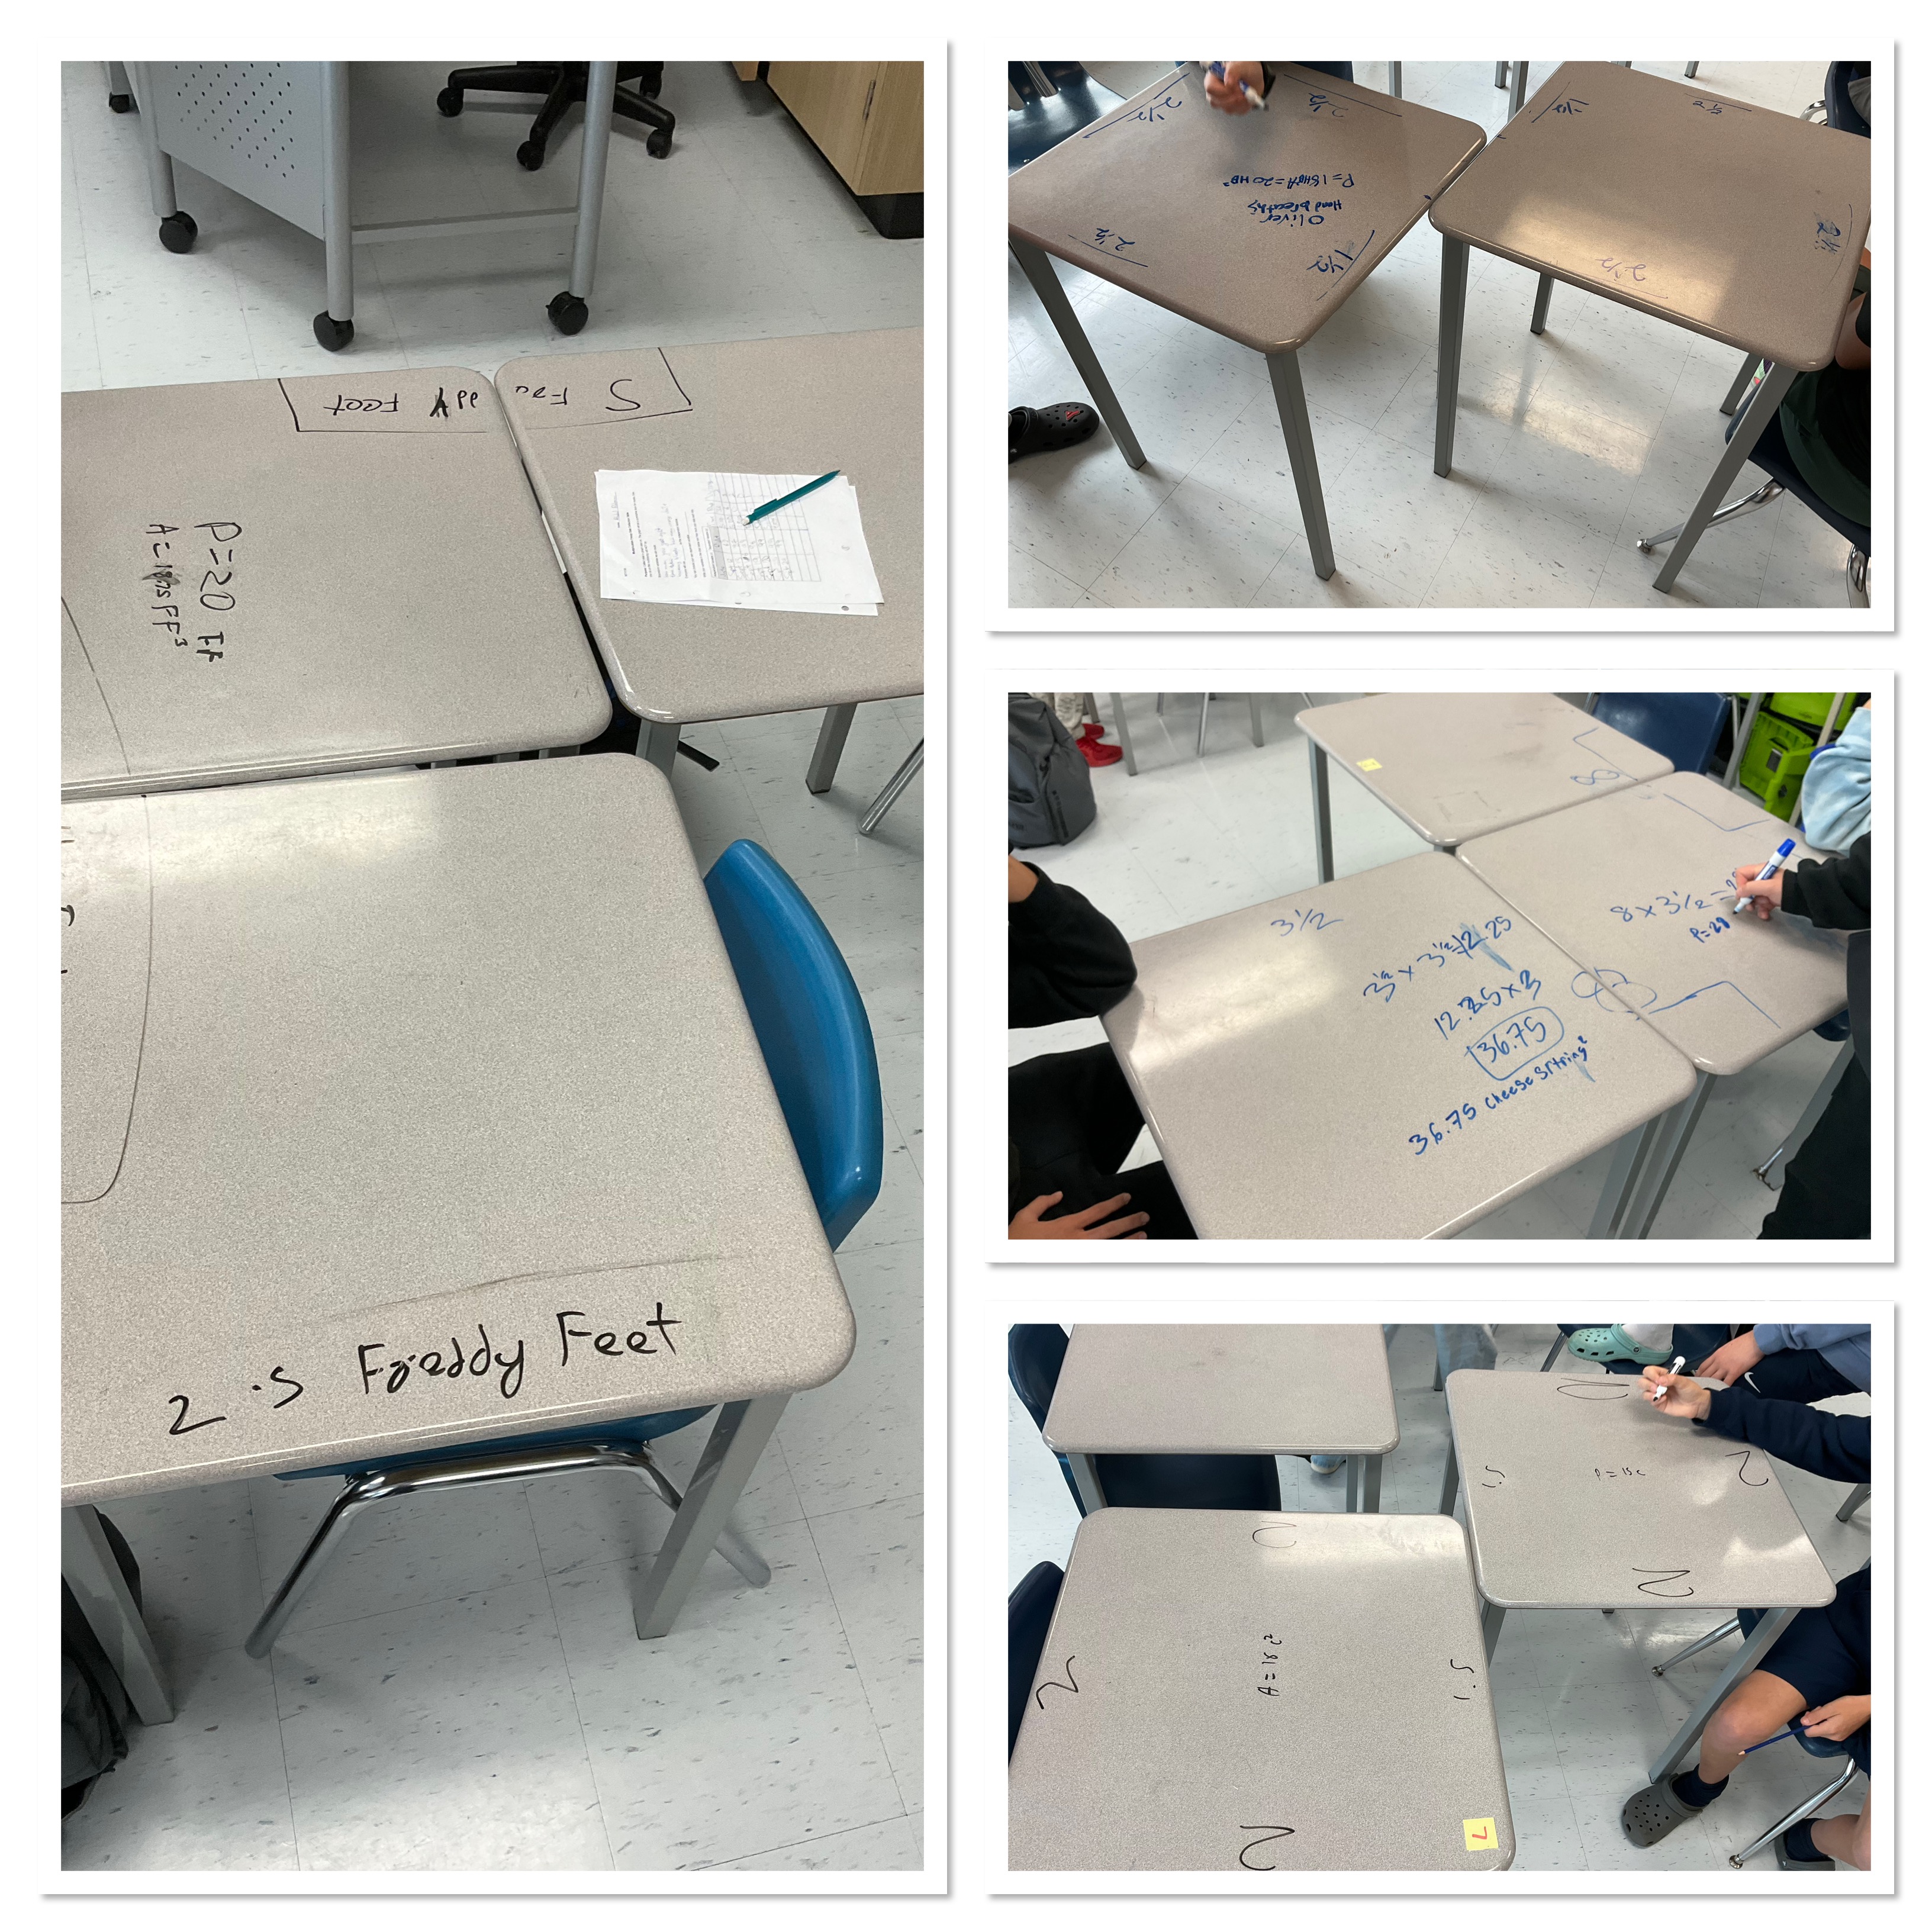
Groups worked on presenting their calculations with units. This was the first time I’ve ever considered what a cheesestring squared would be.
Common Factoring
I’ve been working on a sequence for common factoring, as this has been an area of struggle for my students in the past. This time round, we started at the very beginning, finding the factors of 12, and the factors of 20. We wrote them all out:
12 is (1)(12) or (2)(6) or (3)(4) or (-1)(-12) or (-2)(-6) or (-3)(-4).
20 is (1)(20) or (2)(10) or (4)(5) or (-1)(-20) or (-2)(-10) or (-4)(-5).
We then looked for any common factors, which we identified. Then we looked for the greatest common factor. In this case it is 4.
Next I asked about the greatest common factor between 12 and 3x
Then the greatest common factor between 16x^3 and 12x
Then we looked at 45(x^2)(y^4) and 225(x^5)(y^3). Students noticed that the lowest power on each variable will be in the greatest common factor.
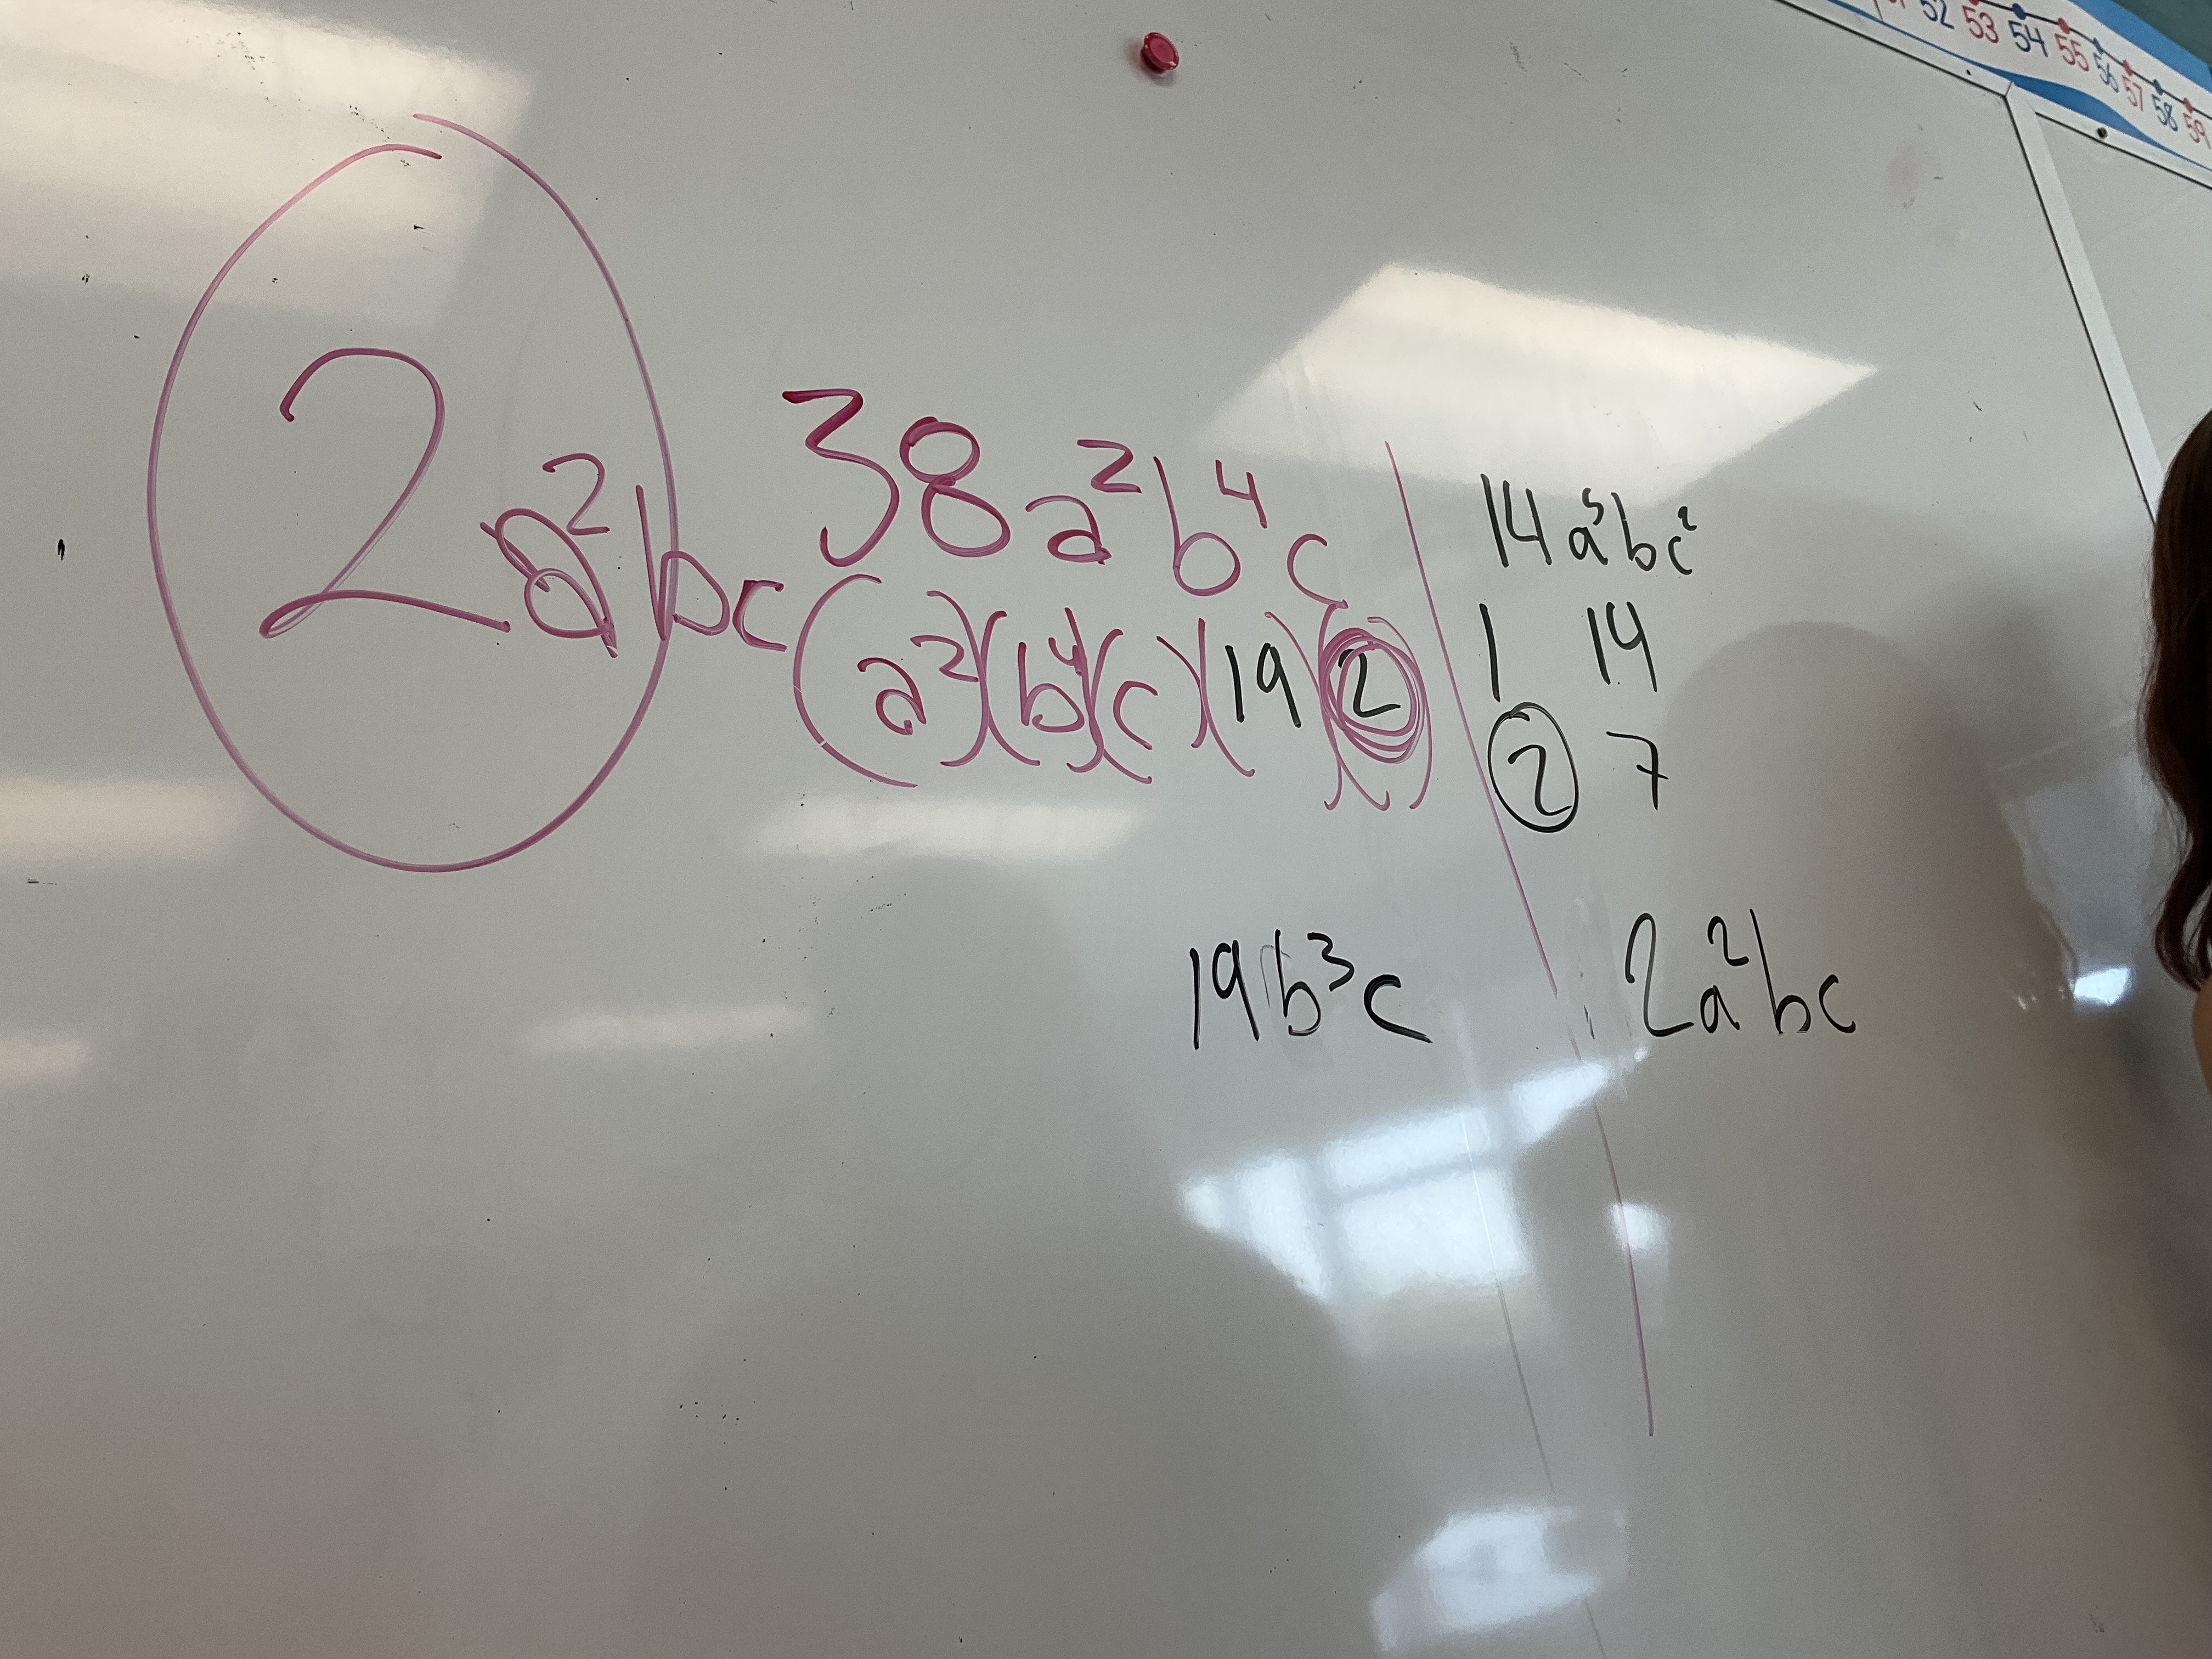
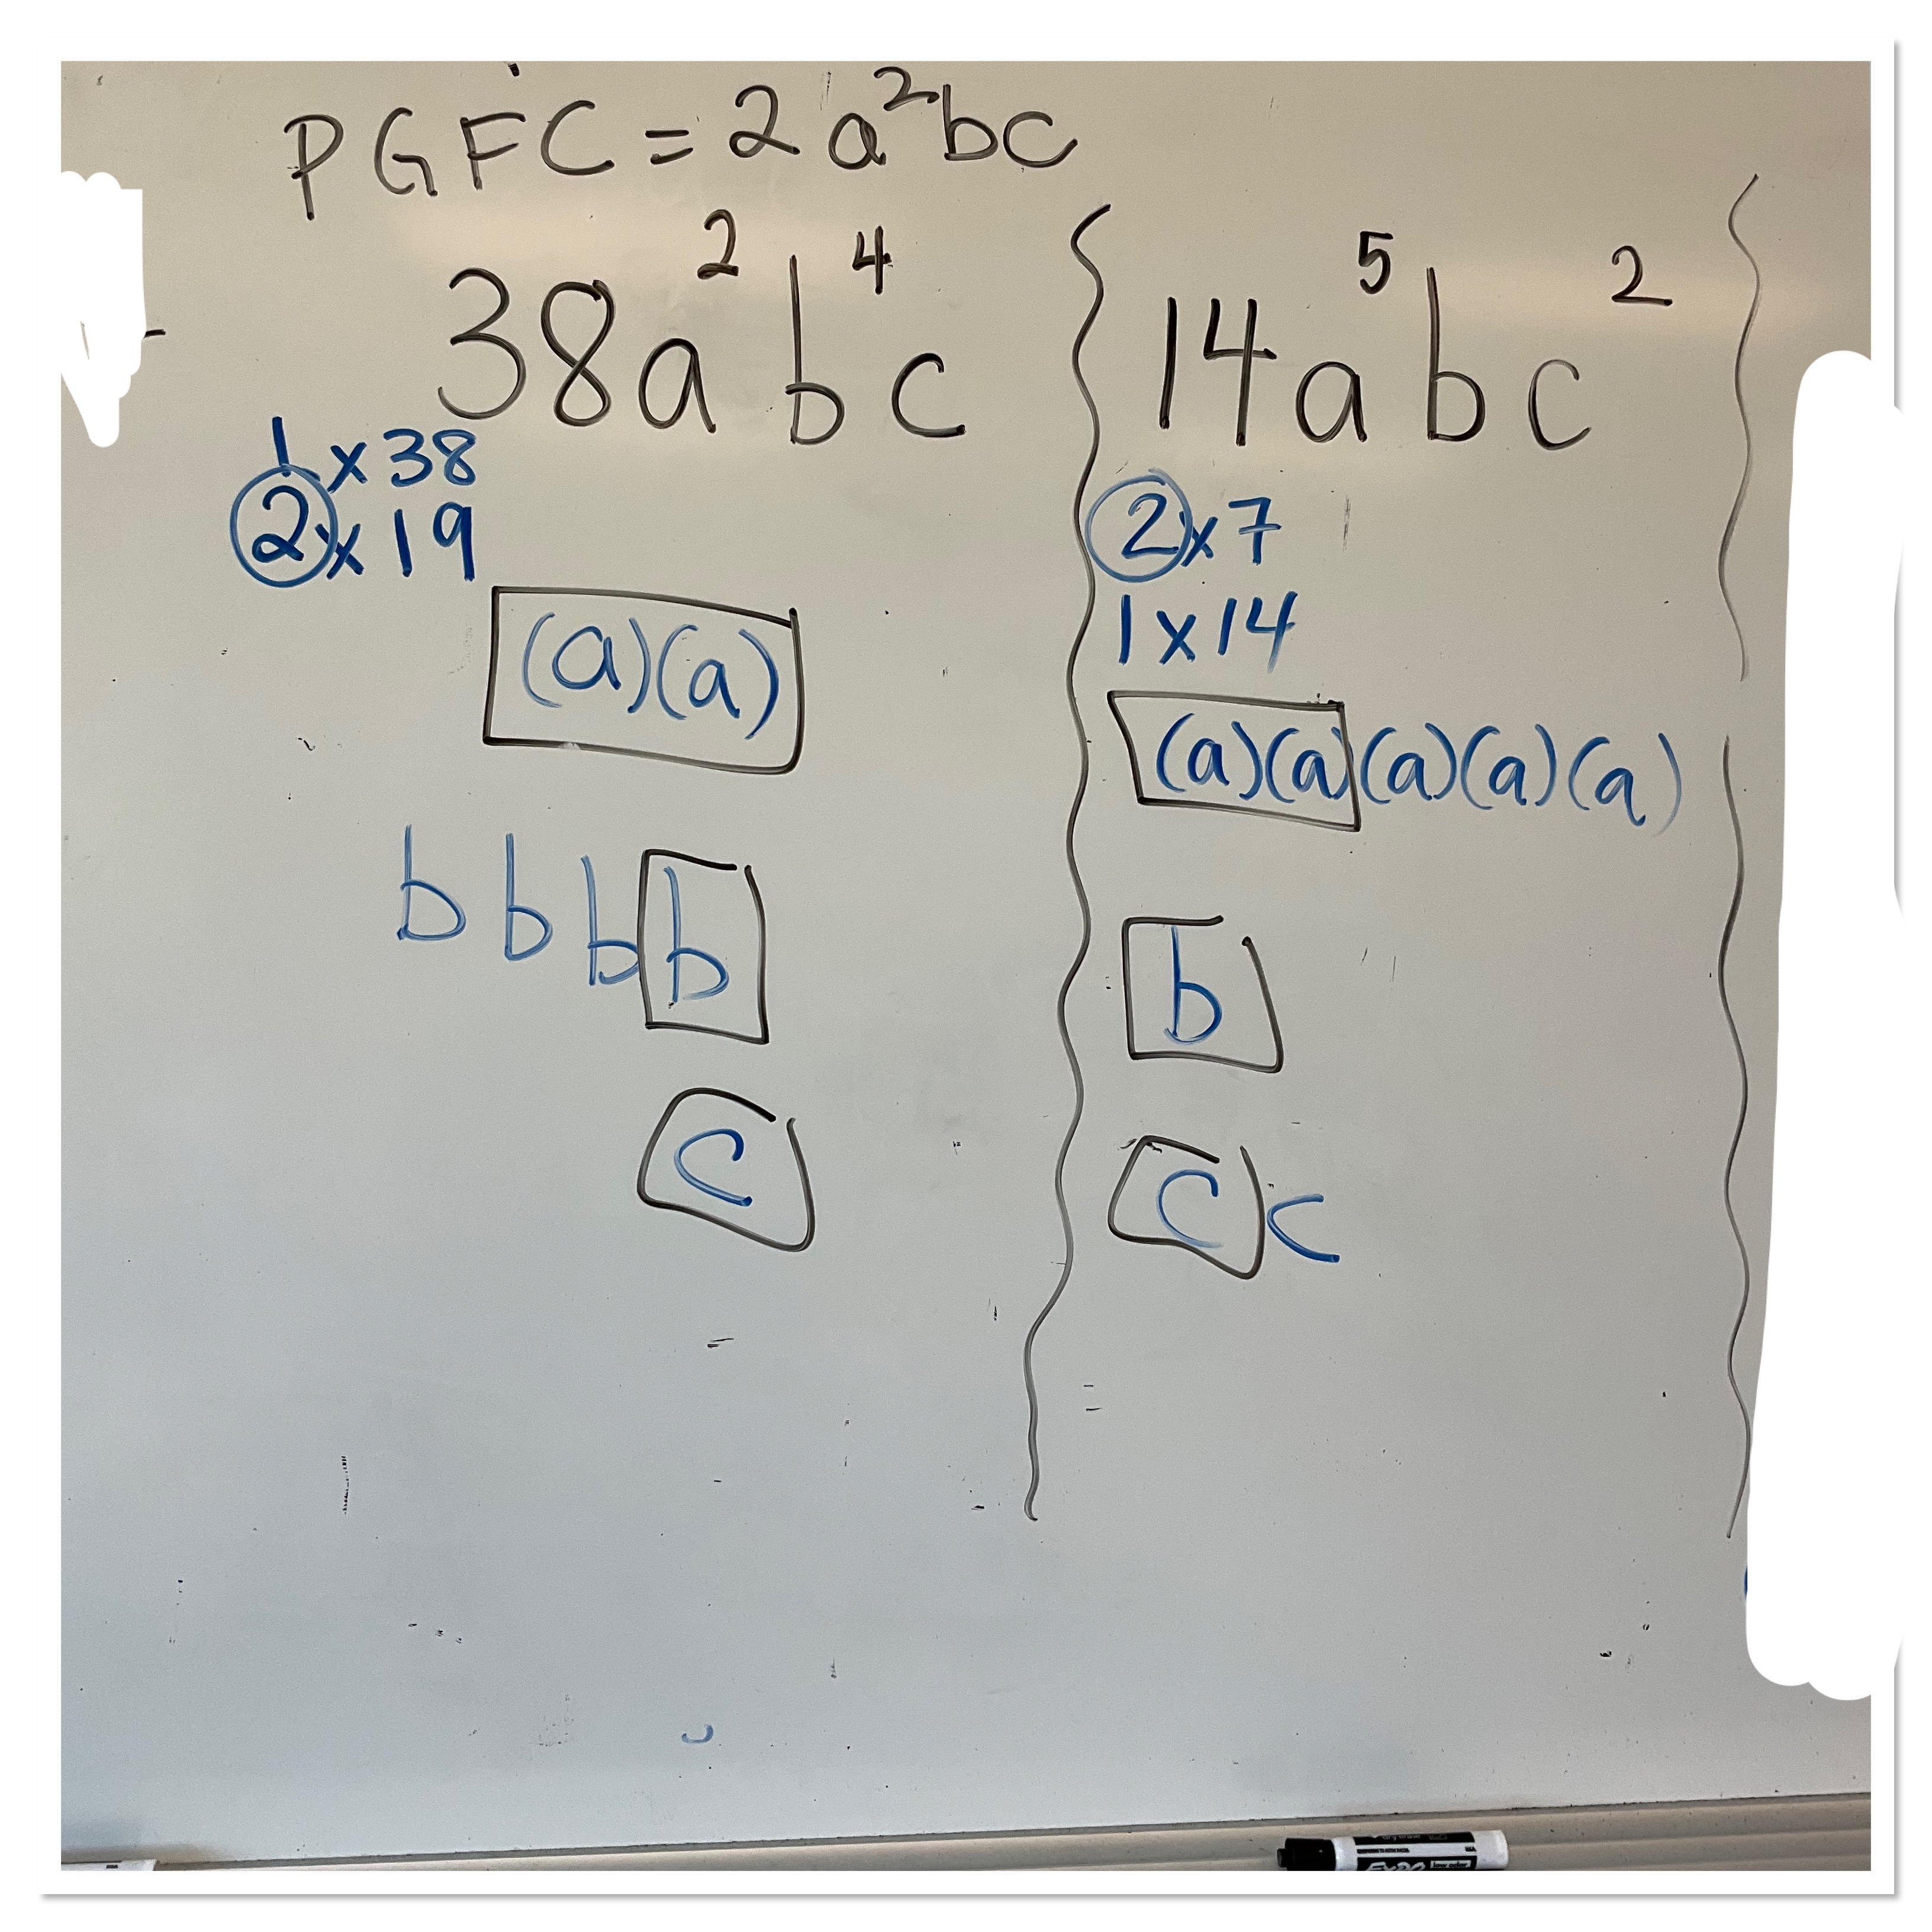
Next we looked at 38(a^2)(b^4)(c) and 14(a^5)(b)(c^2). Students were working on how to represent the factors and find the greatest common factor of 2(a^2)(b)(c). They also started to group the “leftovers” together.
We next started to formalize a way to think through the process. We reviewed a bit about exponent laws in the process.
Finally we got to common factoring a polynomial. We find the greatest common factor, and put that outside of the brackets, and we end up creating a distributive property question with the “leftovers” (the not common factors) remaining in the brackets.

we can check our work with distributive property and exponent laws.
Students were keen to keep practicing. They asked for more and more chances to show that they got it. I’m pleased with how well the sequence went today, and am hopeful that retention will be strong. We’ll see next week!
Snapshots of Math from Today
Today I was in a few classes, and captured some learning and fun to share. In 2P the class was starting their work with visual patterning and linear and quadratic relationships. This is something that they have seen in grade 9, but sometimes forget bits and pieces, so it’s a great refresher before doing more work with linear systems or quadratic models.

using patterns from visualpatterns.org we ask students to draw figure 4 in the pattern, and then to extend it back to draw figure 0. We look for how the figures are changing, and if it’s changing by the same amount each time. We make a table of values, where we count objects, and look for patterns in the table (first and second difference leap out here), and then we add the points to a graph, where we again can see the rate and the y intercept (which is always the same as figure 0). The next step is to push past thinking additively, and just (in this case) adding 2 and then another 2 and then another 2. The best way that I have found to do this is to ask about what figure 10 would be like. How many times would we have added 2? To get to figure 10 we’d have added 2 10 times, and since we started with 1, we’d have to add the 1. We could then jump to figure 100, and determine that there’d be 201 stars there, since we had to add 2 100 times (which is 2×100) then add 1.

Students came up to help consolidate the work at the main board after working through a few different patterns. It was exciting to hear the words that they remembered from grade 9, and how the skills have stayed with them over the summer. Prior knowledge is now activated, and they’re ready to work with some quadratic patterns!
In MTH1W we’re working on our multiplication data collection, and strategies. We’re going to make scatterplots or our data once we’ve done this for 10 days.

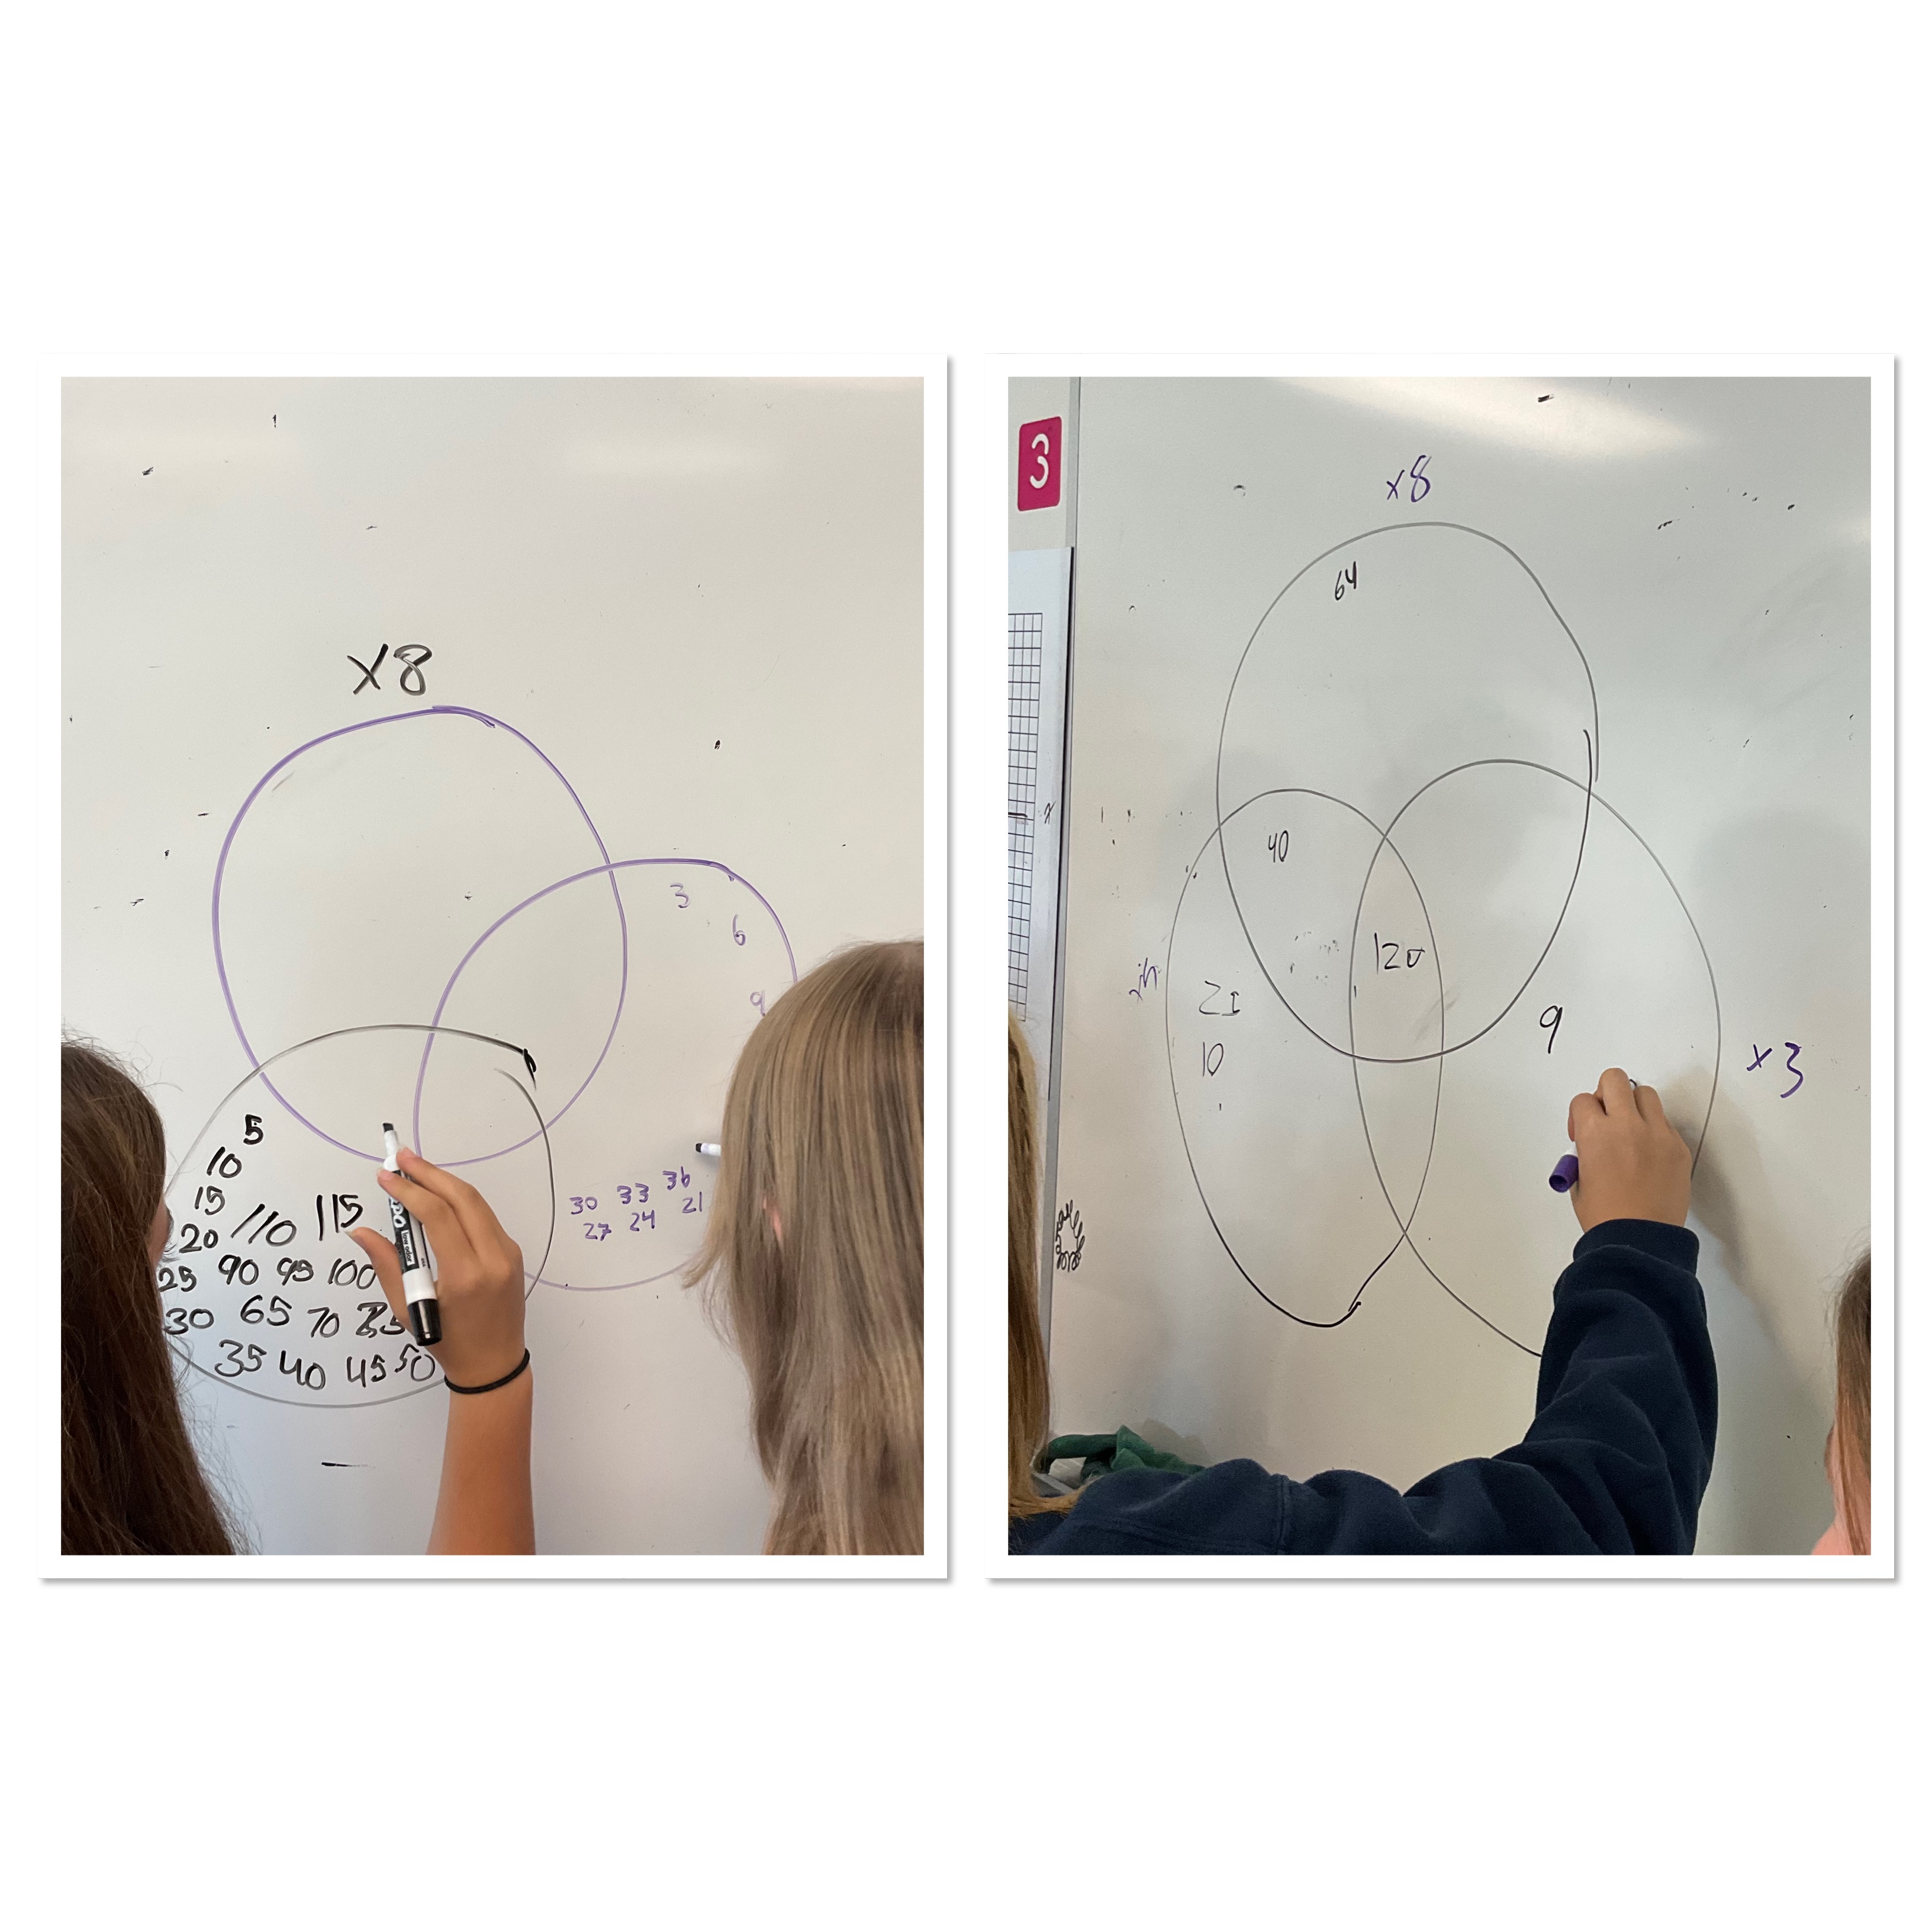
we missed our “vennsday” task yesterday because we were outside for grade 9 play day, so we did another belated vennsday activity.

we had an interesting time filling in the sections, and saw some patterns emerge. In the circle that had all the multiples of 8 the numbers were all even. In the circle with multiples of 5 the numbers ended in 5 or 0. In the central section all of the numbers ended in 0 since they had to be a multiple of 5 that is even.
After this, while we were at the boards, we explored the perimeter and area of the figures in this pattern.

Students were prompted to continue to figure 4 and 5 if they were done, and then try the perimeter of figure 100, and figure 1000. The goal was to remember what area is, and how to calculate perimeter, but also to start thinking of patterning, and relationships while we’re at it. To quote the students they said that they were “cooking”.
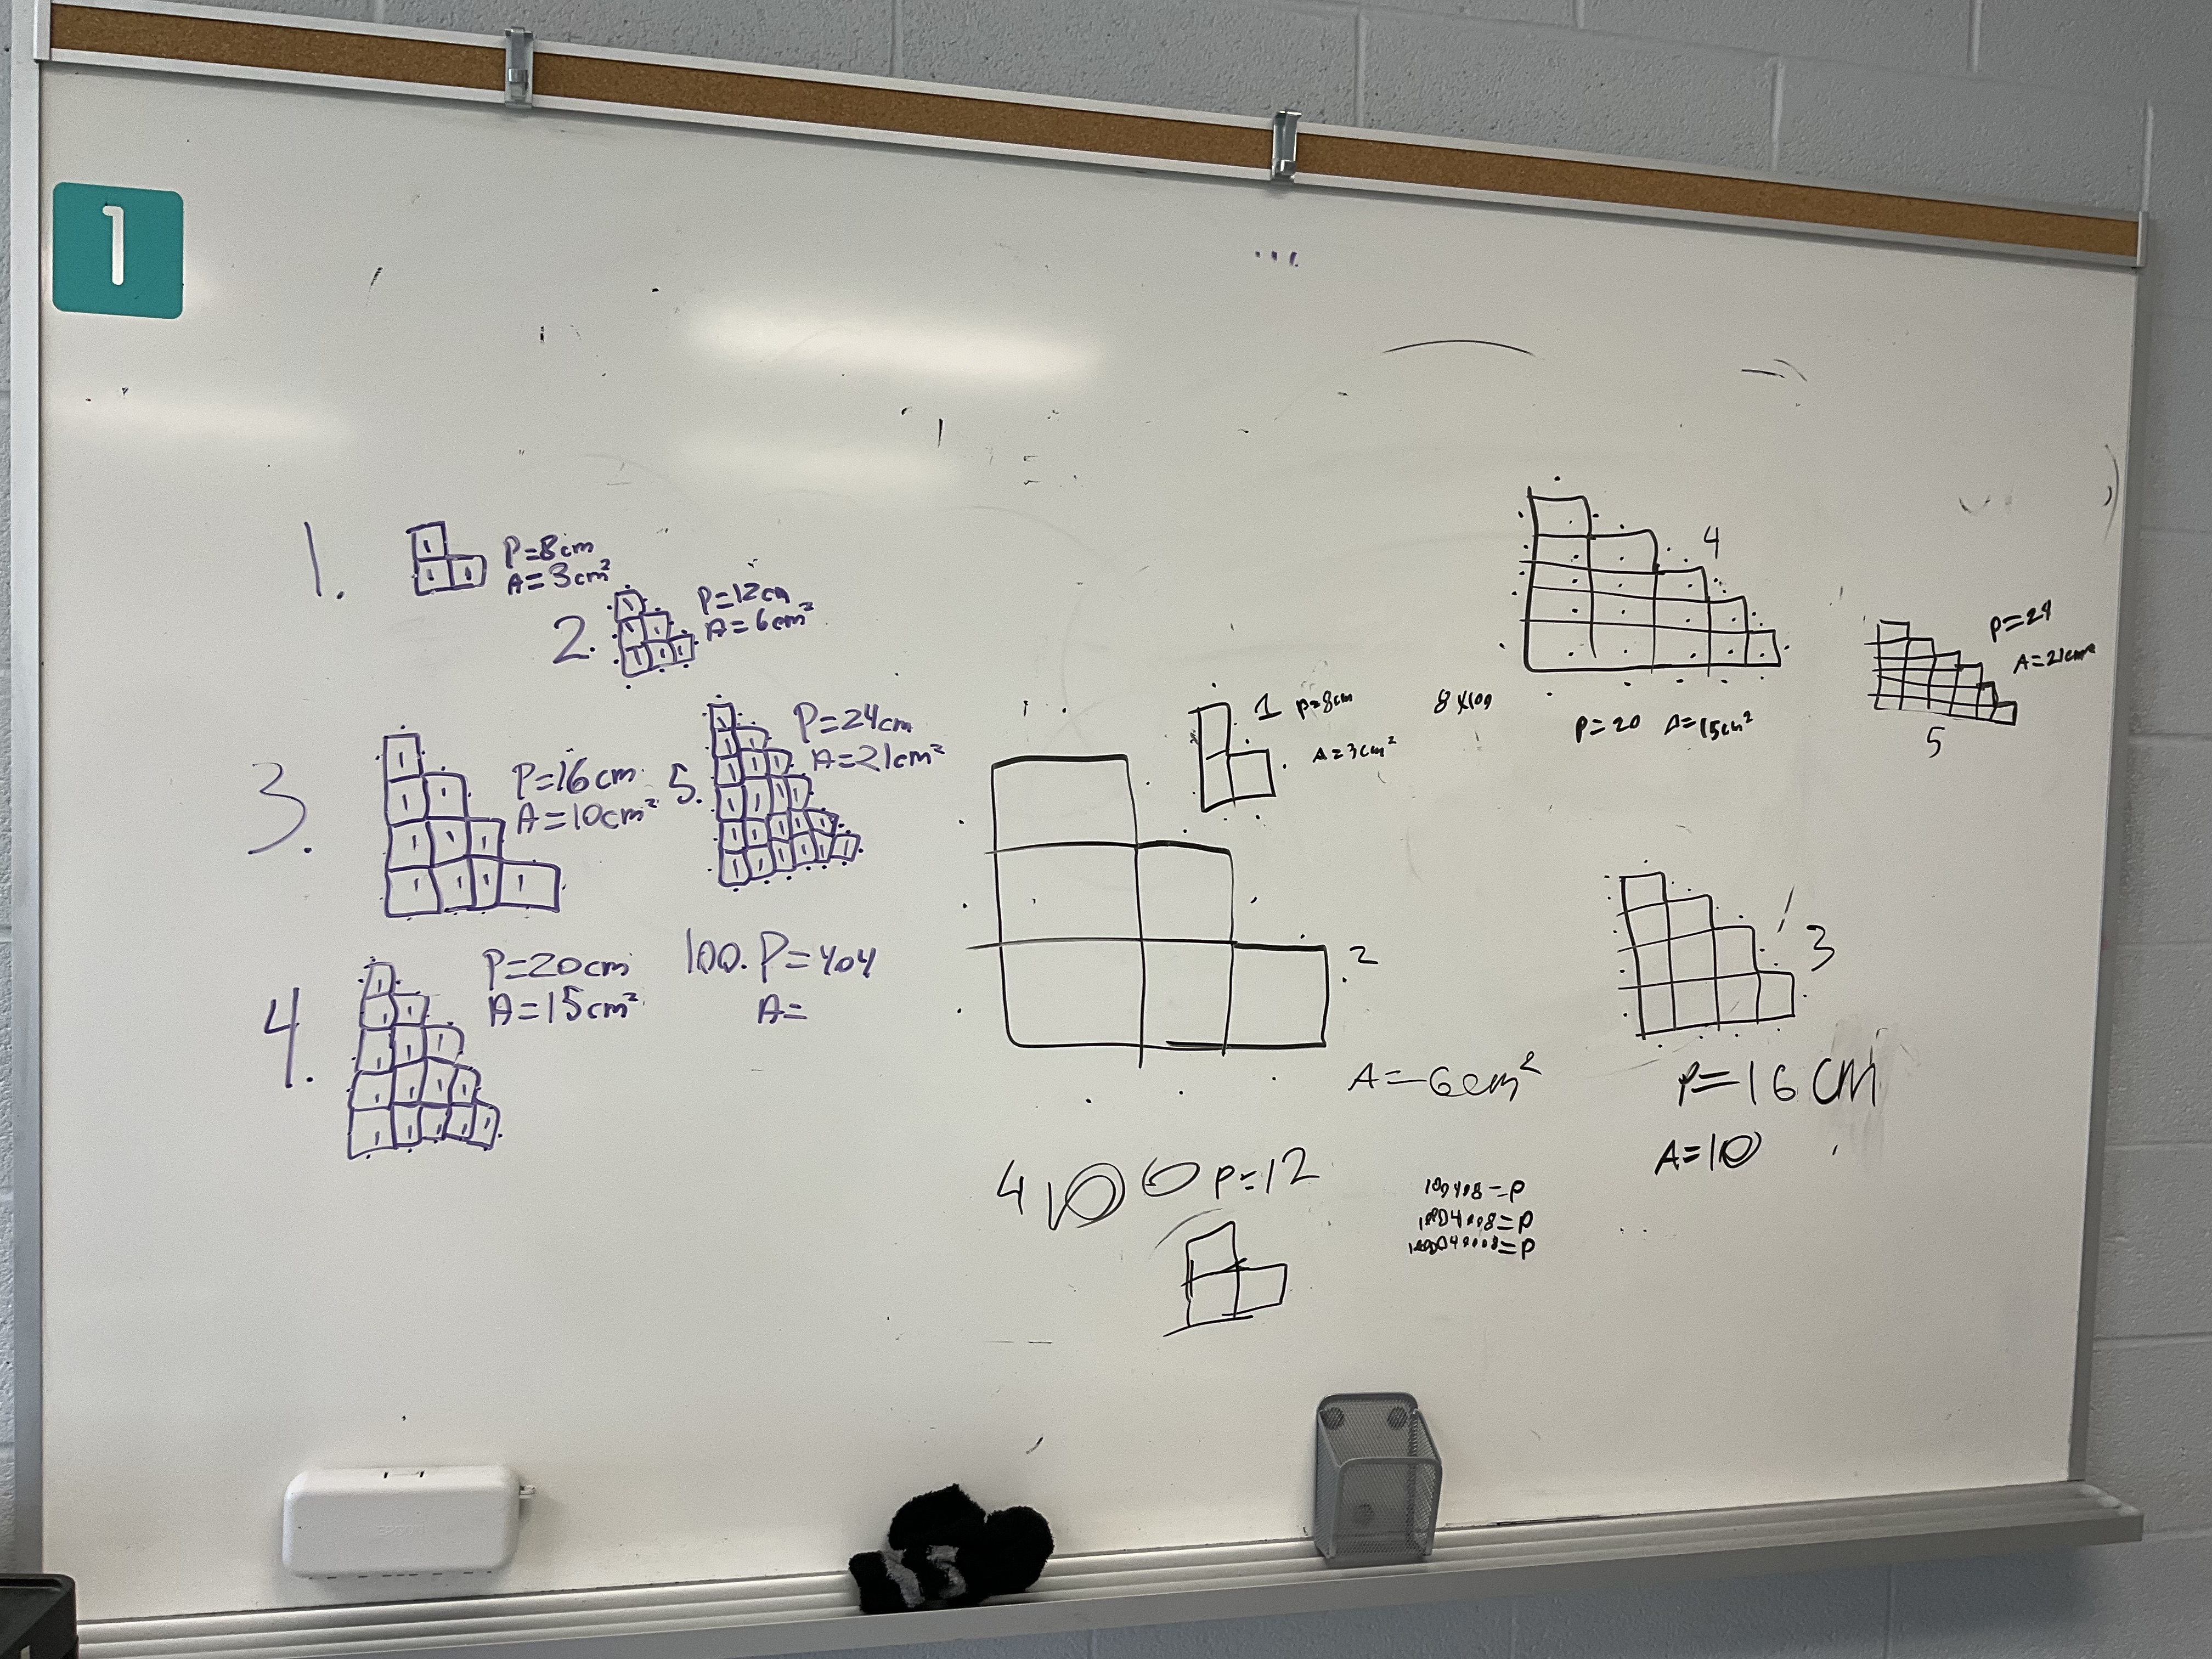
Connections were made between the perimeter always being 4 times the bottom side length, and then that the bottom side length is always one more than the figure number, so using those pieces of information students could calculate the perimeter of any figure number I gave them. It’s great to see them develop the confidence to work through a new problem, and communicate their thinking, and be really excited to discover the patterns.

My 2D class started working on factoring and expanding today using tiles. We spent a lot of time building rectangles with tiles, and determining the dimensions and the areas. Long sides are named x, and short sides are named 1. Long sides touch long sides, and short sides touch short sides. We have to be careful about colours of tiles, remembering that (-)(-)=(+) and (+)(-)=(-).
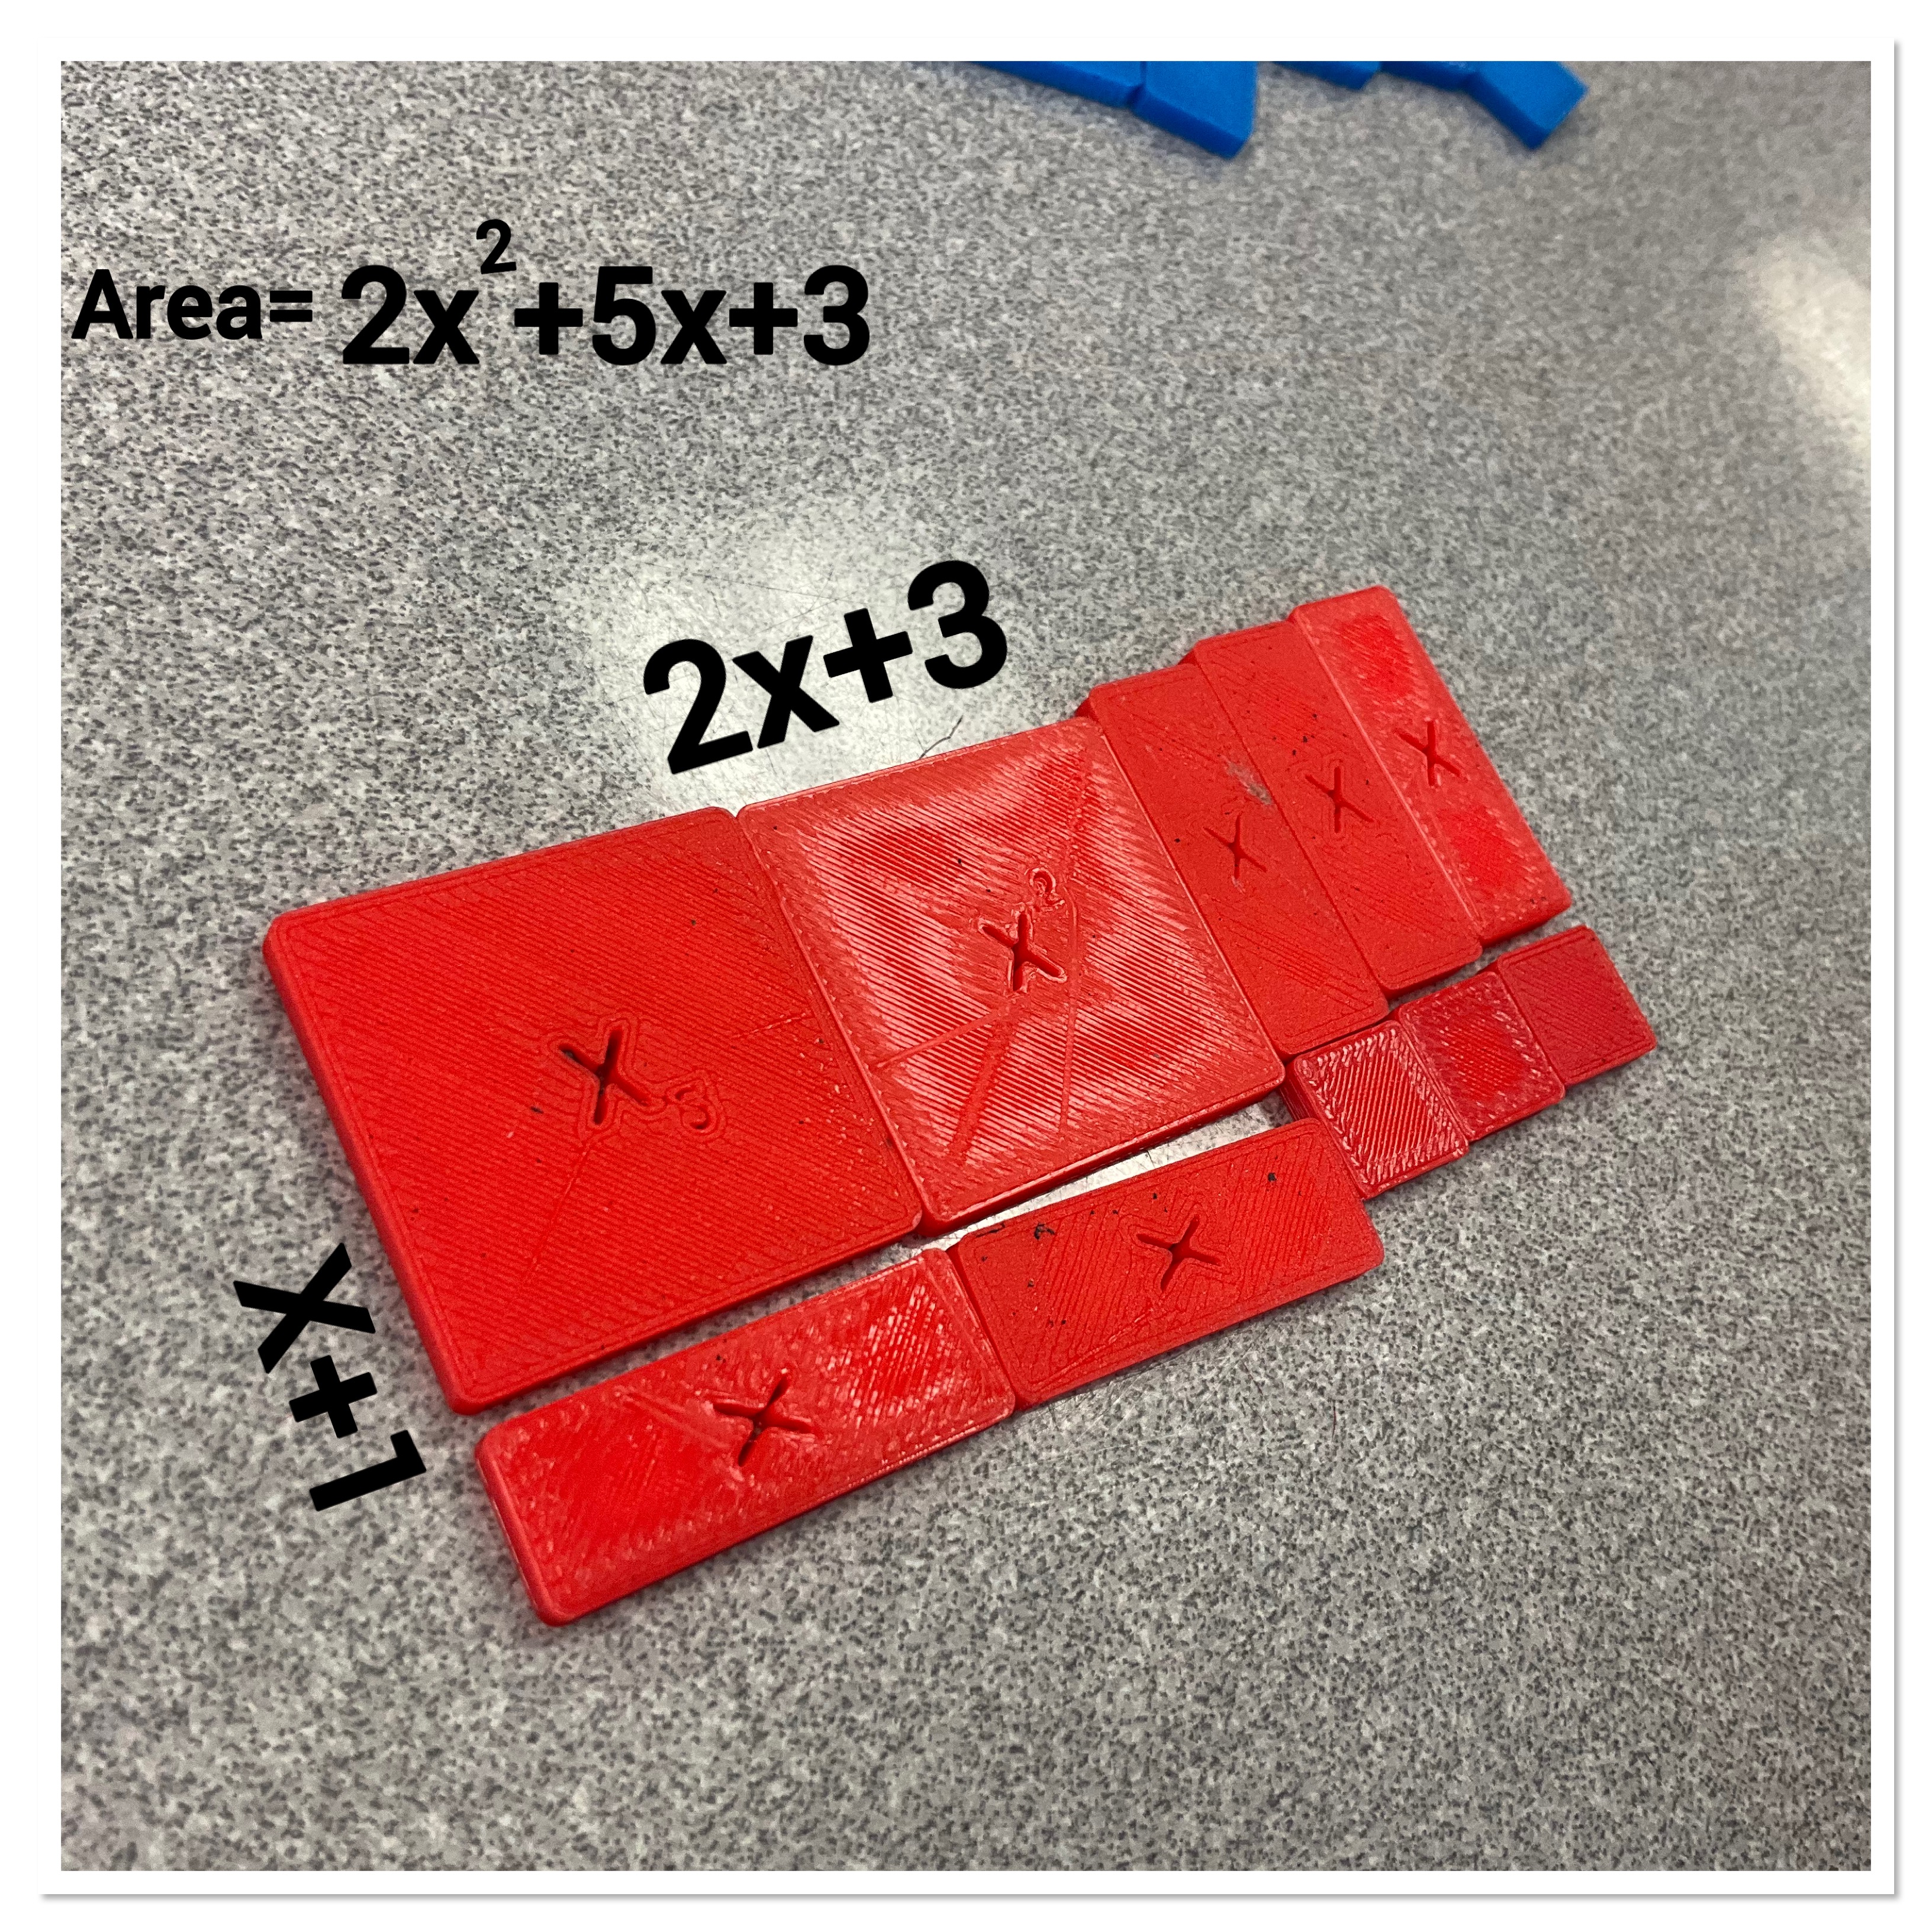

Sometimes the questions gave the picture of the rectangle, and we had to determine dimensions and area. Other times we were given the area and we had to build the rectangle and determine the dimensions, and other times we were given the dimensions and we had to build the rectangle and determine the area.

There were some tricky cases where we needed to introduce some zero pairs to complete our rectangles. We’re starting to notice some patterns emerging which we will continue to explore tomorrow. It was a busy day with a lot of positive mathematical energy!
Bell Ringer Math Task For Surface Area and Volume
Today in 2P math we did a bell ringer task where students worked in random groups of 4 to calculate the surface area and volume of a variety of 3D solids.
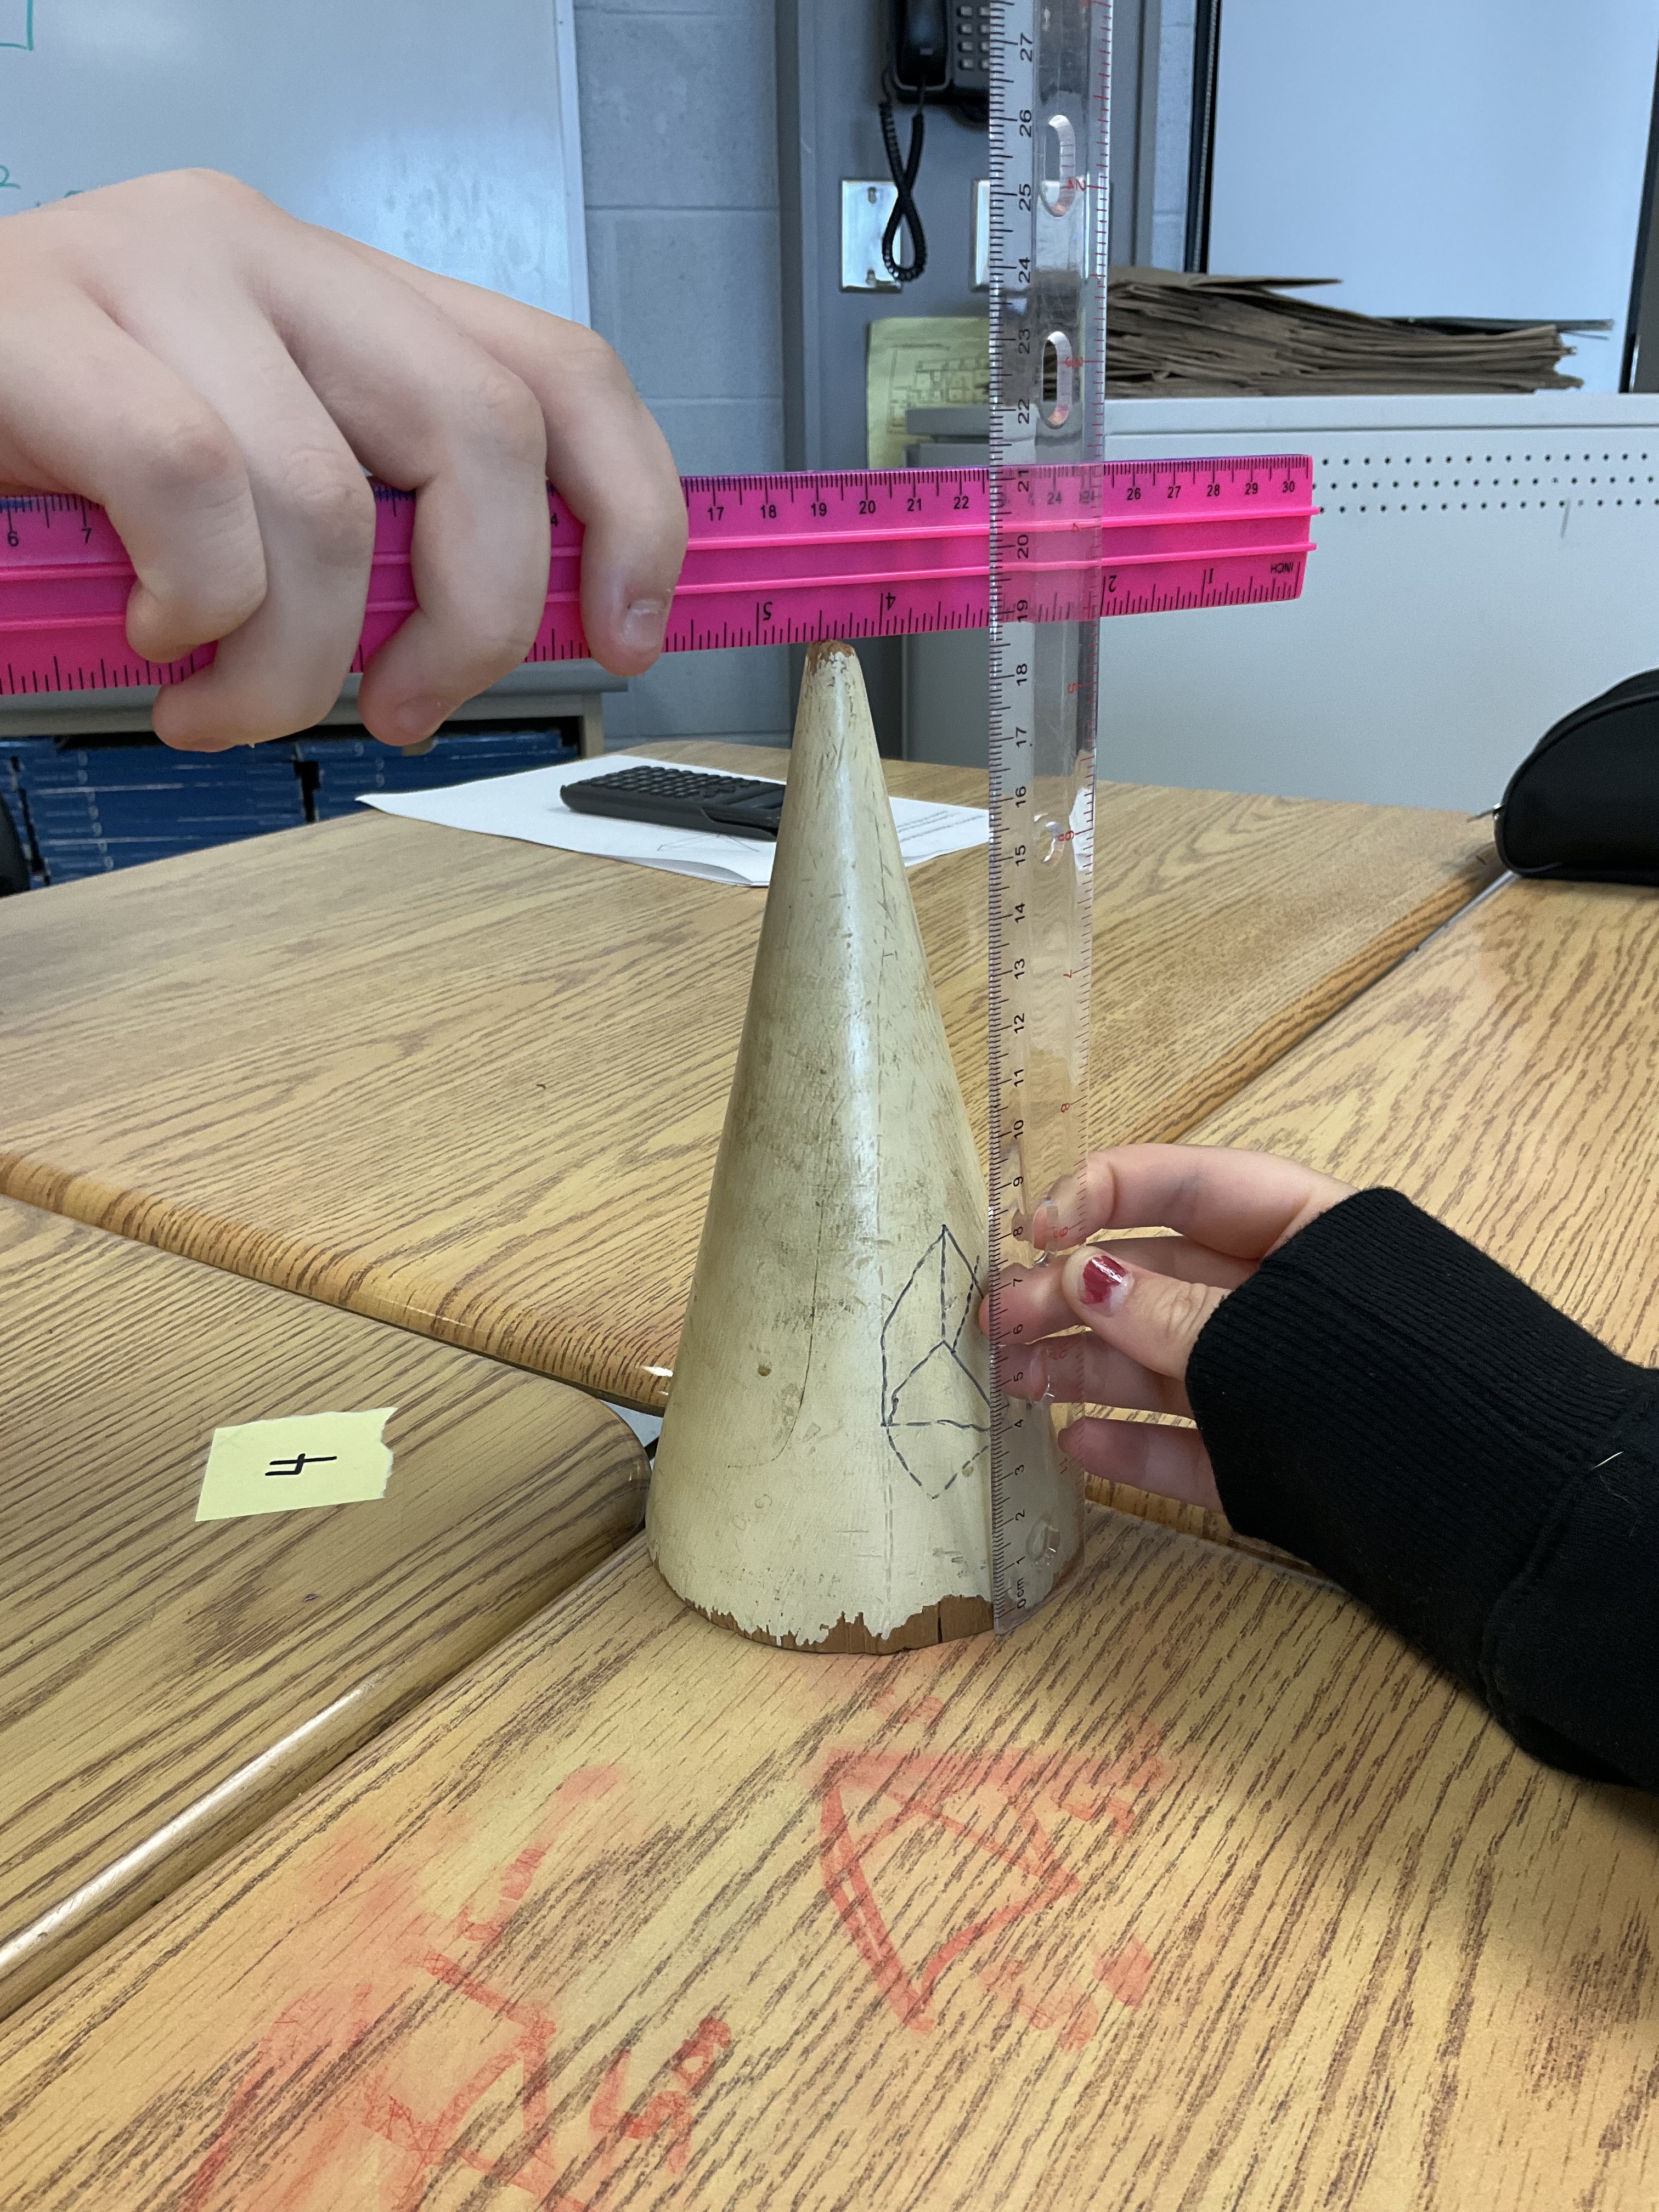
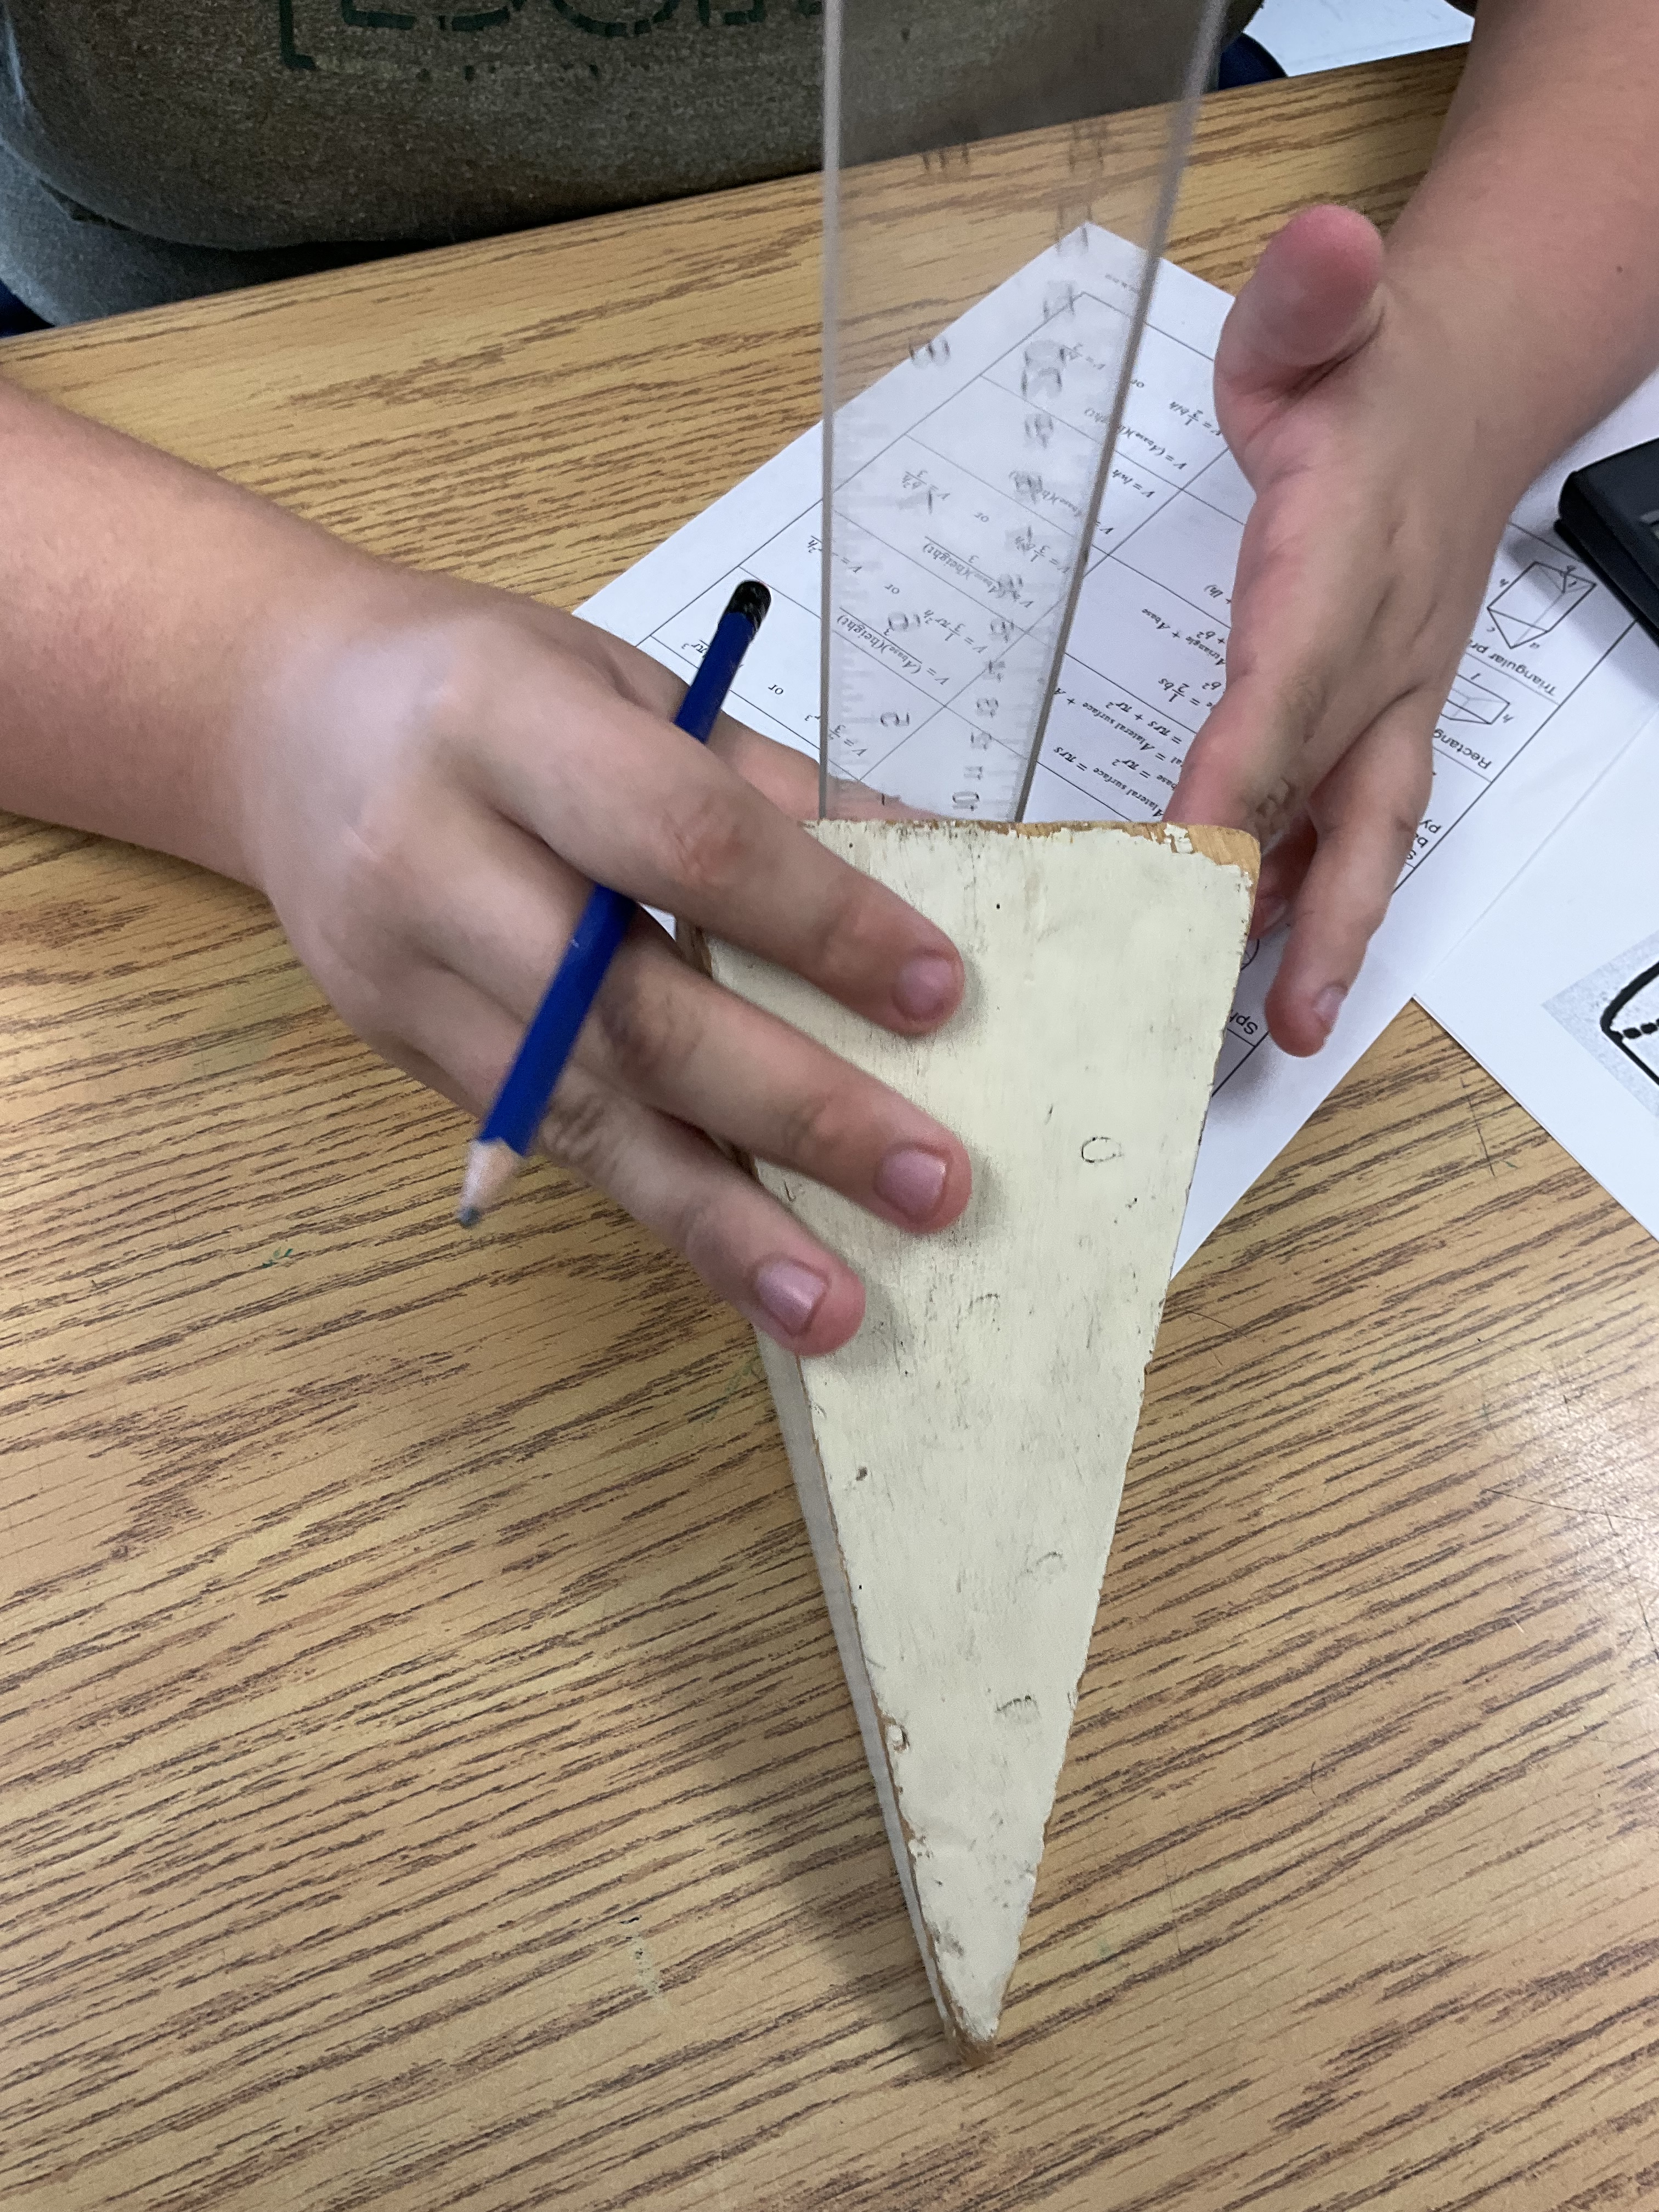
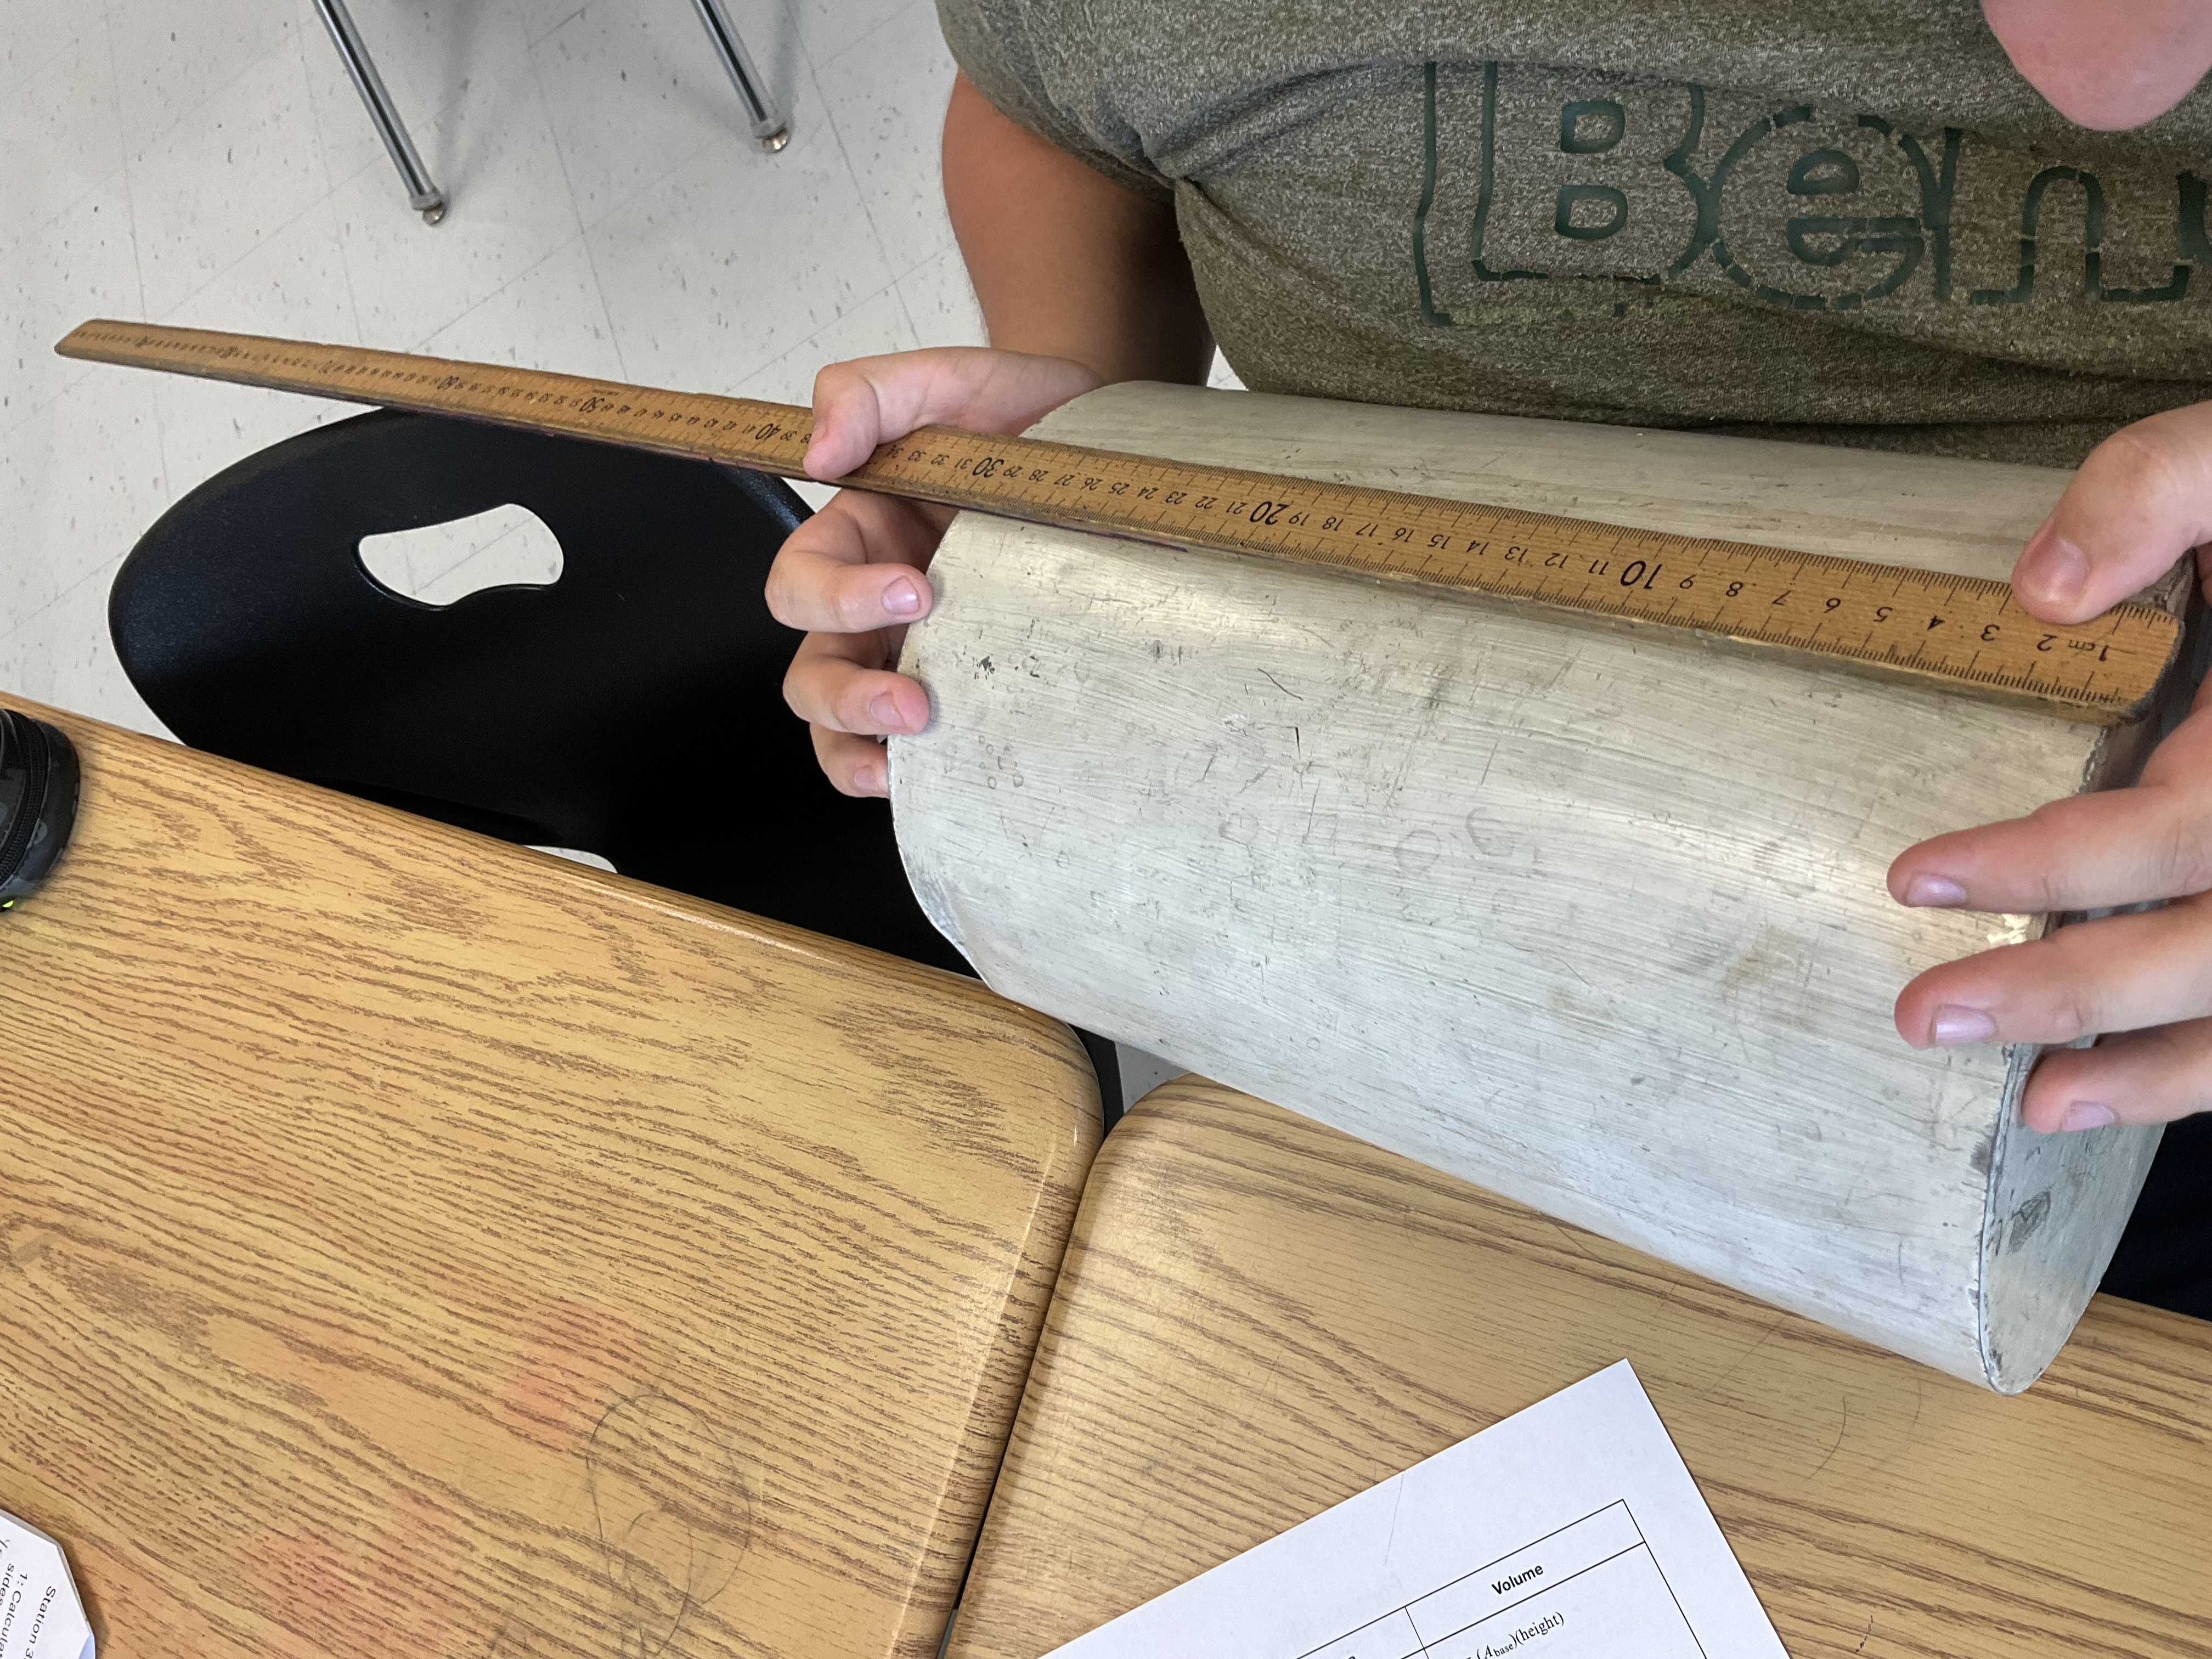
Each student had a package of pages with a drawing of the form, and space for them to write their measurements and do their calculations. They also had a ruler and formula sheet available on all of the tables.

Students worked in their groups, for 6 minutes at the station, and then the bell rang and they moved to the next station.

once all groups had been to the stations a first time, we gave them a second chance at each station, but this time for 3 minutes, just to be sure of their measurements, and to check for communication and units.
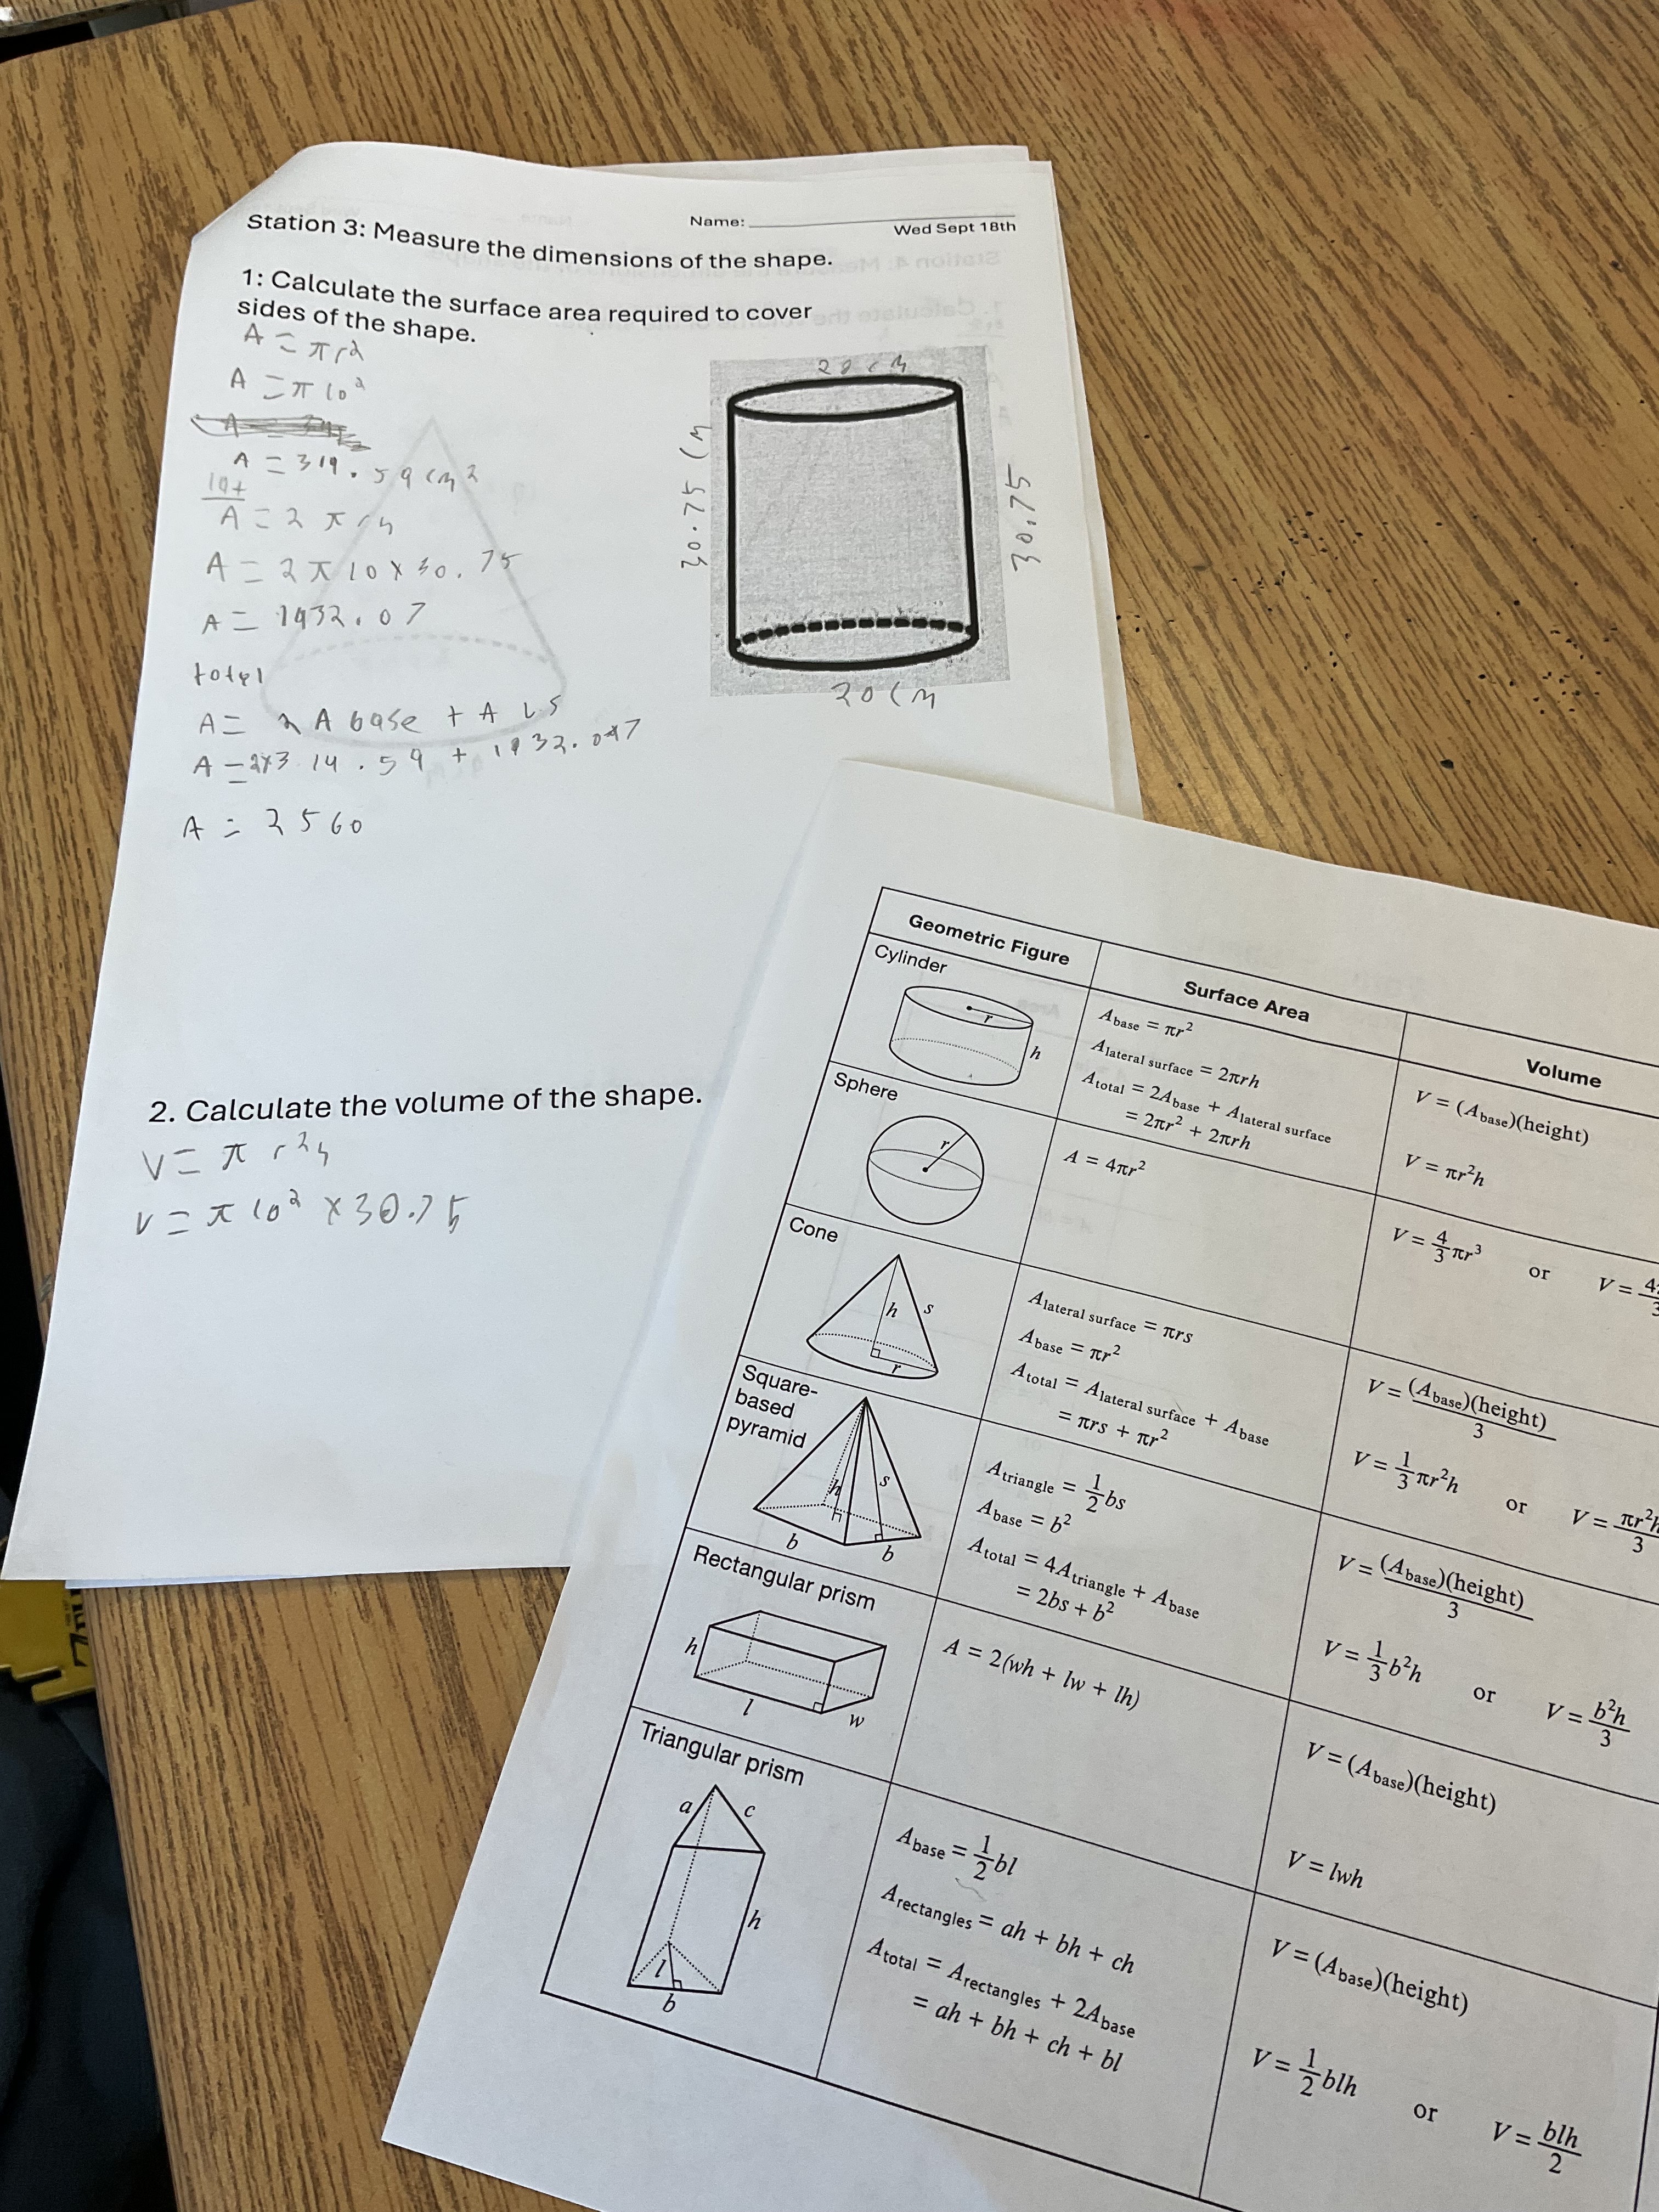
Students were actively engaged in the task all period, and working with their groups to accomplish their goals. There was positive energy in the room, and students were really proud of what they accomplished.
Flip Da Visor
We’ve been spending time working on operations with fractions. We’ve looked at a few ways of working out solutions, with drawings, and also with algorithms.
Here is how to add and subtract fractions visually:
Each rectangle represents one whole. We draw out one fraction with horizontal lines, and the other with vertical lines. We colour in the fractions, but to add them, we need to have pieces that are the same size, so we make the horizontal and vertical lines in the other rectangle. This is equivalent to making a common denominator.

Now that the pieces are the same size we can add them up. We get a number greater than 1. We could physically move pieces from one rectangle to another to fill it up. We’d see that there are 14/24 ths remaining after the one rectangle is full. We simplify to 1 and 7/12ths.
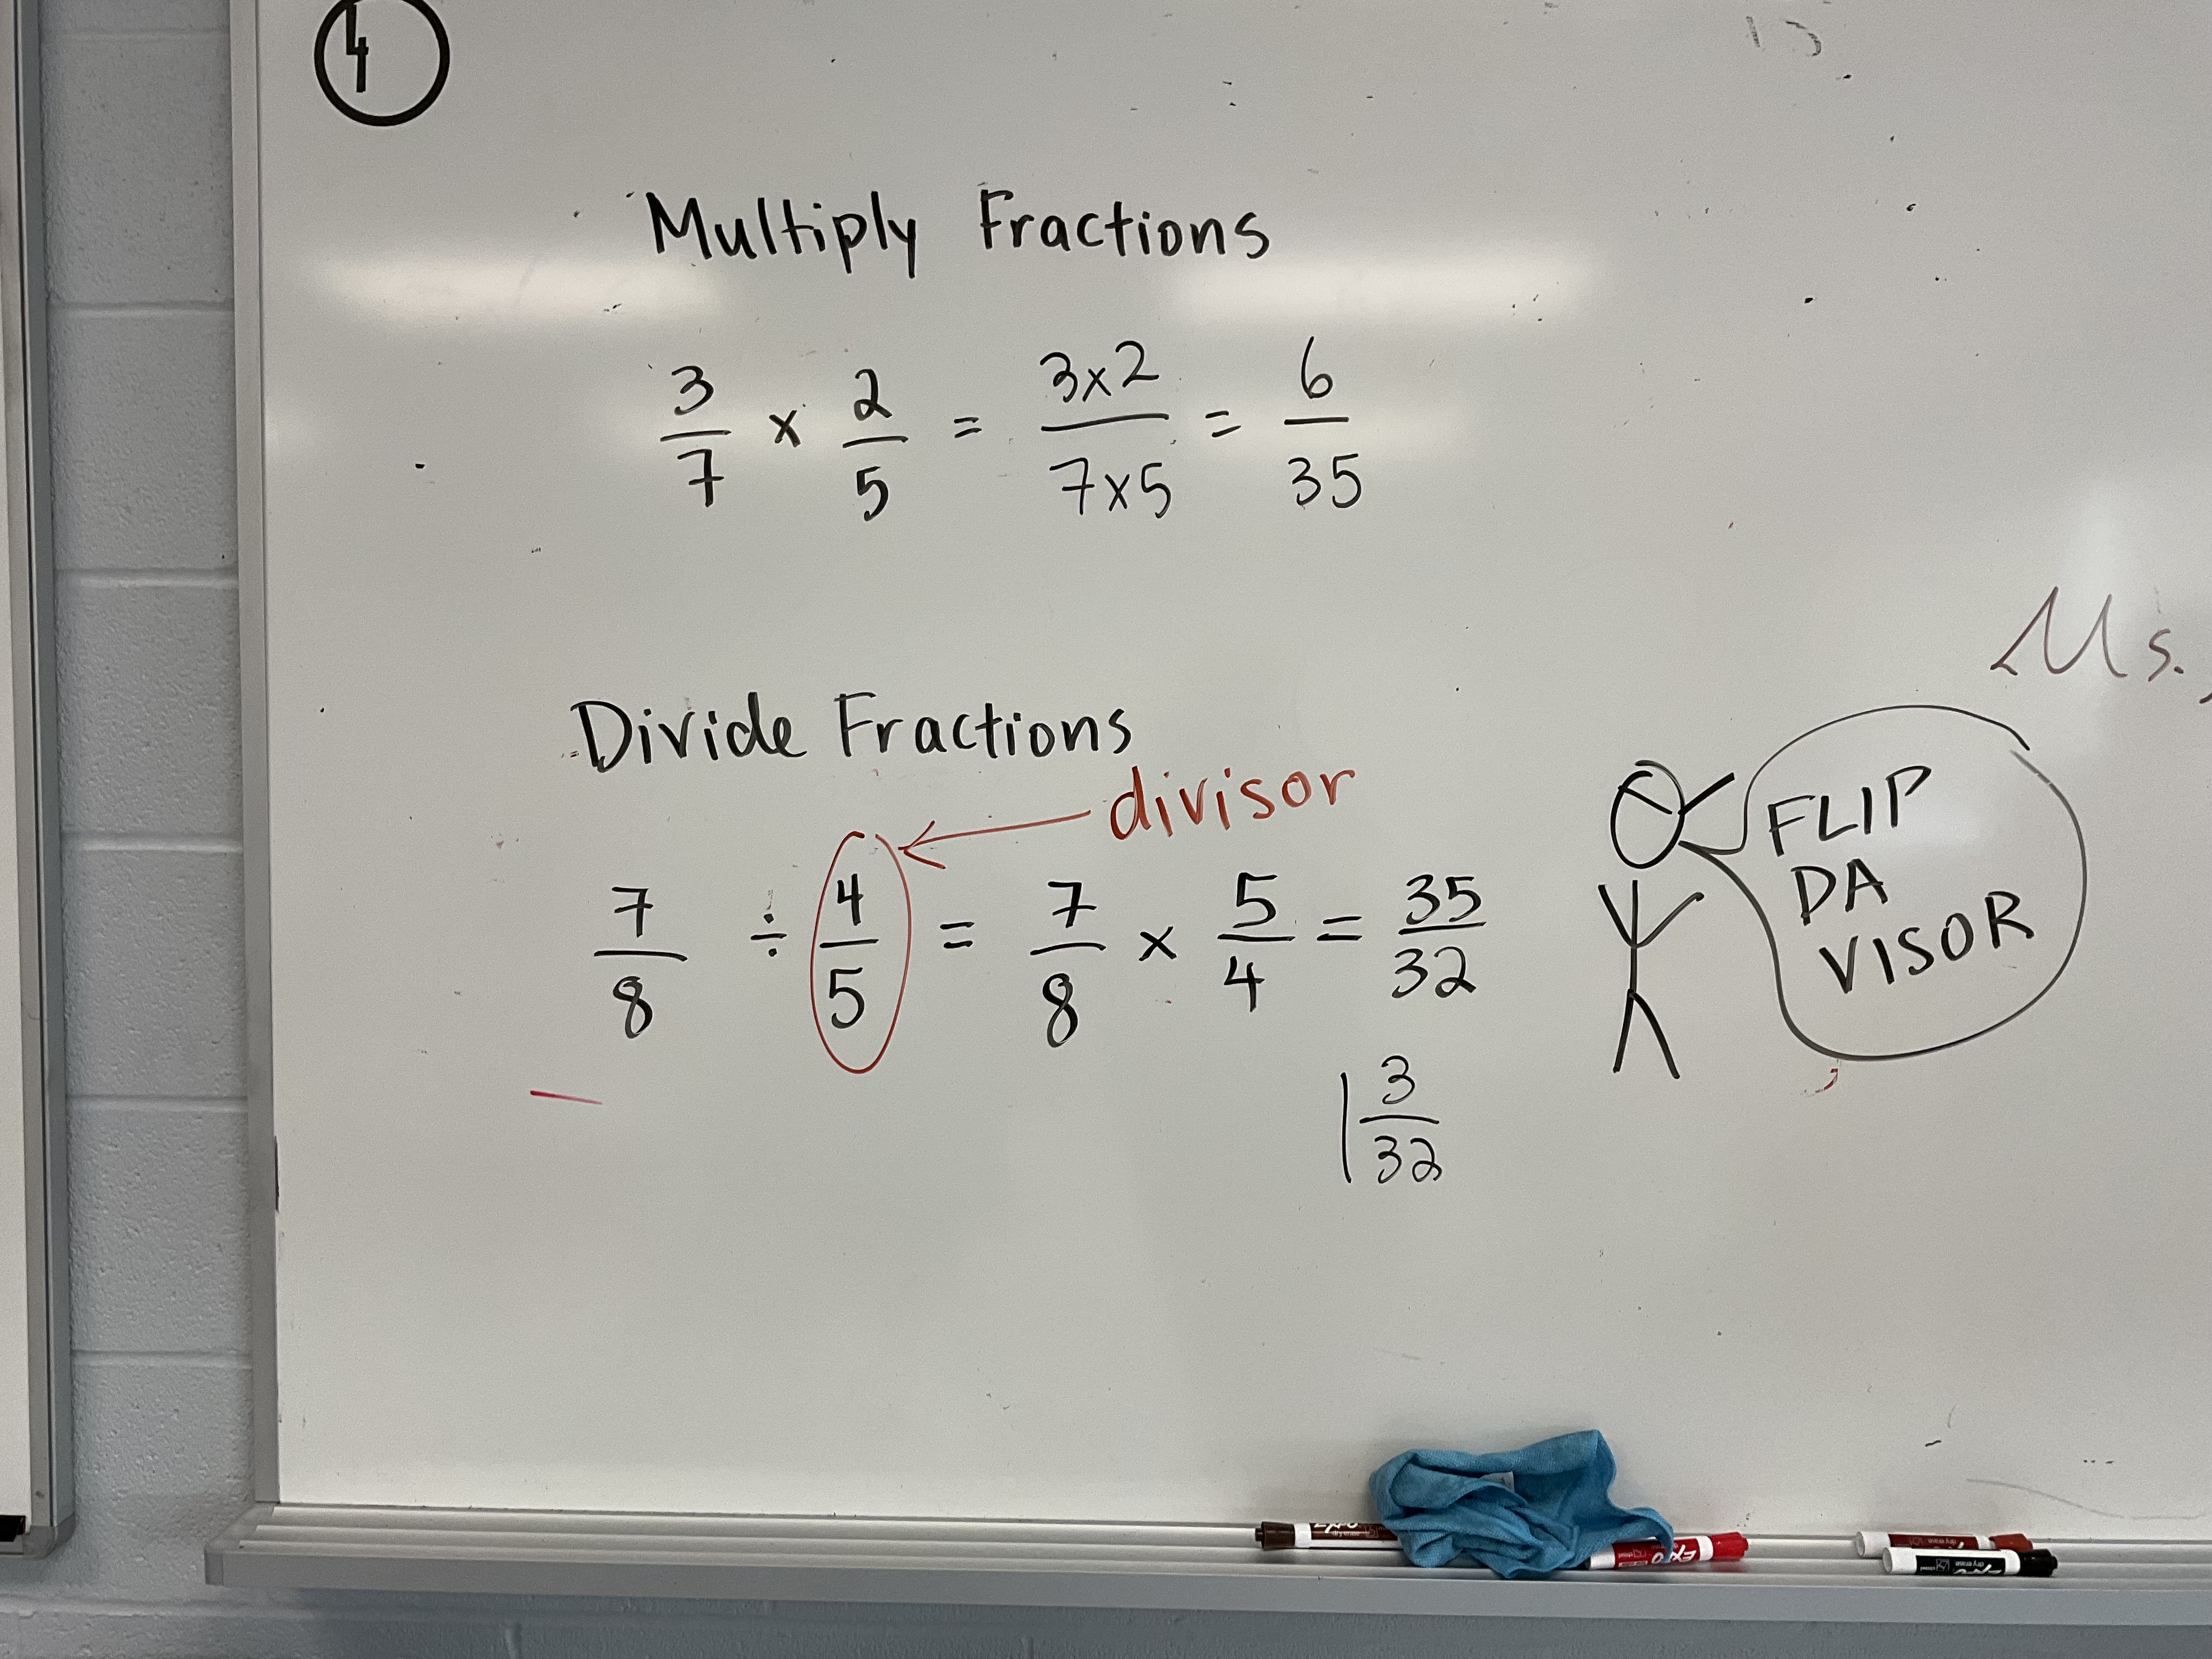
To multiply we use the area model. Area is length times width. We use a rectangle again, and make 3/4 shaded horizontally, and 2/5 shaded vertically. The intersection of the shaded regions is the area, which is 6 pieces out of a total of 20 so the result of the multiplication is 6/20=3/10

Dividing can be done visually as well. We make 2 rectangles, each representing one whole. We divide one horizontally into quarters and colour in 1/4, next we divide the other into 5ths vertically and colour in 3/5.
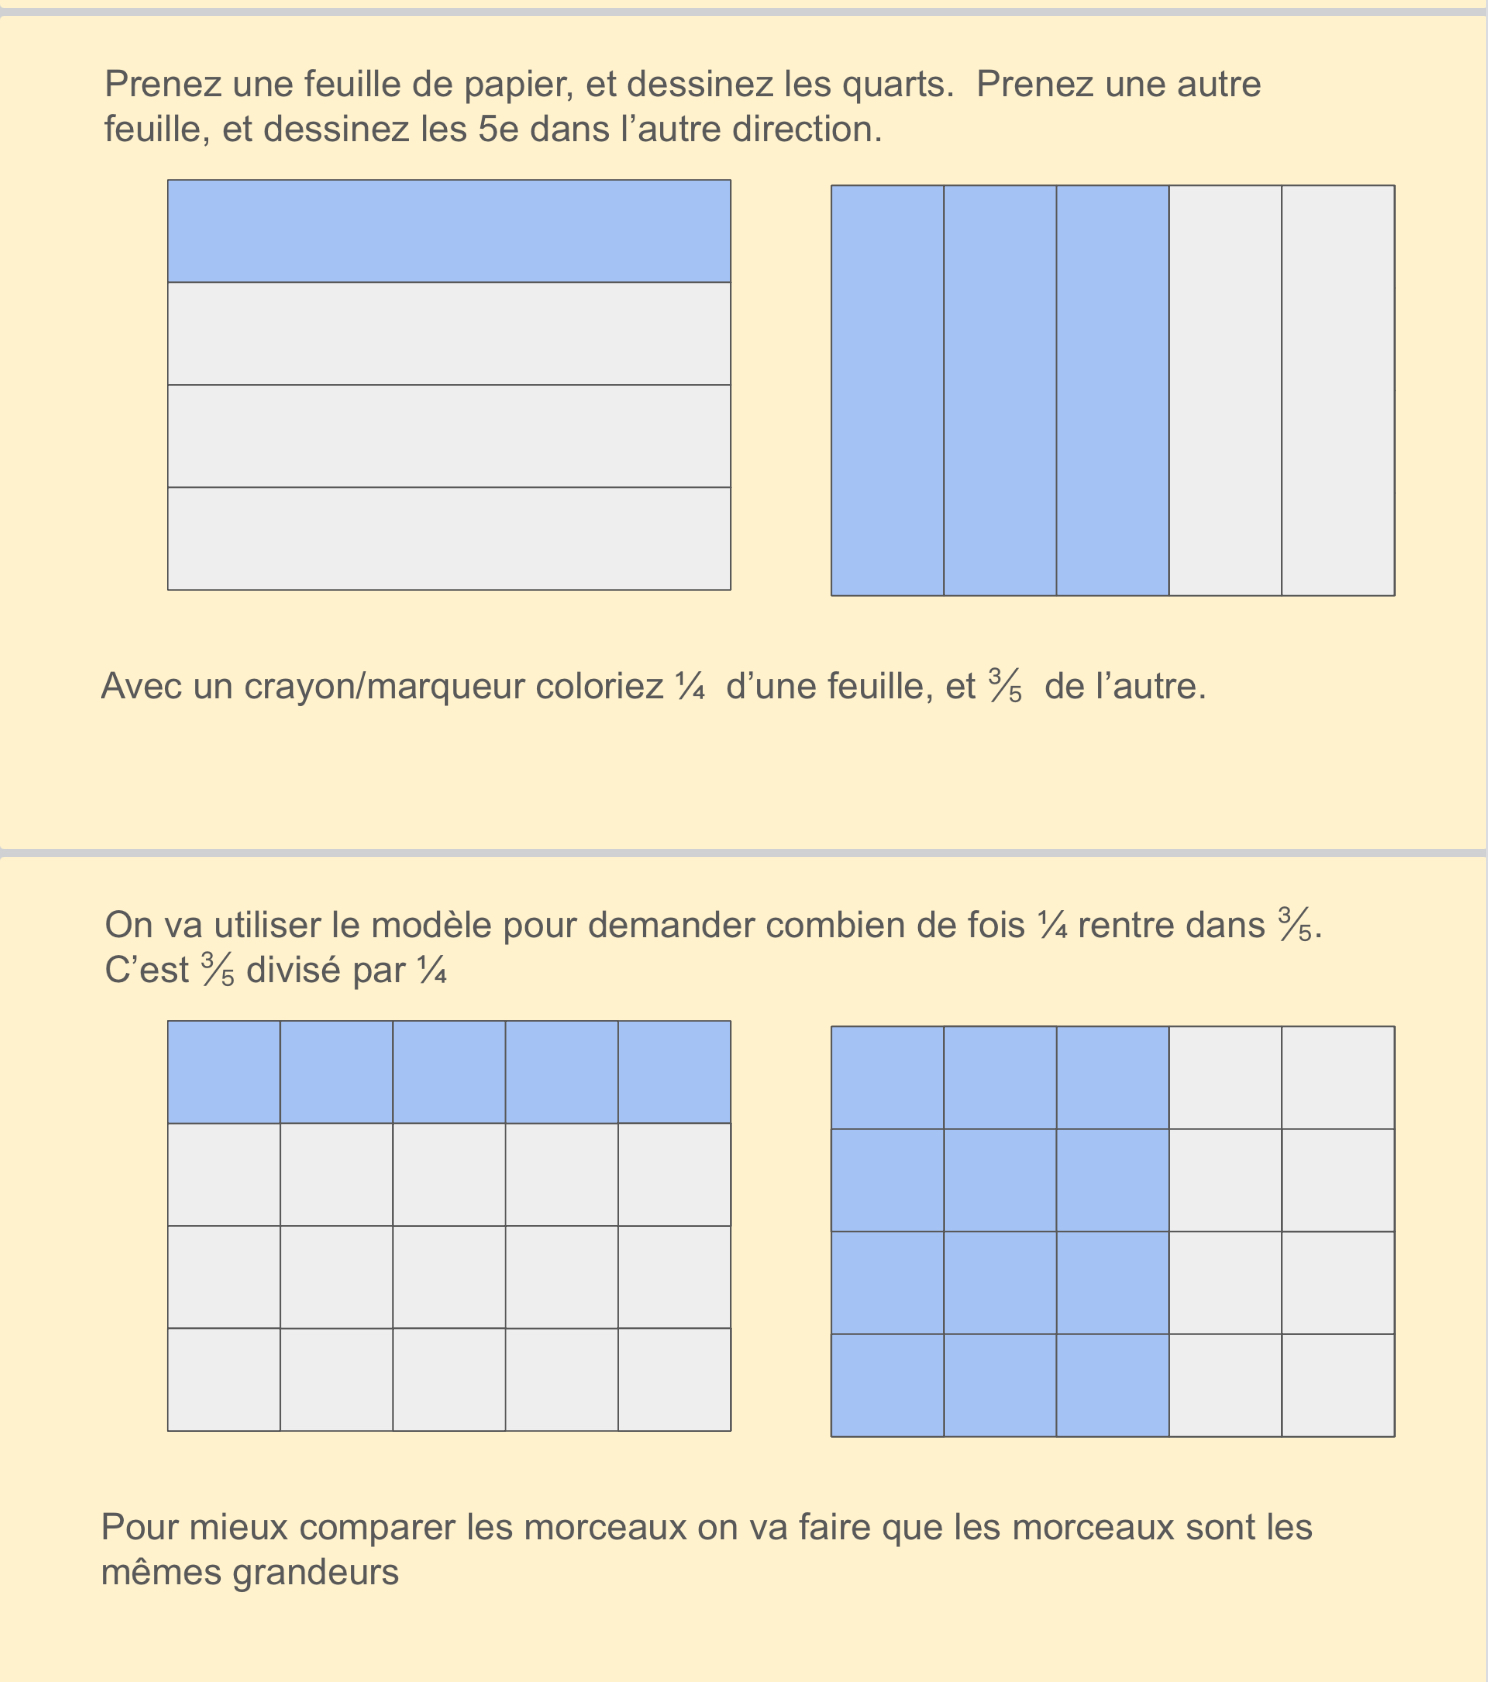
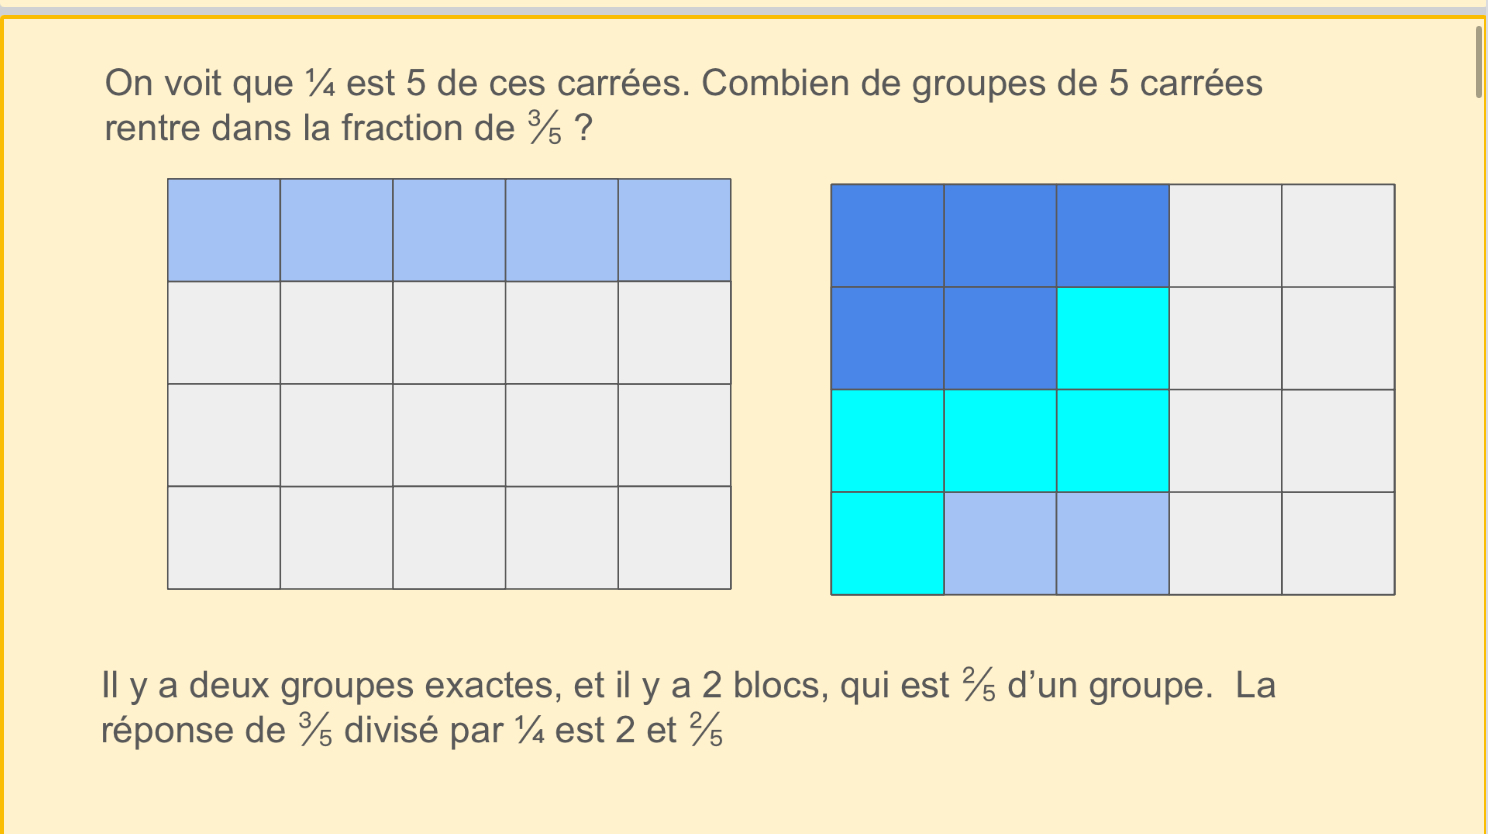
we will determine how many times 1/4 goes into 3/5, which is the same as asking 3/5 divided by 1/4. To figure this out, we make the pieces the same size, then count out 5 pieces in 1/4. We now look for how many groups of 5 pieces are in 3/5. I’ve coloured them in differently. There are 2 groups, and then 2/5 left. The answer is 2 and 2/5.
A trick I use to help with dividing fractions is to wear a visor upside down in class. Students wonder why I have flipped my visor. I link that to flipping the divisor (“flip da visor”) when we have a fraction division question. We flip the second fraction (the divisor) then multiply.
Fractions and Area in Grade 9
Today we are shifting from calculating with fractions to calculating area and perimeter. We worked on the “Unusual Baker” problem.

we are trying to put a price on each piece of cake, if the entire cake is $60.

It was neat to see all of the ways the students approached the task, and made use of their understanding of fractions to determine the price of each piece.
Equation Solving in Grade 10
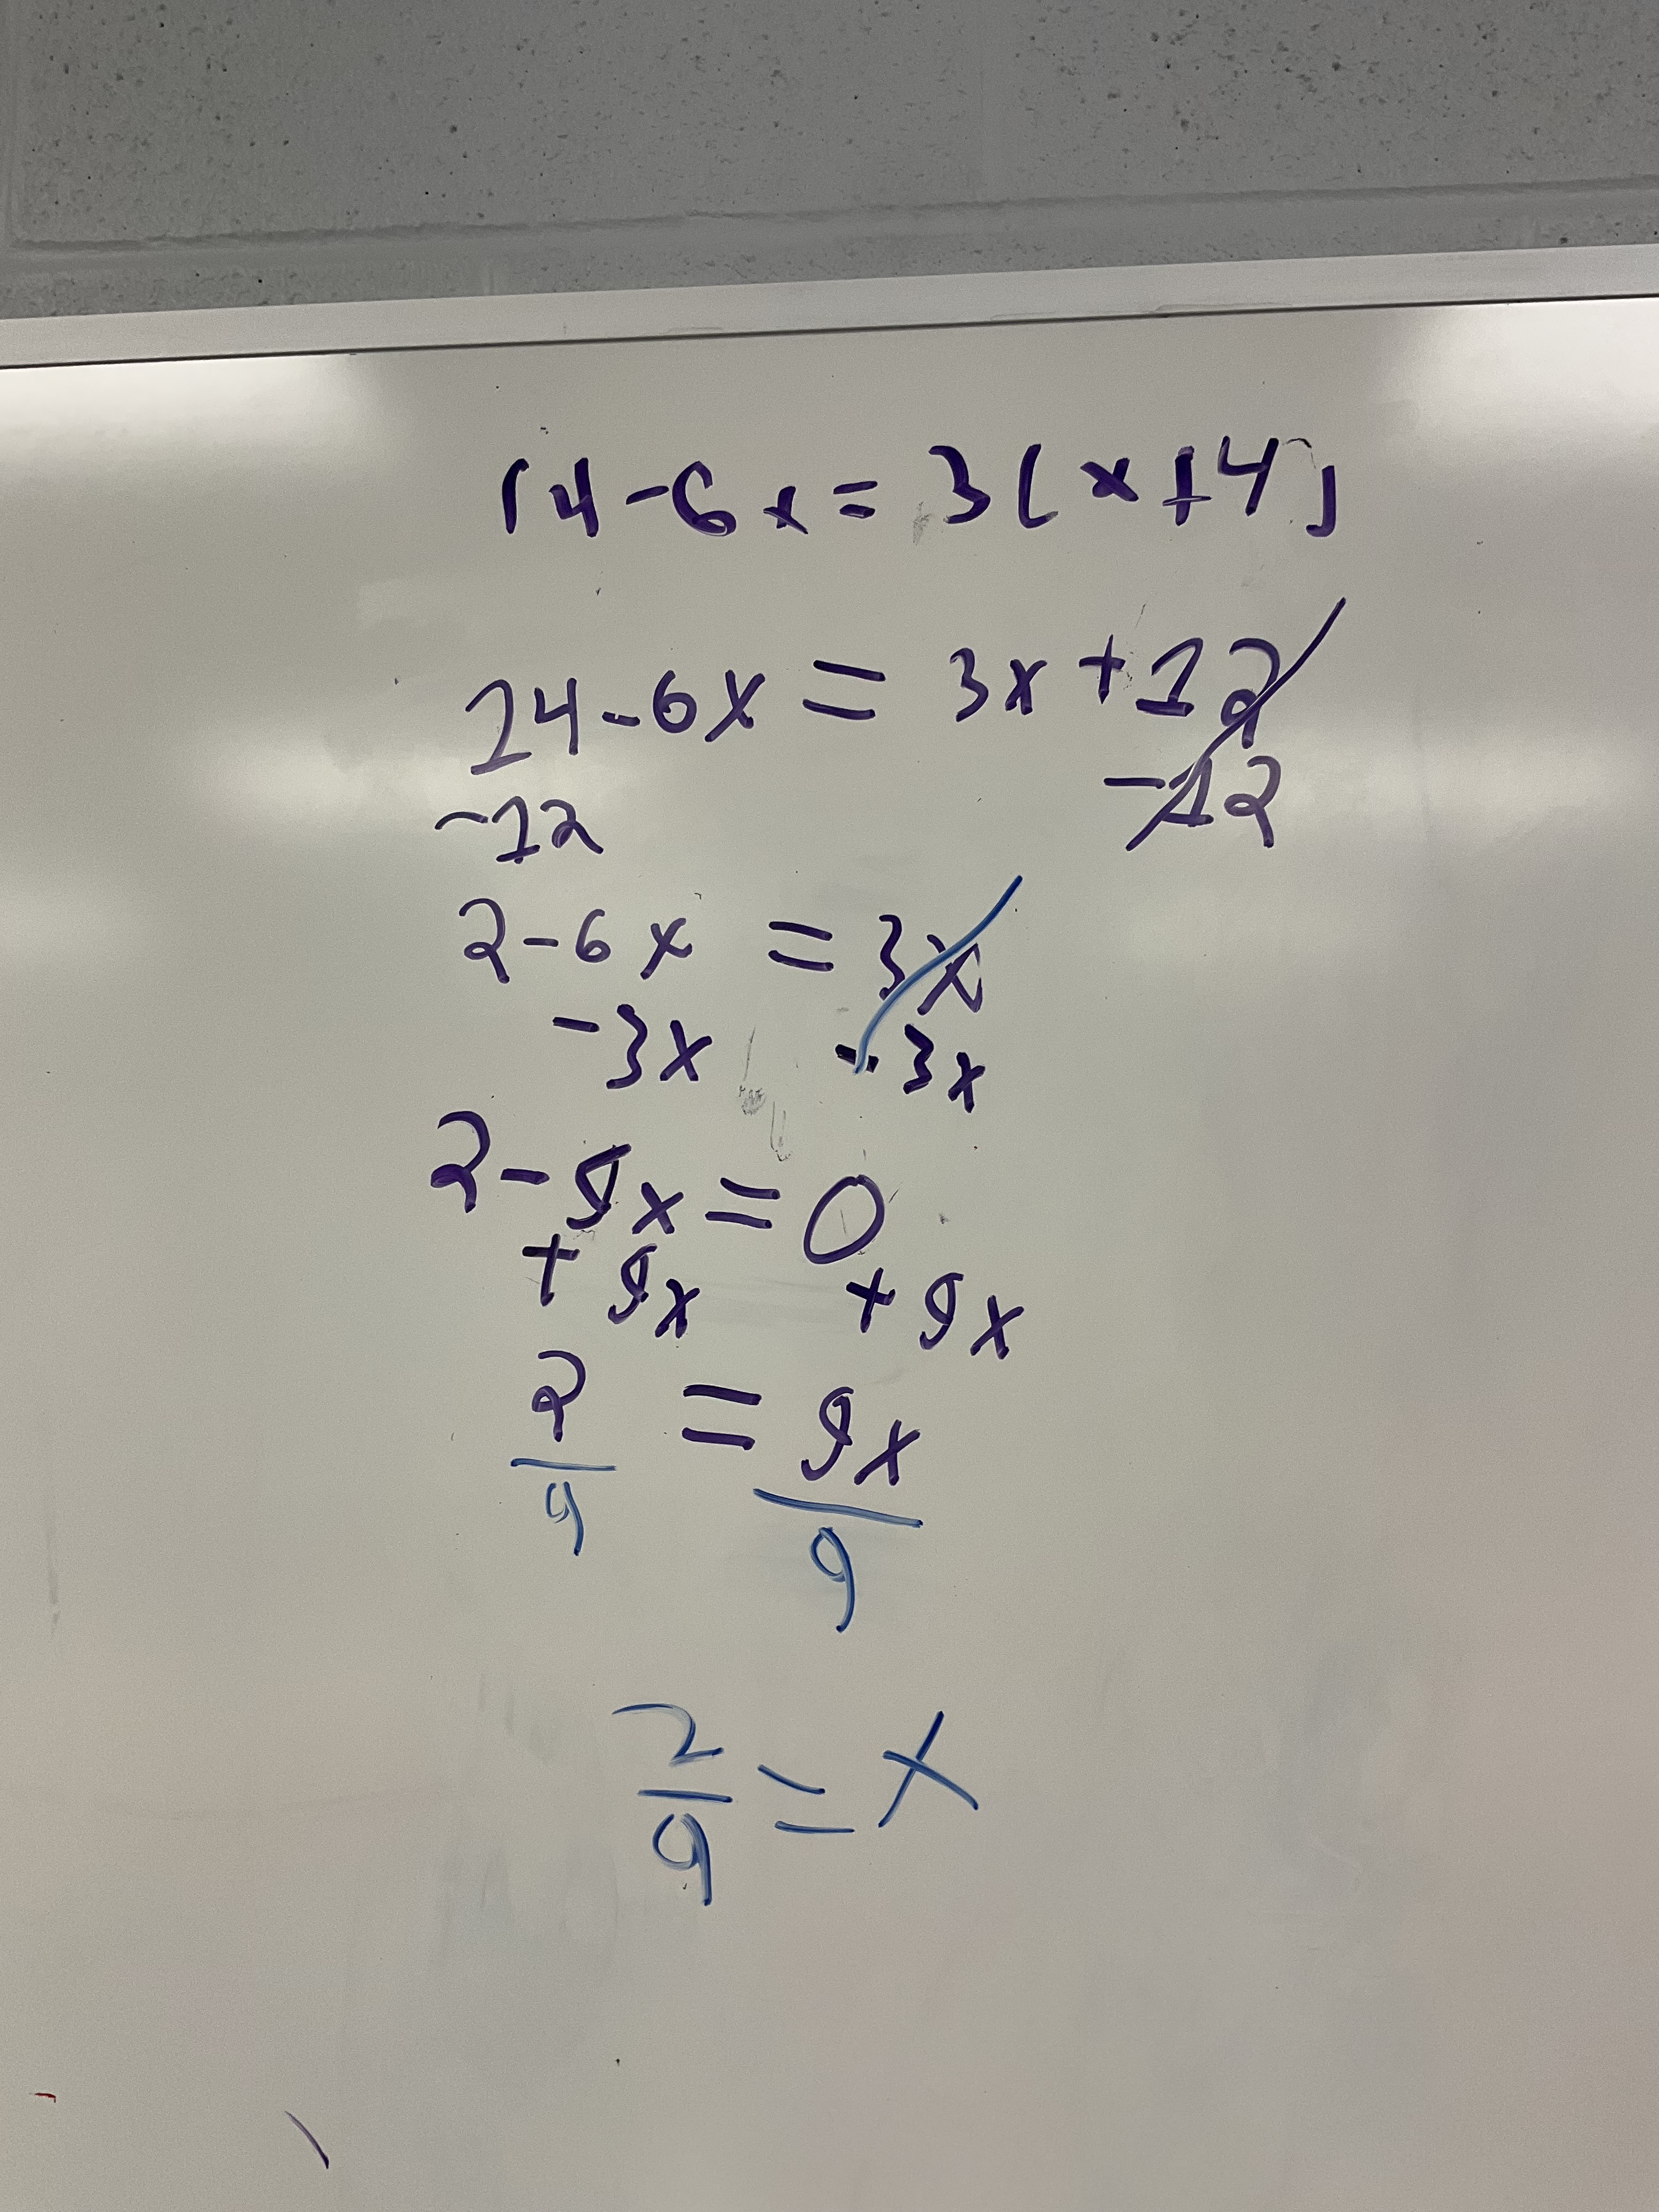
Today in 2P students were solving equations.
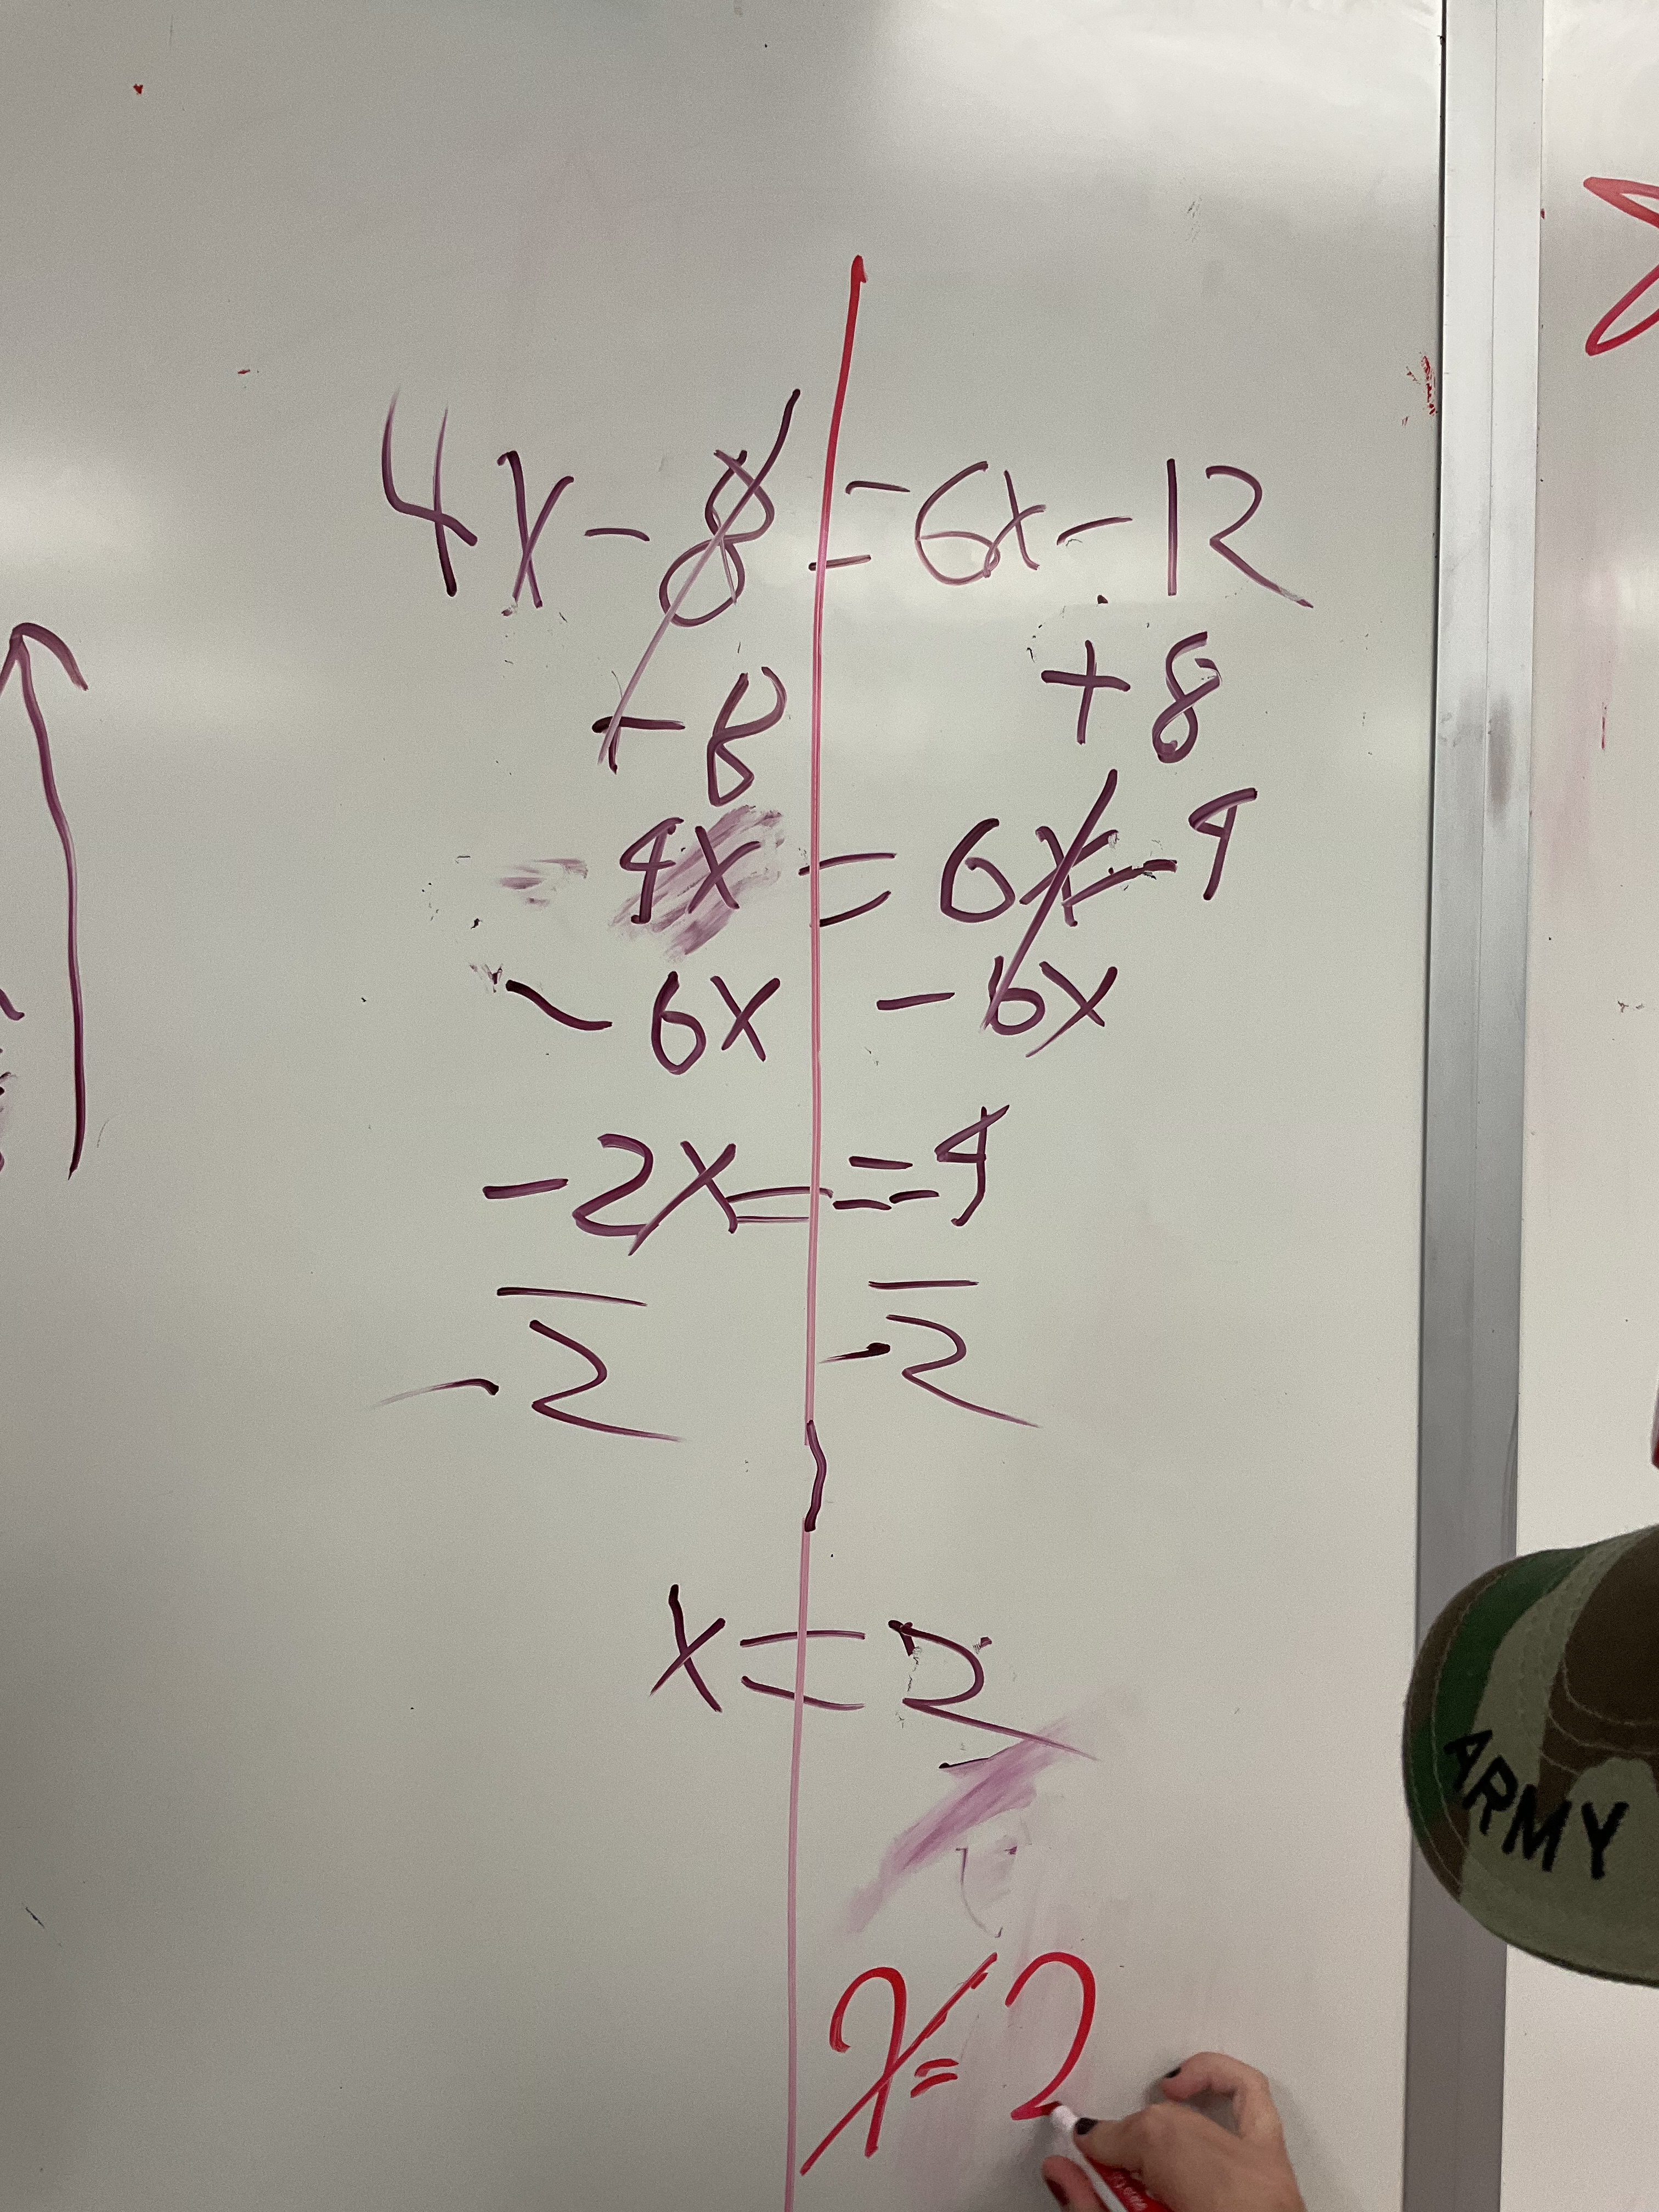
It was great to see how much they remembered from grade 9, and how well they worked together at the whiteboards.
Some questions led to interesting discussions about distributive property.
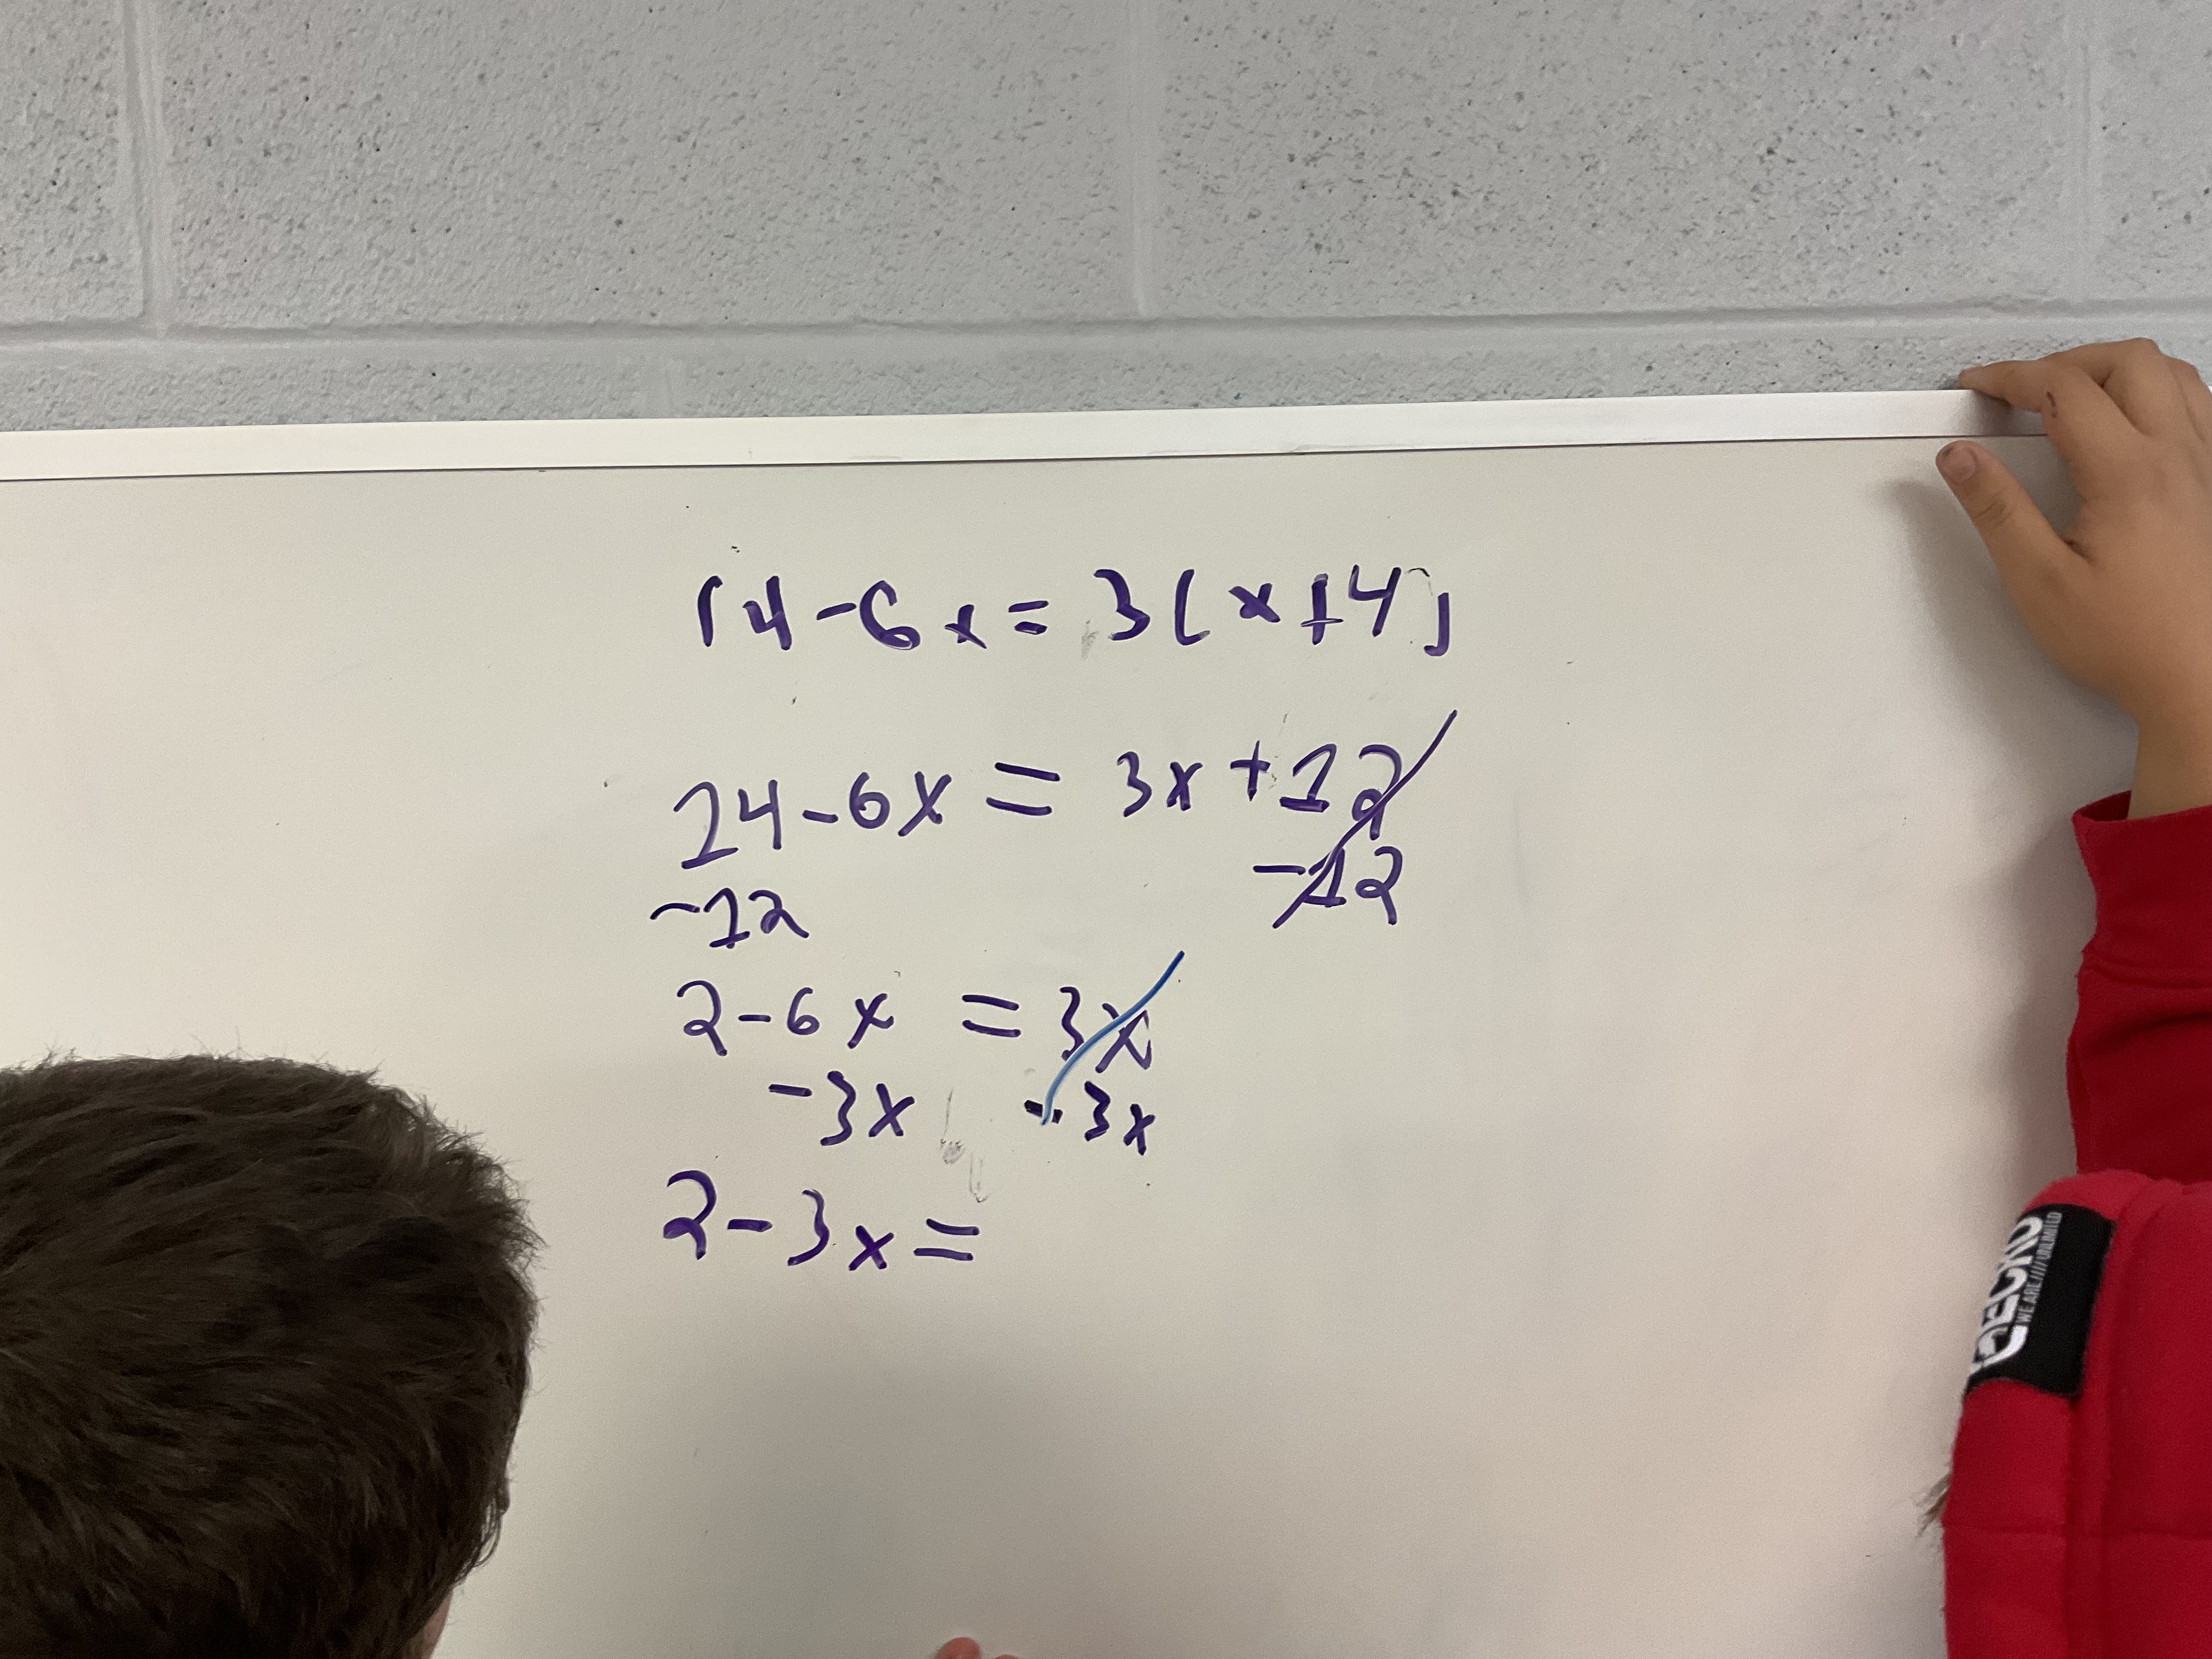
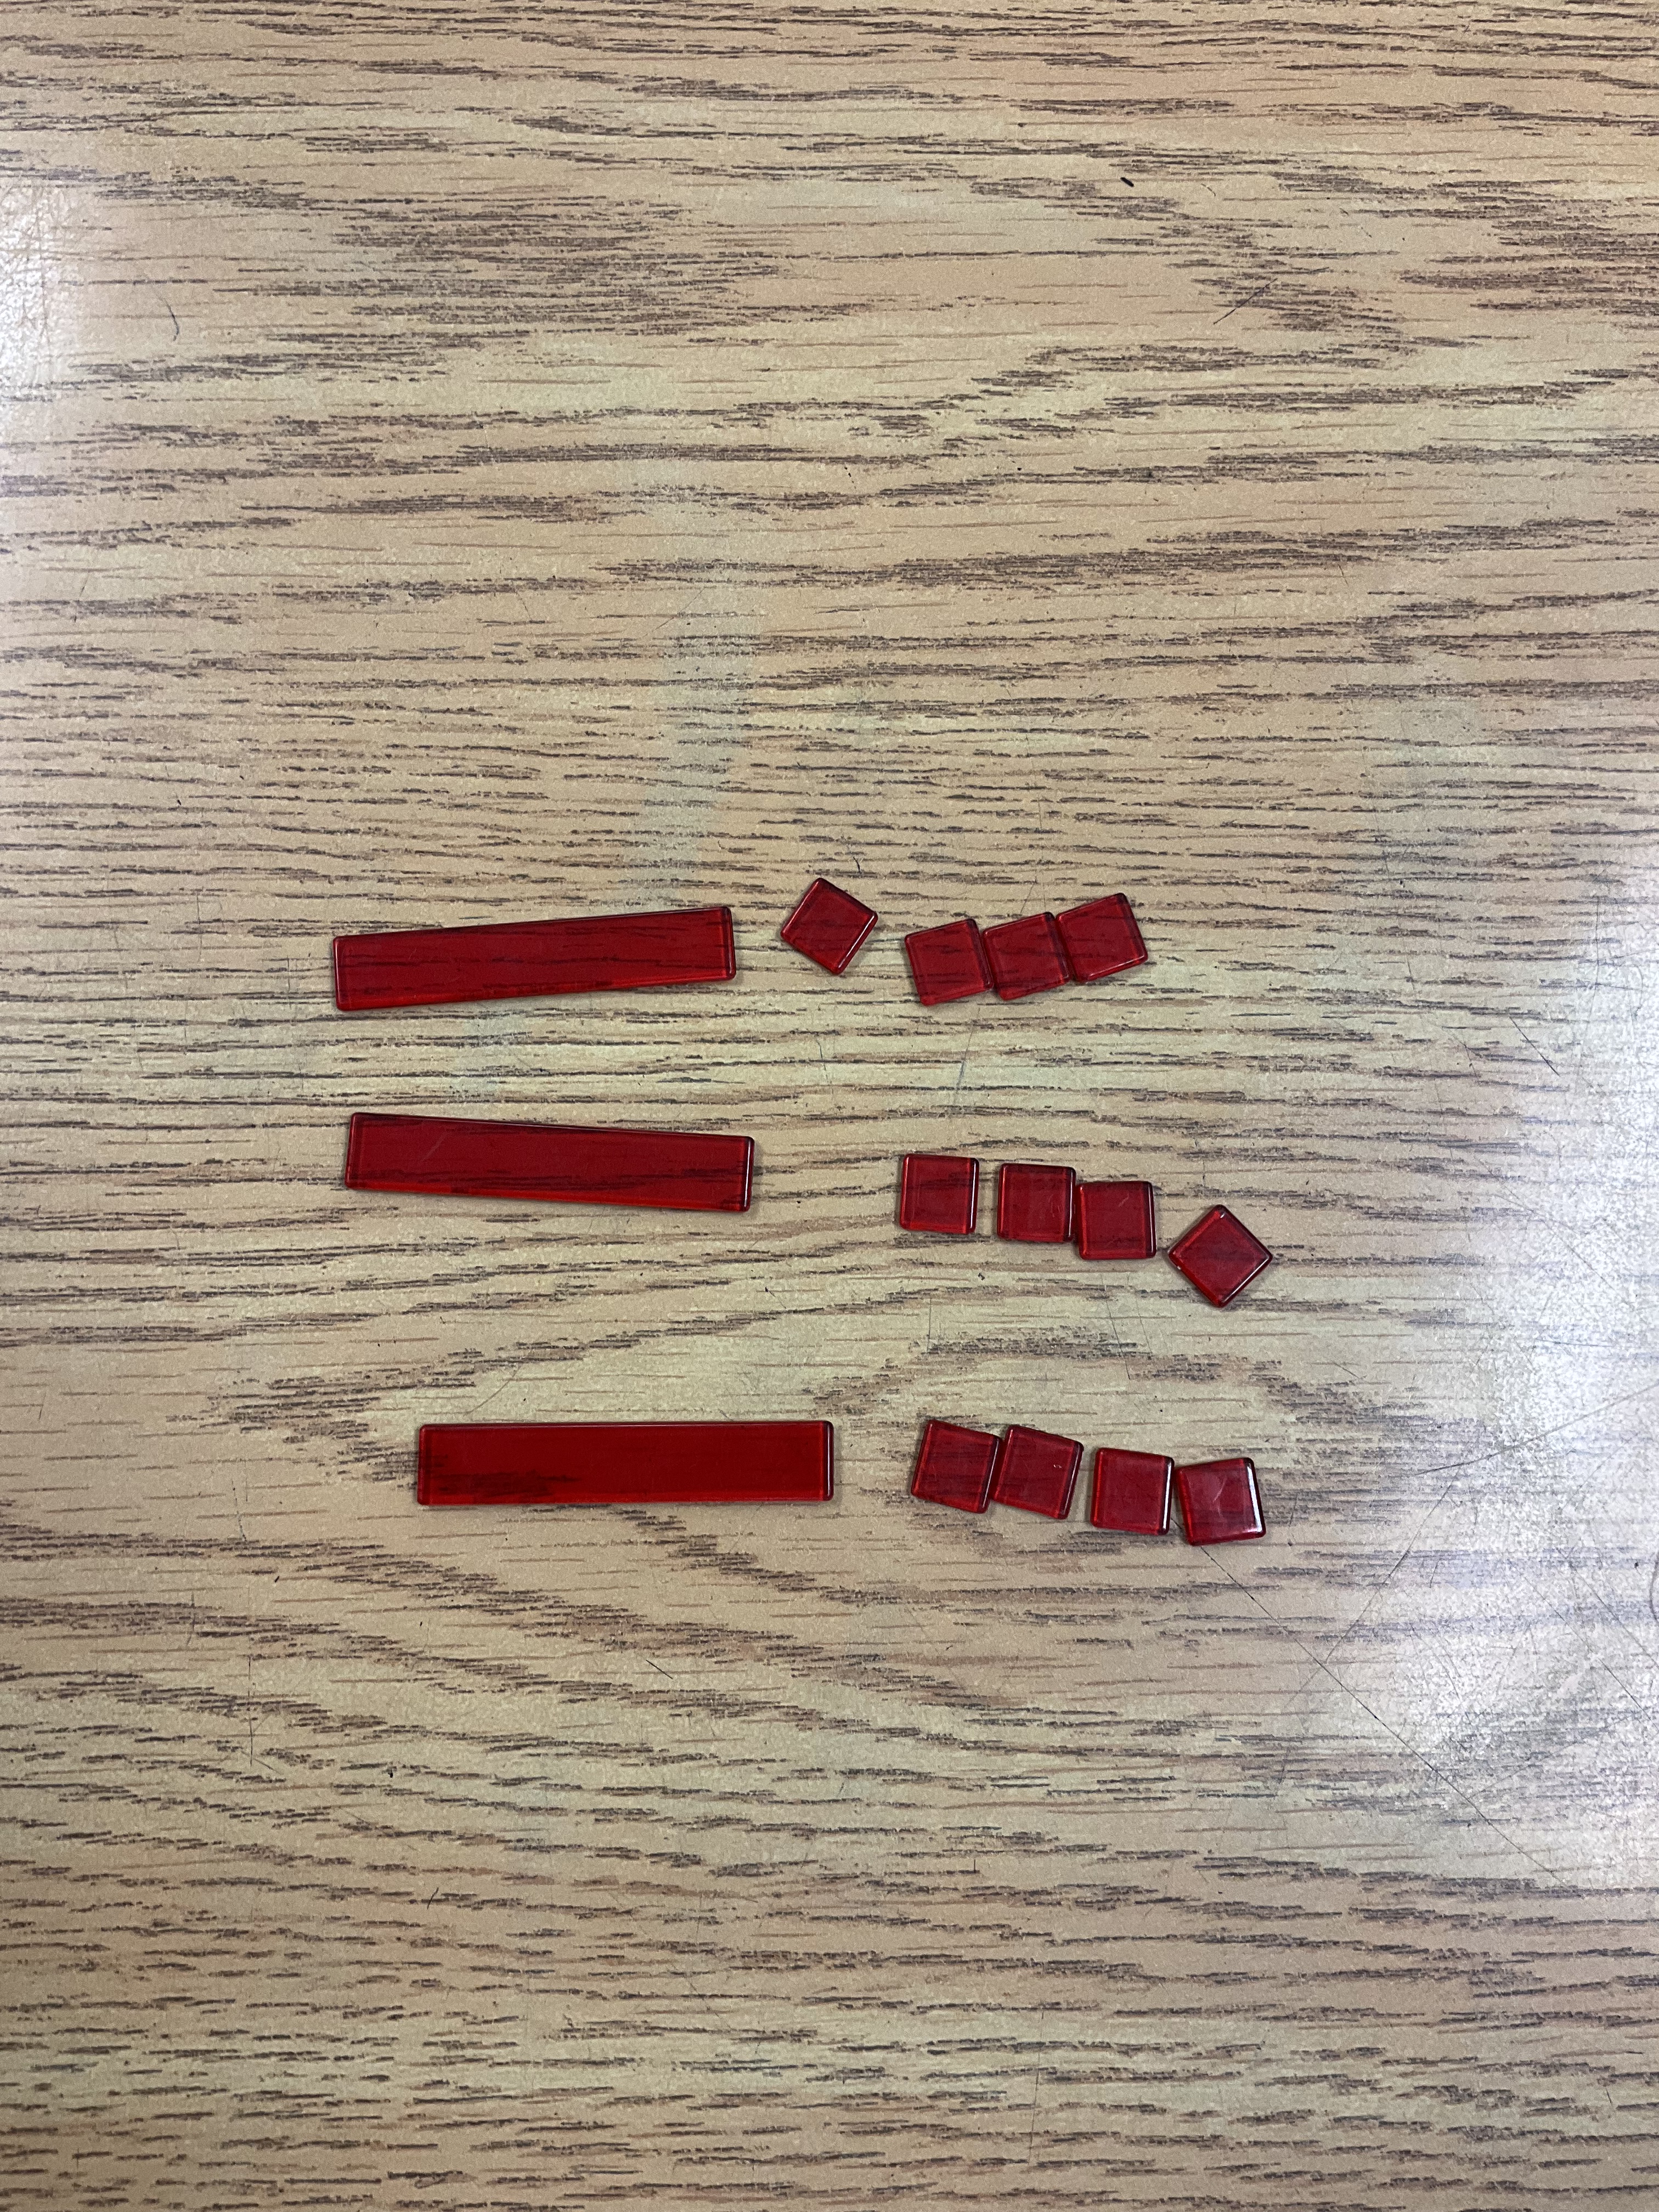
we used tiles to help understand what 3(x+4) means.
It was impressive what they could do by the end!
Visual representations of Fractions
Grade 9s are working on operations with fractions. Today we worked on multiplying.
We started by representing multiplication with an area model, using whole numbers.

Next we spent time exploring what it means if we multiply fractions with an area model. This question represents 2/3 times 1/2. We started by using vertical lines to divide the rectangle into thirds, and we coloured 2 of the thirds. Next we divide the rectangle horizontally into 2 pieces and we colour one of the halves.

the result of the multiplication will be a fraction. The numerator is the pieces that were coloured twice. In this case, 2 pieces. The total number of pieces will be the denominator. There are 6 total pieces. The result is 2/6 which simplifies to 1/3.
We did a few more examples at the walls, and then tried a new model for taking meaningful notes. The first quadrant has an example that involves filling in a few blanks, but the format is highly scaffolded. The second example leaves room for students to use their knowledge. The third quadrant is where they can write down an example we’ve done, or make up their own. The final quadrant is where they write some pointers for themselves for next week when we look at this again.

This note taking practice will be something we will be working on this term as a way to document our learning.
