Algebra Review
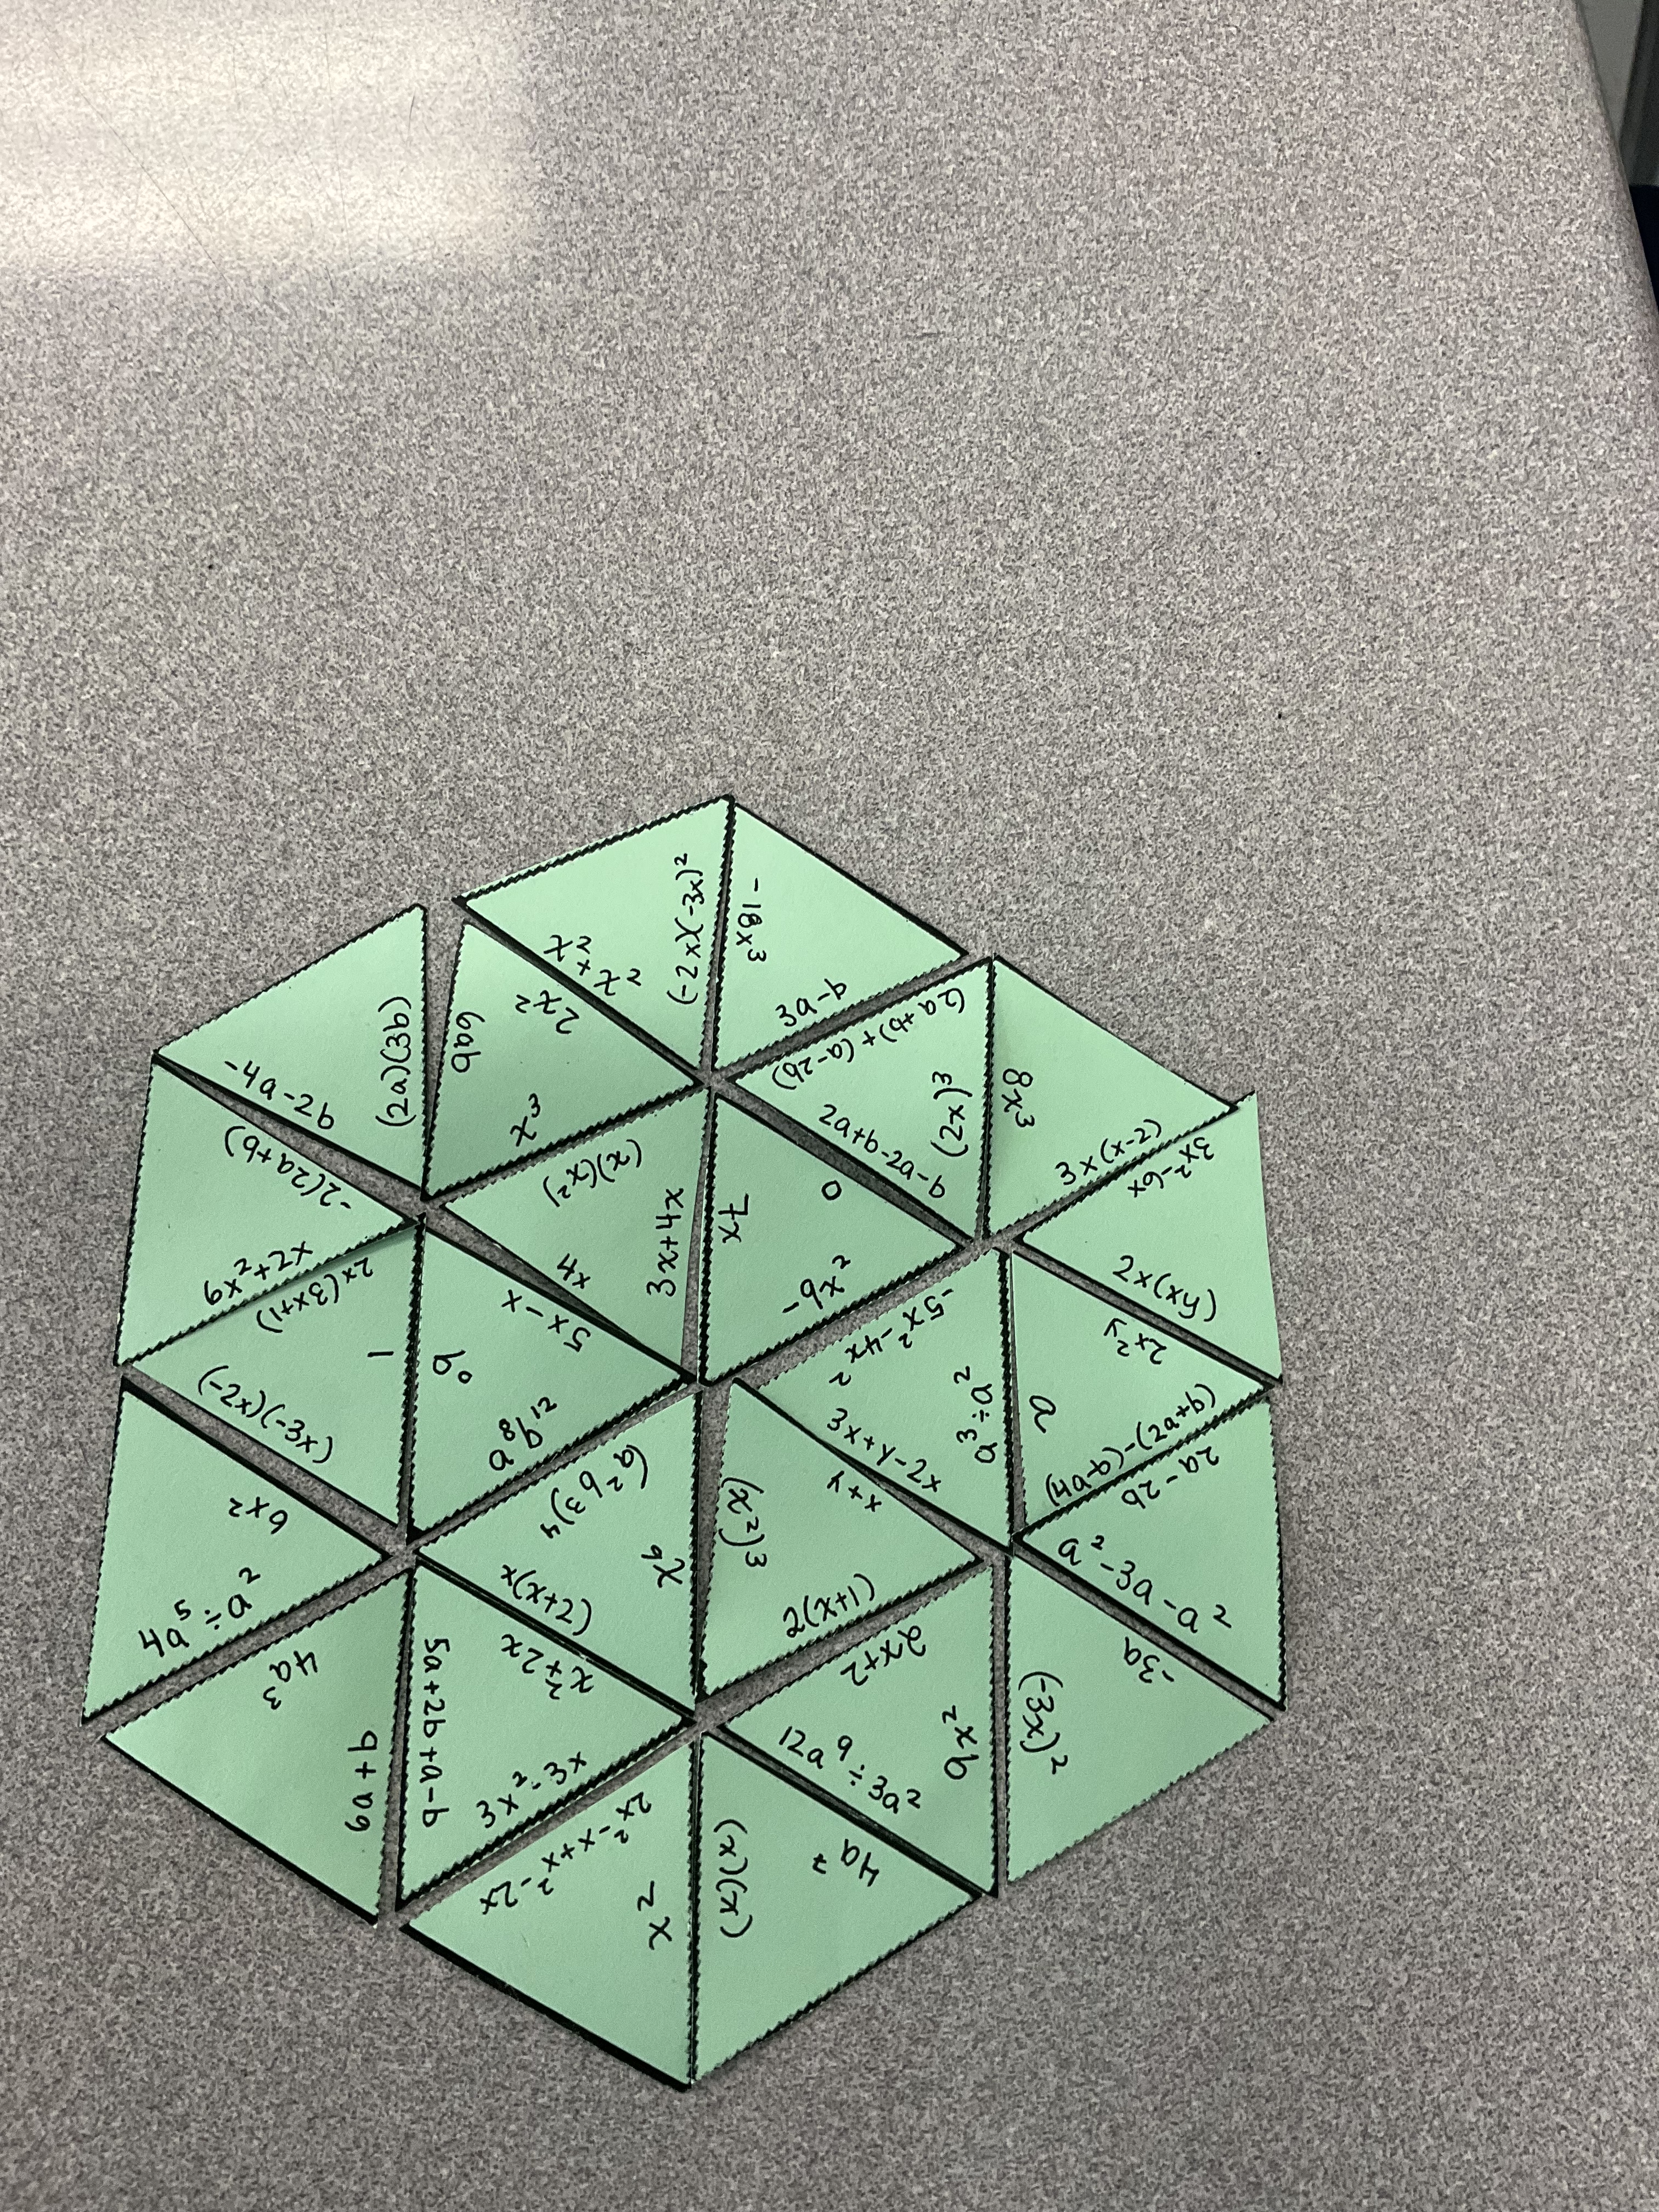
Grade 9s are deep into algebra review today. We dug out some math Tarsia Puzzles and had some fun putting them together.

We had 2 different puzzles to do, which kept most students actively involved and discussing math for most of the period.

Puzzle had fractions and order of operations work, vocabulary, exponent laws, different forms of linear equations, distributive property and equation solving.
I made these tarsia puzzles in a word processor, but in the olden days I made them by hand, copied them on card stock, and cut them out. Some groups tried one of my puzzles from years ago. They had fun putting it together.
I was impressed at how they were working hard, and having good discussions with peers, and reminding each other about what we’ve learned this term.
Here are the .pdf copies of the puzzles.
Remember to print them single sided, and if doing more than one puzzle in a class, having different colours for different puzzles is helpful. When I am very organized I’ll give groups sandwich bags, and have them put their puzzle pieces in the bag to either bring home to practice, or for me to keep and use with future classes.
More about Matrices
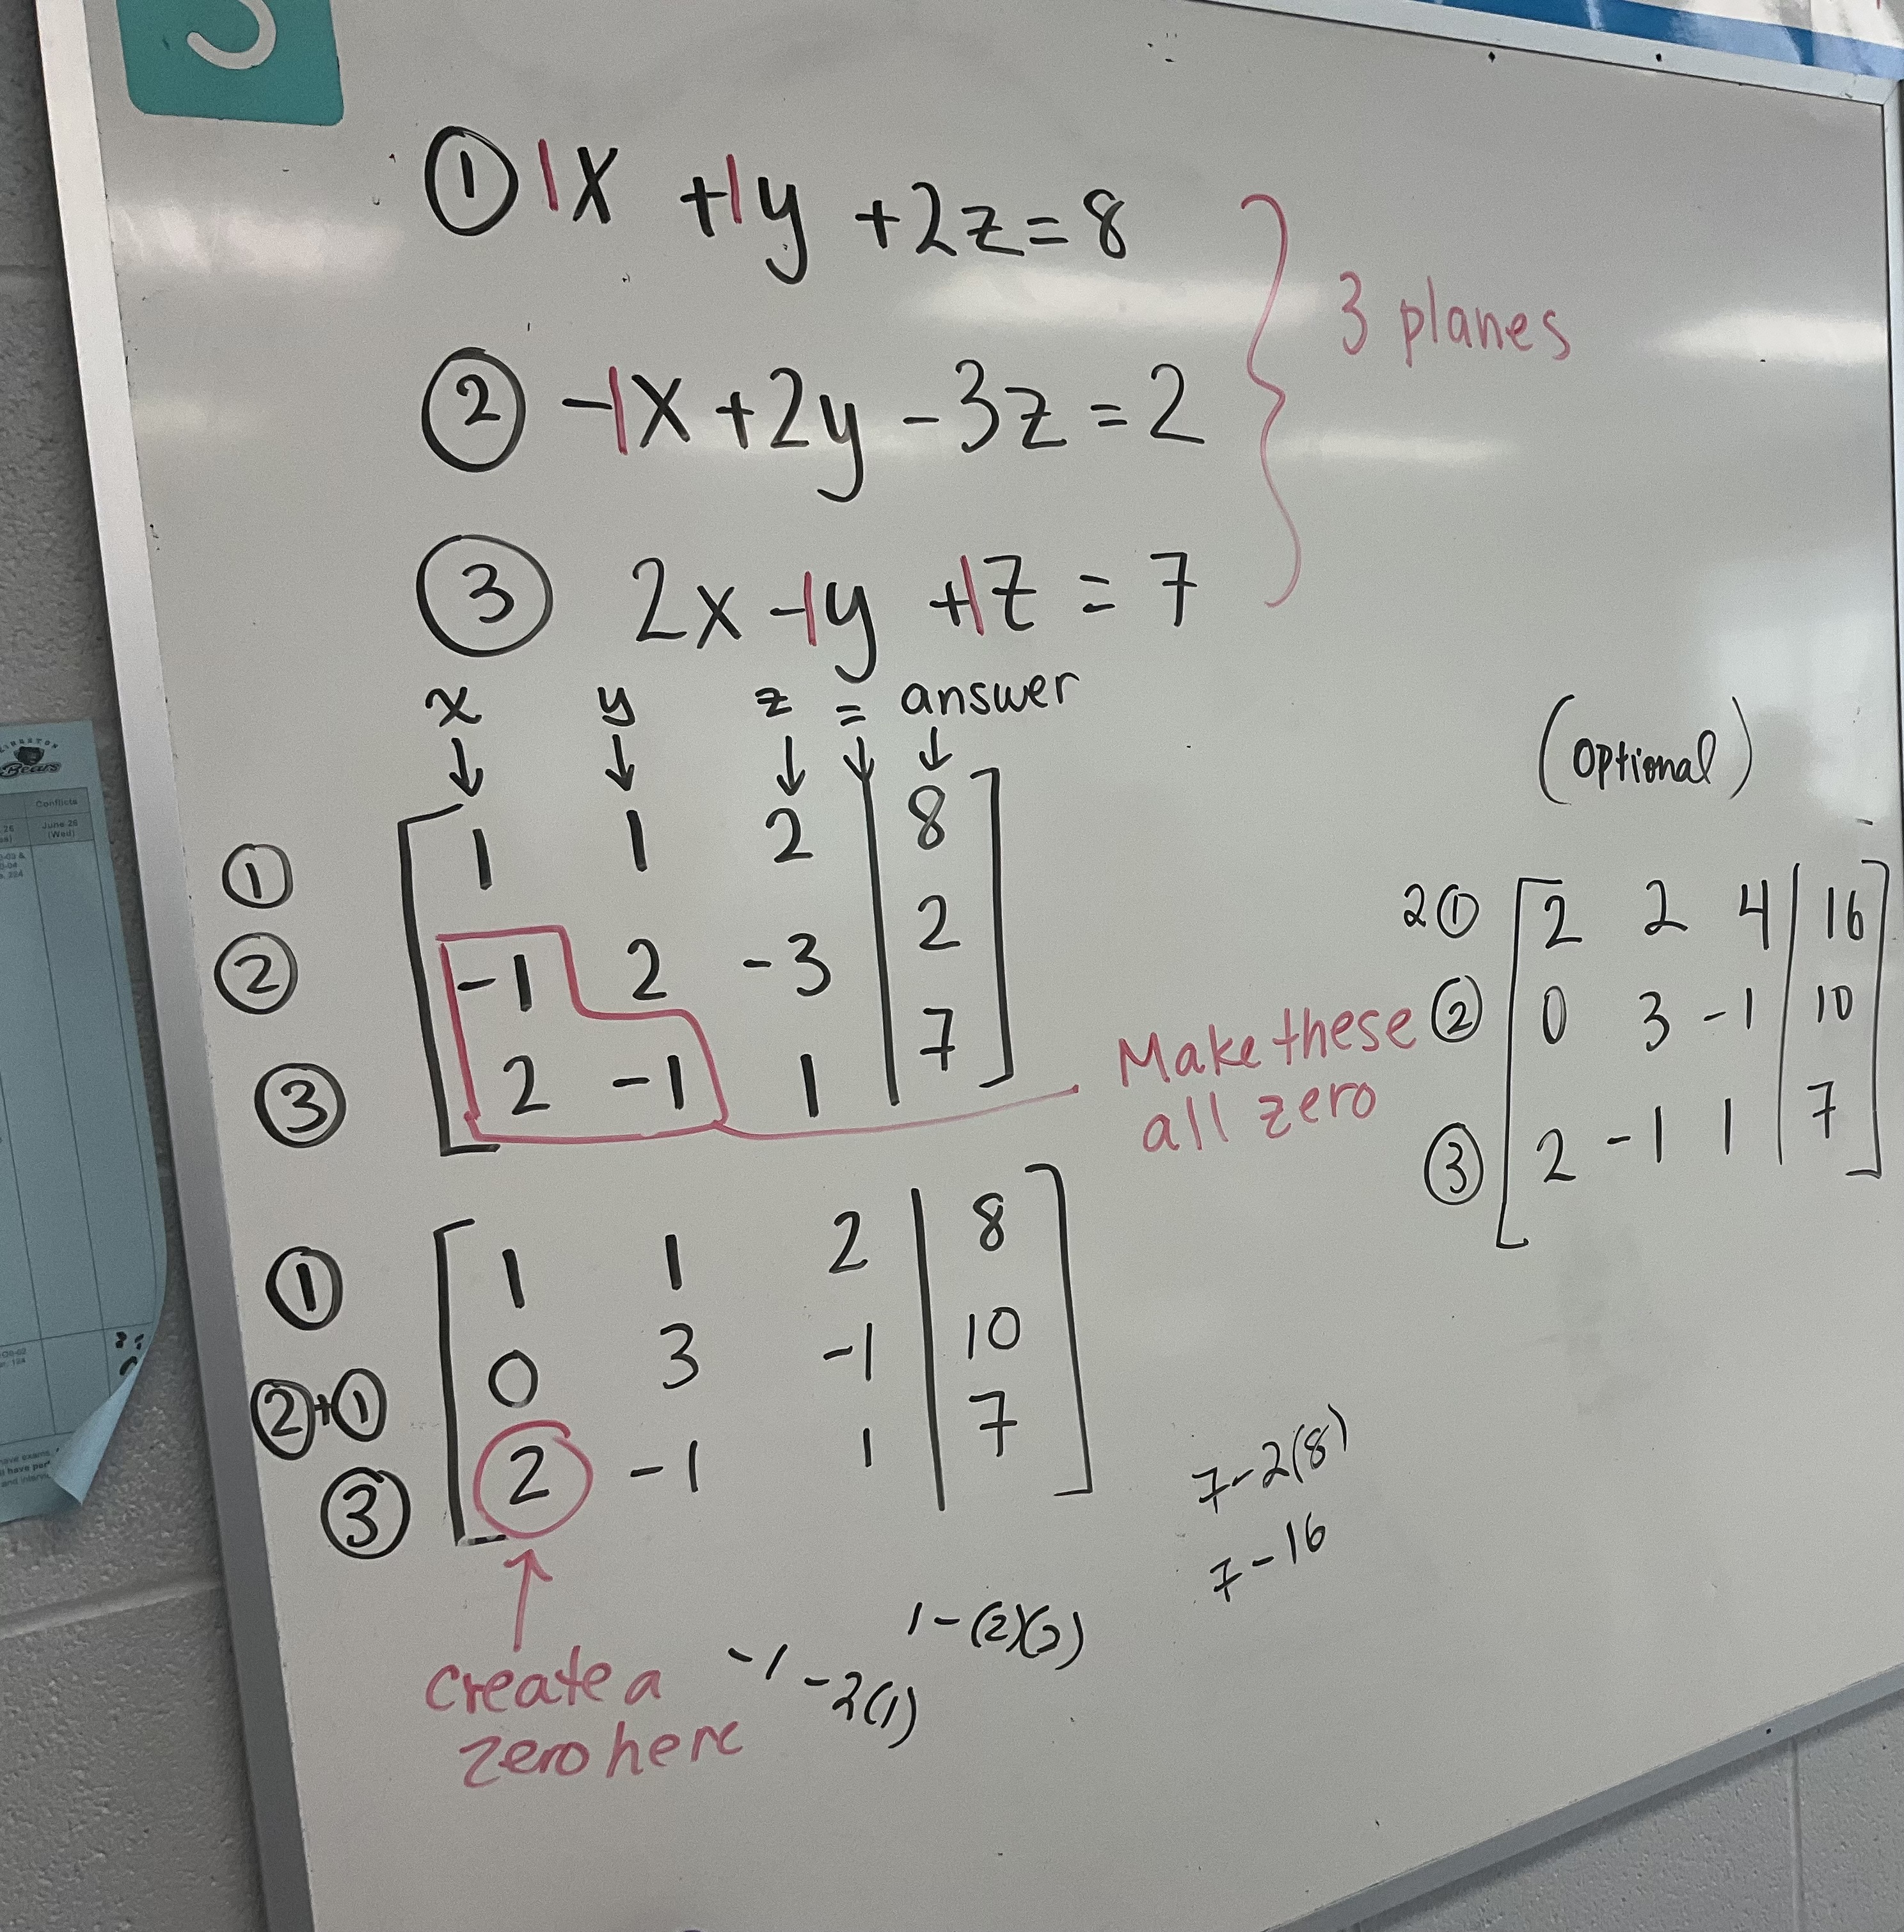
We dove in to matrices today and solved a system of 3 equations in 3 unknowns.
We are getting good at making the bottom left corner into zeros, and now we know how that will help us solve the system.
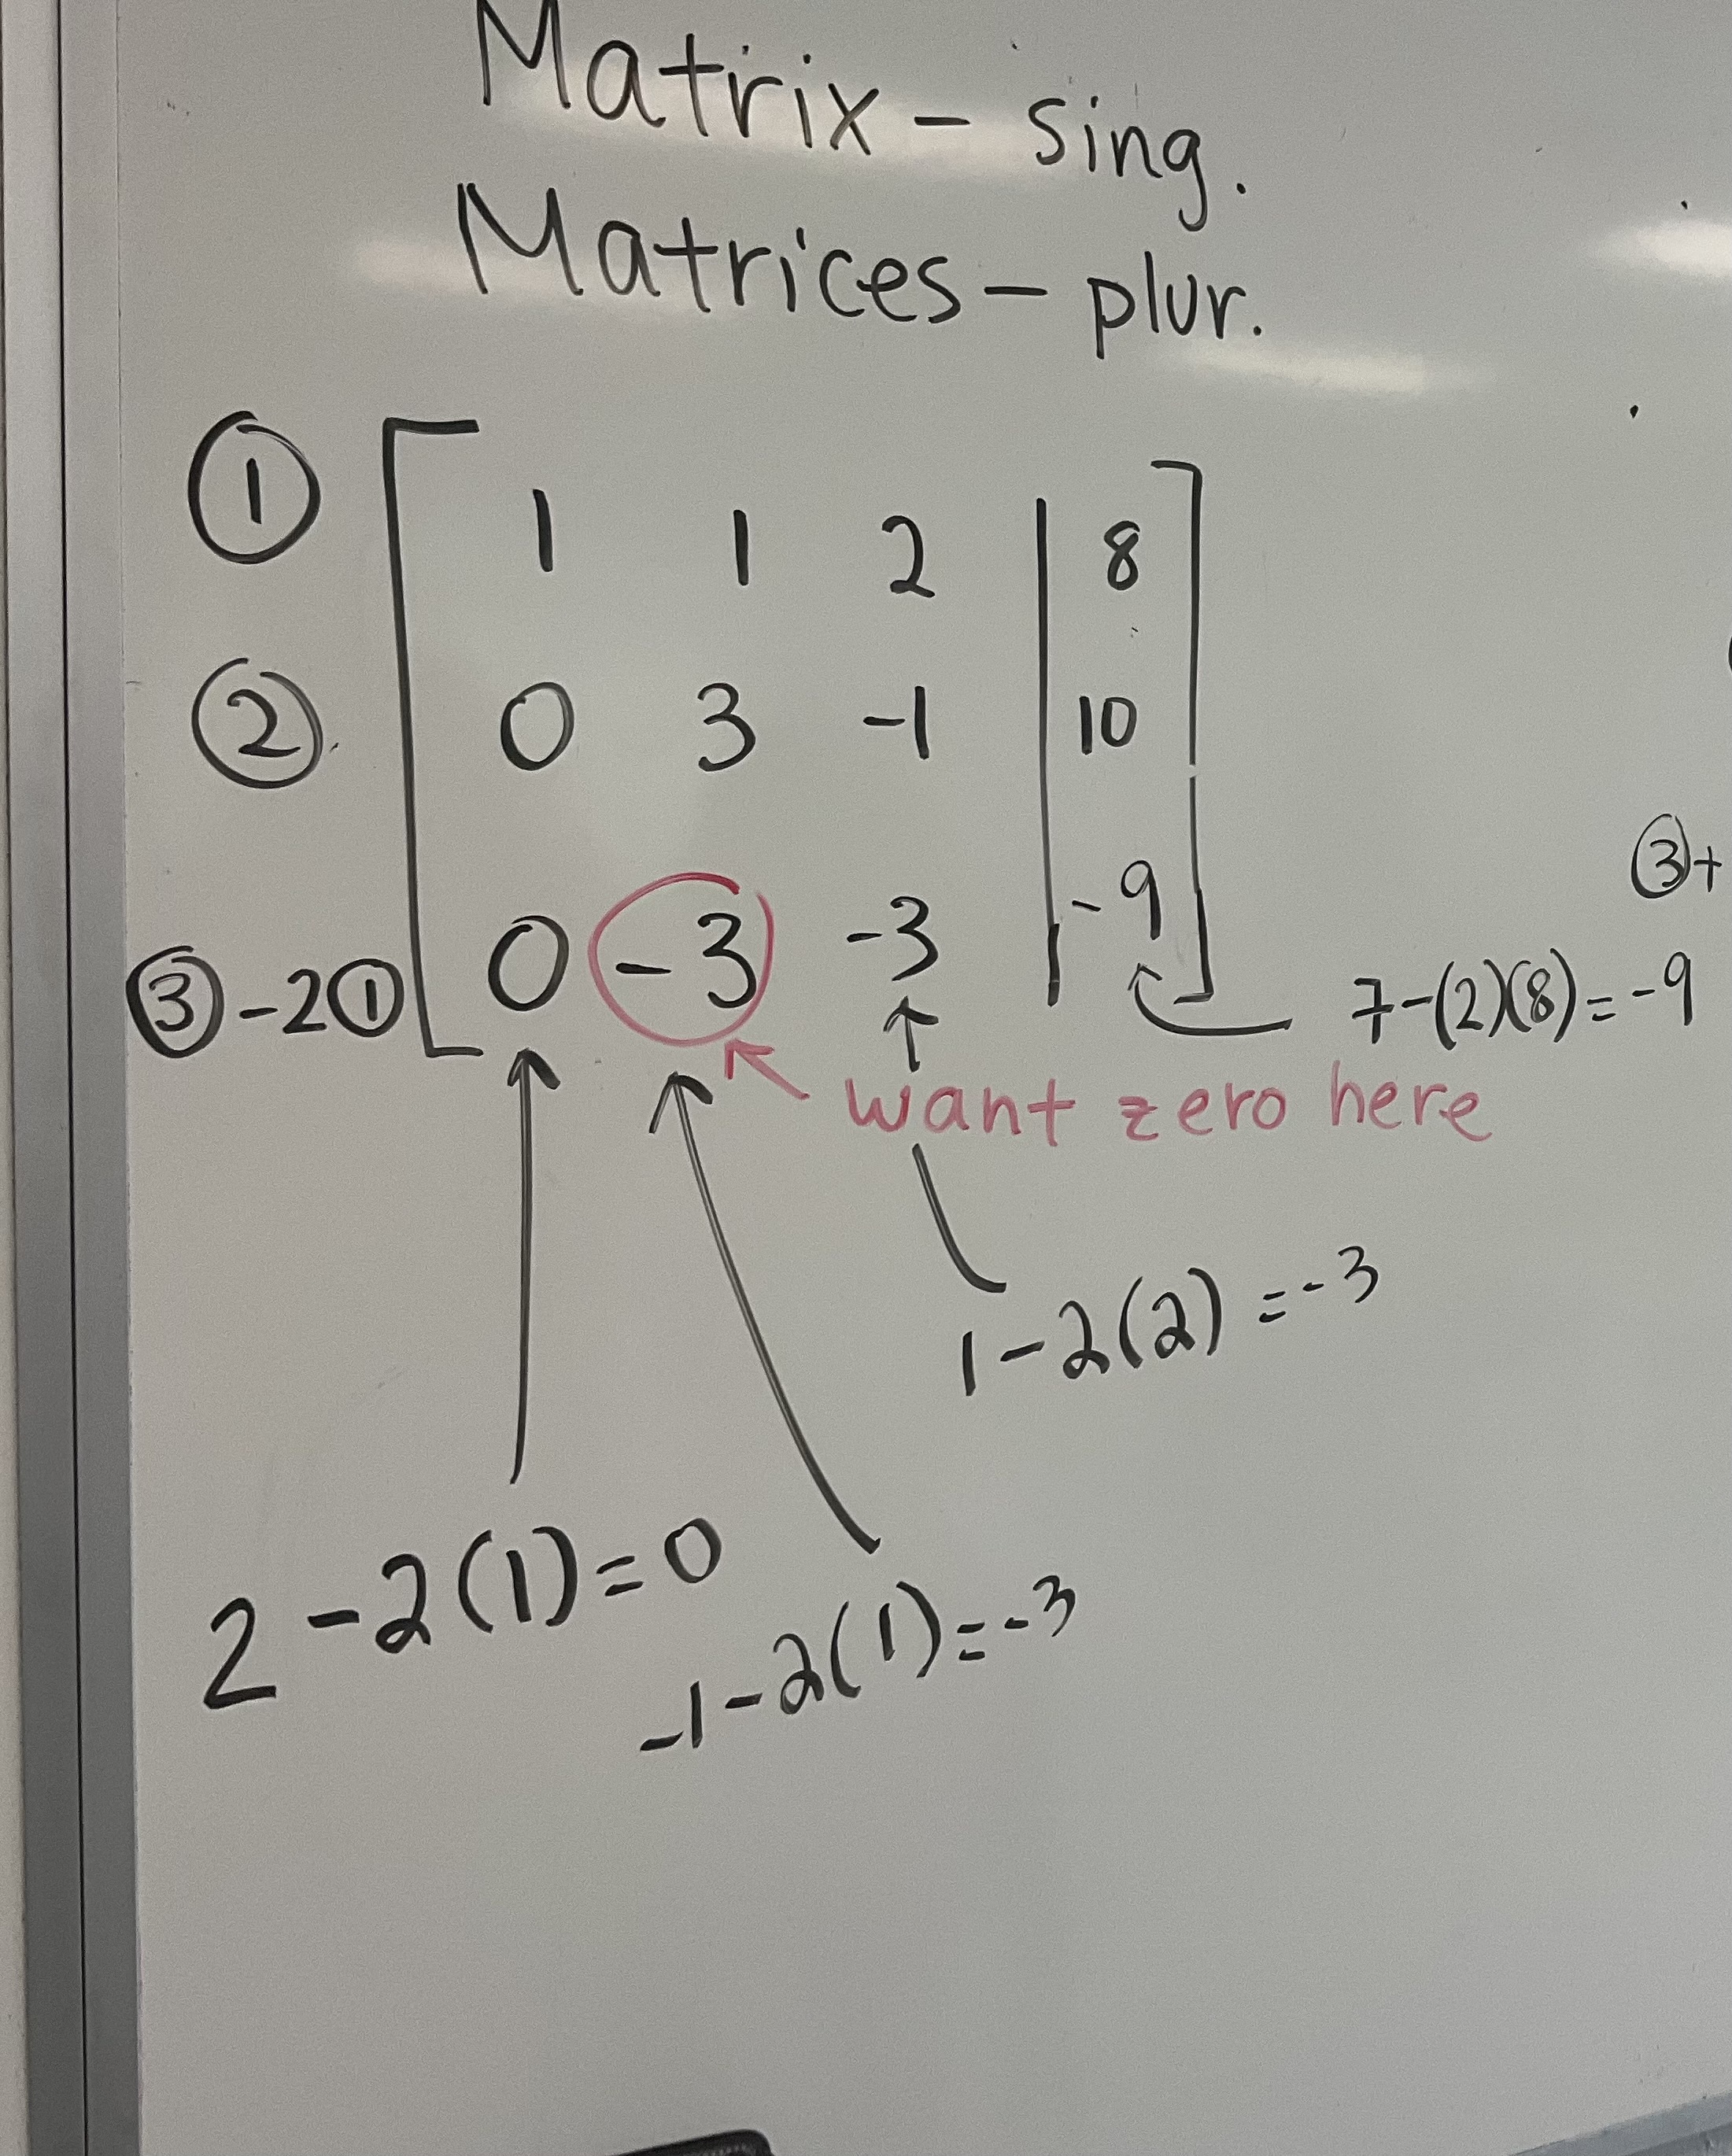

Once we have reduced our matrix to this point, we can jump back into equations to arrive at the final solution.


Something new this year that I’ve been exploring is the desmos 3D graphing. It is powerful to see that this solution is actually the intersection point of the 3 planes we started with.
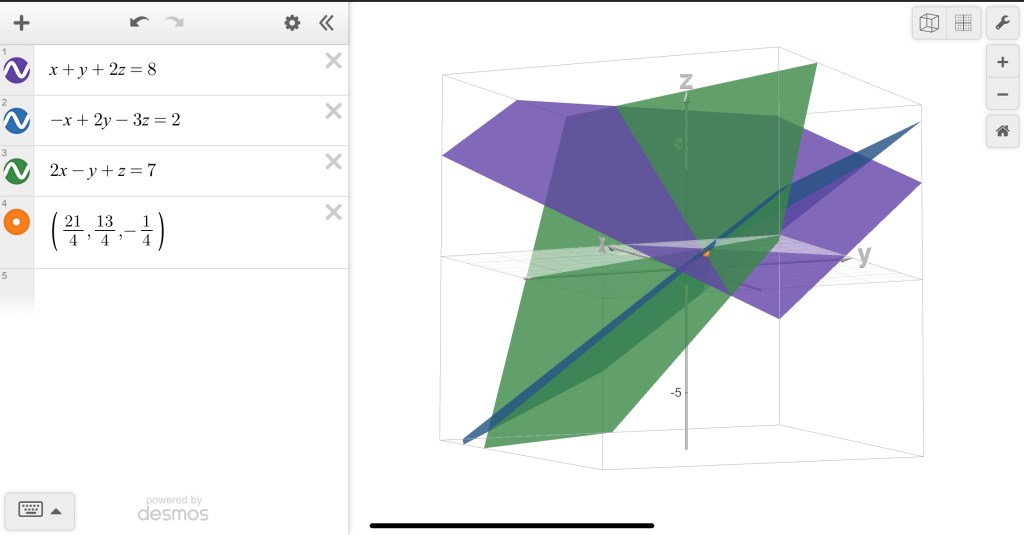
here is a link to the desmos graph so you can interact with it and try it out.
Understanding Bias in Algorithms

Grade 9s looked at several articles today and we practiced marking up text and summarizing. We talked about strategies good readers use to interact with the text, and then we broke off into smaller groups jigsaw style to read and learn from several articles.

One article talked about pulse oximeters registering different values depending on the skin’s melanin content (because melanin is interpreted as higher hemoglobin counts and higher oxygen content of blood), so algorithms and devices have a built in bias. Another article talked about how AI can be a big help, but if it is trained on biased materials, it will reinforce and amplify the bias. Another talked about how data security is important, and how people should consider what health information is entered onto apps, using the example of period tracking apps in the United States where abortion is becoming more illegal in certain states. Another talked about data security of apps like tiktok where foreign countries can have influence and access.
We had some interesting discussions, and some students are rethinking which apps they are using, and who may have access to their information. We also recognize the importance of having a diverse group of people represented at the coding table!
Math Is Everywhere!
In MTH1W we are working toward our exam and culminating task. Our exam will be similar to our tests, a menu of mild medium and spicy questions covering the many strands of the course. Our culminating task will be quite different from that. It is something we explored 8 years or so ago, but are going to try again, and streamline it differently this time.
To prepare for our culminating task we are practicing our skills of noticing and wondering.
Today my class looked at this image, and brainstormed the different ways that they can see math in this image, or the different math questions this image makes them wonder about. We also prompted them to think of the information that they’d need to solve the questions that they are wondering about.
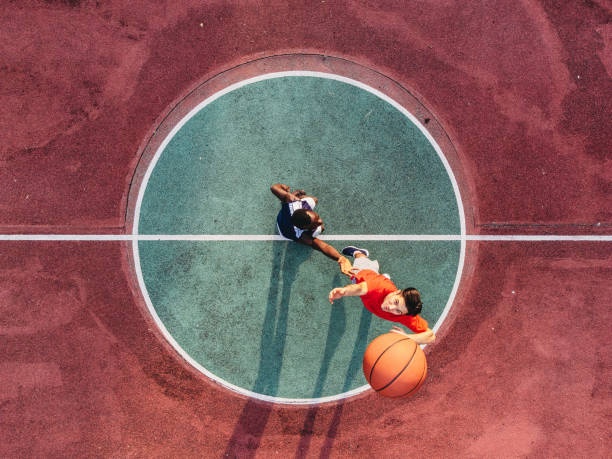
It was interesting to hear the students’ ideas. Many were interested in the circumference and area of the circle. Some were curious about the proportion of the image that was green compared to red. Some were noticing angles in the circle from the people, or their shadows. Others were curious about the basketball and how to calculate things about it, or how it compared to the circle on the ground.
As we approach our culminating task we will practice the skills of asking good questions about the math that we see in various images.
Our culminating task is inspired from an OAME presentation years ago, where students are presented with an image, and they are tasked with creating good questions about the image. The questions should fit within several key strands of the curriculum. For us this year it will be measurement/geometry, numeracy, and financial math.
Day 1: Students will be in groups to examine the image, and create a mild/medium/spicy question for each of the 3 strands. They will also decide on what information they’d like to ask us for. While in groups they can brainstorm ways to solve the questions that they are creating. Groups will submit their questions, and their information request at the end of the class.
Day 2: Students will be working independently. They will receive a copy of their group’s questions, along with the answers to the information requests that they submitted. Students will choose to answer the mild/medium/spicy question for each strand, and submit their work at the end of the class.
Students will be evaluated on the depth of question that they asked as well as the answers that they determine using the provided information.
We are trying to value the group work that we do all the time in class, and the practice that we have been using frequently of “noticing” and “wondering”, and asking for more information. We hope that this culminating task will allow students to show skills that they can’t show on an exam.
Welcome to the Matrix
In Calculus and Vectors we are working on solving systems of equations to tell us points of intersection of lines and planes. We will need to solve a system of 3 equations in 3 unknowns. To get us geared up for that challenge we looked at the 3 act task “tech weigh in” (sequel).
For those new to 3 act tasks, there is usually an intro video to get us thinking. We watch the video and notice things and wonder things.
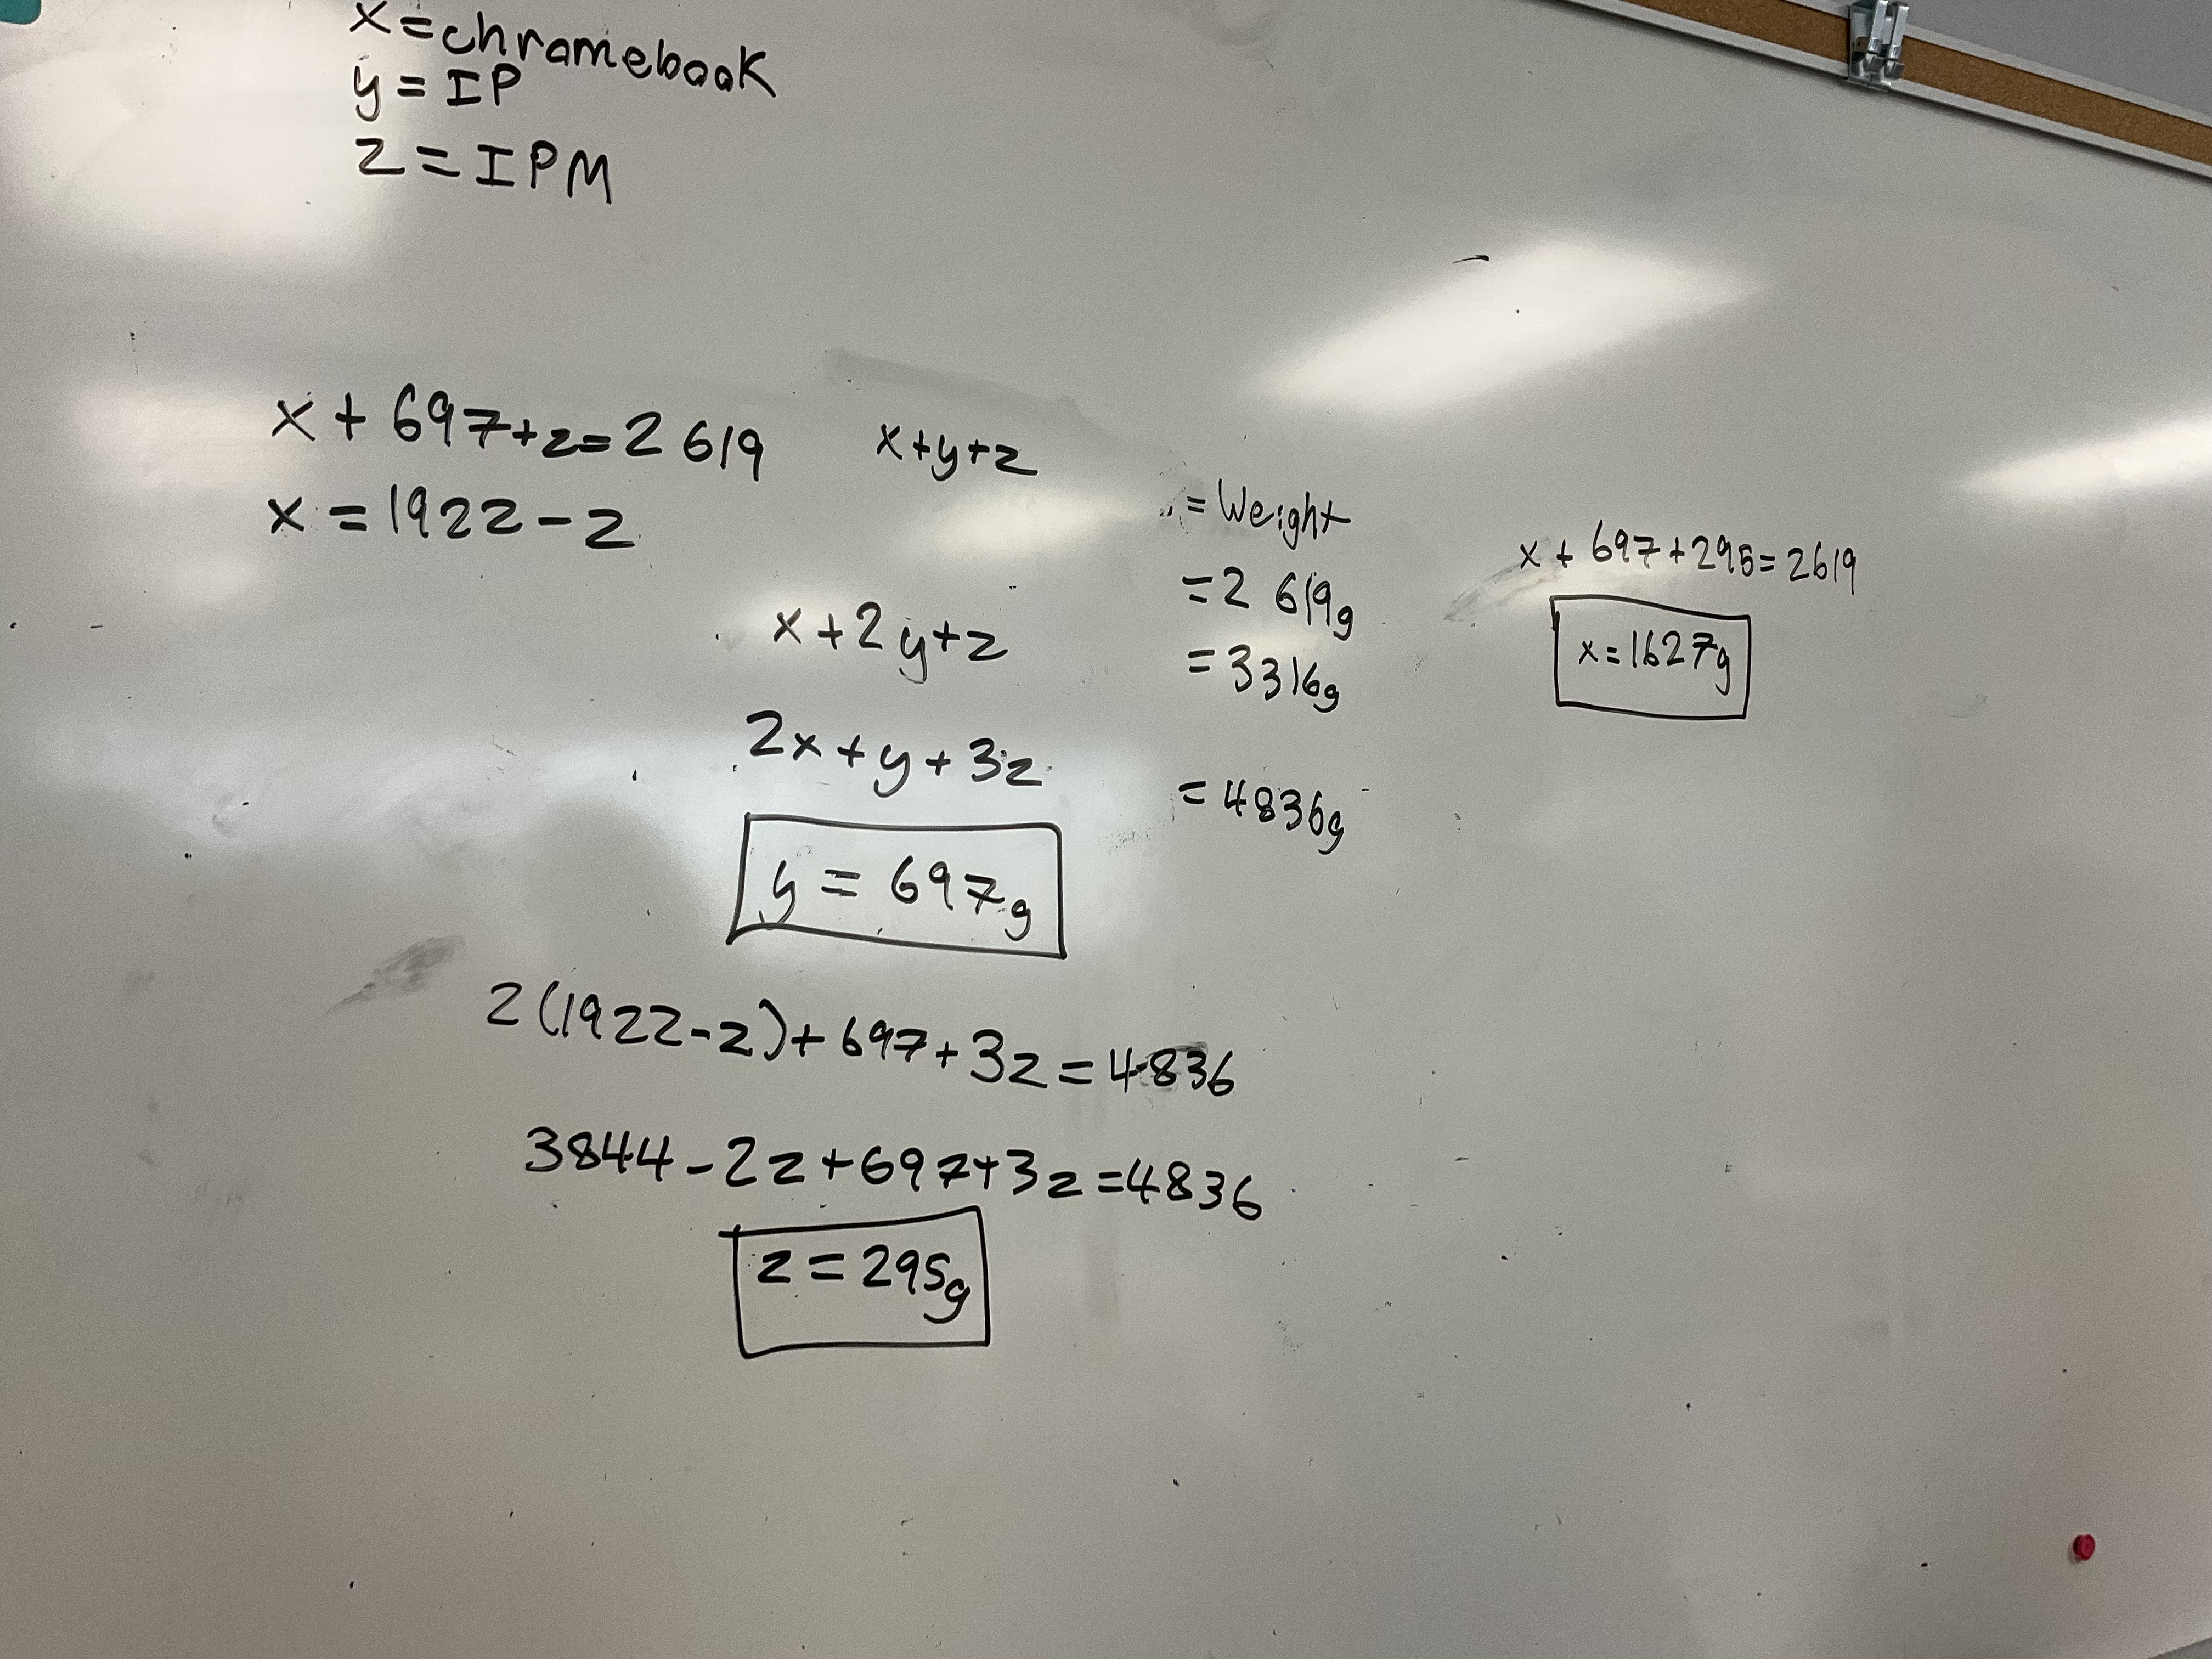
Act 2 brings more information, often at the request of students. They know that the first video didn’t have enough information in it, so the next videos provide more details that can be used to calculate something. In this case, it is the mass of an iPad, a Chromebook and an iPad mini.
My students knew that for 3 unknowns they needed a lot of information. They knew to keep asking for more scenarios!
3 unknowns need 3 equations, so here is the 3rd scenario.
Now that we have 3 situations, we can create 3 different equations to solve for our 3 unknowns.

Some groups went directly to elimination. This is a great task to use as an intro to elimination as the equations seem to invite that solution method, and students intuitively take that path.

Others use substitution, but in the end we all get to the answers no matter the method. We look to streamline our communication though, and we notice that some methods are more direct than others.
In the end we can watch the 3rd act to verify our answers.
We are working towards solving systems of 3 equations and 3 unknowns because we will be looking for the intersection of planes in the near future, using the Cartesian equations in the form Ax+By+Cz+D=0.
At the end of the lesson today we started to look at what a matrix is, and how to write them. We will practice using them in the coming days to keep our calculations organized so we don’t go around in circles like some of us experienced today!
Catapults Day 2

We spent time today calculating the x intercepts and the vertex for our catapult trajectories.

We made graphs and made predictions about where to place the catapult if we were going to aim for a target on the floor, or if we were aiming for a target on a chair.
One group even tackled the situation where we’re catapulting a pompom onto an angled surface.

By using their understanding of slopes and angles and trigonometry they used the tan ratio to solve their problem, and then it continues to be a quadratic problem which we’re getting really good at solving.

Our individual portion of the culminating task is coming up next week, where we will do similar analysis using a new set of data.
Finishing our beading
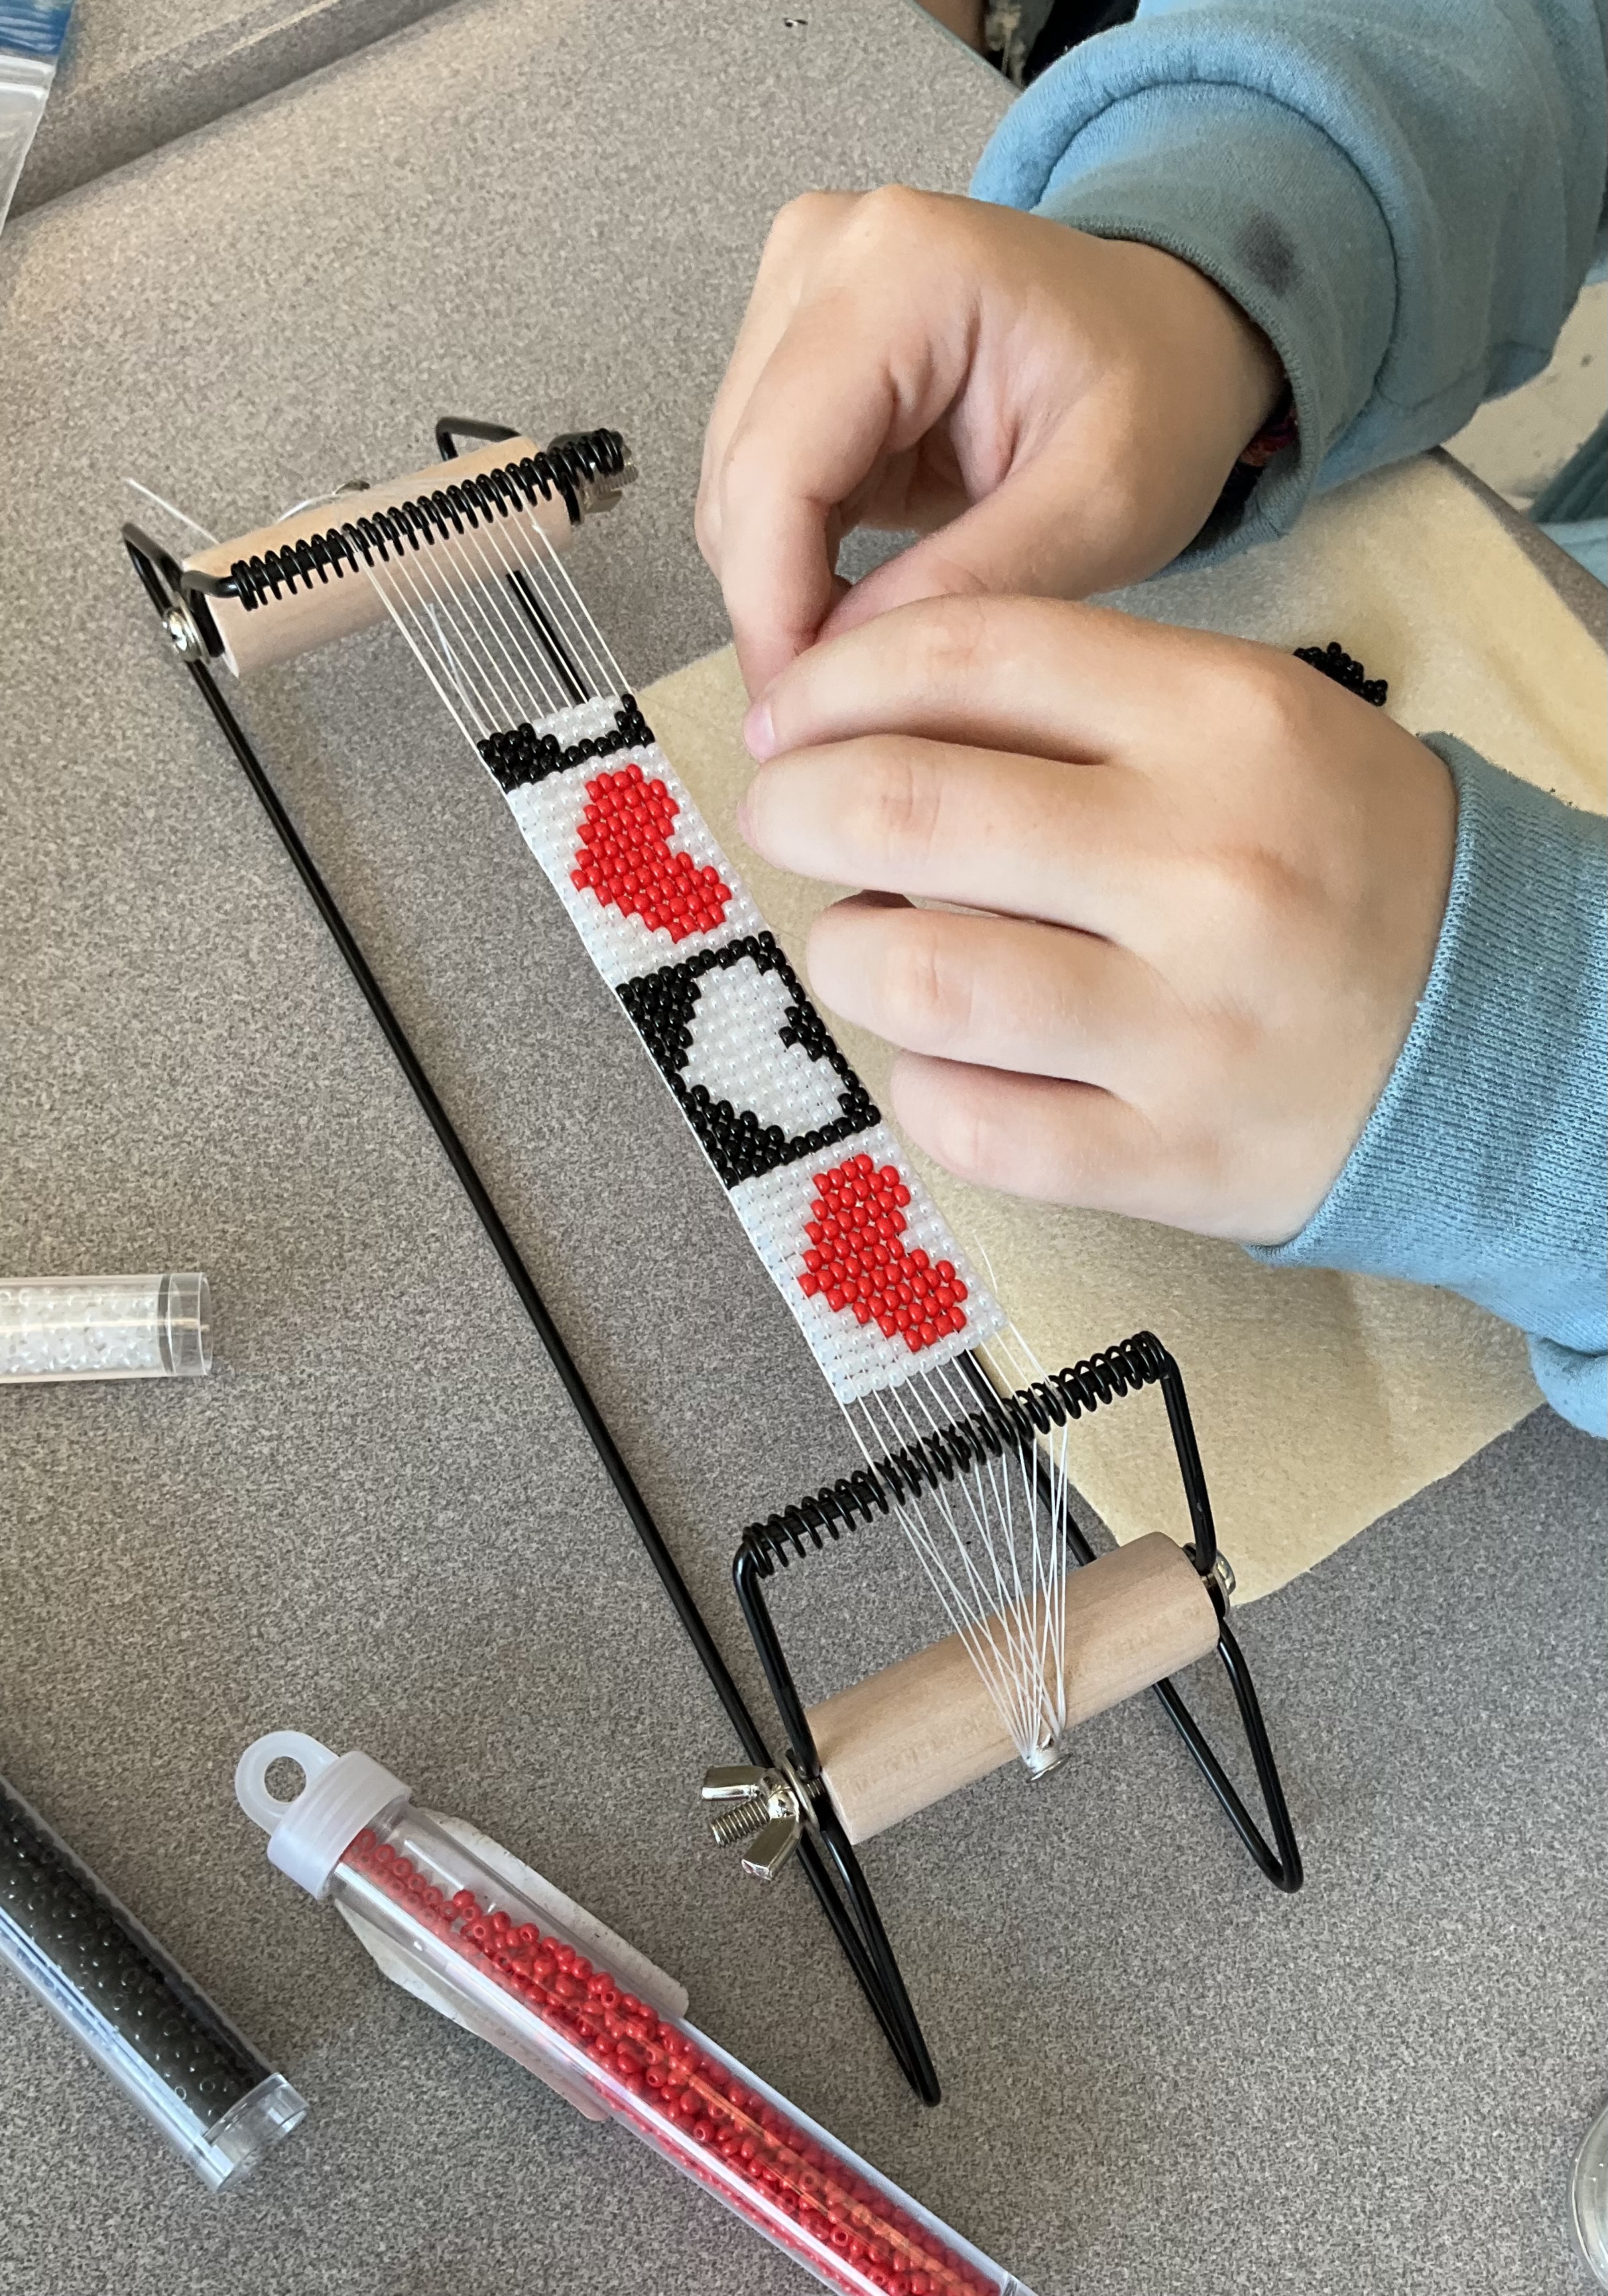
We paused our beading progress for a while, but were working hard today to finish them up, and add glue and leather. We needed to weave the thread back and forth for about a centimetre which secures the threads and gives a surface to attach the leather end pieces and ties.
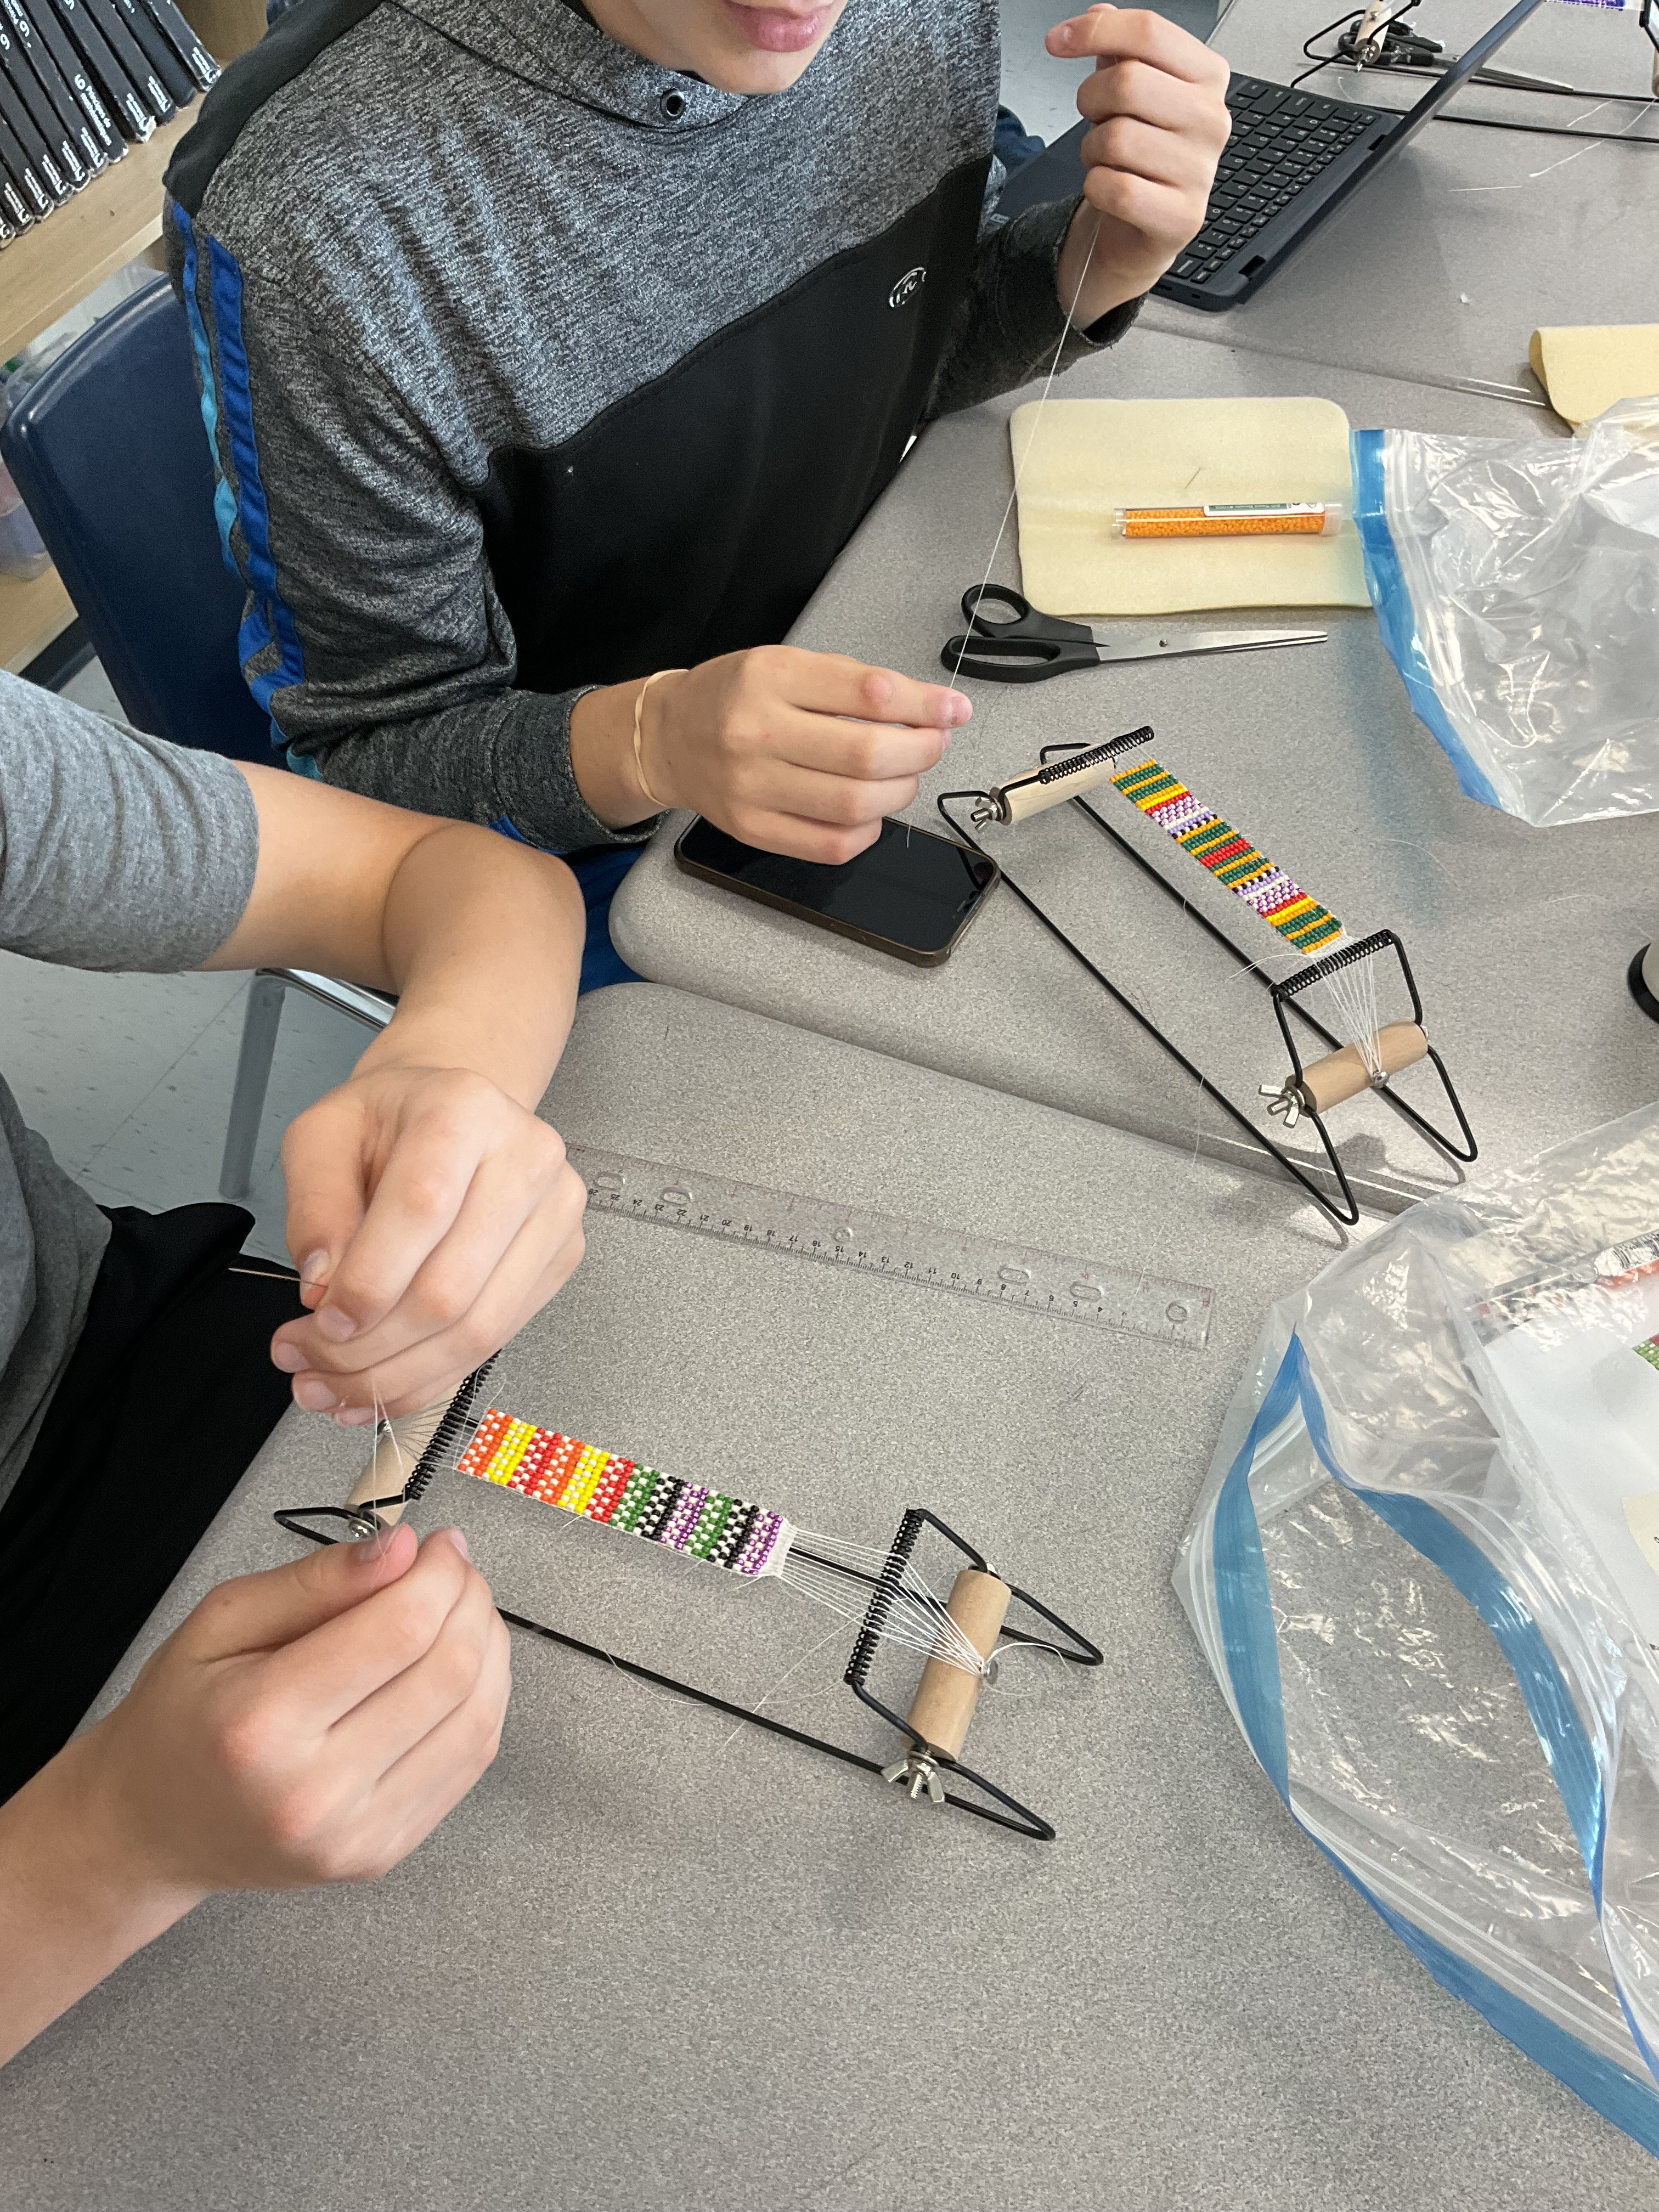

We glue the threads to keep them stabilized, and then we glue the leather on the ends.
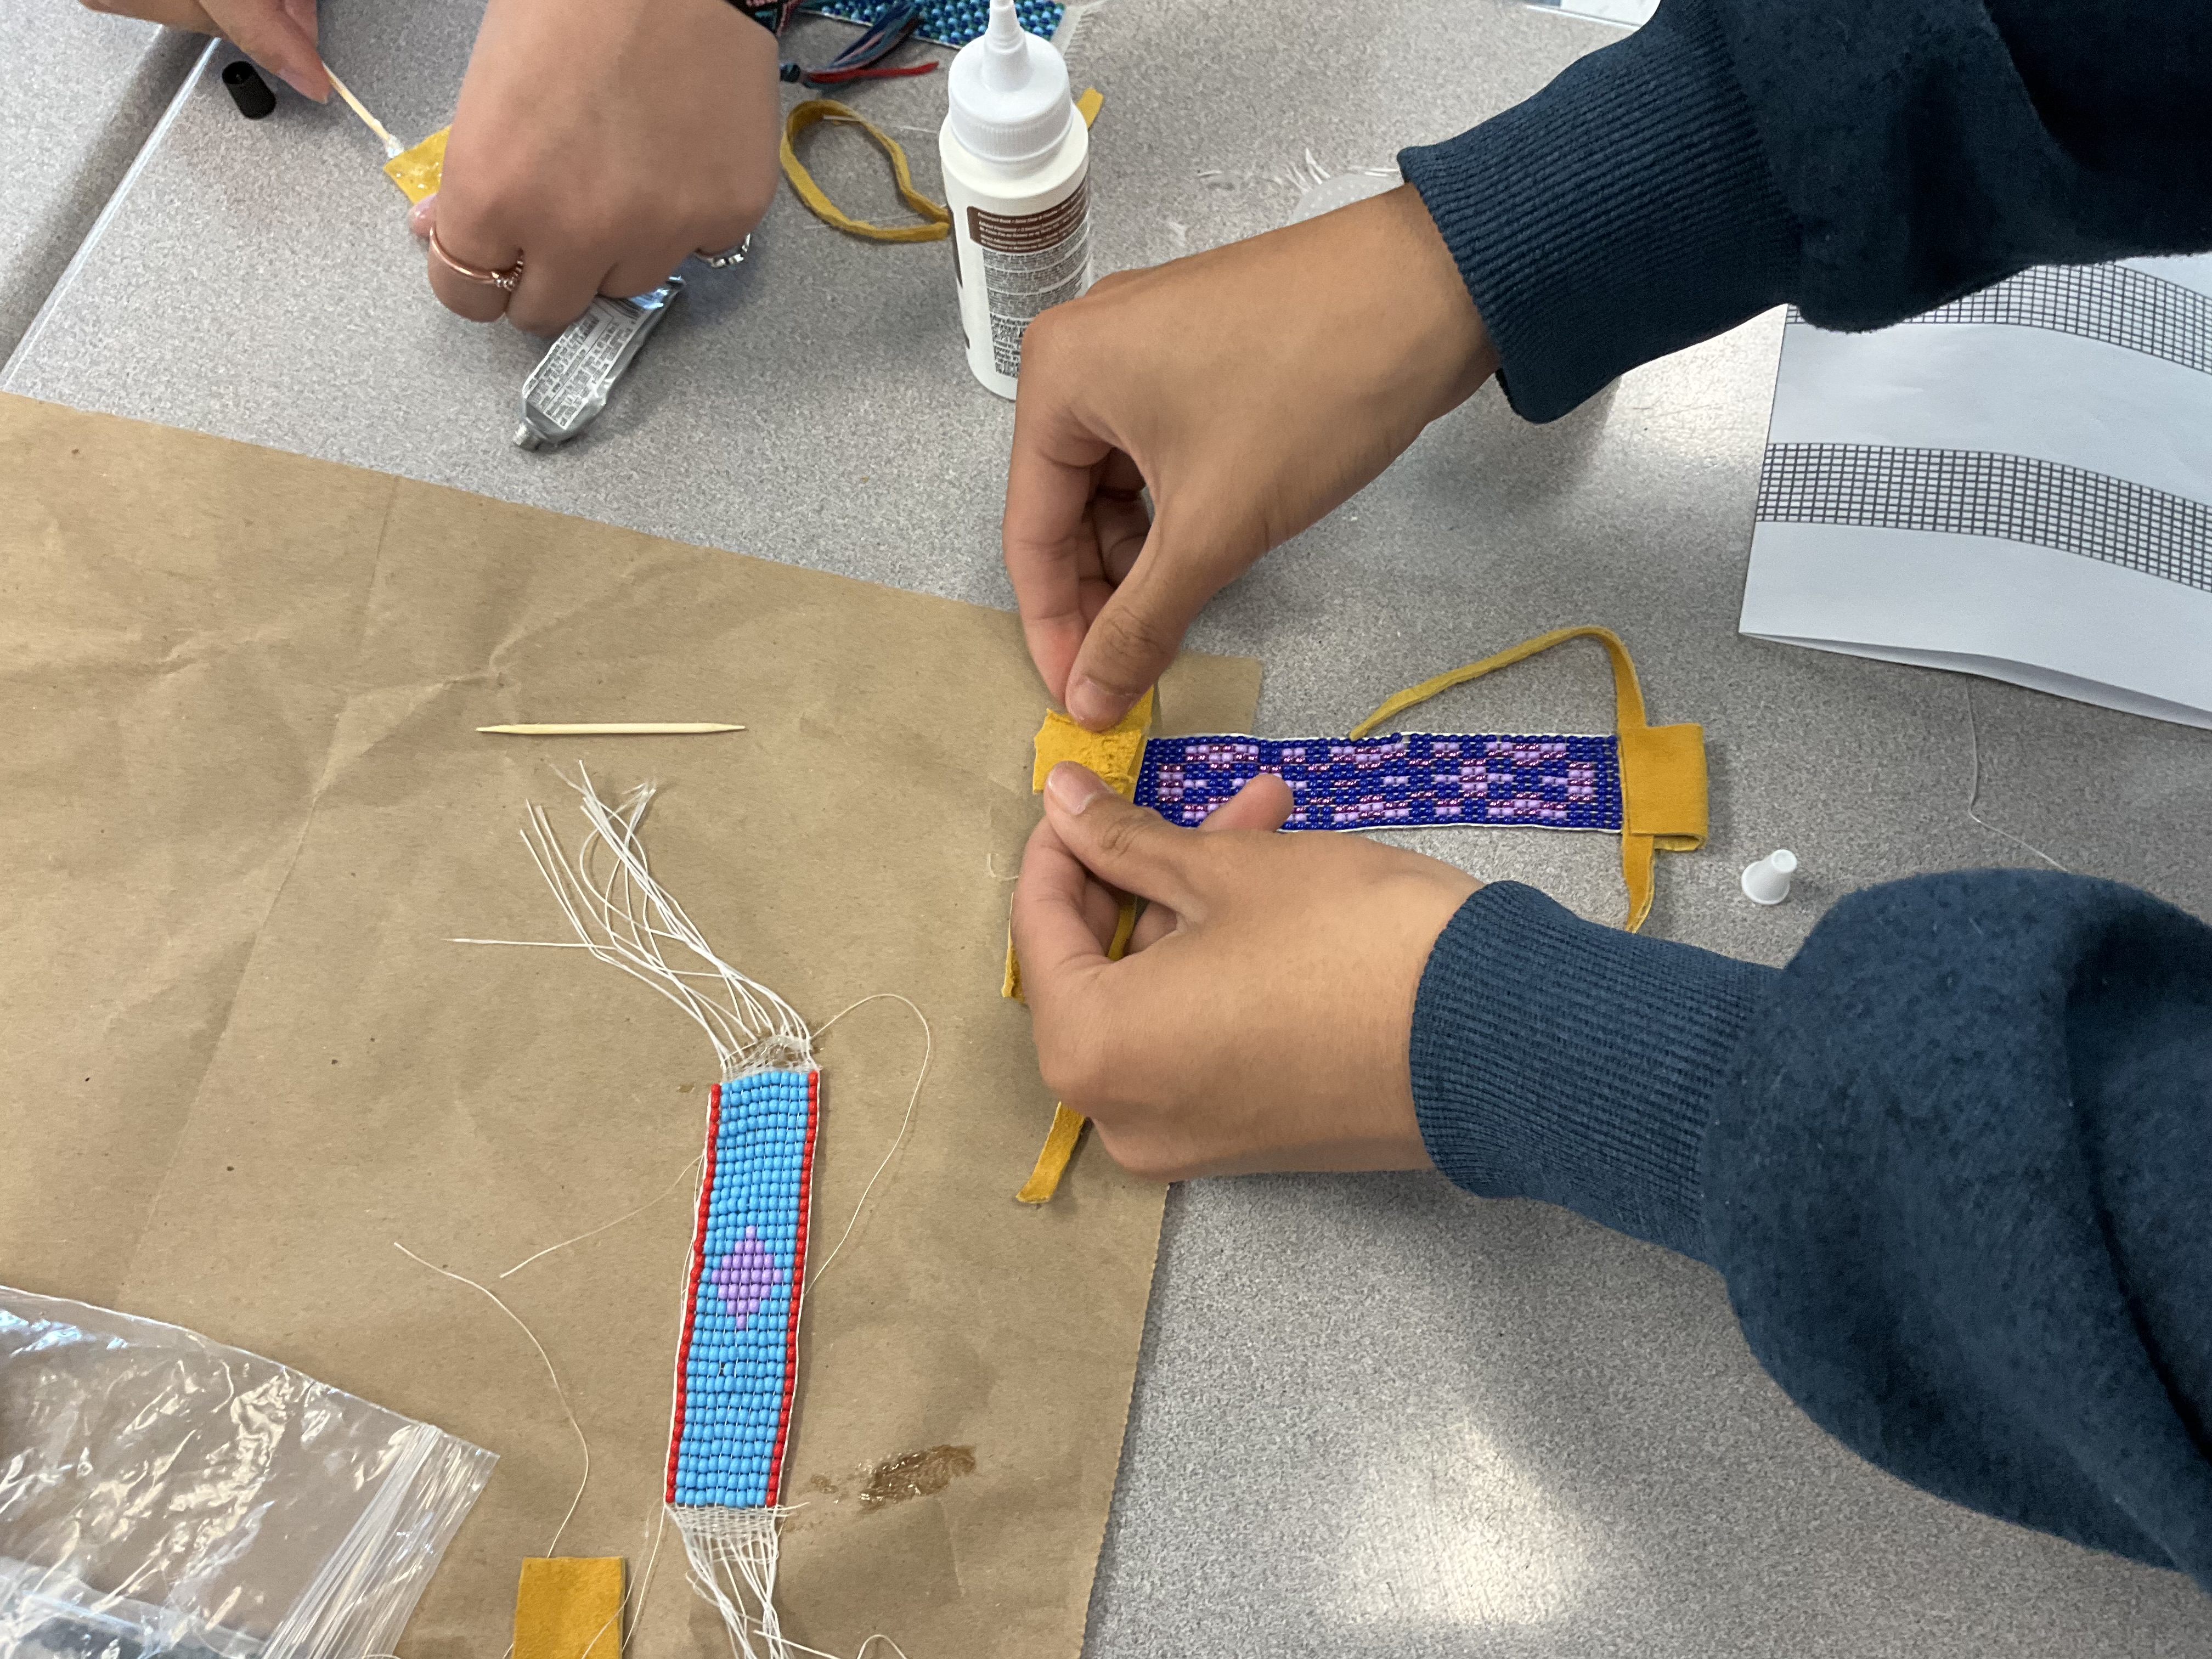
We’re putting together a document to share our photos and explain the math that we see in the designs.
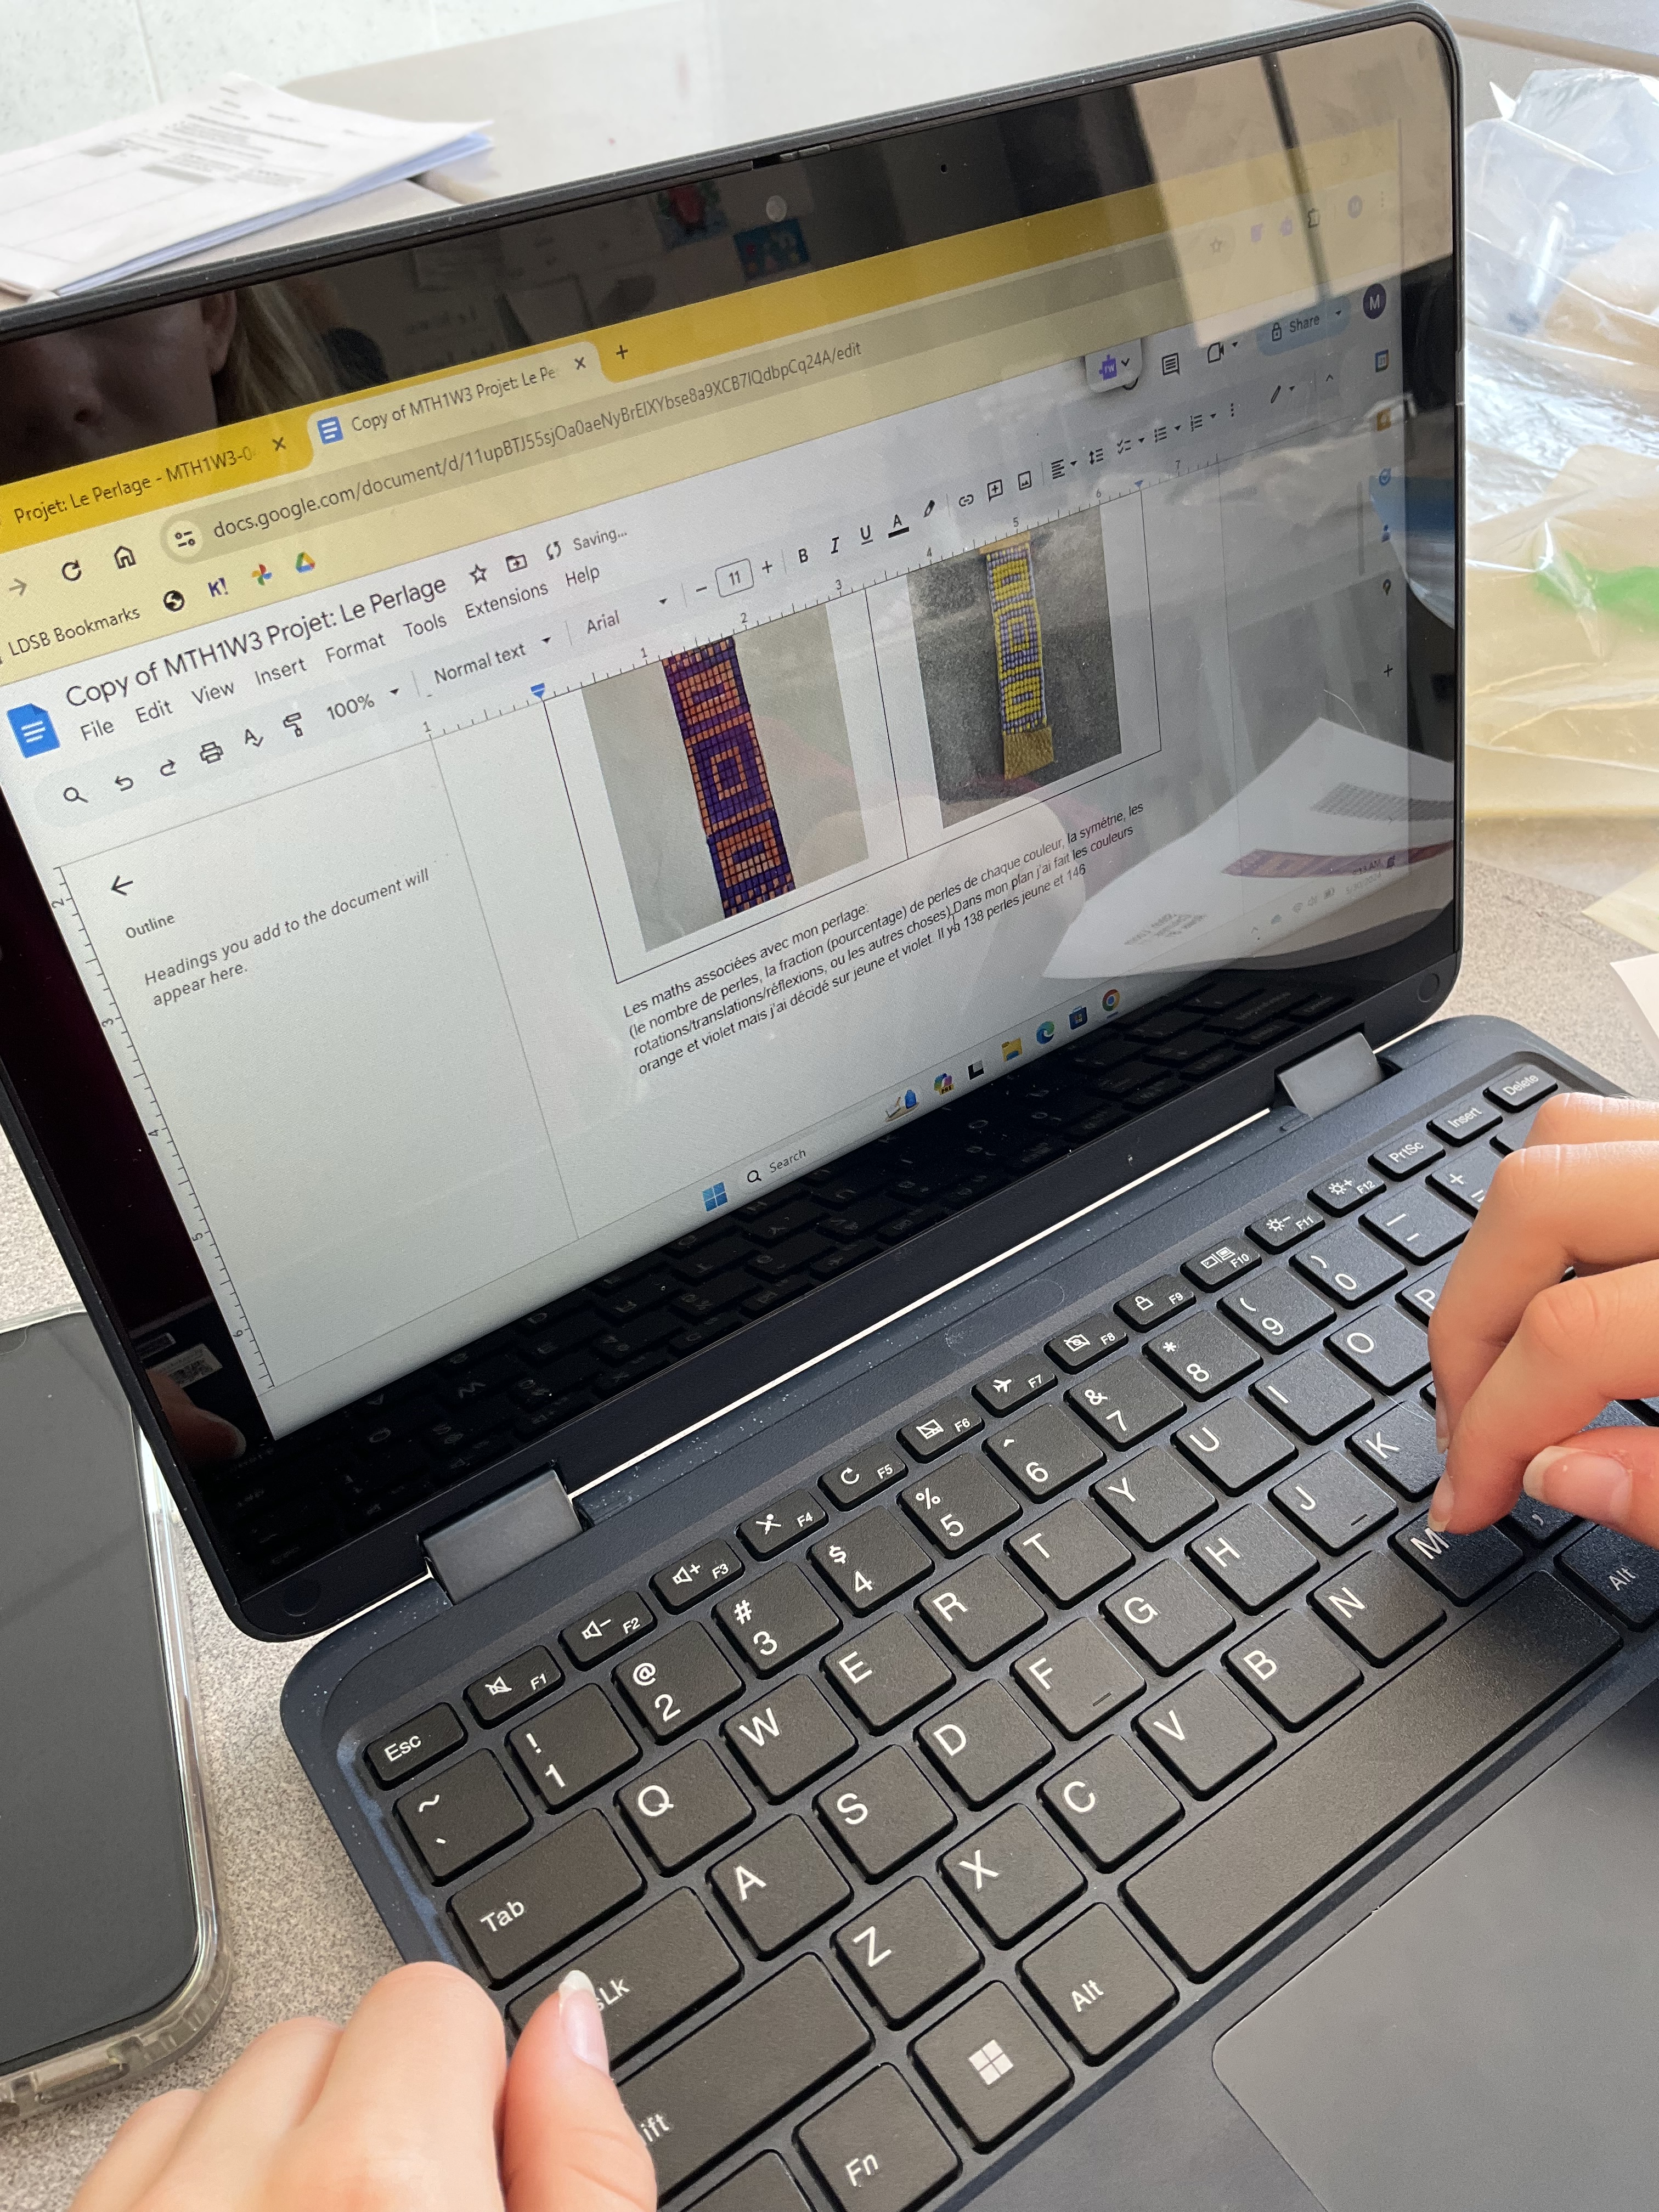
We have learned a lot through doing this project, both about beading and about patterning and about fractions and percents, and symmetry. We also learned about managing our time and emotions and persisting with a task over a period of time.
Catapults as a Culminating Task
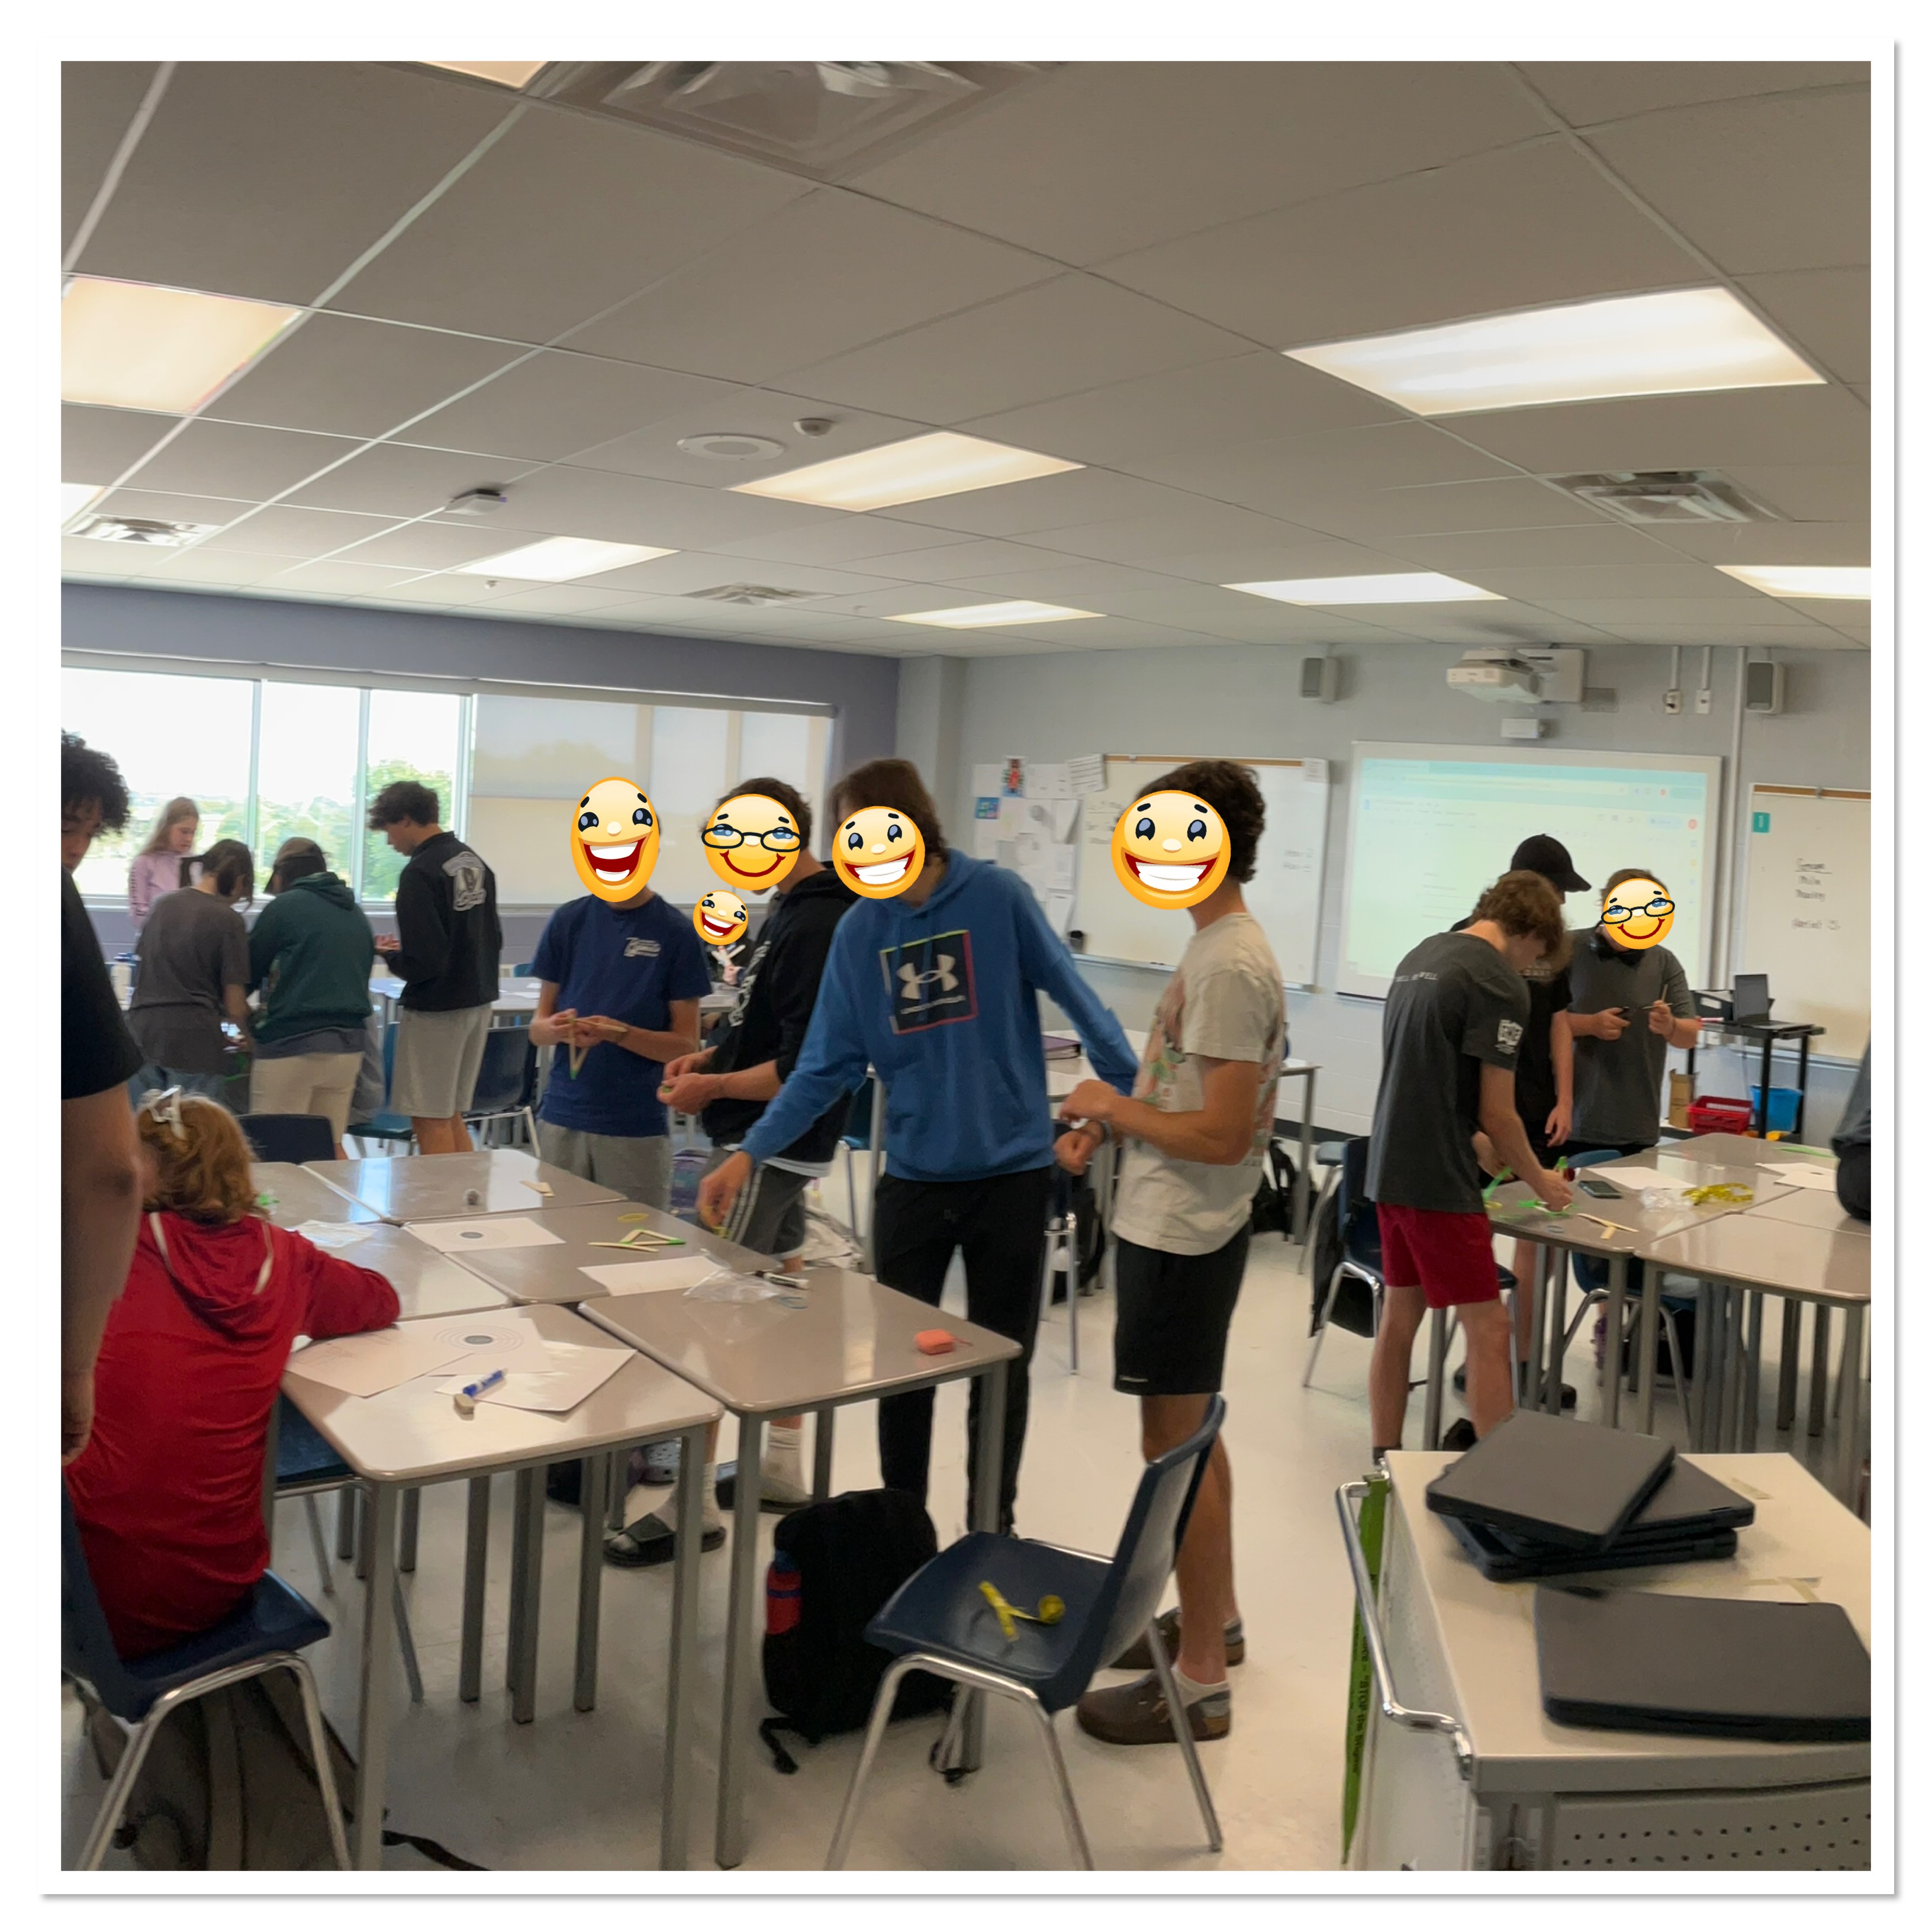
In Grade 10 math we’re working towards our mastery of quadratics and problem solving, and are currently analyzing the trajectory of a pompom flung from a catapult as our culminating task for the course.
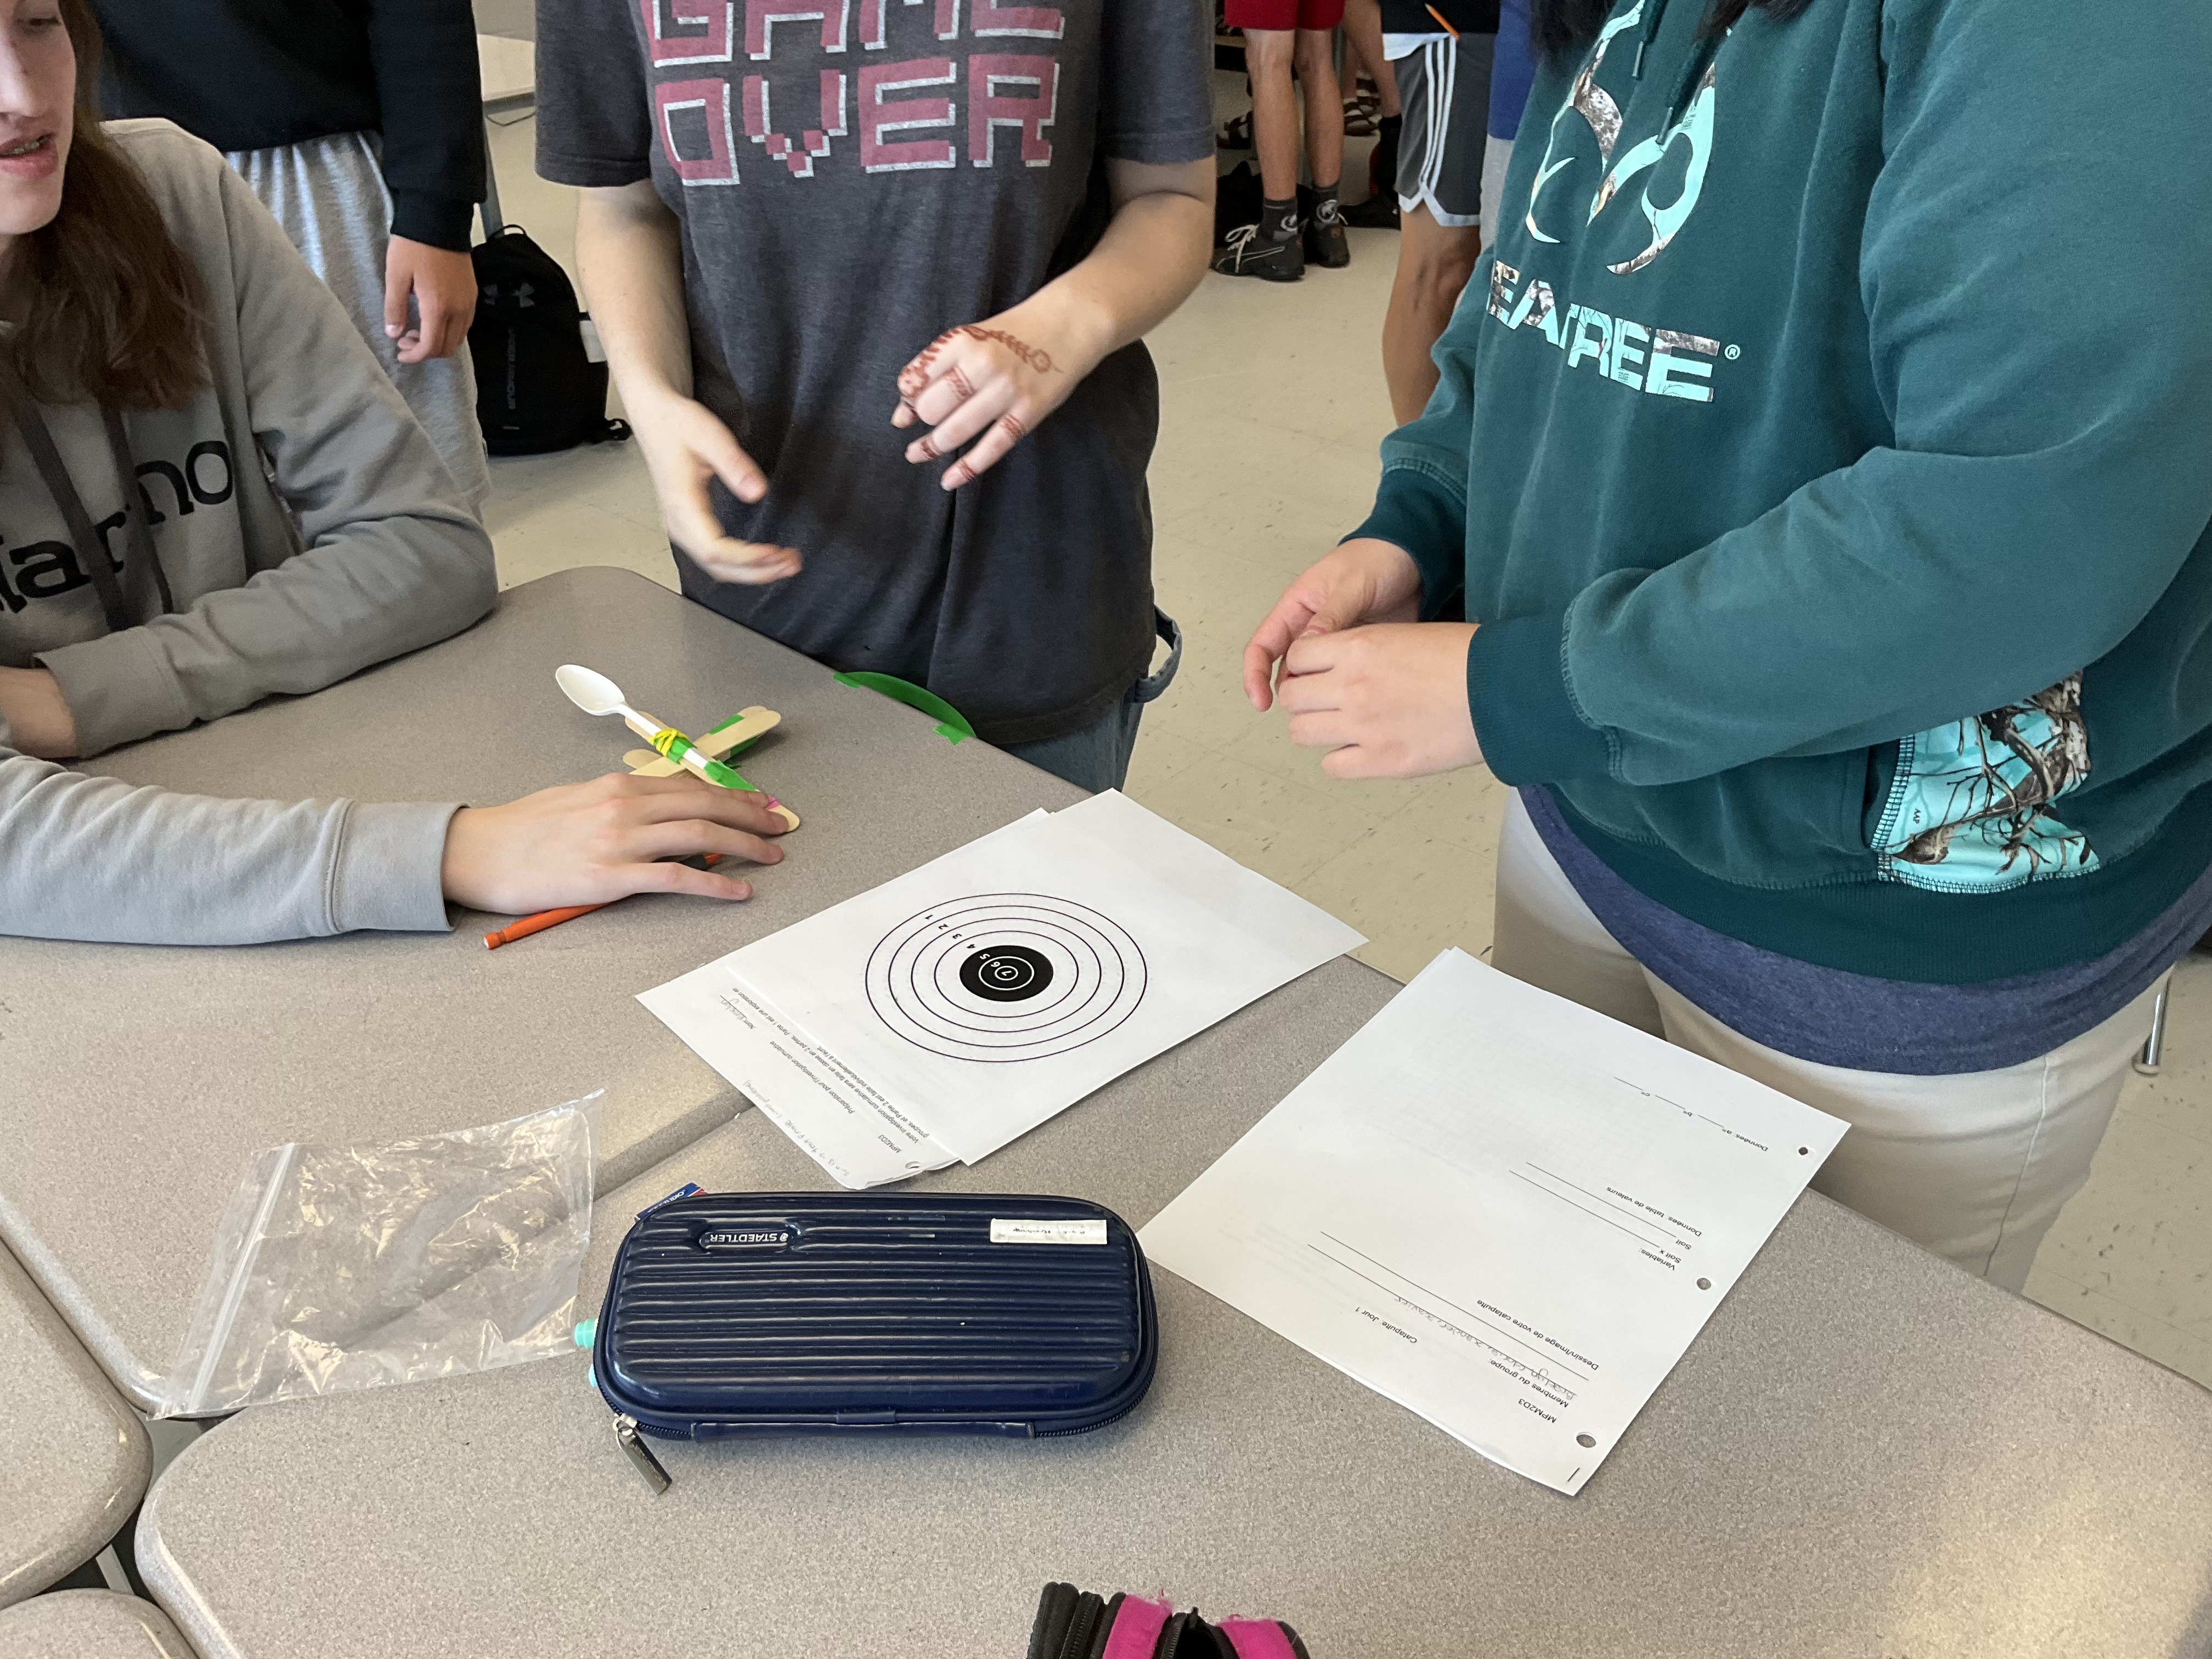
Each group of 4 students got a small sandwich bag with 10 popsicle sticks/tongue depressors, 3 elastics, a plastic spoon and a pompom. Each group also got some tape, a measuring tape, a print out of a target, and a work package to help them direct their learning and organize their information.
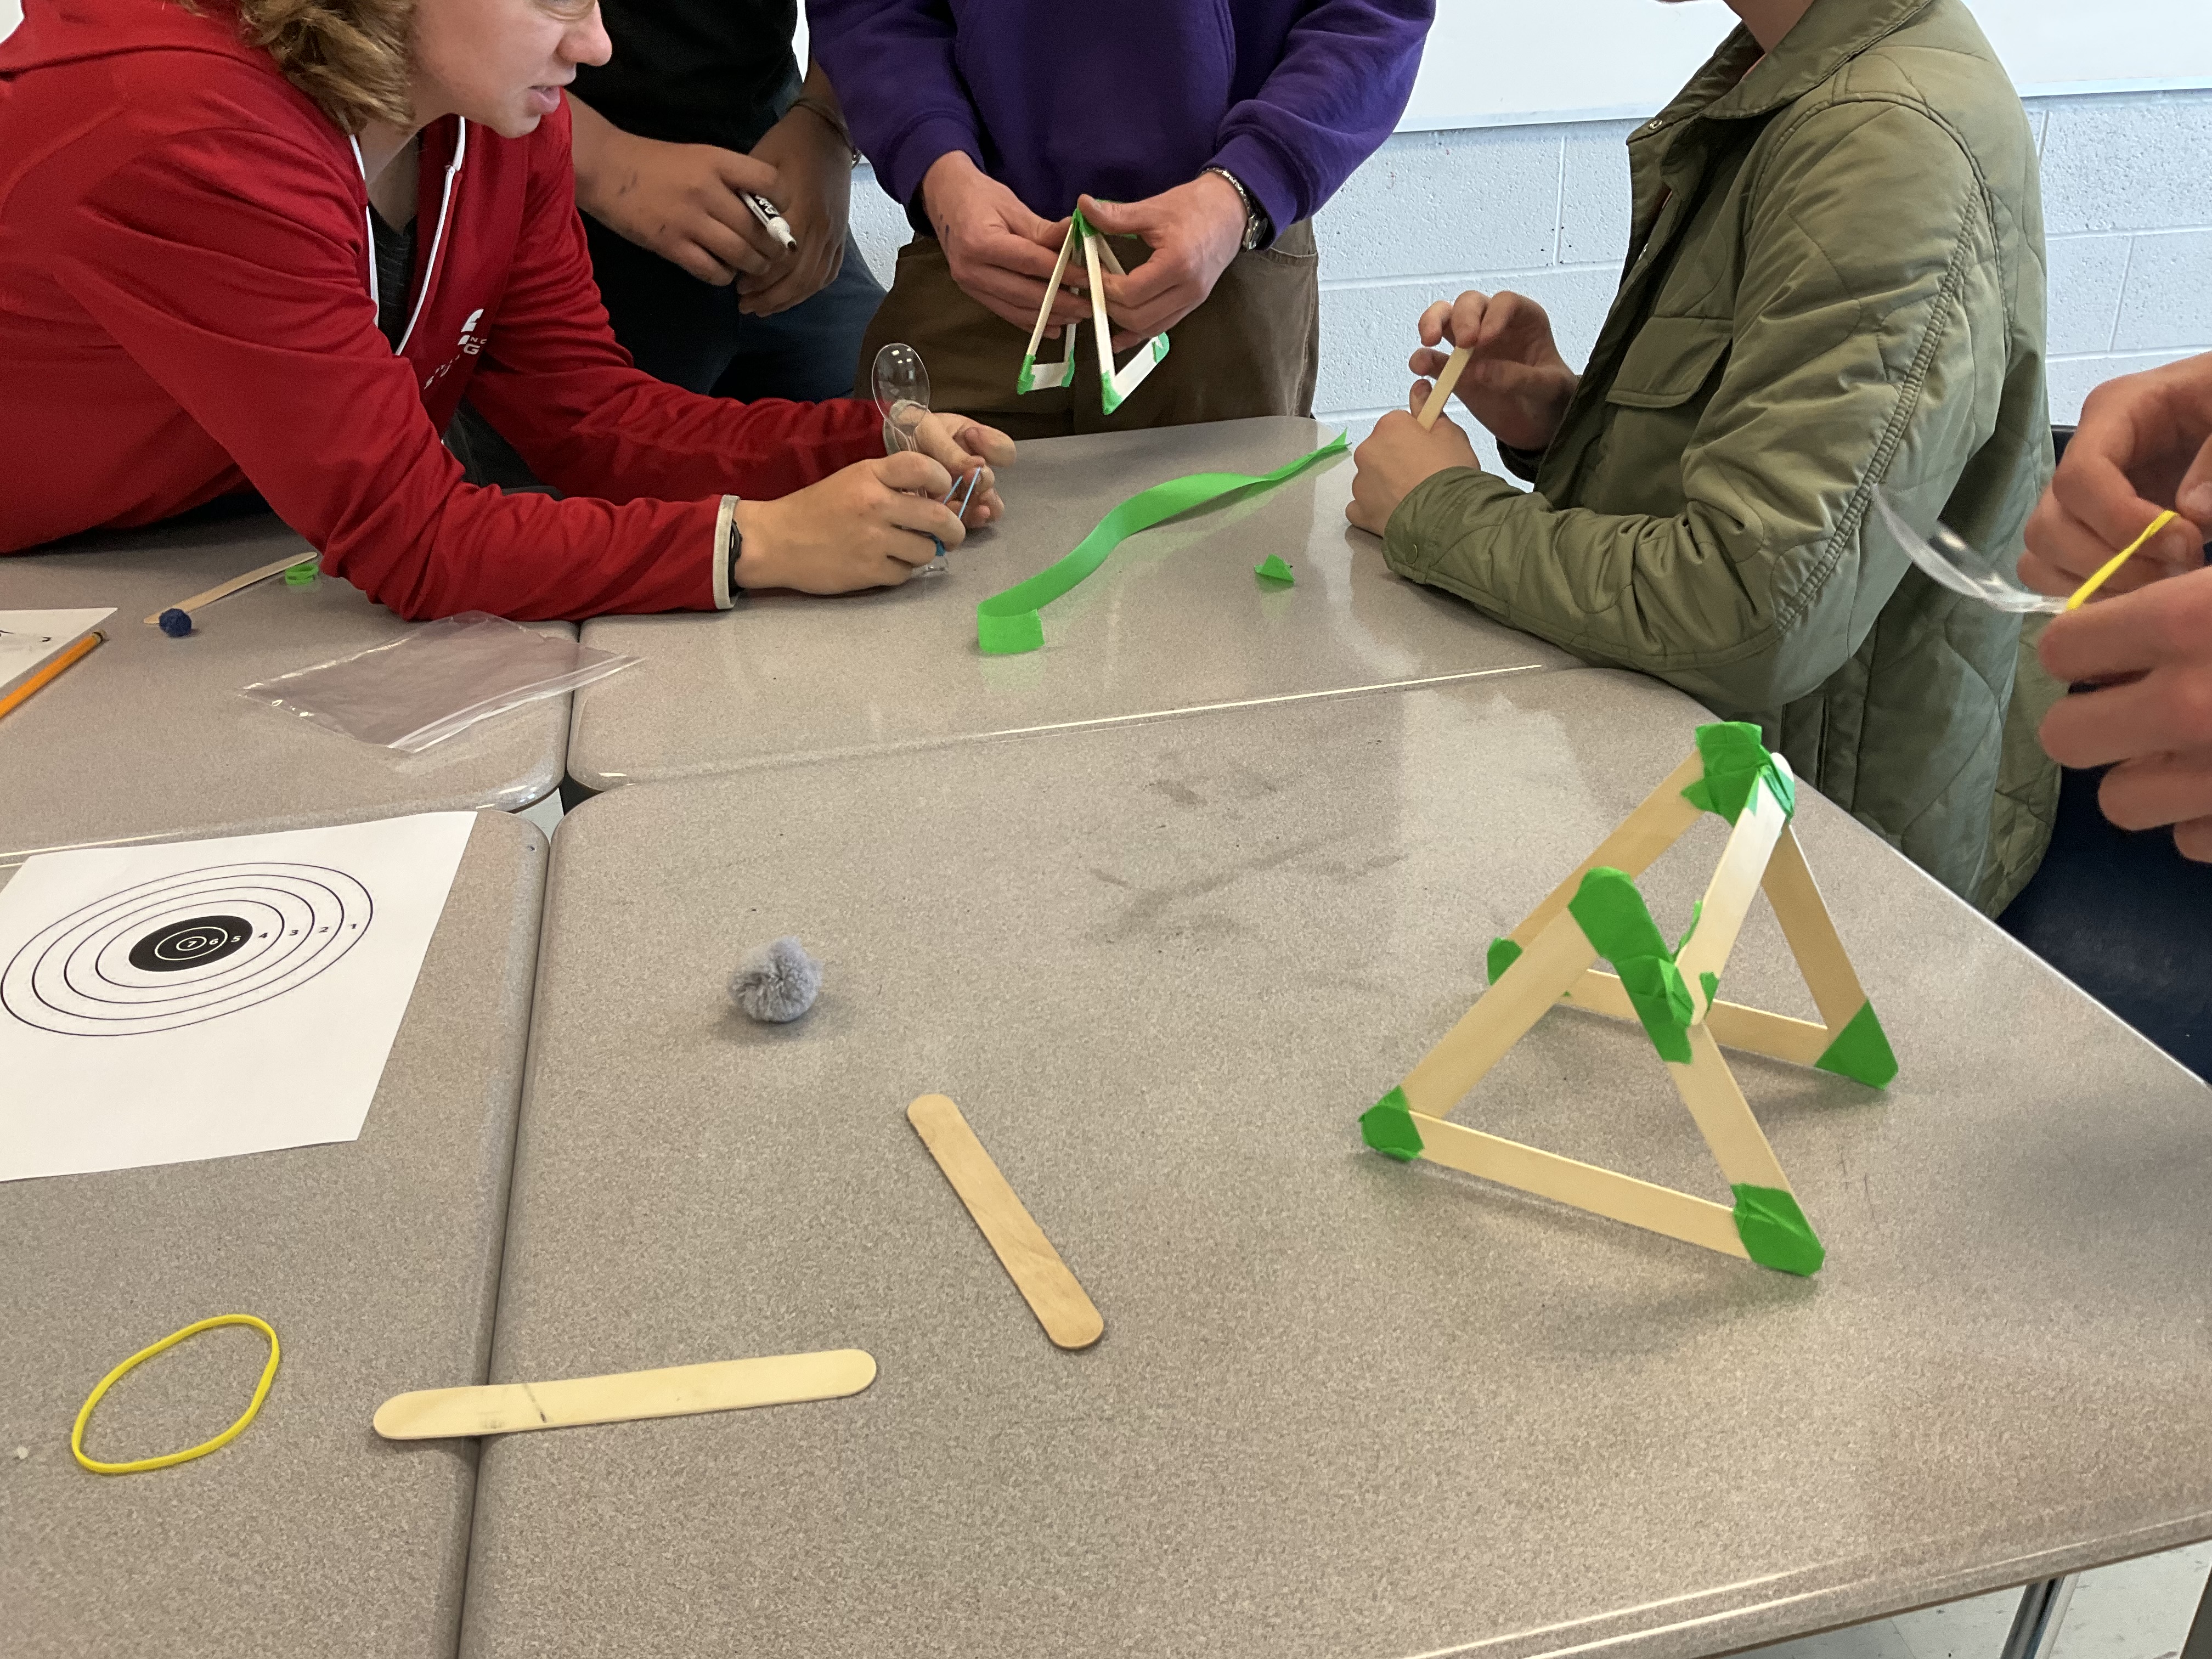
There were many different ways that groups designed their catapults. It is interesting to see how varied the trajectories were!
Groups came one at a time to the hallway to use the app “Visual Physics” to video their projectile.
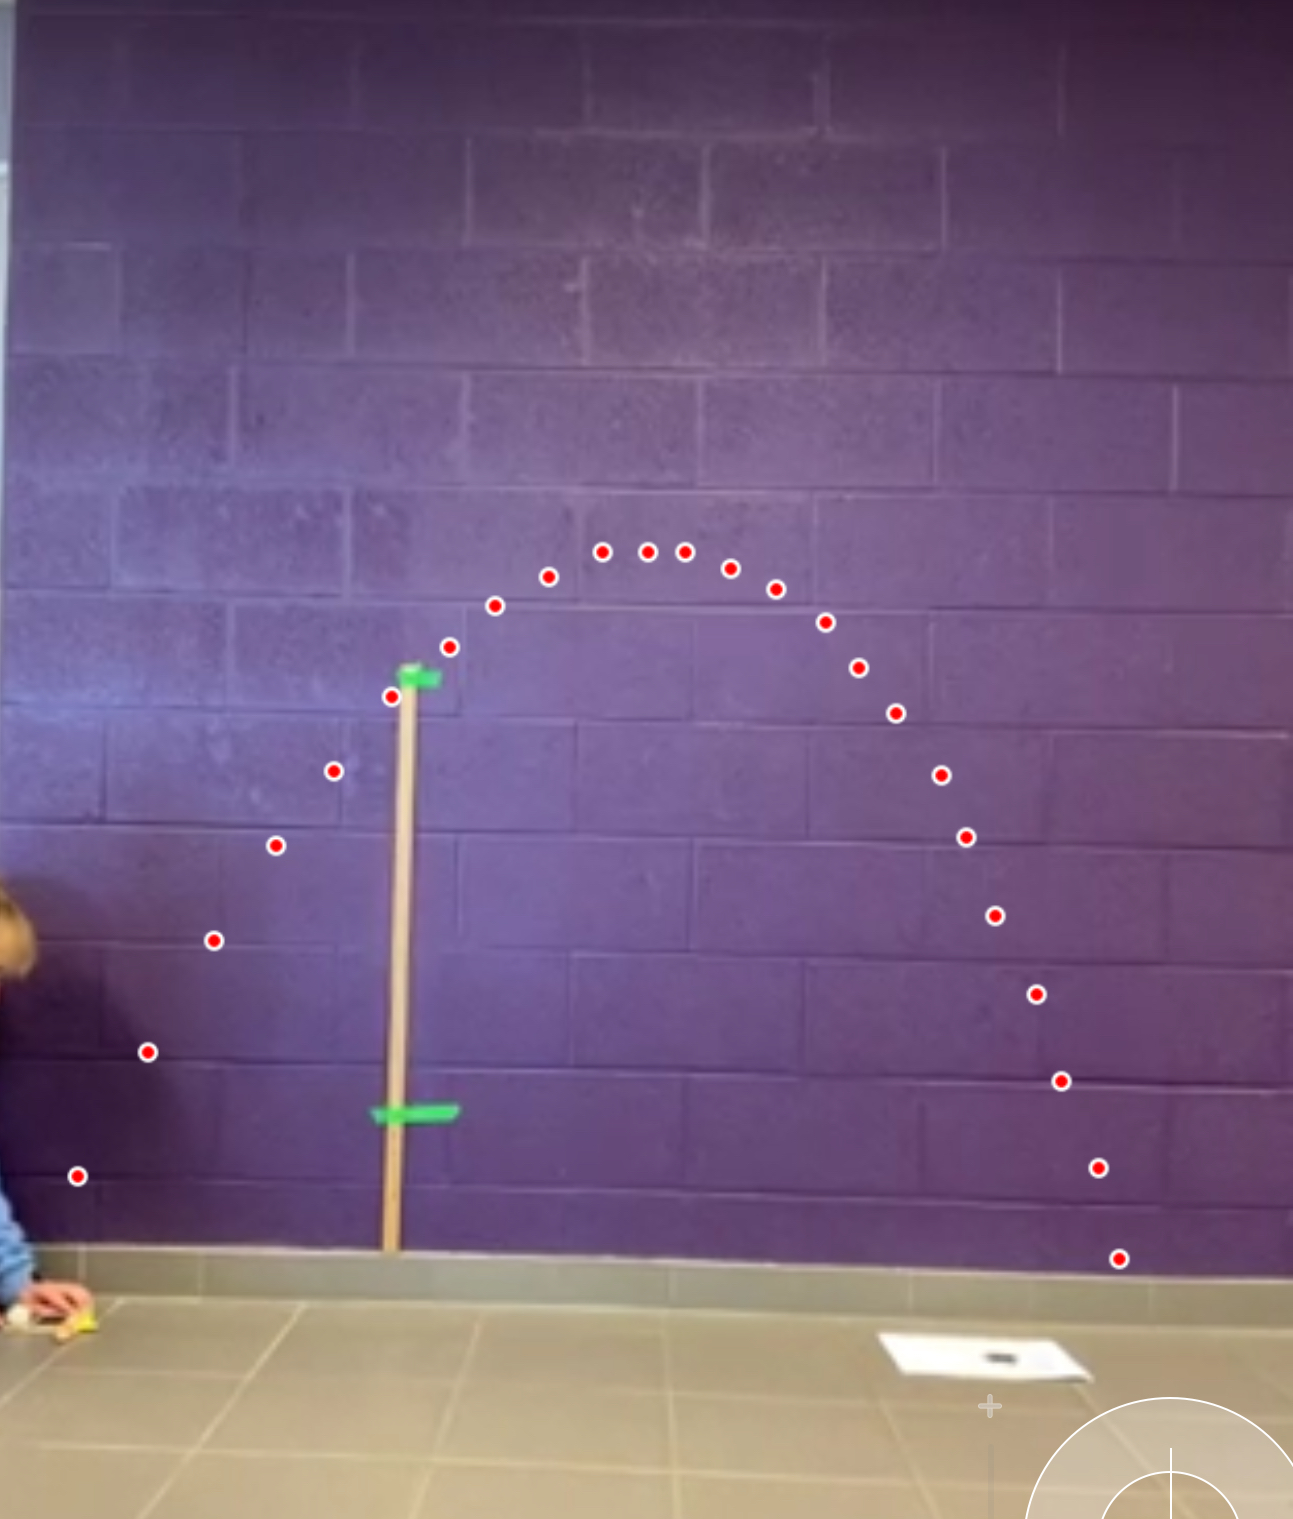
The app lets you step through the video frame by frame and locate the position of the pompom. We used a white pompom to see it against our purple wall. It’s important to use a meter stick to add a calibration scale so our data can all be reasonable and comparable when it is exported.
The video and data points are then exported to a different app called “Graphical GW” to be analysed. We can select different ways to show the data. We chose a table and a graph, comparing the horizontal and vertical distances as x and y. We can apply a curve fit too which will provide an “a”, “b” and “c” value for the standard form equation.
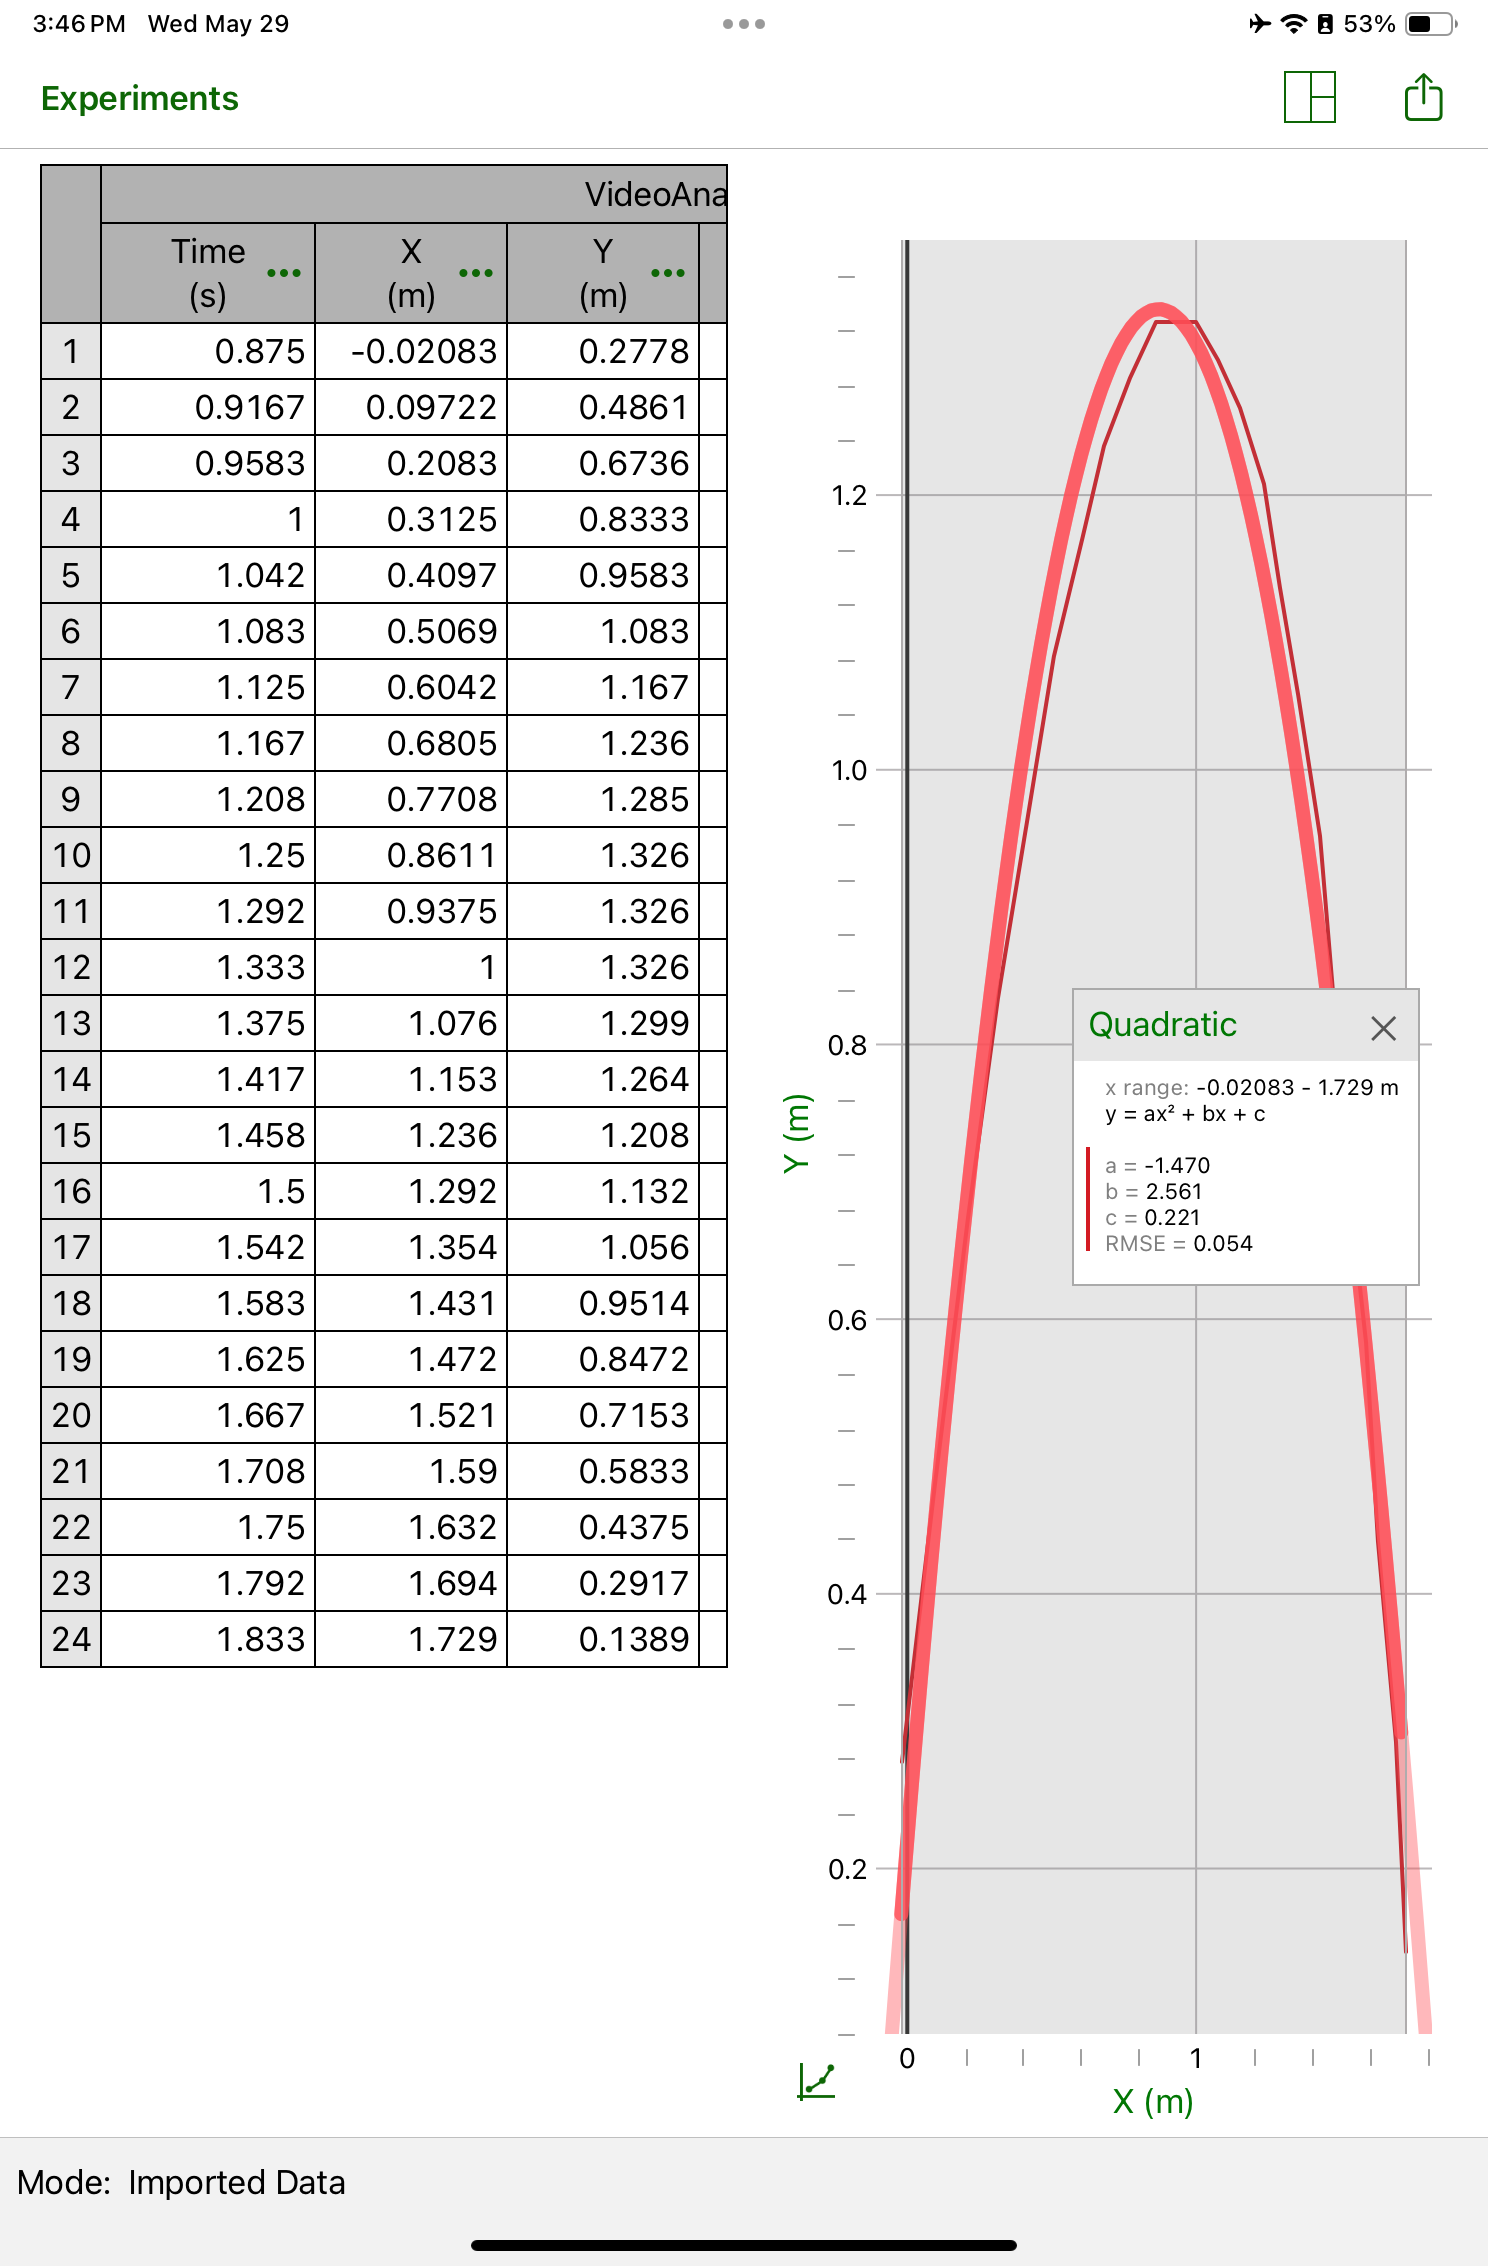
We can see that the table will let us create an equation in vertex form, and we can calculate the “a” value and compare it to what we have from the curve fit. We can use the equations to calculate the x intercepts and predict where the pompom will hit the ground.
All seven groups got their catapults made and data collected today. Tomorrow we will work on the analysis and get some feedback and think of some good extension questions to tackle.
Our final step will be to give students a set of data, similar to what they used today, and have them repeat the process individually, and answer some extension questions.
Each time we work through this process, I try to refine what I do. Last year, prepackaging the materials was my improvement. This year it was to give them a target and measuring tape, and to scaffold the collection of data and analysis with a work package. Next year it will be to establish a “how to clean up” process, as with all the excitement we ended up with a lot of debris around the room!
As with a lot of these tasks, it is important to let go of the reins a little, and let students take control of their learning and own the task. Since we have worked in groups all term, we have broken down many barriers, and students are getting very good at helping each other and asking each other good questions. At this point in the year they have learned a lot and are getting quite confident with their skills, which is great to see.
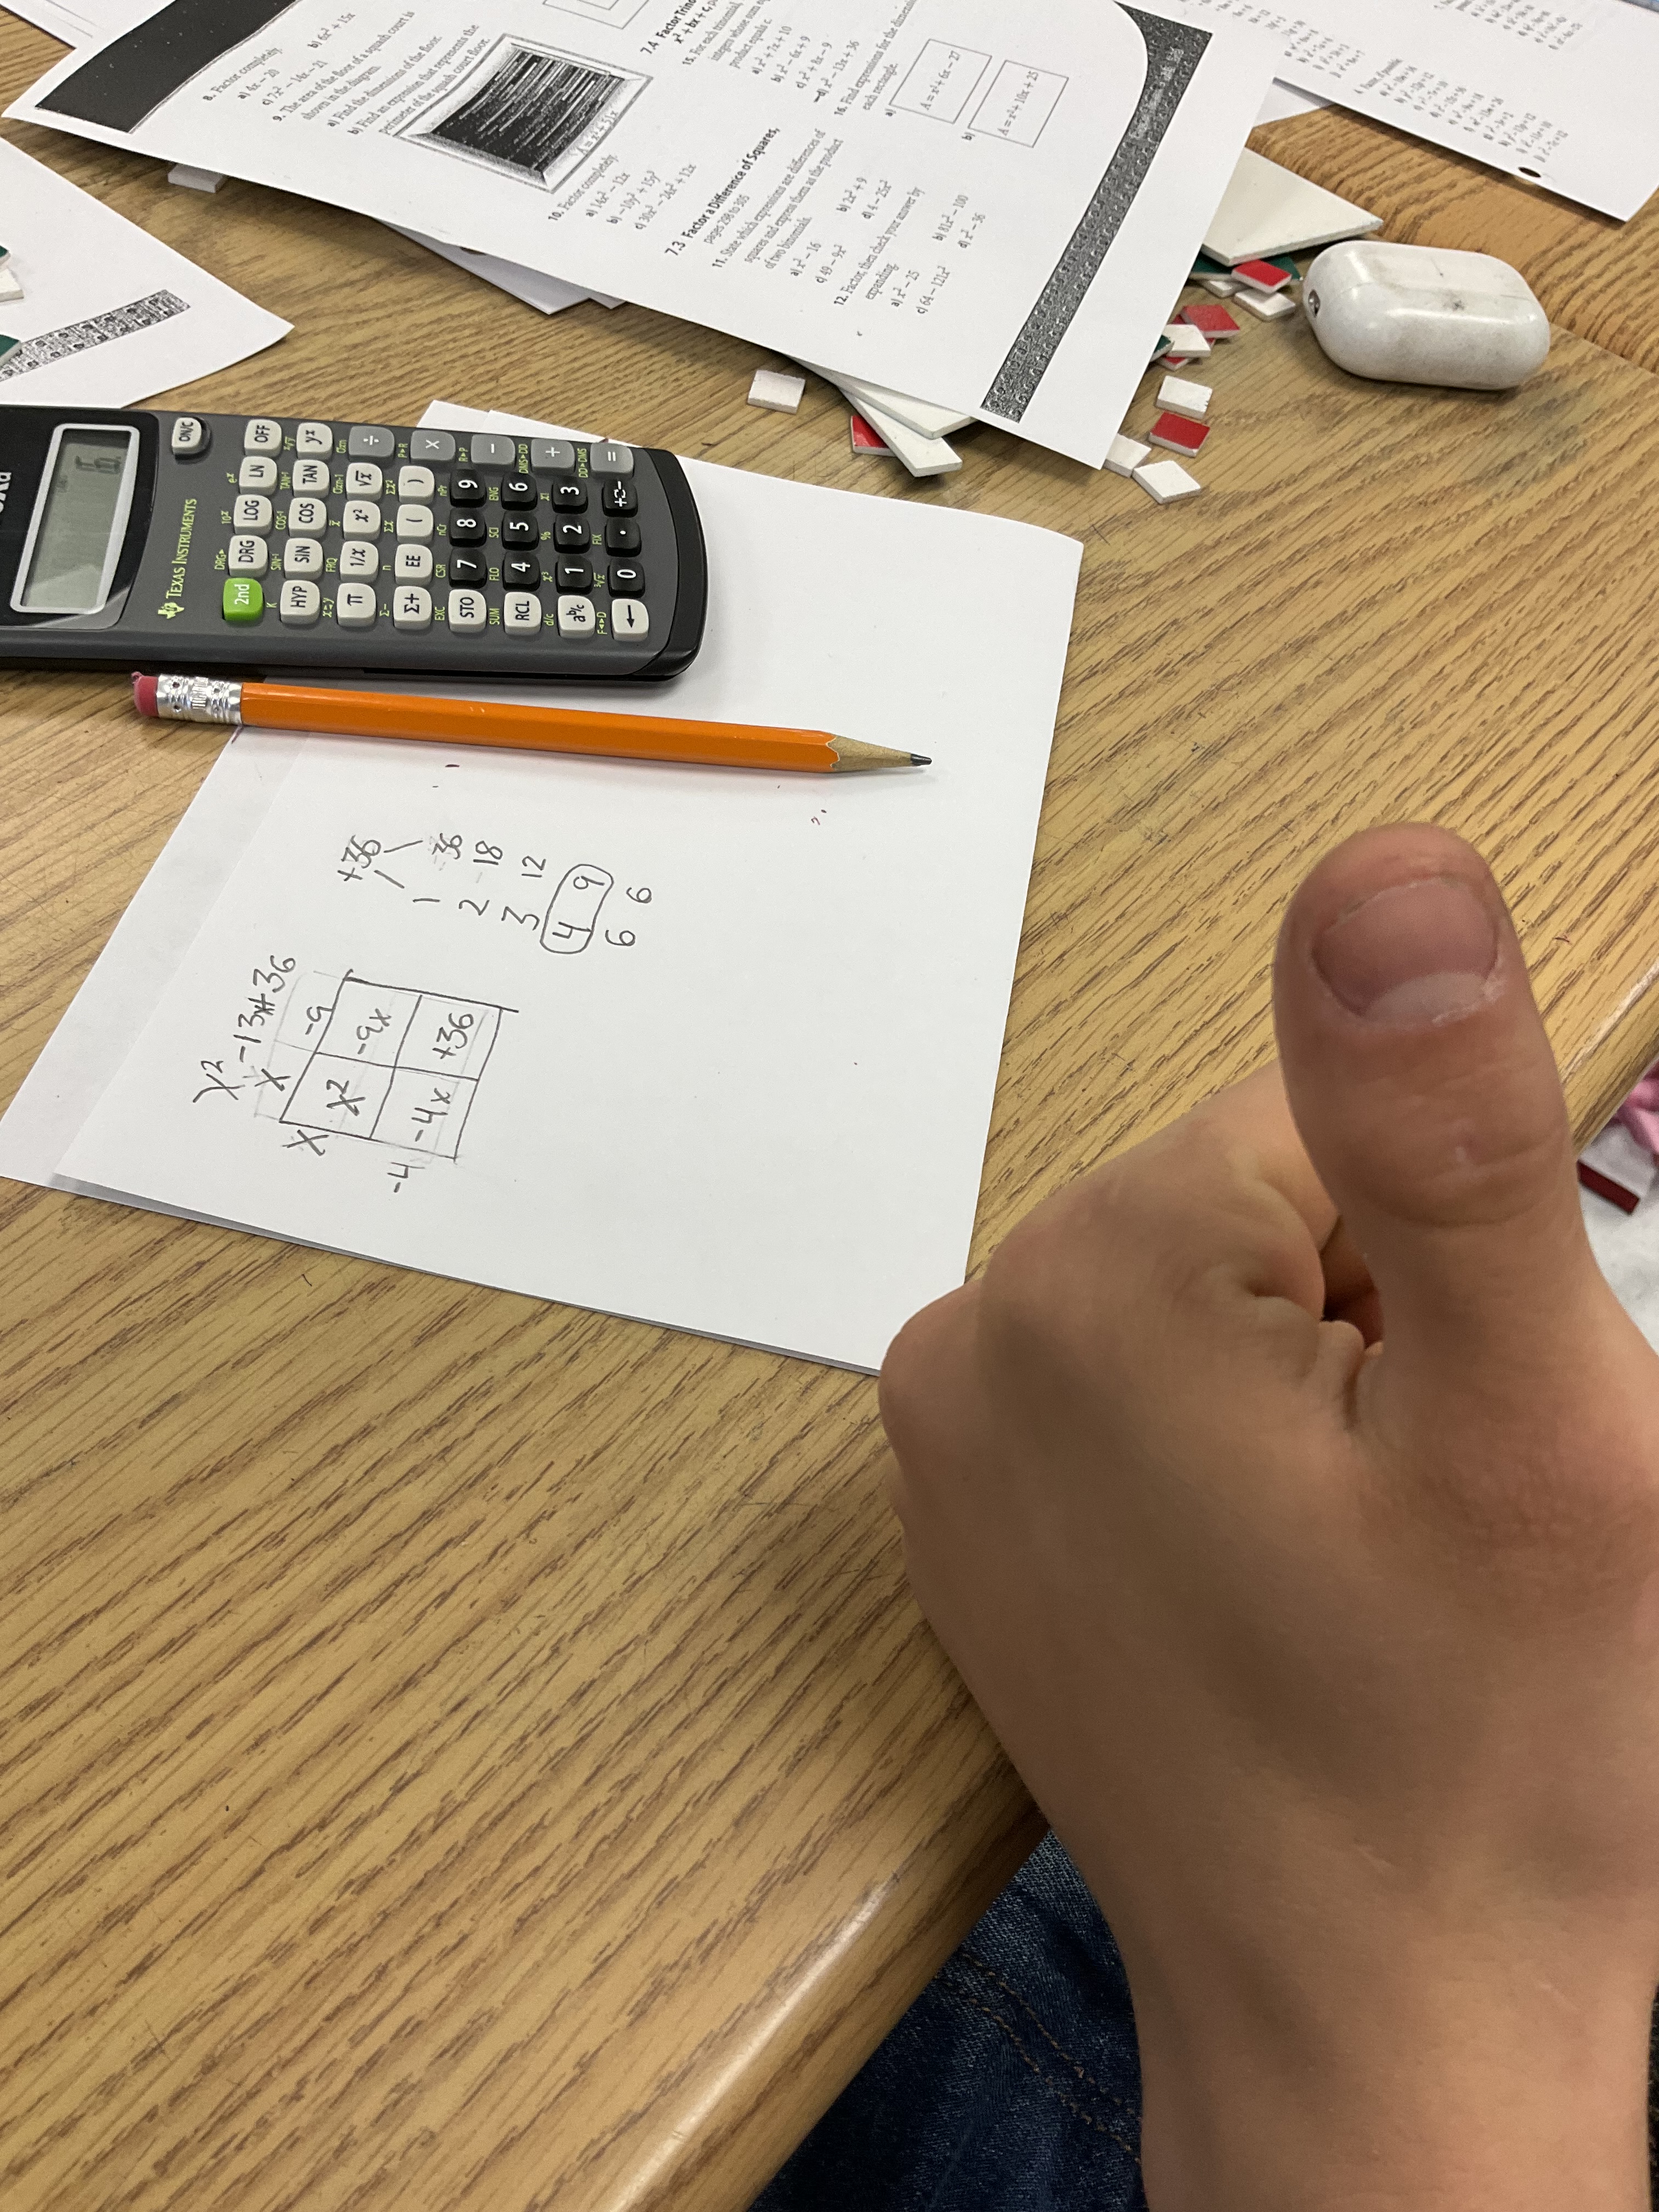
Area Model for Expanding and Factoring
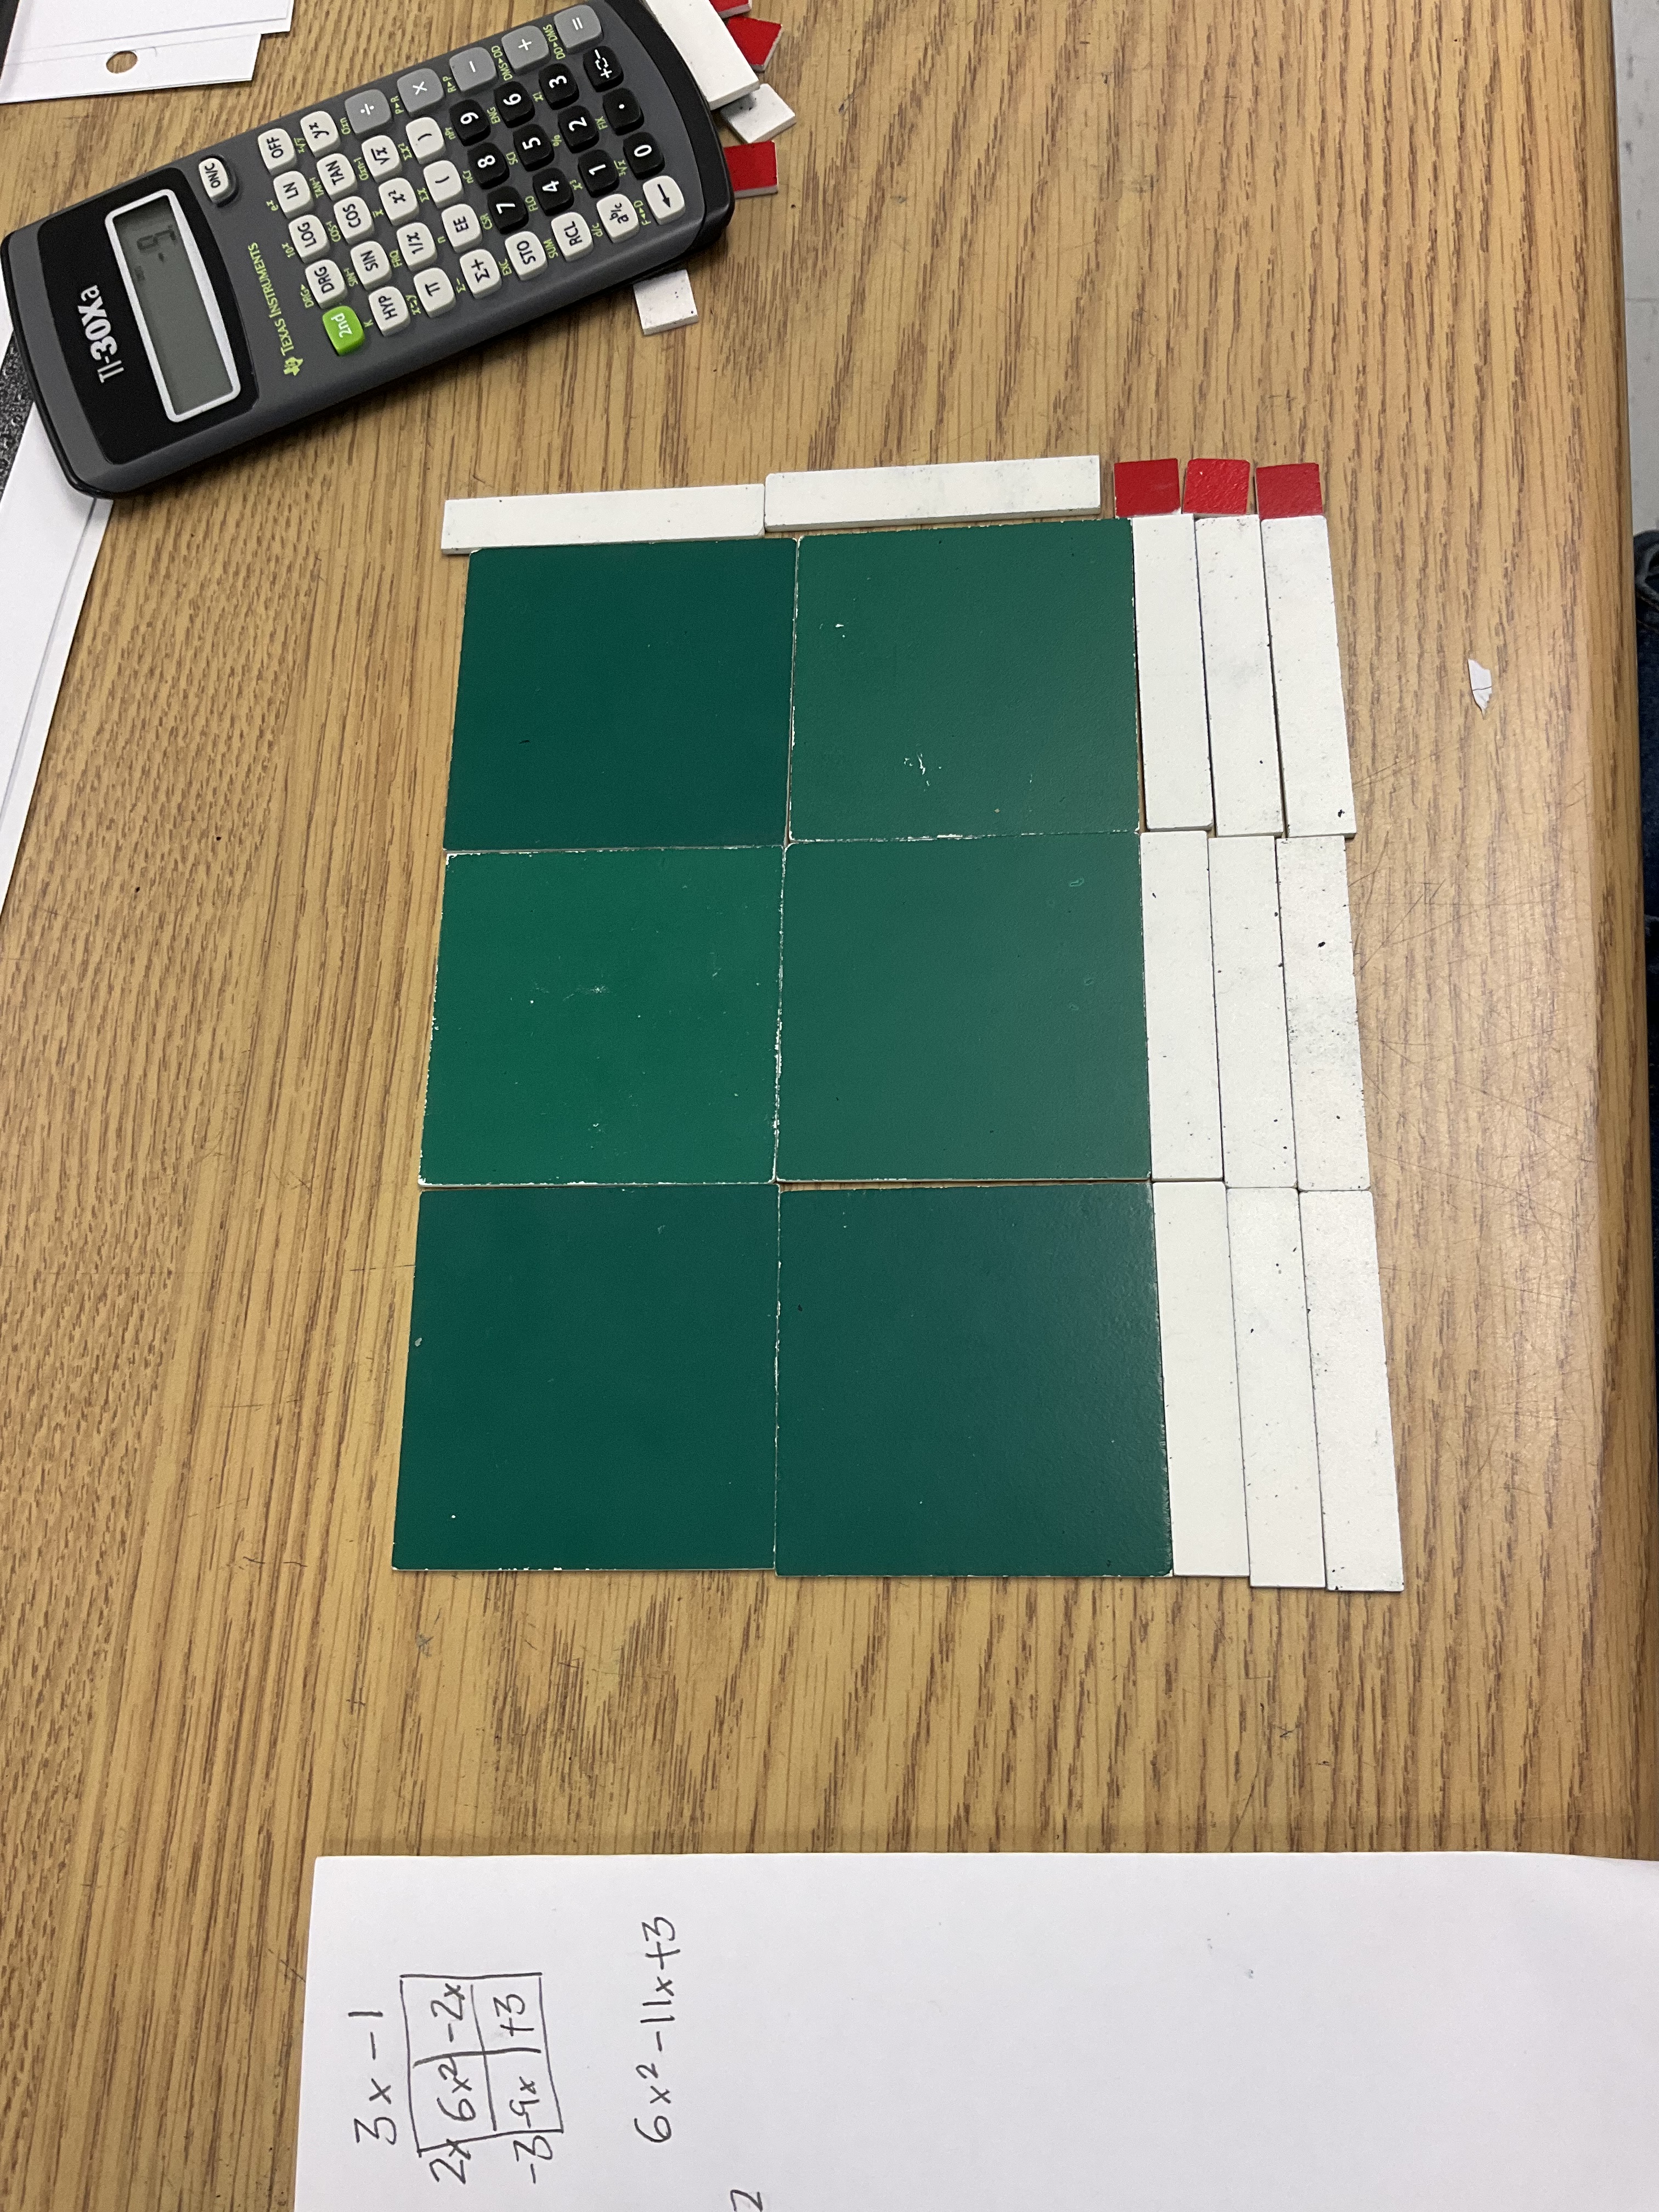
I’ve been helping out in a grade 10 applied math class during my prep time this month. One of the students I’ve been working with has become a master of algebra tiles for expanding and factoring quadratics.

We worked on expanding with the area model when it was not convenient to use tiles, and both processes are becoming quite natural.
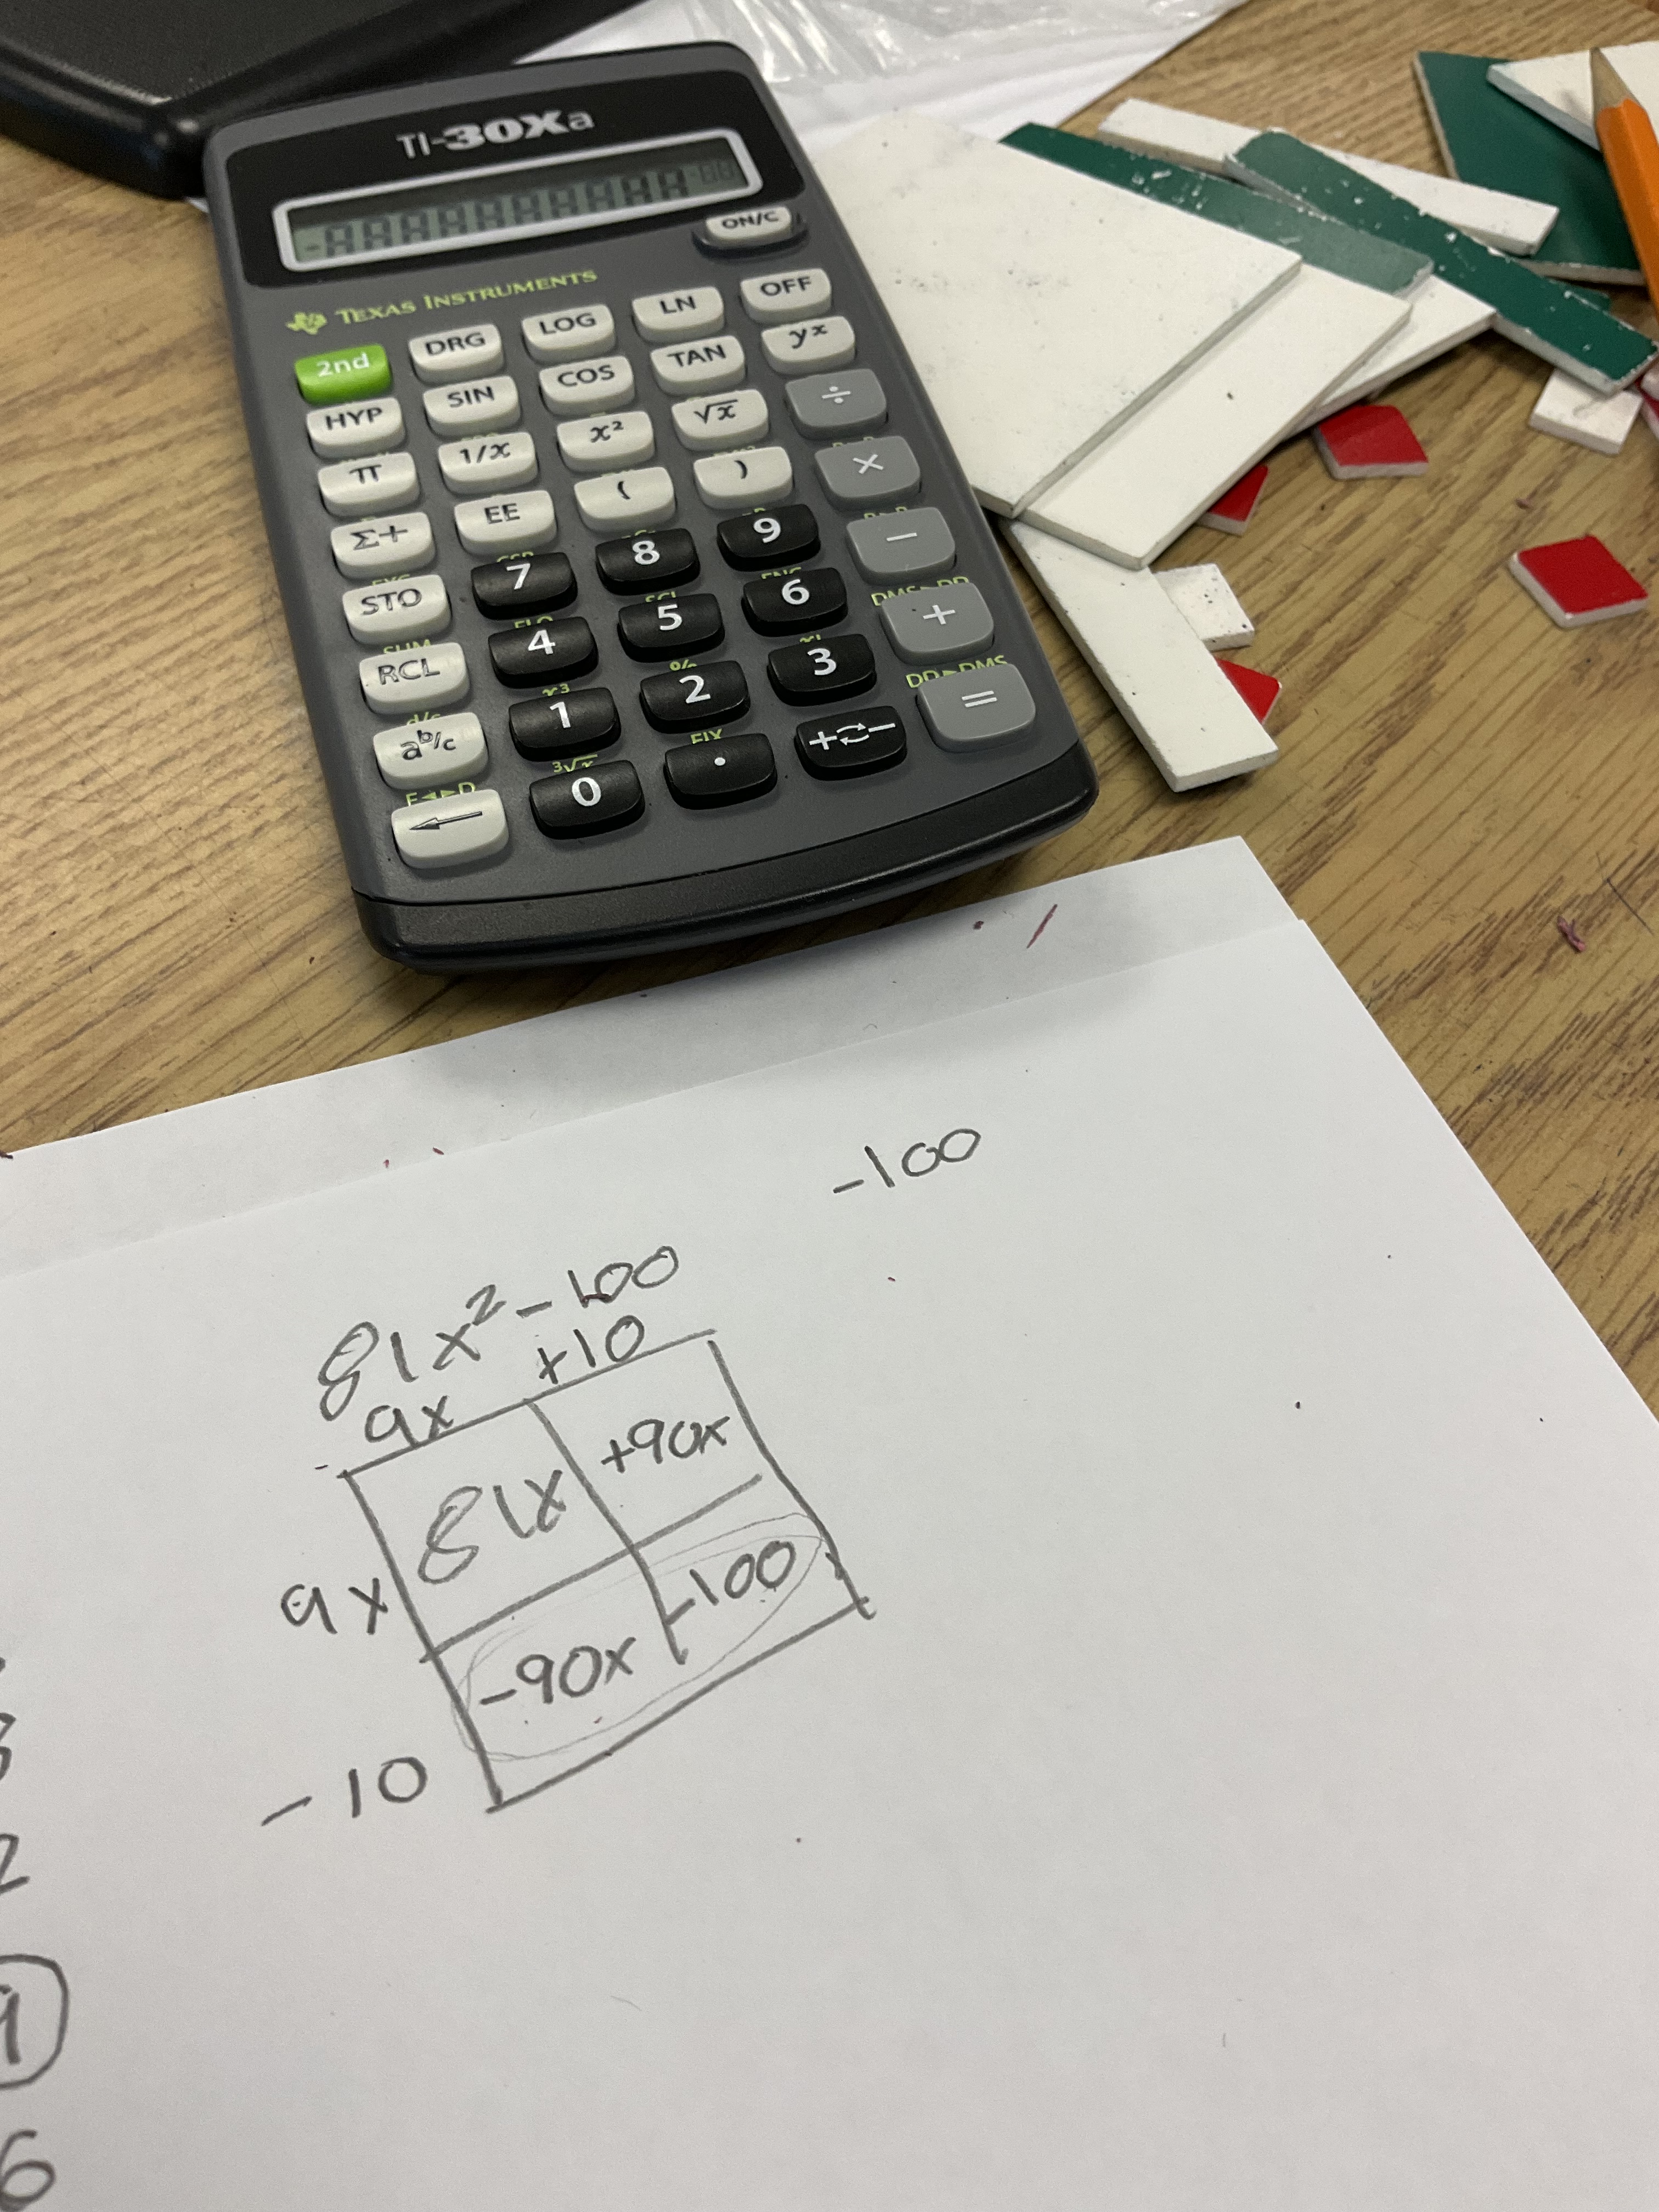
Even a difference of squares with a large leading coefficient is not an issue for someone who understands zero pairs!
Confidence and skills are growing as we make more and more connections between concrete and visual representations.
I’m thankful for the opportunity to share my enthusiasm for tiles!
Angle Day
We got out the polygon tiles today in MTH1W and made some beautiful art. We can use our art to talk about a lot of math topics. In this image for instance, we can explore fractions, and see how we can use several different types of tiles to create hexagons. Each hexagon is made of 6 green triangles, or 3 blue rhombuses, or 2 red trapezoids.

We can use this image to explore some angle concepts. We can see that two of the triangle angles are equal to the obtuse angle on the blue rhombus and also equal the angle on the yellow hexagon.
we know that if we add up the angles in a triangle we get 180 degrees, and if it is equilateral, like the green, we know that the 180 degrees is split evenly among 3 angles. 180 divided by 3 is 60 degrees. We can conclude then that the obtuse angle on the blue or yellow is 120 degrees.
We can also explore opposite angles, as seen at the blue X. We know that angles that are opposite each other are congruent.
We can also add up the angles around a point (orange). We have 120 degrees (yellow), we have 2 green, each with 60 degrees, and 2 blue acute angles each with 60 degrees. If we add them all up we get 360 degrees. This is true around every point! The sum of the angles is 360.

I challenged my class to determine the angle measurements of each of these blocks. We can use the “sum of angles around a point” strategy to calculate the missing values.
At the centre of the design we have 12 beige rhombuses which make a full circle. We know that we can calculate the acute angle of the rhombus if we divide 360 by 12. That gives us an acute angle of 30 degrees. We can try to calculate the sum of the angles around the green dot to calculate the missing obtuse angle. We have a 120 degree yellow angle, and a 90 degree orange angle, and the remaining degrees needed to make 360 must come from the obtuse beige angle. 360-120-90=obtuse angle, 150=obtuse angle.
Another way to explore this is understanding that the sum of the angles in a quadrilateral is 360 degrees, so if you have two angles of 30 each, that leaves 300 degrees for both obtuse angles, and each obtuse angle must be 150 degrees.

We can explore supplementary angles too as a way to prove that the obtuse angle in the beige rhombus is 150 degrees. We know that the sum of supplementary angles is 180 degrees. These angles make a straight line when put together. Examine the yellow supplementary angles, we see 60+60+60=180. If we look at the blue supplementary angles we see that the acute angle is 30 degrees, so the obtuse must be 150 since they are supplementary angles and add to 180 degrees.
We got interested in figuring out what the interior angles of polygons were, and we built a table of values to check for patterns.
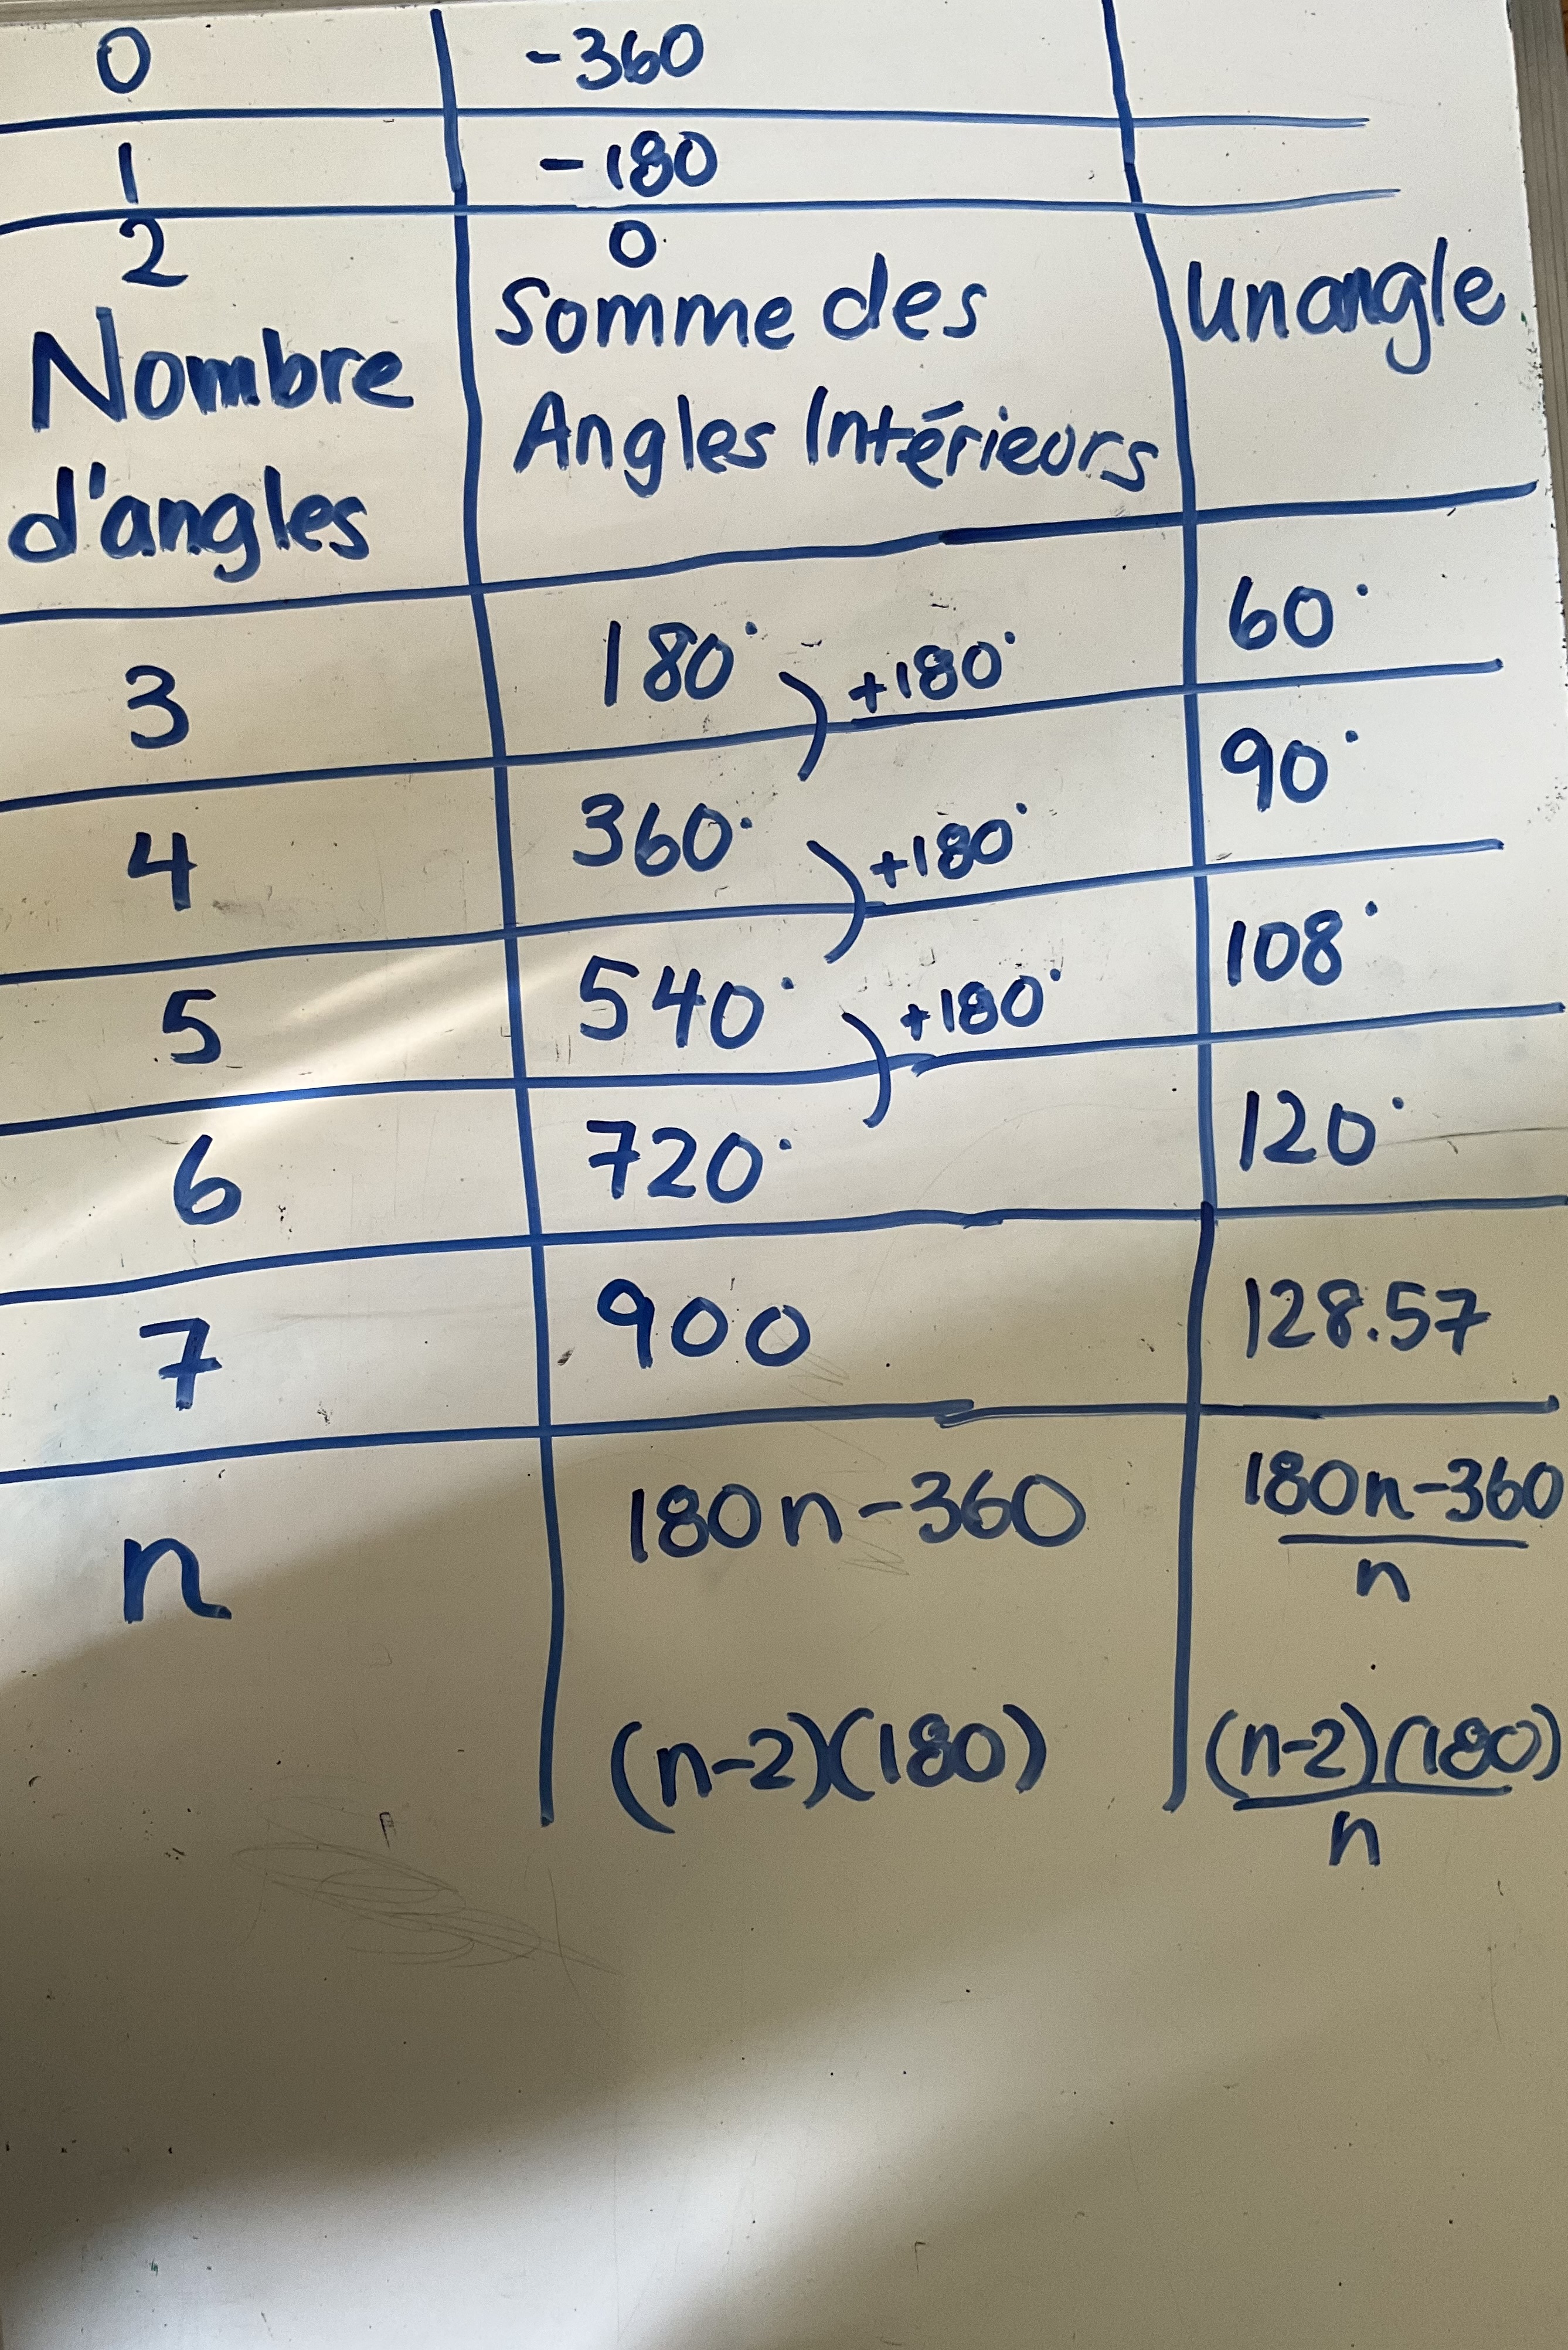
We noticed that the sum of the interior angles column increases by 180 degrees each time. We know that the rate of change (slope) is 180. We went back in the table to find the constant, which is -360. The equation for the sum of the interior angles in any polygon is SIA=180n-360
We noticed that the angle column doesn’t increase linearly since the first differences are not the same. We got the values by dividing the sum of the interior angles by the number of angles. We had an enthusiastic participant who explored what happens when we had a million sides on our polygon, and calculated that the interior angle would be 179.99 degrees. The class agreed that the polygon would look pretty circular.
To explore further, we graphed the angle values on desmos. We noticed that there is a limit to the value of the angle. It approaches but never reaches 180 degrees.

Our next steps are to explore the sum of the exterior angles, and also the value of exterior angles. More to come tomorrow!
