Test preparation

We’re working really hard to get ready for tomorrow’s test. We’re practicing with tiles, practicing with text books, taking pictures of our work, using google classroom, and making our digital study notes. We’re working together to get last minute questions answered, and to be sure of all of the algebra rules we need.
We all need calculators for tomorrow! We’re ready. We’ll do well tomorrow.
Algebra practice
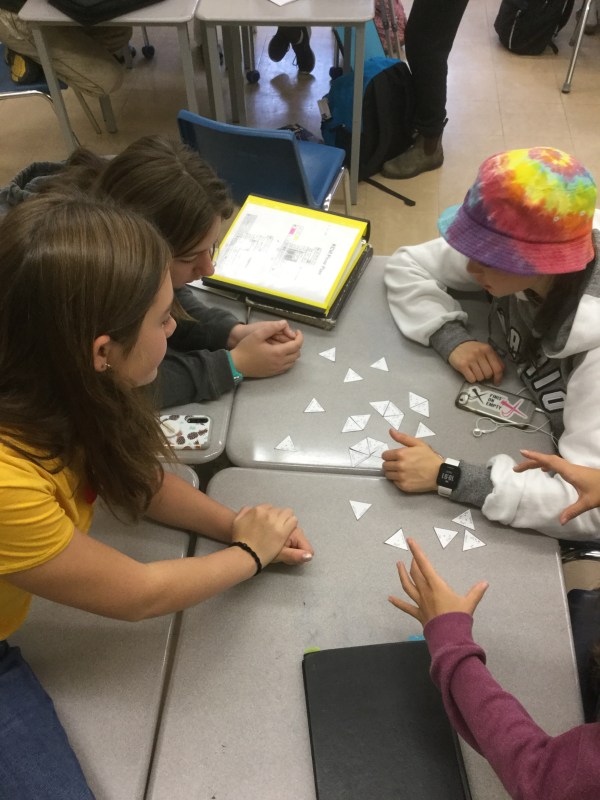
Grade 9s worked “speed dating style” to review algebra concepts today, and solve problems together.
 by working in pairs, across the table, we can help each other out, and coach our peers to understand and perfect our algebra skills.
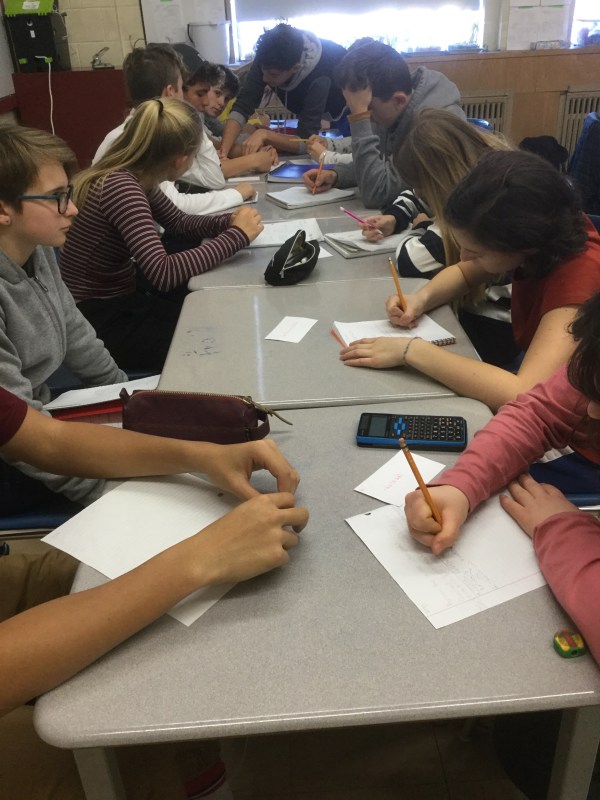
We are having fun too!

Quadratic formula
Today’s the big day in grade 10! Here’s the derivation of the quadratic formula. It shows how to complete the square for any trinomial, and then, to set y=0 and isolate x to find the roots, as we’ve been practicing lately.
 we isolate x by doing opposite operations on both sides.
In the end, we have a beautiful formula (in the box) which we will use a lot. We even learned how to sing this formula to the tune of “pop goes the weasel”.
We use the formula to calculate roots of a quadratic.
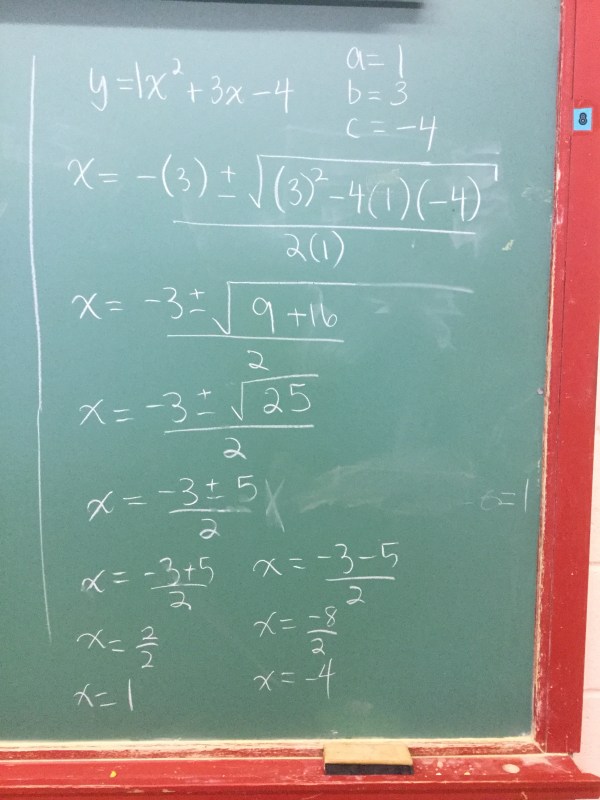
We could have done the same thing by factoring

But not all equations are factorable. We can always use the formula!
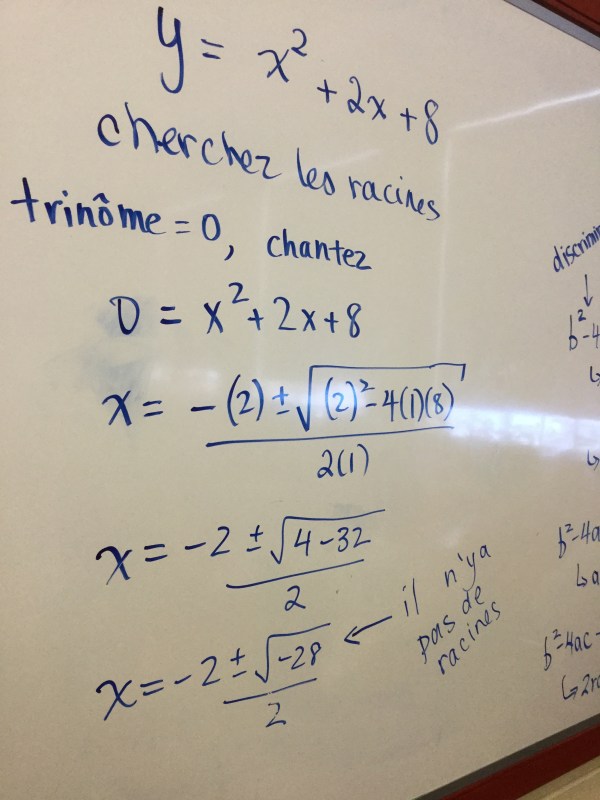
We also saw what happens when there are no roots
We will be using this a lot to solve problems tomorrow.
Modelling quadratic patterns

Using the website visualpatterns.org we explored a few patterns. We looked at them in a similar way to patterns we explored in grade 9, linking the visual pattern to an equation, a table and a graph.
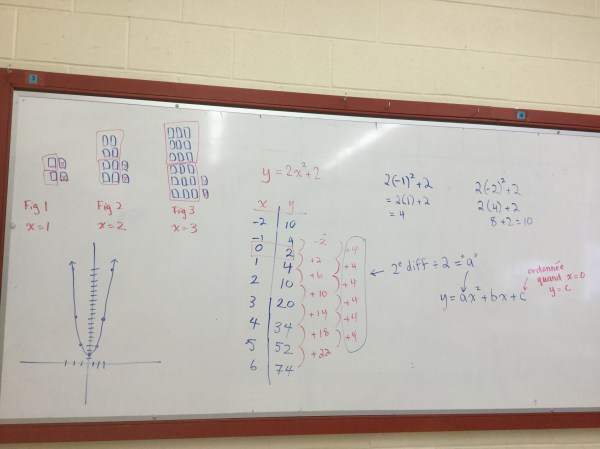
We remembered how to look for groups of “n” and squares of “n” to help us build an equation. We also remembered that the data in the tables correspond to (x,y) coordinates for the graph. We looked at the first differences, and second differences. For linear growth the first differences are constant. For quadratic (parabolic) growth the second differences are constant. We looked at how the 2nd difference is related to our equation (our “a” value is always half of the constant second difference). We looked at how figure 0 is related to our constant term in our equation, and the y intercept of the graph.

We had a look at a cubic function too, just to notice that the 3rd differences are constant, and that the graph looks different from a parabola.

There are sometimes some tricks to use when visualizing and making equations. For this pattern it helps to add another set on top to create a rectangle that is (x+1)(x+2) and then since we only need half of that we can multiply by 1/2 or divide the whole thing by 2.

For this pattern some people looked at groups of “n” to model the yellow squares. We see 8n^2+4n+1 this way.
Others looked at creating expressions for the yellow squares.

And some looked at an expression for the entire square, with white rectangles removed.

And in the end they all simplify to the same thing! Algebra is neat that way.
We will continue to explore these trends over the next few weeks.
Tarsia Puzzles
Grade 9s worked on exponent laws and algebra practice today by putting together tarsia puzzles.


Each triangular piece has algebraic expressions on the sides. We matched up simplified and unsimplified versions.
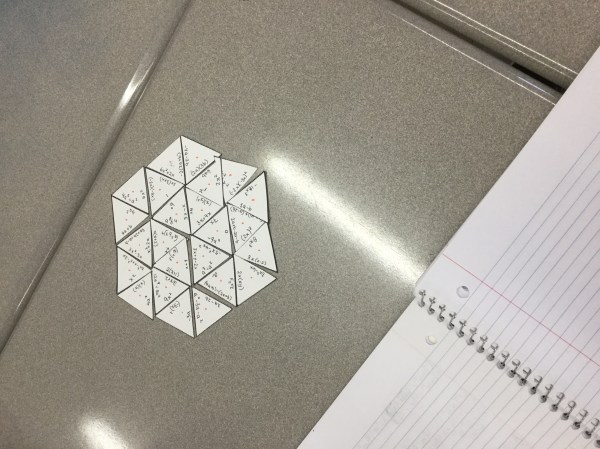
We needed to work together to catch our errors and stay on track.
Review for test
In Grade 10 we are reviewing before our test tomorrow.
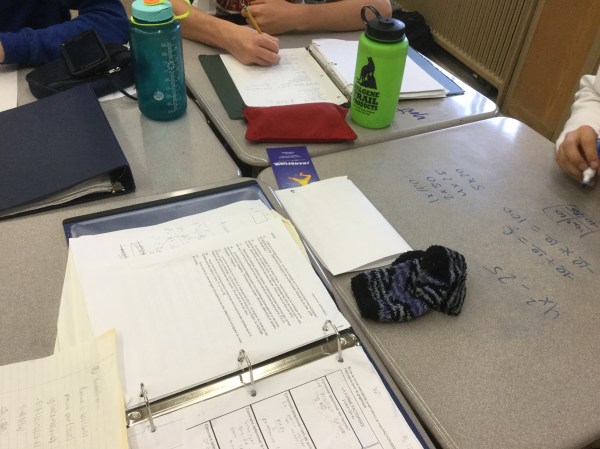
We’re working on word problems, and factoring…
 we are writing answers up on boards, and working well with our classmates to verify answers.

We’re taking pictures to put our work into our study notes which are due tomorrow.
Distributive property
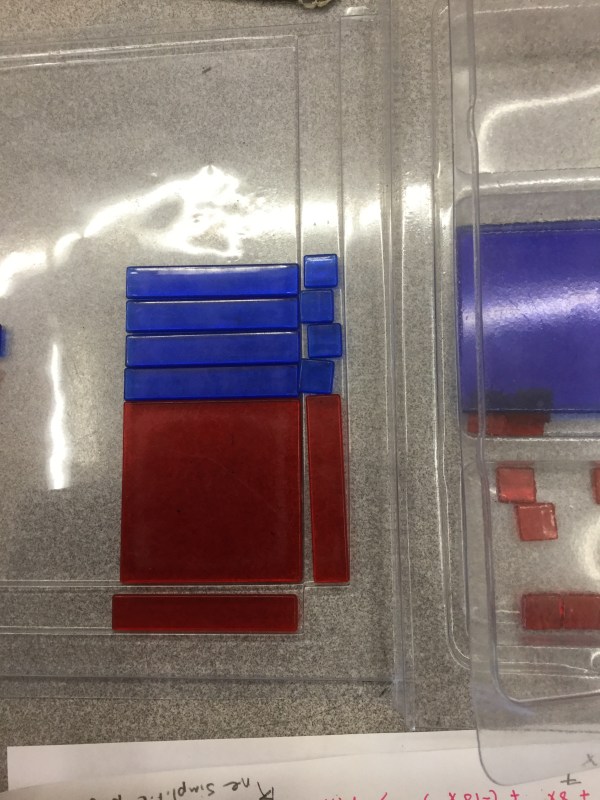
Grade 9s are multiplying with algebra tiles now! This photo shows (x)(x-4) and the answer to that multiplication is x^2-4x.
Pumpkins!
We spent Hallowe’en with grade 9s exploding pumpkins.
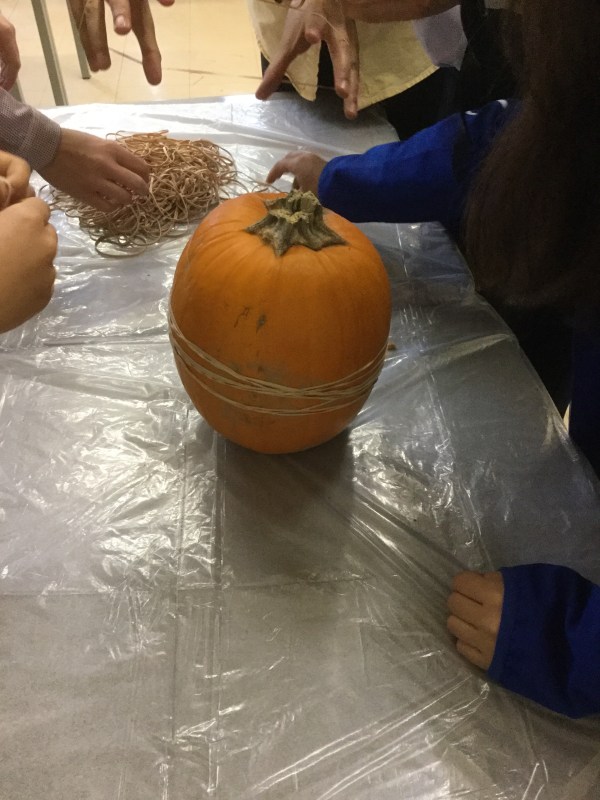
We measured heights, circumferences, and then made a prediction about how many elastics it’d take to pop the pumpkin open.
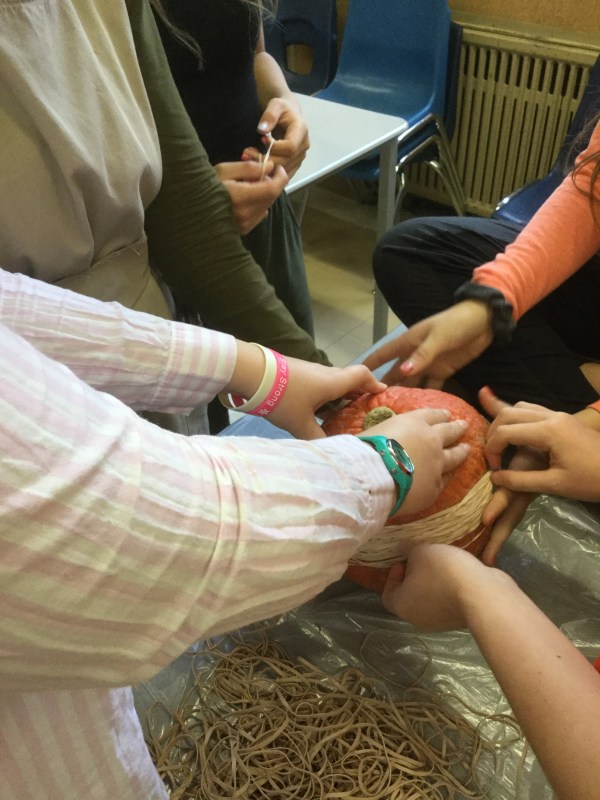
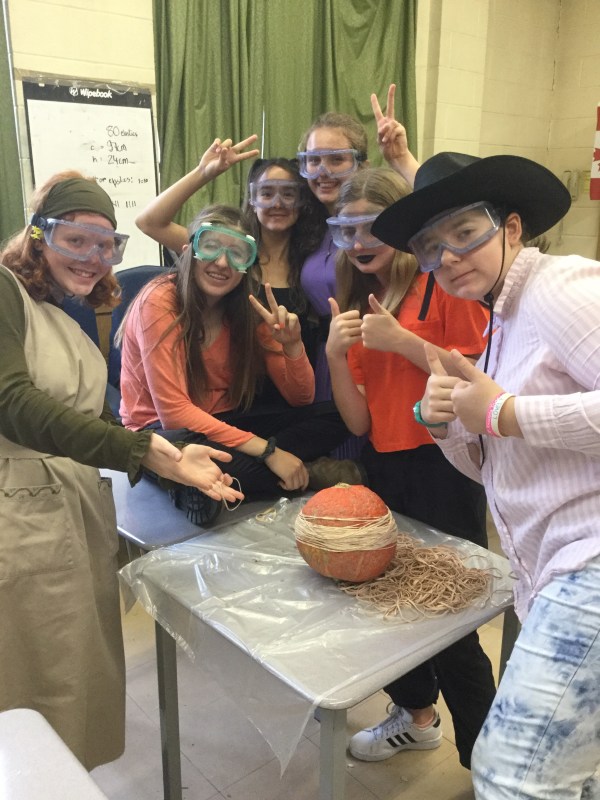
We needed to work together, often adding several elastics at once.

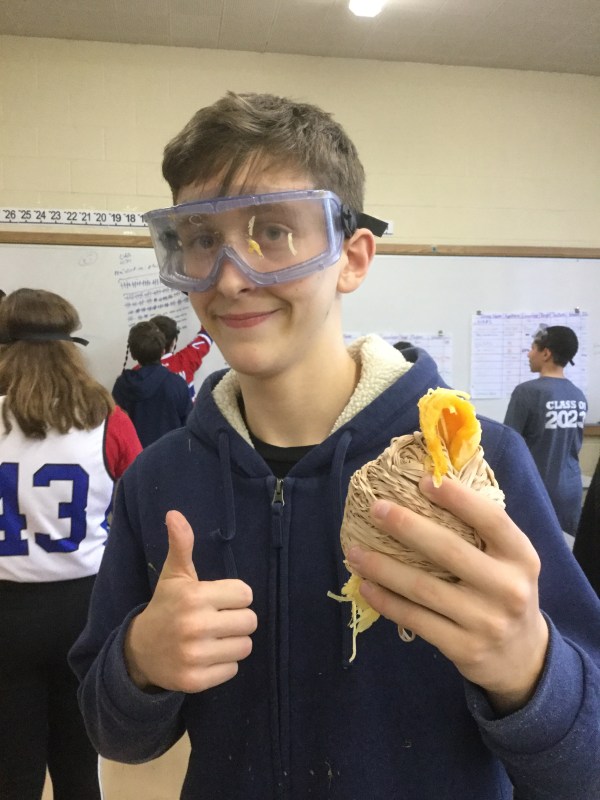
Some pumpkins started to show signs of weakness…cracking, or bubbling, or leaking…so we knew they were getting close…and we began filming.
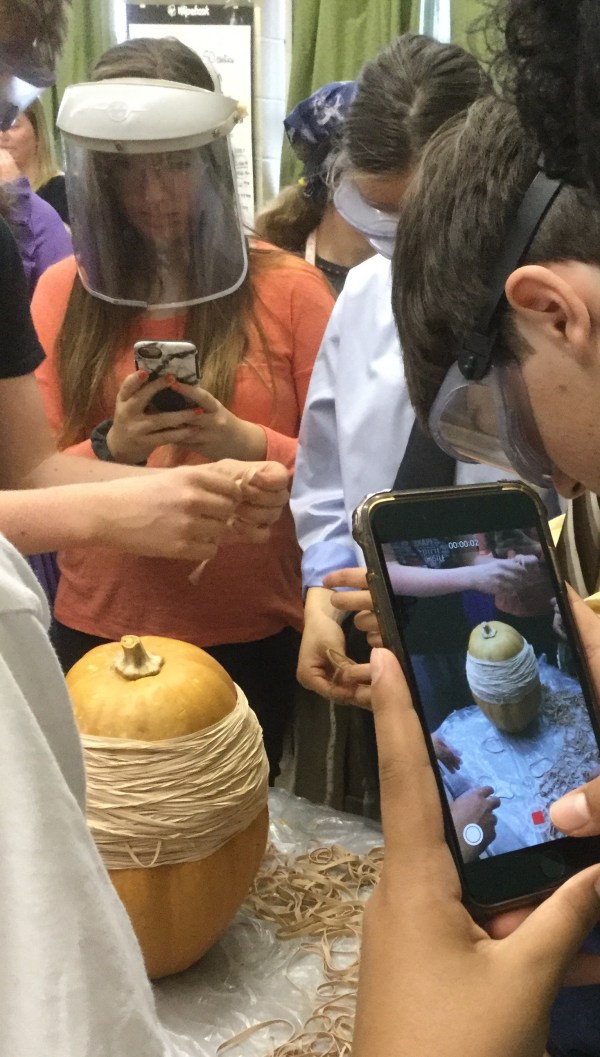
We wanted to catch the moment on film.
Some groups took a lot more elastics than others. Some groups had 300 elastics, while others needed more than 1000. We’ll be making scatter plots to see if we can determine the factors that correlate to an increased number of elastics.
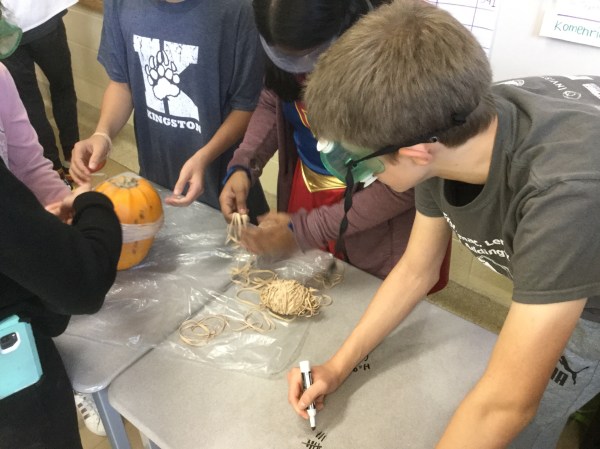
We had lots of fun!
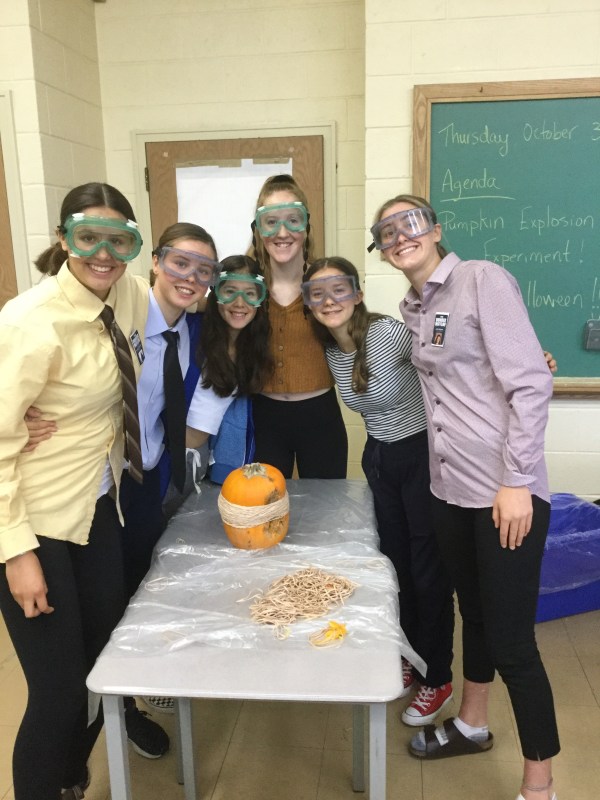
If you do this at home. Be sure to protect your eyes.
Solving quadratics problems
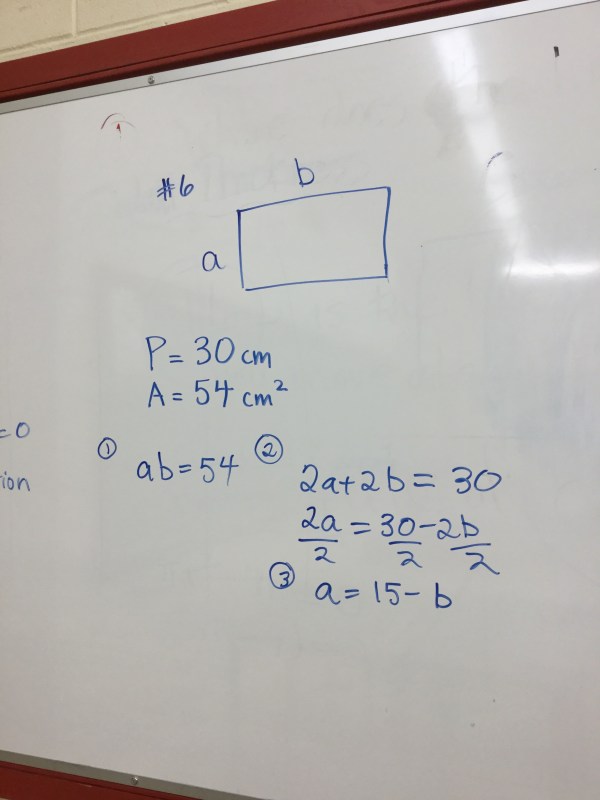
For this problem, we know the area and the perimeter of a rectangle. We make equations, and substitute so that everything is in terms of one variable.
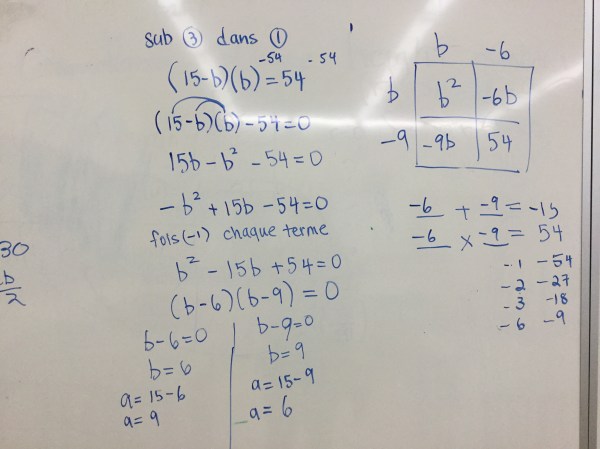
We then multiply the brackets, and work towards having 0 on one side, and an algebraic expression on the other. That expression is factored (using the area model in the box) and the factors are written with the product=0.
We then find the roots by setting each bracket equal to 0.
Once we get the 2 values for “b”, we use each one to calculate a value for “a”.
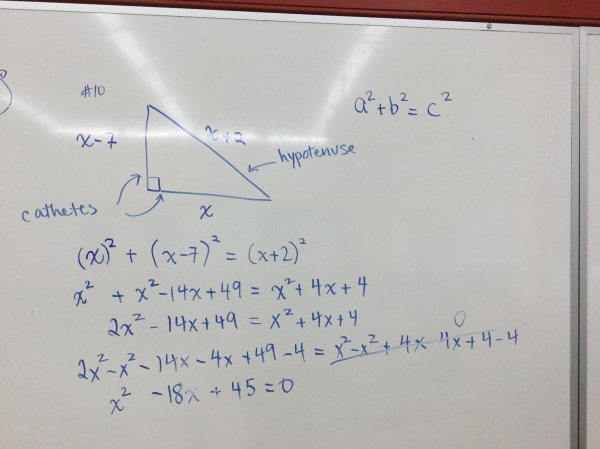
This question relates the legs of the triangle to the hypotenuse using algebra. One leg is 7cm longer than the other, and the hypotenuse is 2 cm more than the shortest leg.
We use the pythagorean theorem to create our equation. We need to expand by multiplying the binomial by itself to create a trinomial. We simplify our equation to get 0 on one side.
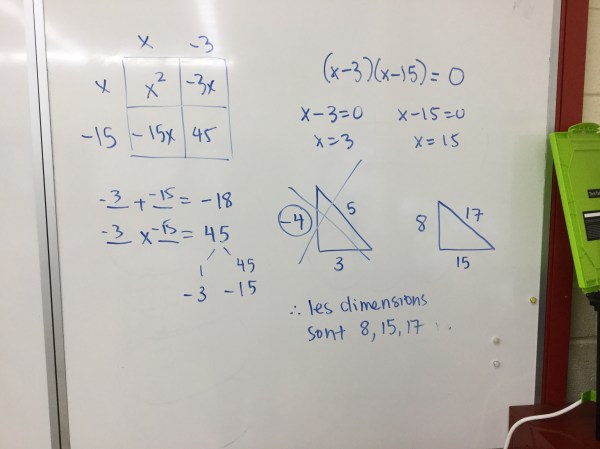
We then factor (using the box) and we write our factors in brackets equal to 0. We now find the roots by setting each bracket equal to 0 and solving for x.
We need to check at the end if the x value is acceptable. We know that side lengths must be positive, so x must be 15, and not 3.
Polynomials and algebra tiles
We are working on combining like terms and simplifying expressions.
Today we looked at representing expressions with algebra tiles

This is 3x+1 (and a lot of zero pairs!) we can simplify this a lot by removing the zero pairs.
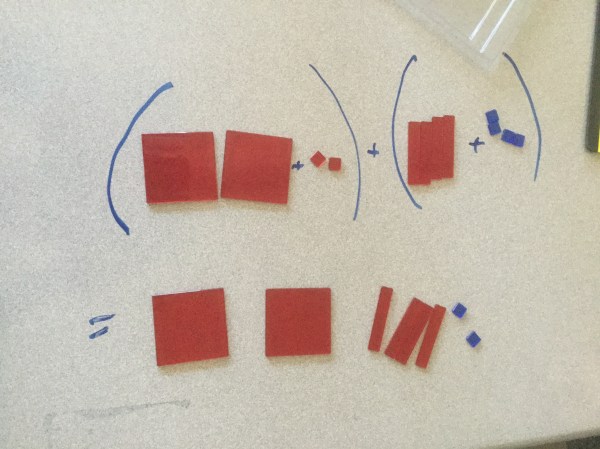 we also looked at how to add 2 binomials to get a trinomial as an answer.
