Speed is distance / time
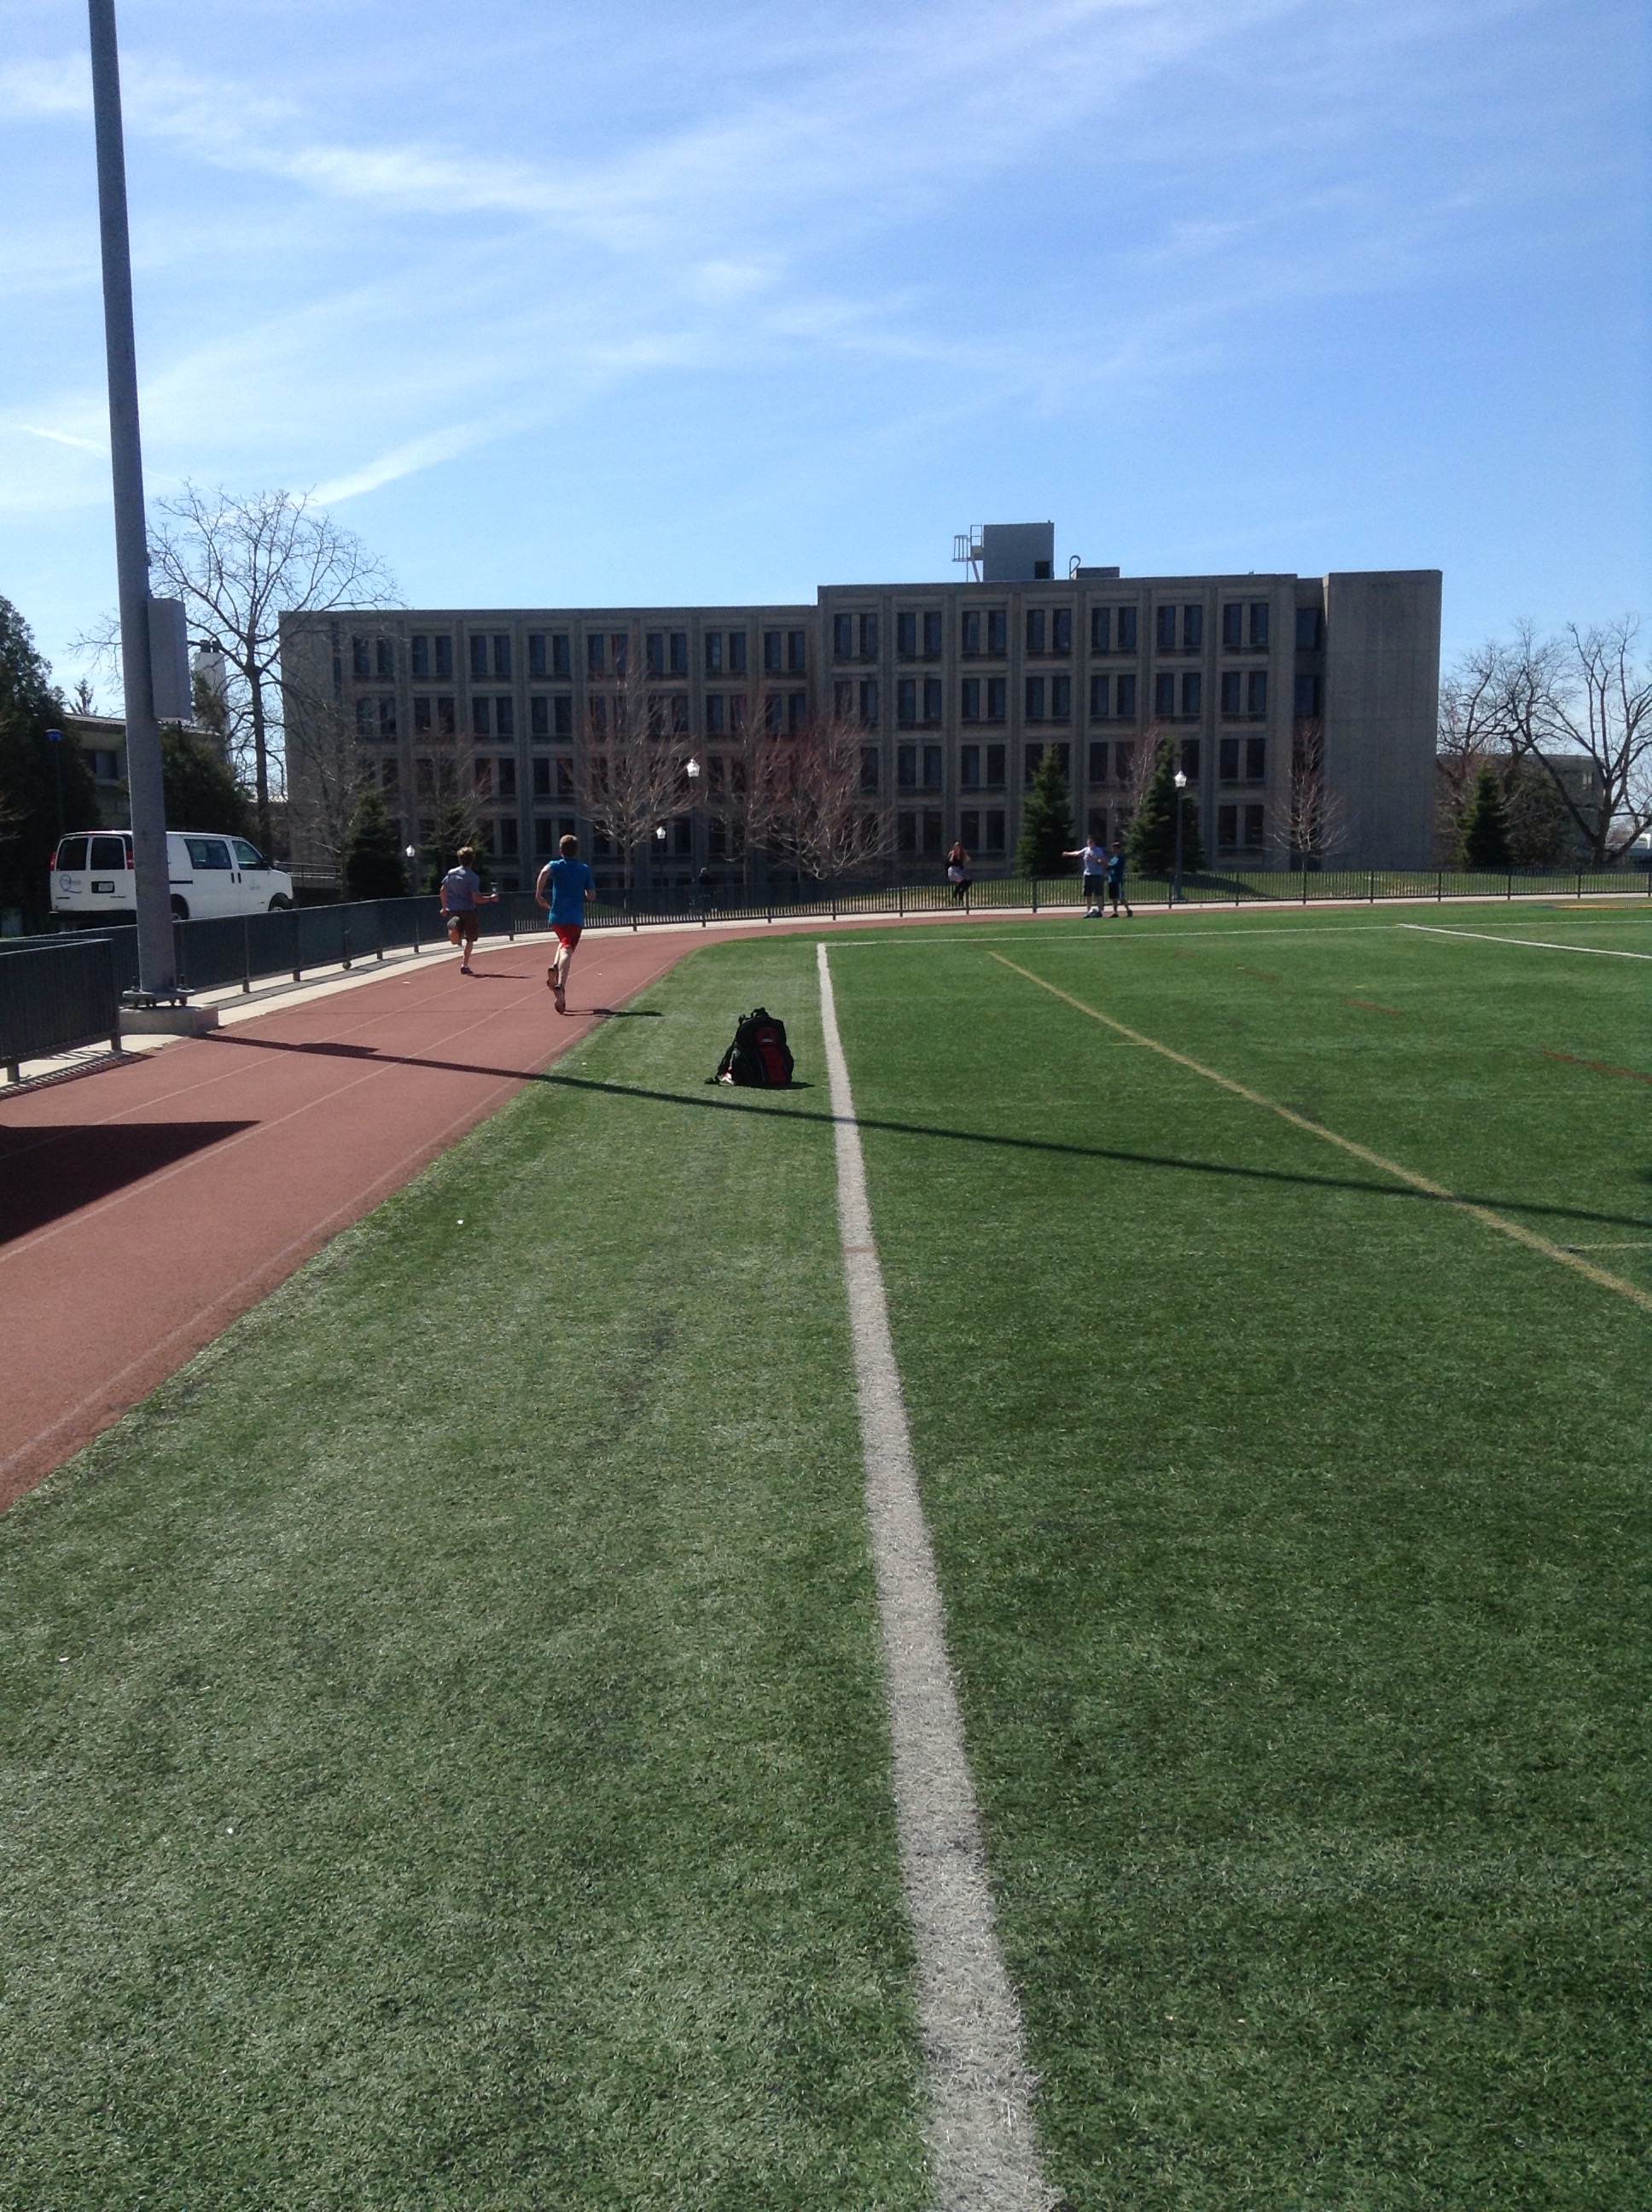
Today in grade 9 we looked at speed. We want to create a “photo finish” situation between a grade 9 runner and Usain Bolt. To do this we can give either a head start of time or distance. We need to use speed, distance and time to figure it out.
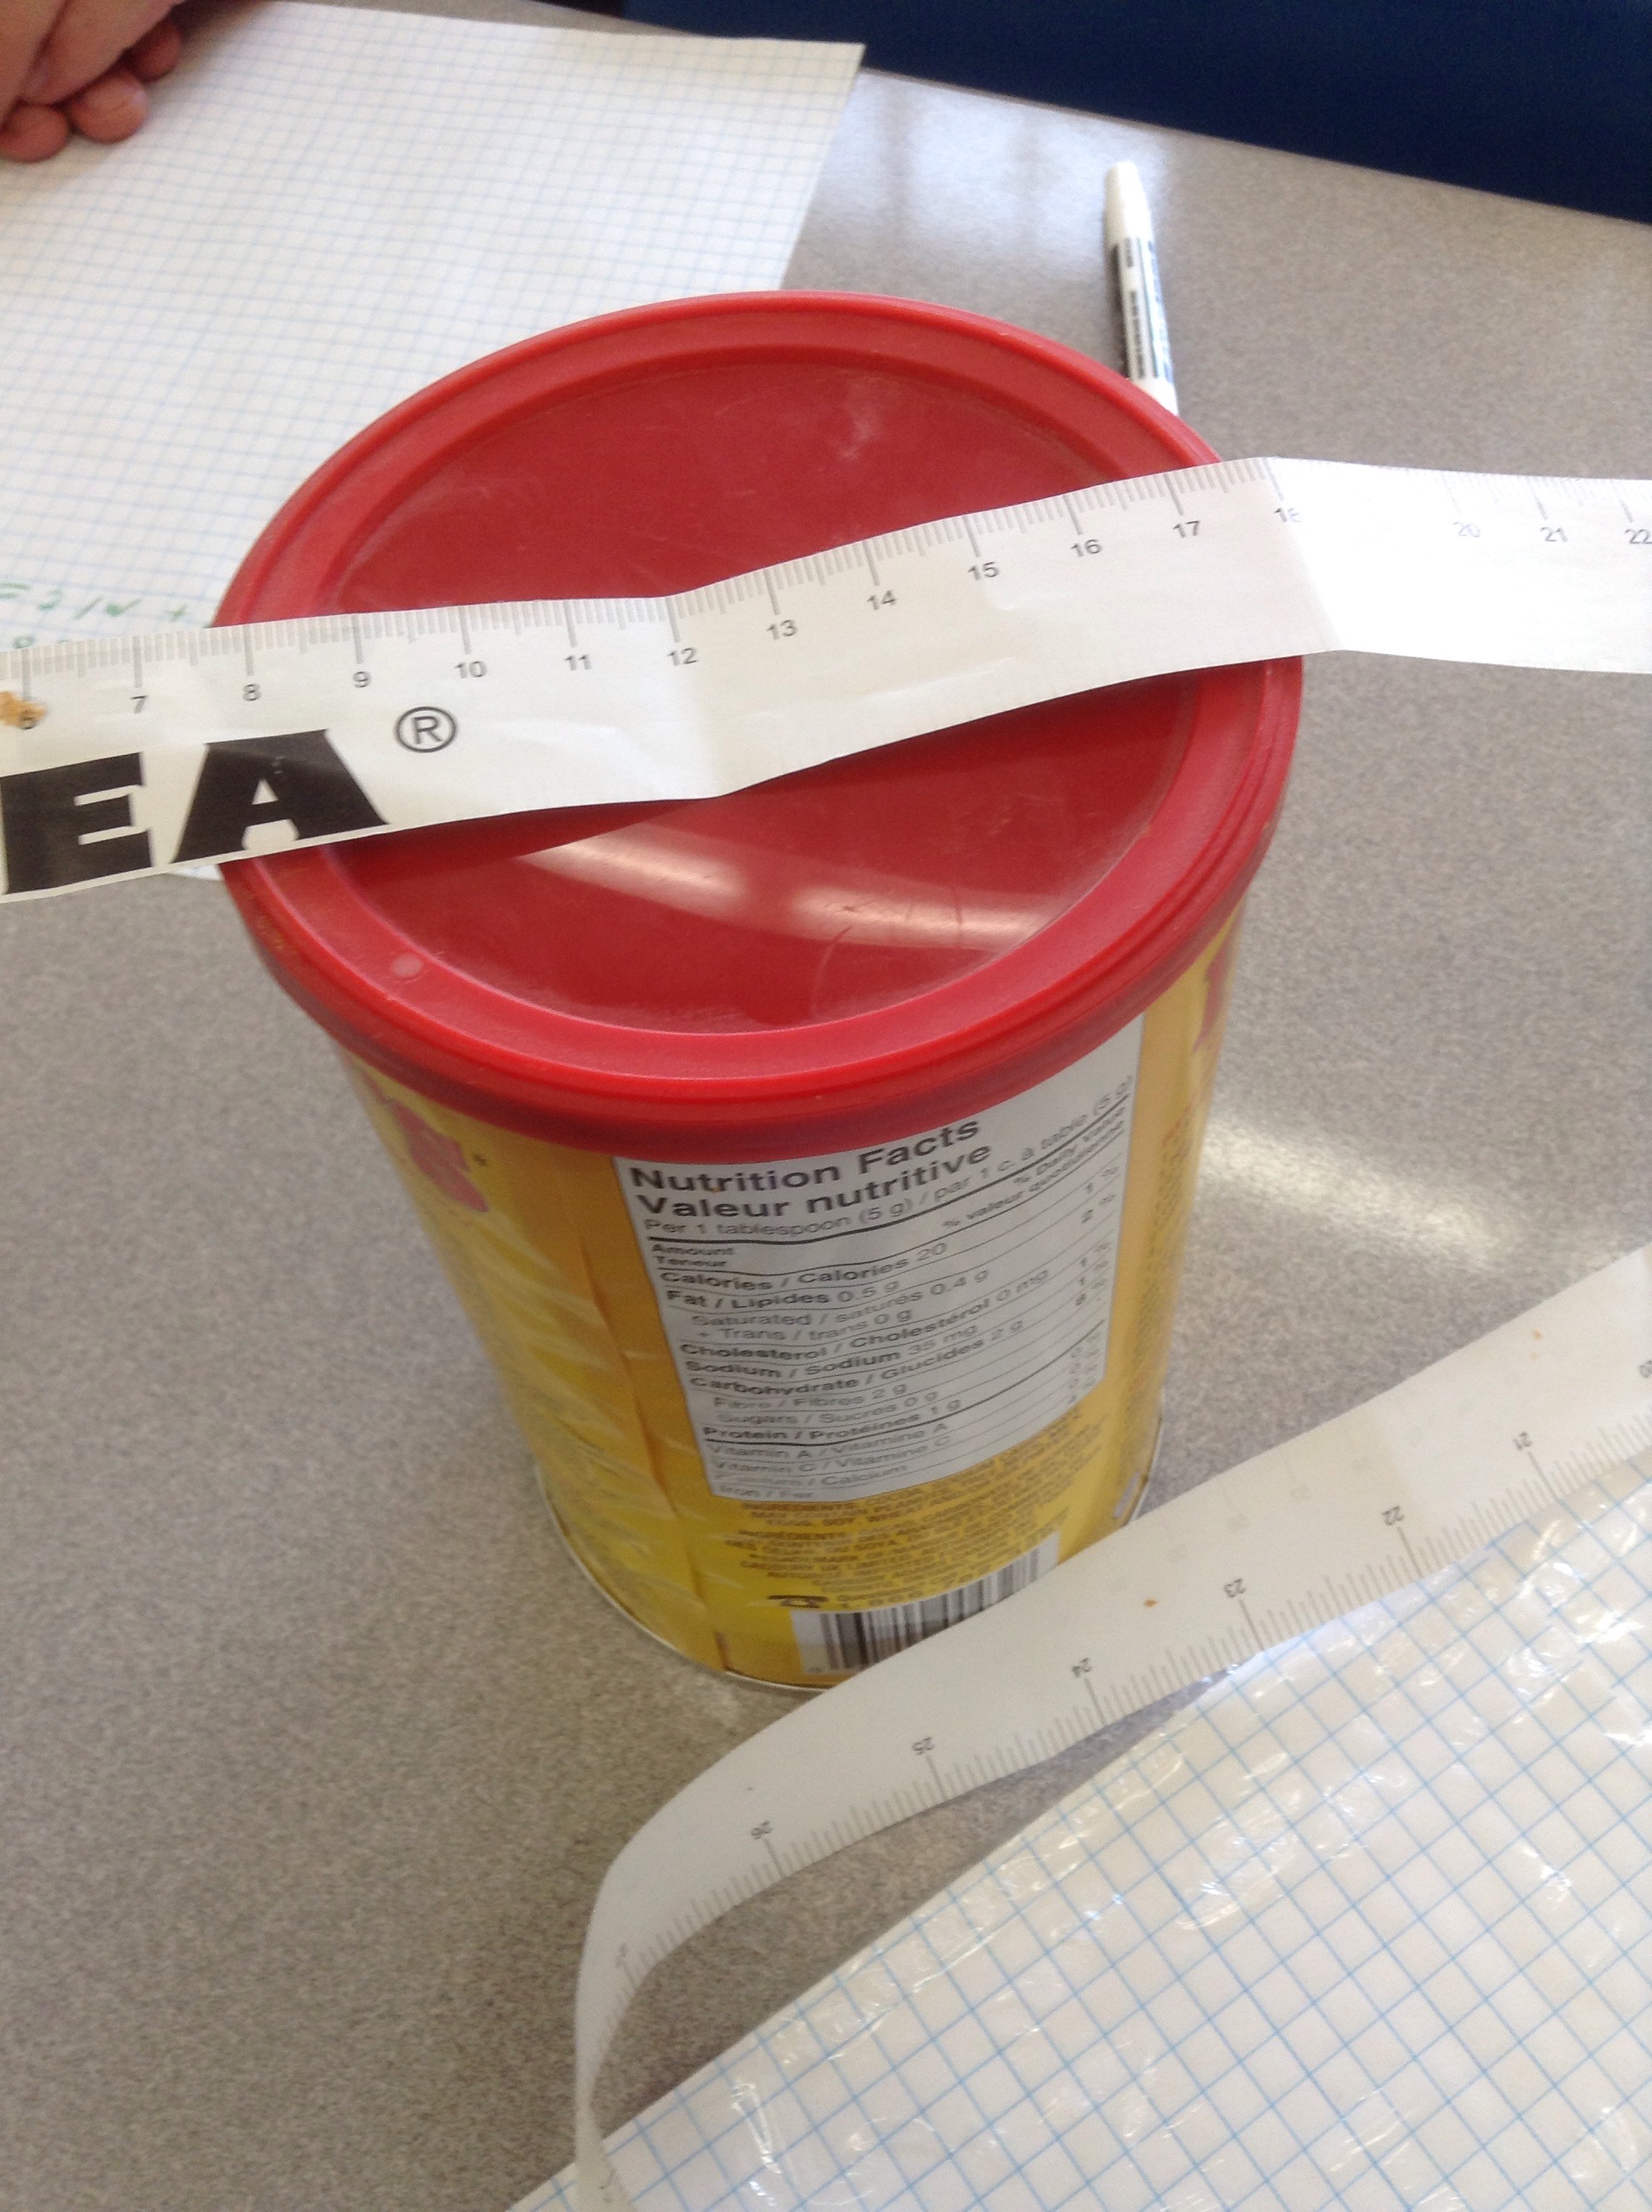
Packaging Problems
We are planning to pack up 8 tins of cocoa to mail in a big cardboard box. We measured the dimensions, and made a layout for the 8 tins. Next we determined the dimensions of the box. We used a price of 0.01$ for each square inch of cardboard, then compared boxes based on their price. Some arrangements are more pricey than others.
To help visualize the box dimensions, we used models, or drawings.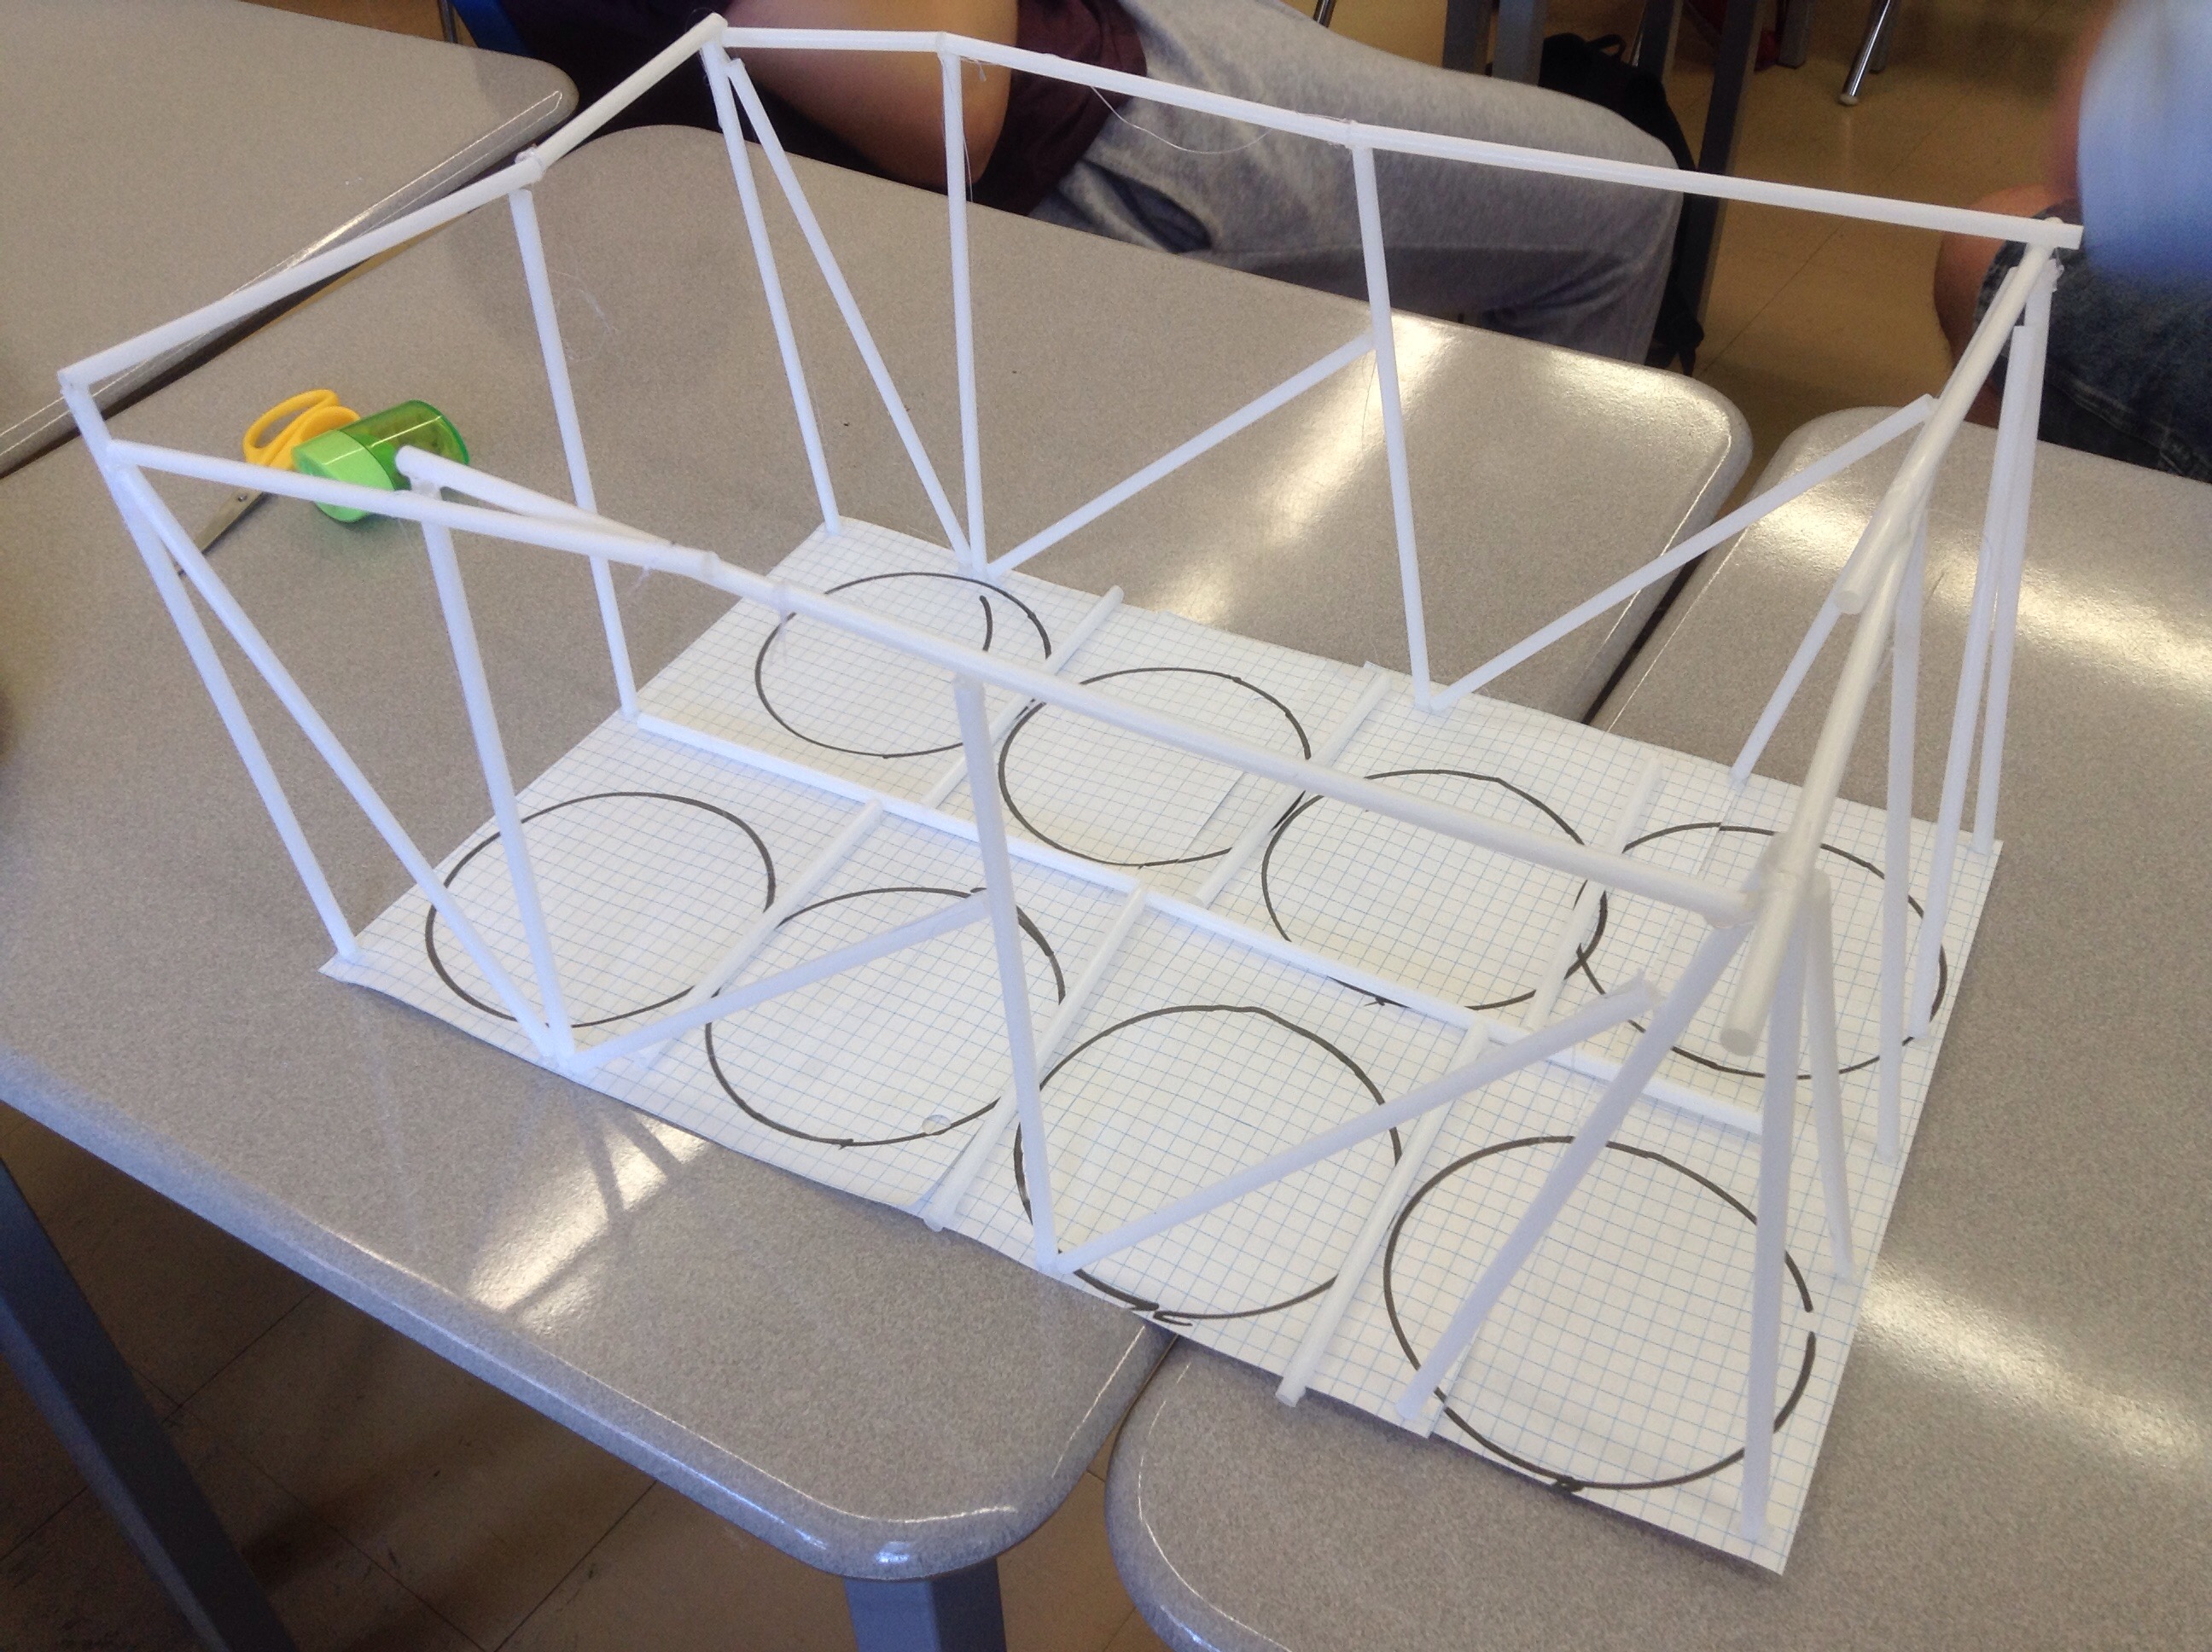
To help visualize the net of the box, we used linking shapes.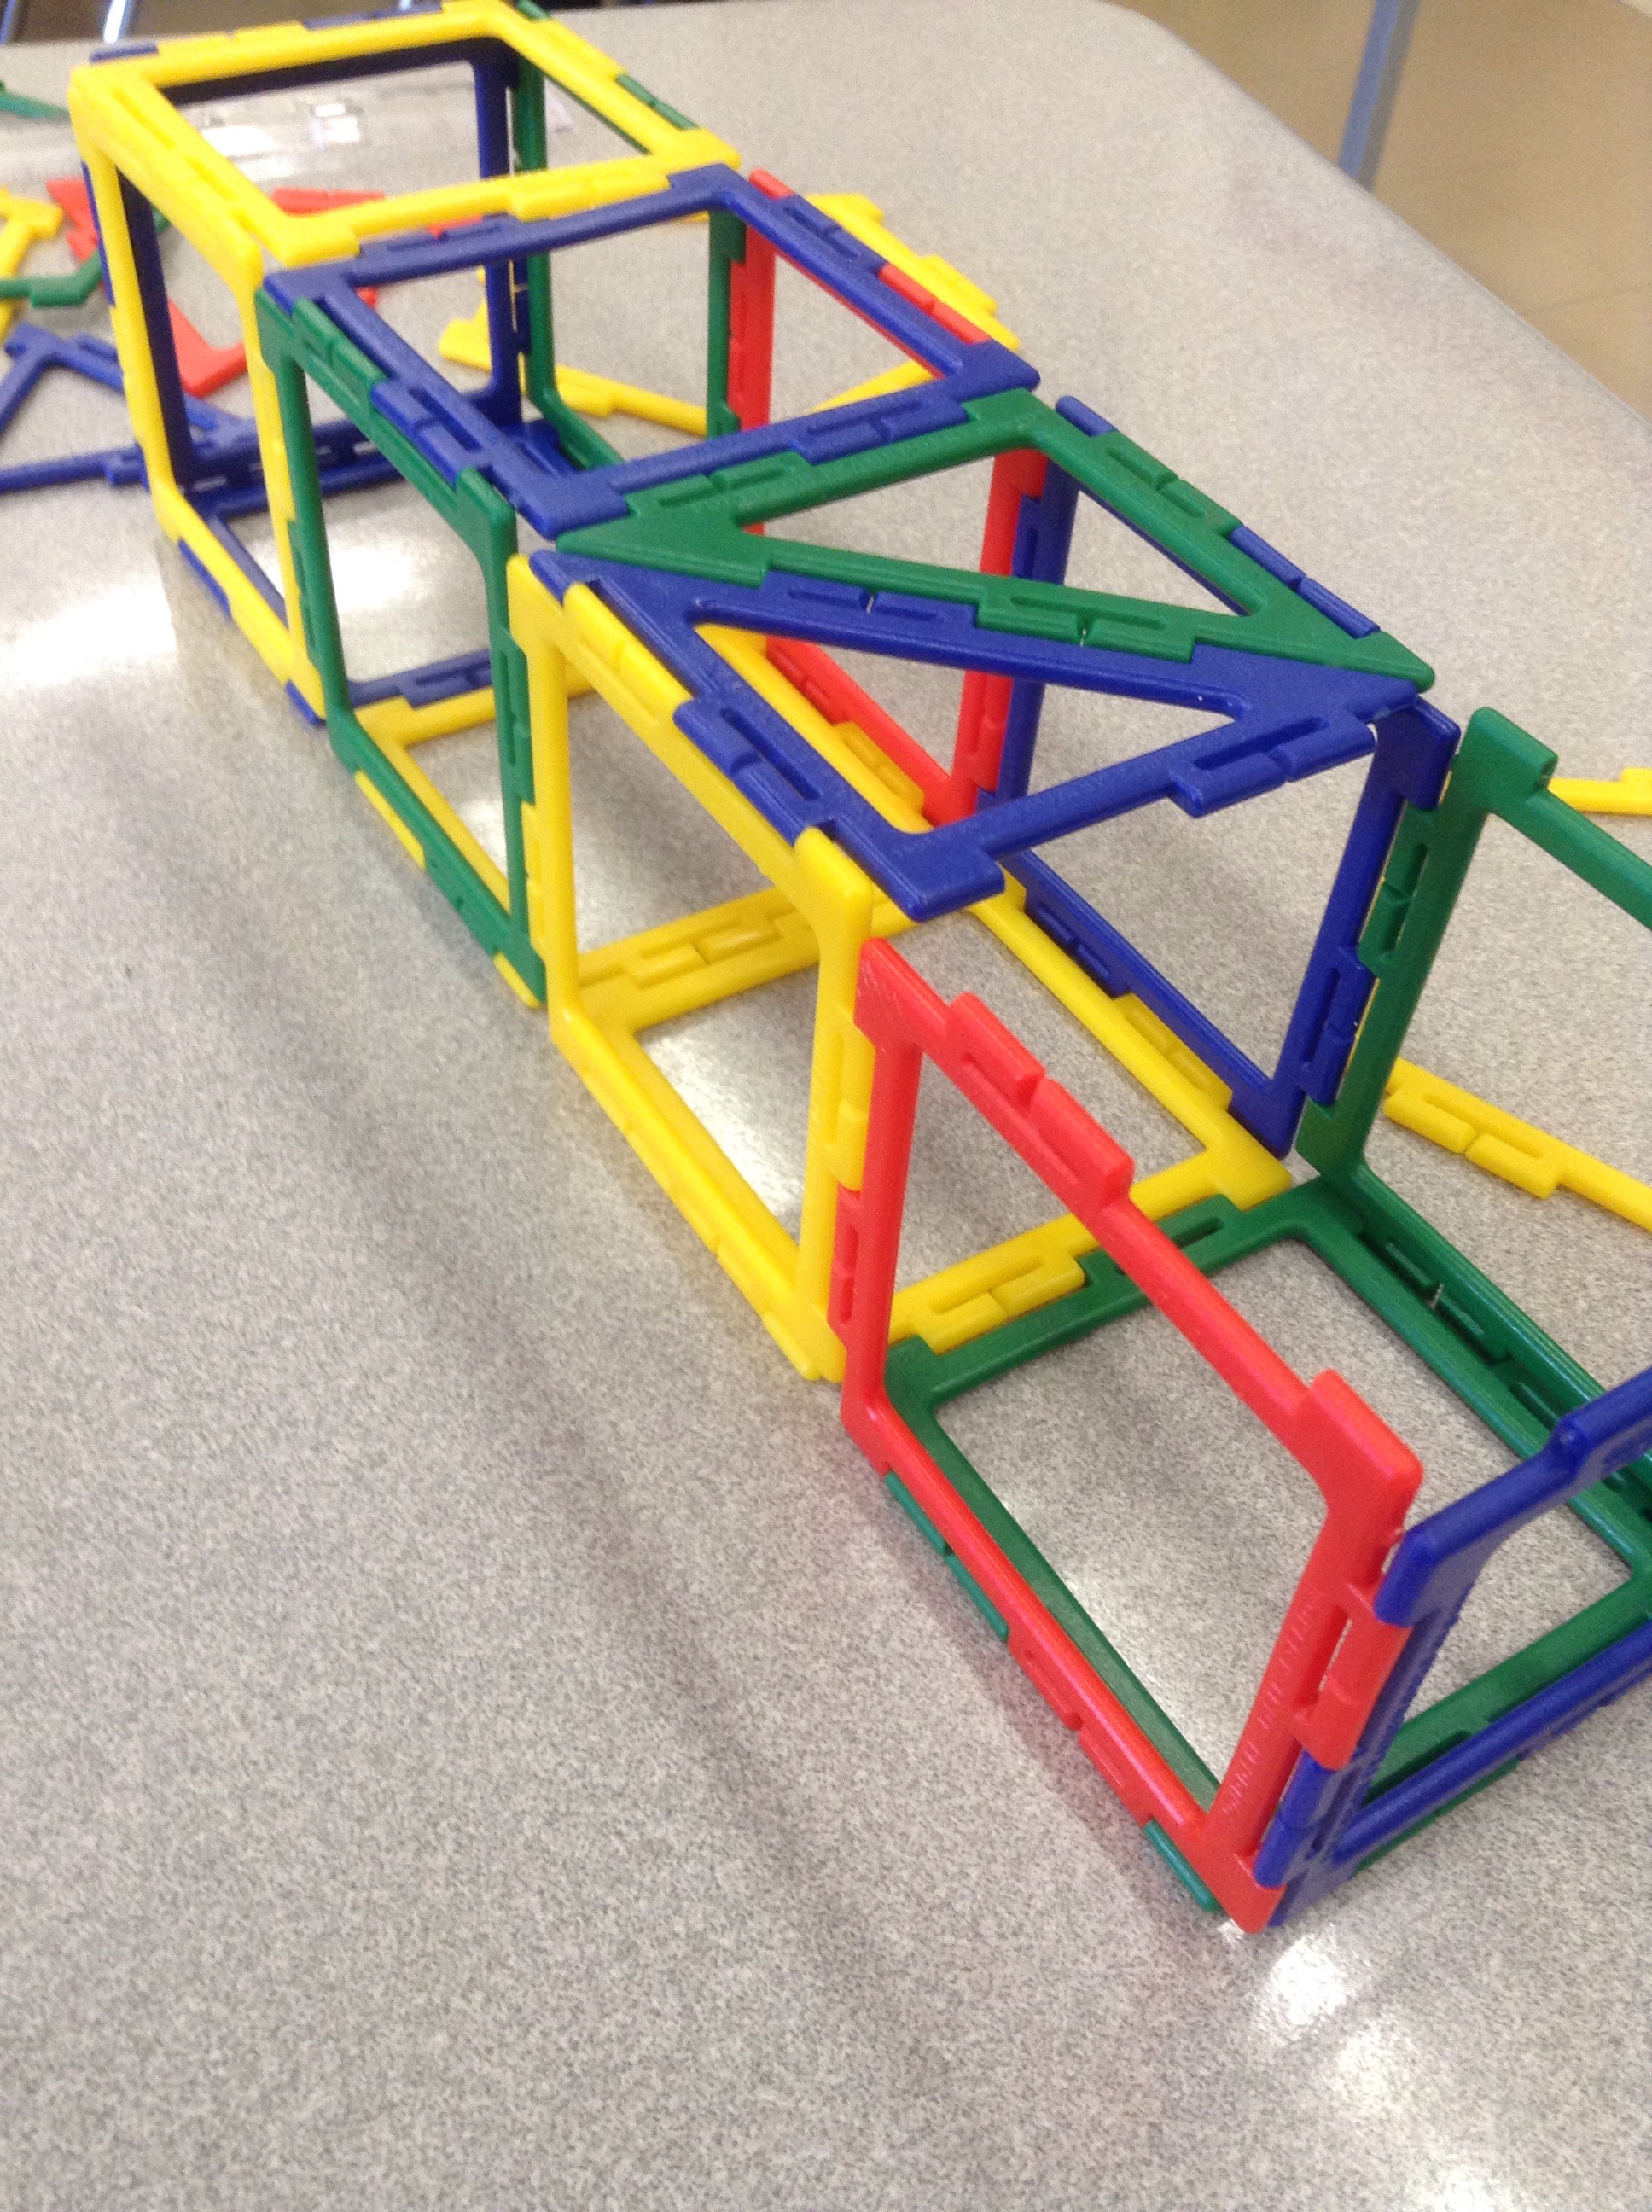
Running Like a Koala

We had a race on all fours to see if we could run as fast as Rocco and Biff, the koalas in our word problem. Some of us can in fact run that fast!
Bean Flowers

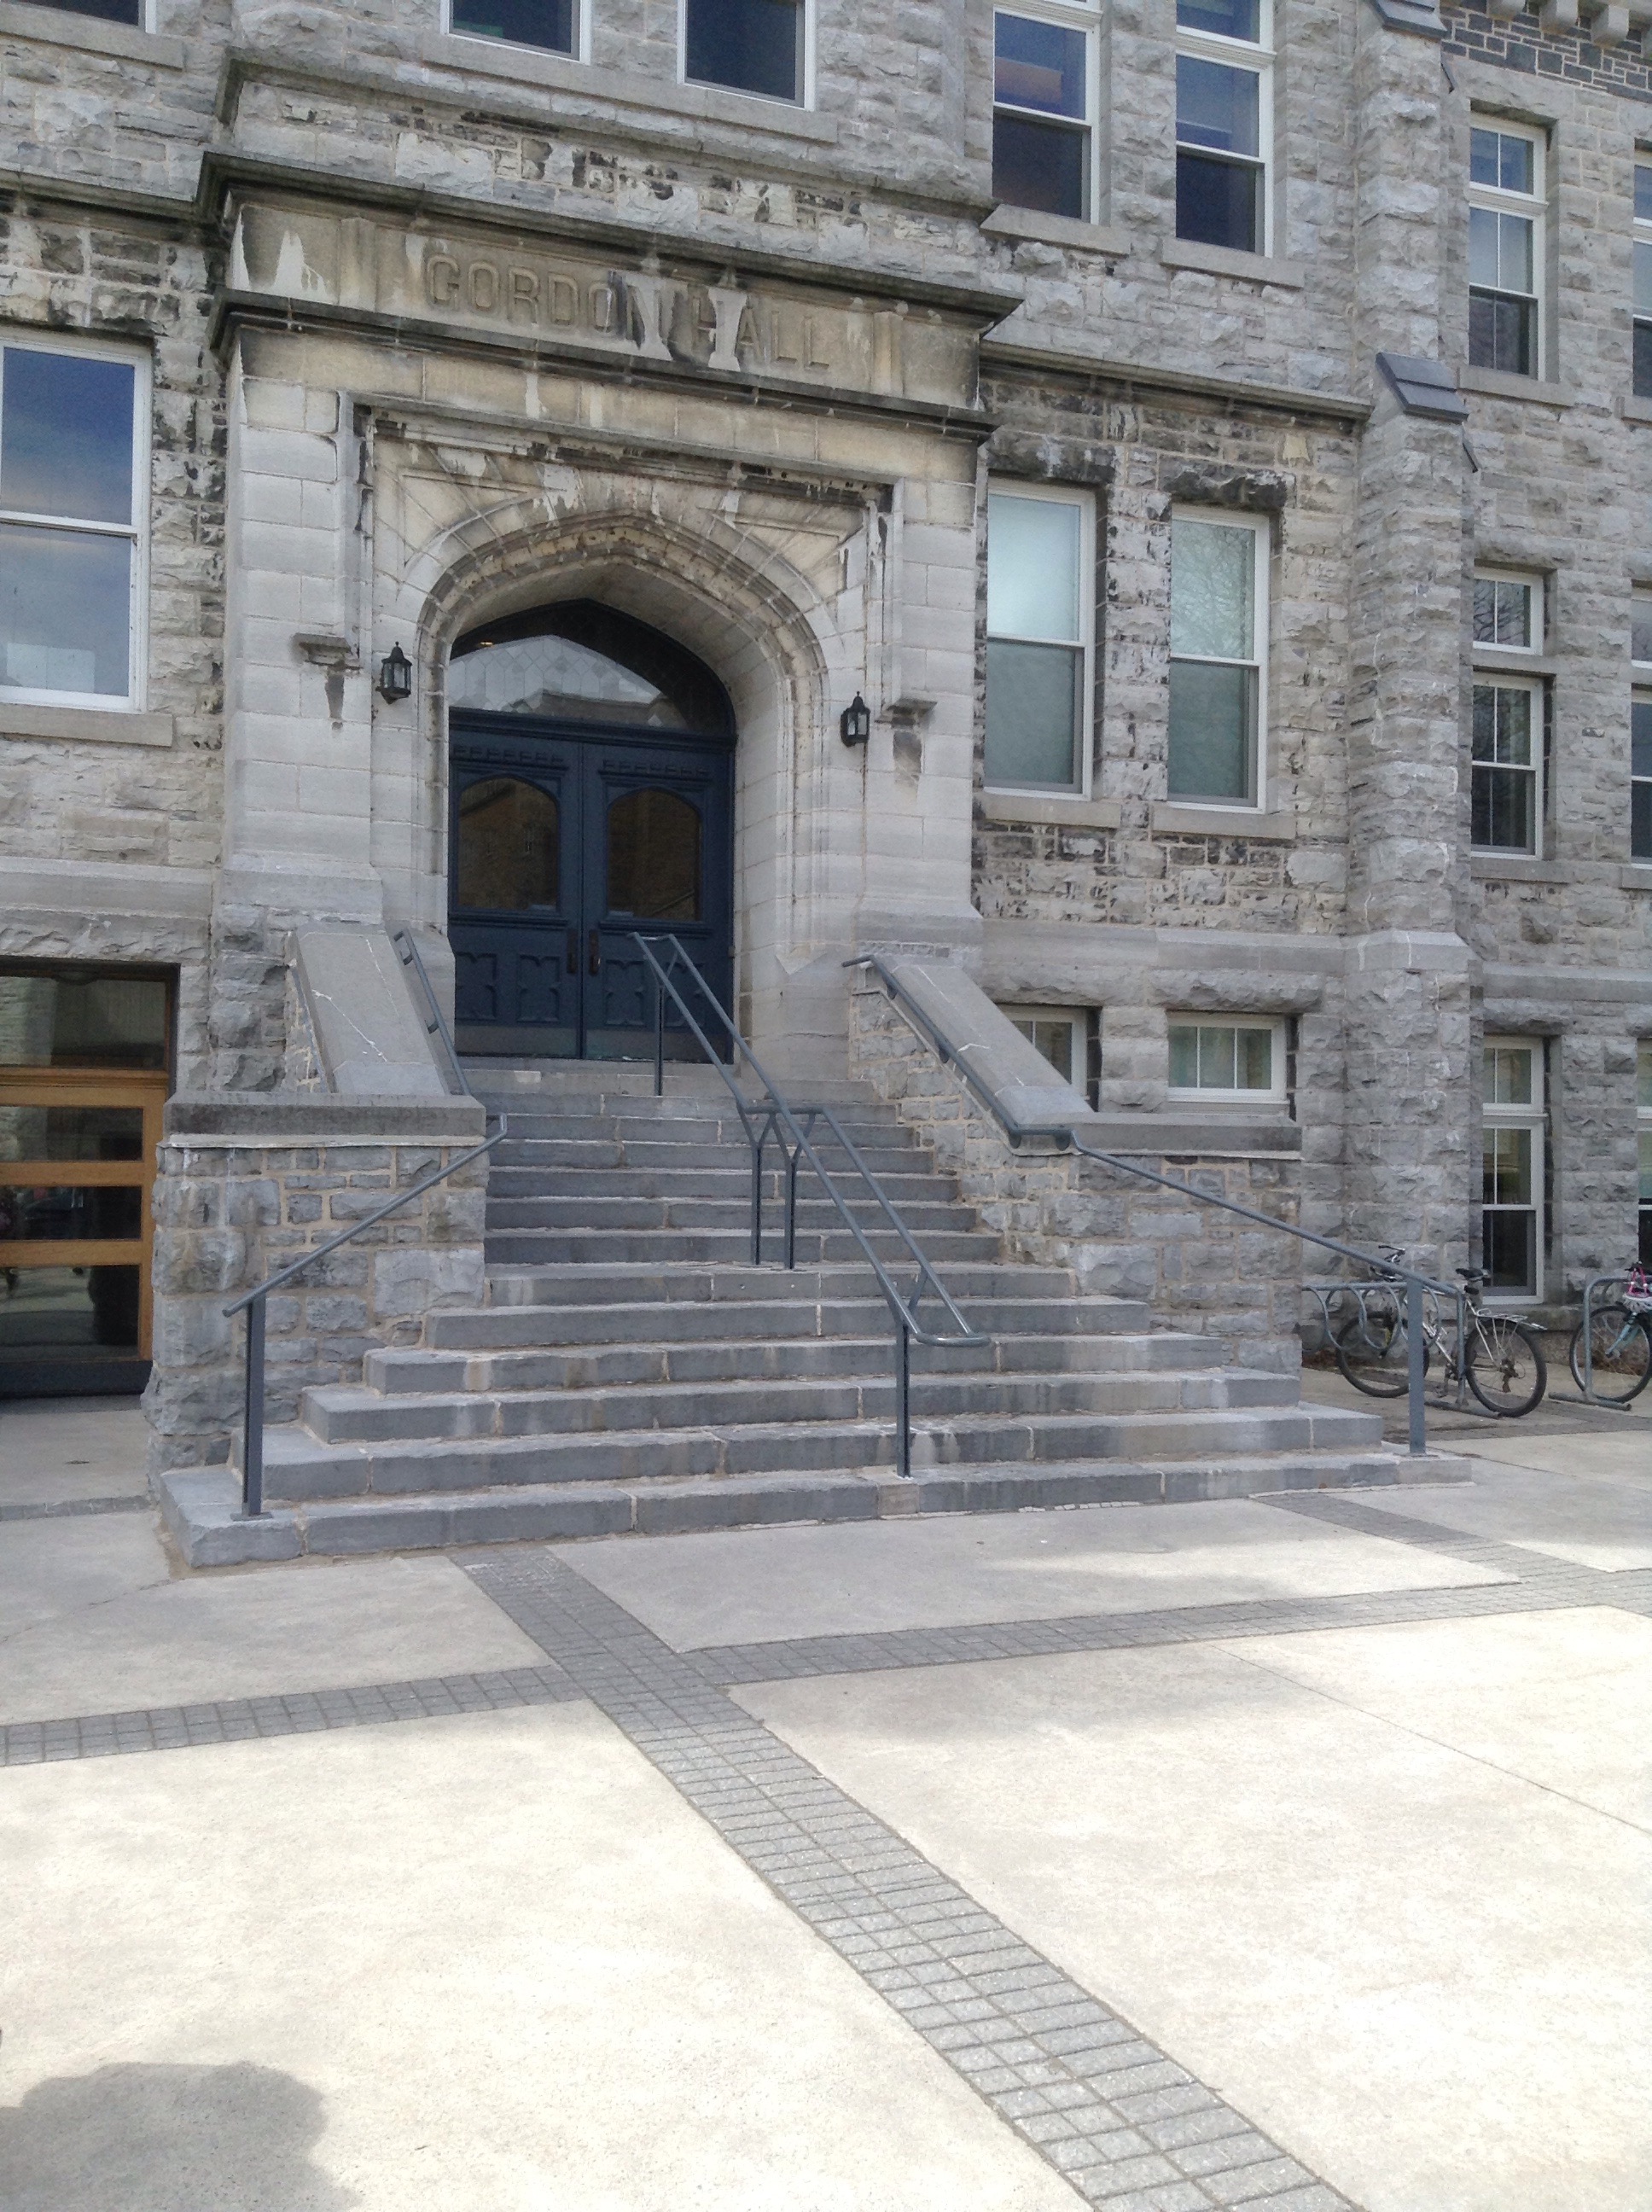
Stairs at Queen’s
We climbed lots of stairs around Queen’s to get a sense of slope. These were the steepest ones we found.
Measuring rise and run, and calculating slope got easier with all this practice.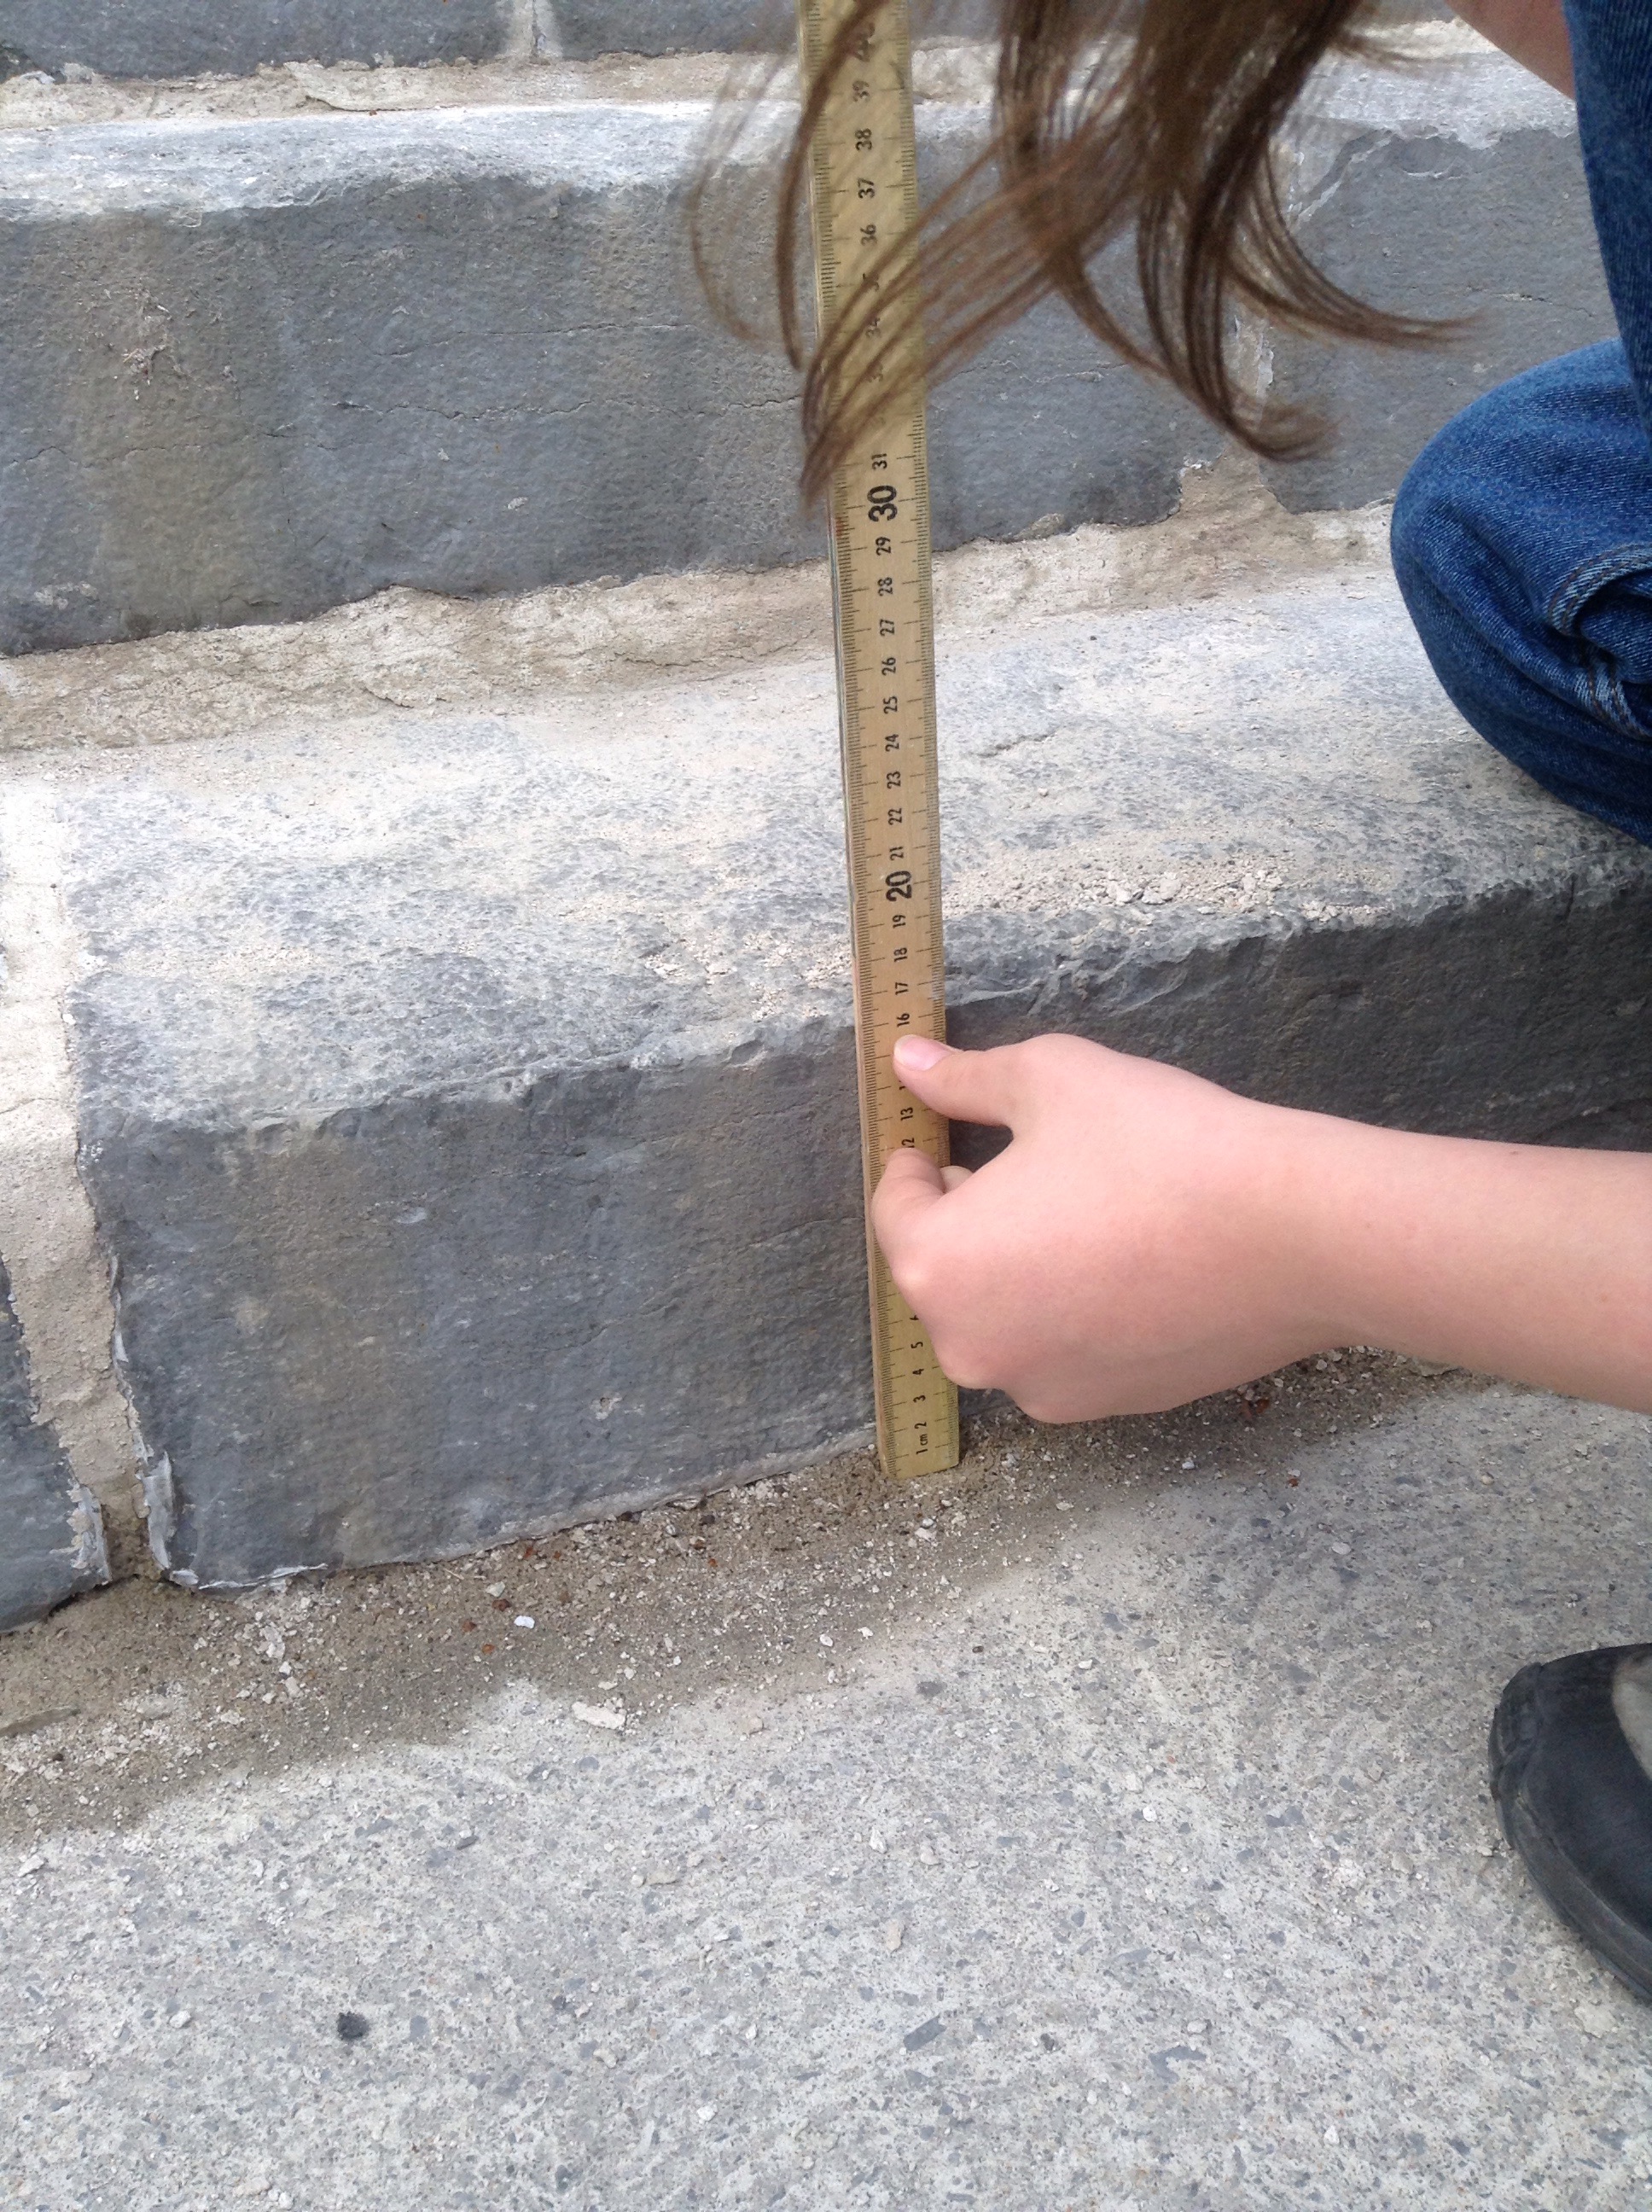

Beans and snow

It’s way too late in the year for snow!
Volume Calculations
We used the green cubes as a scoop to fill the cookie tins (cylinders and rectangular prisms). We calculated and then tested. It was amazing how accurate we were!
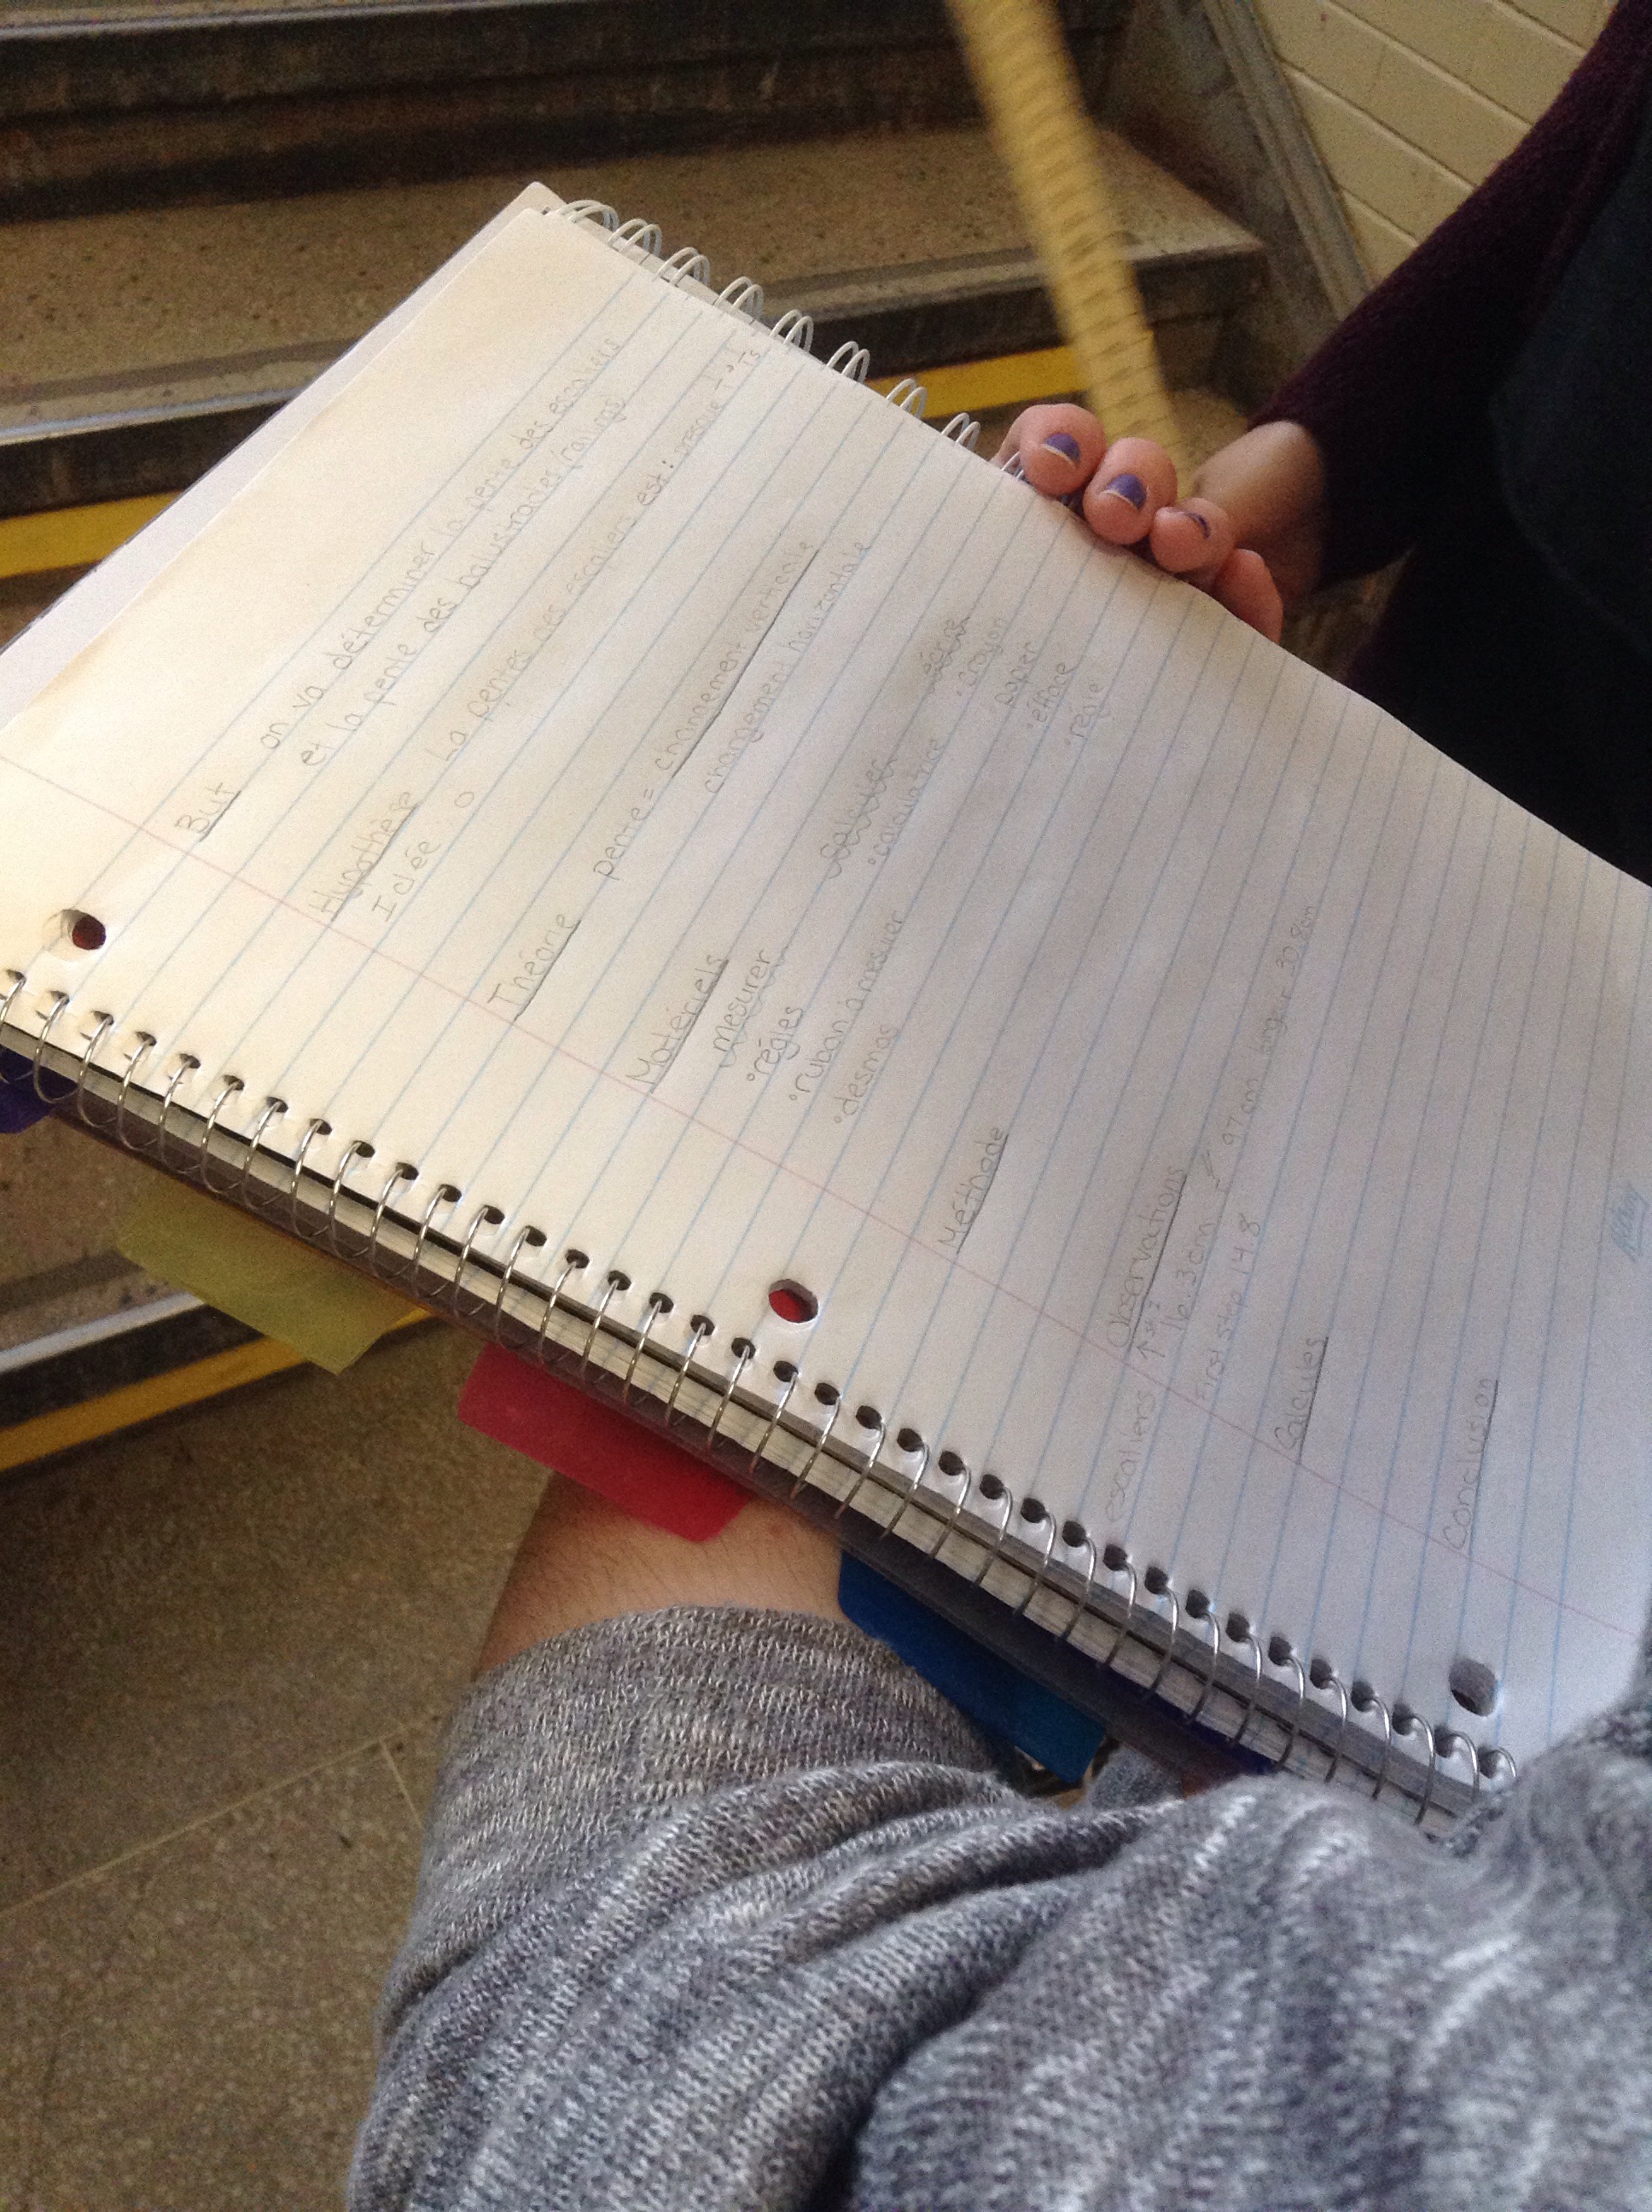
Stairs
We’re figuring out the slope of the stairs and the railing in the main foyer. 

And we’re comparing the slope to that of the Earl Street stairs.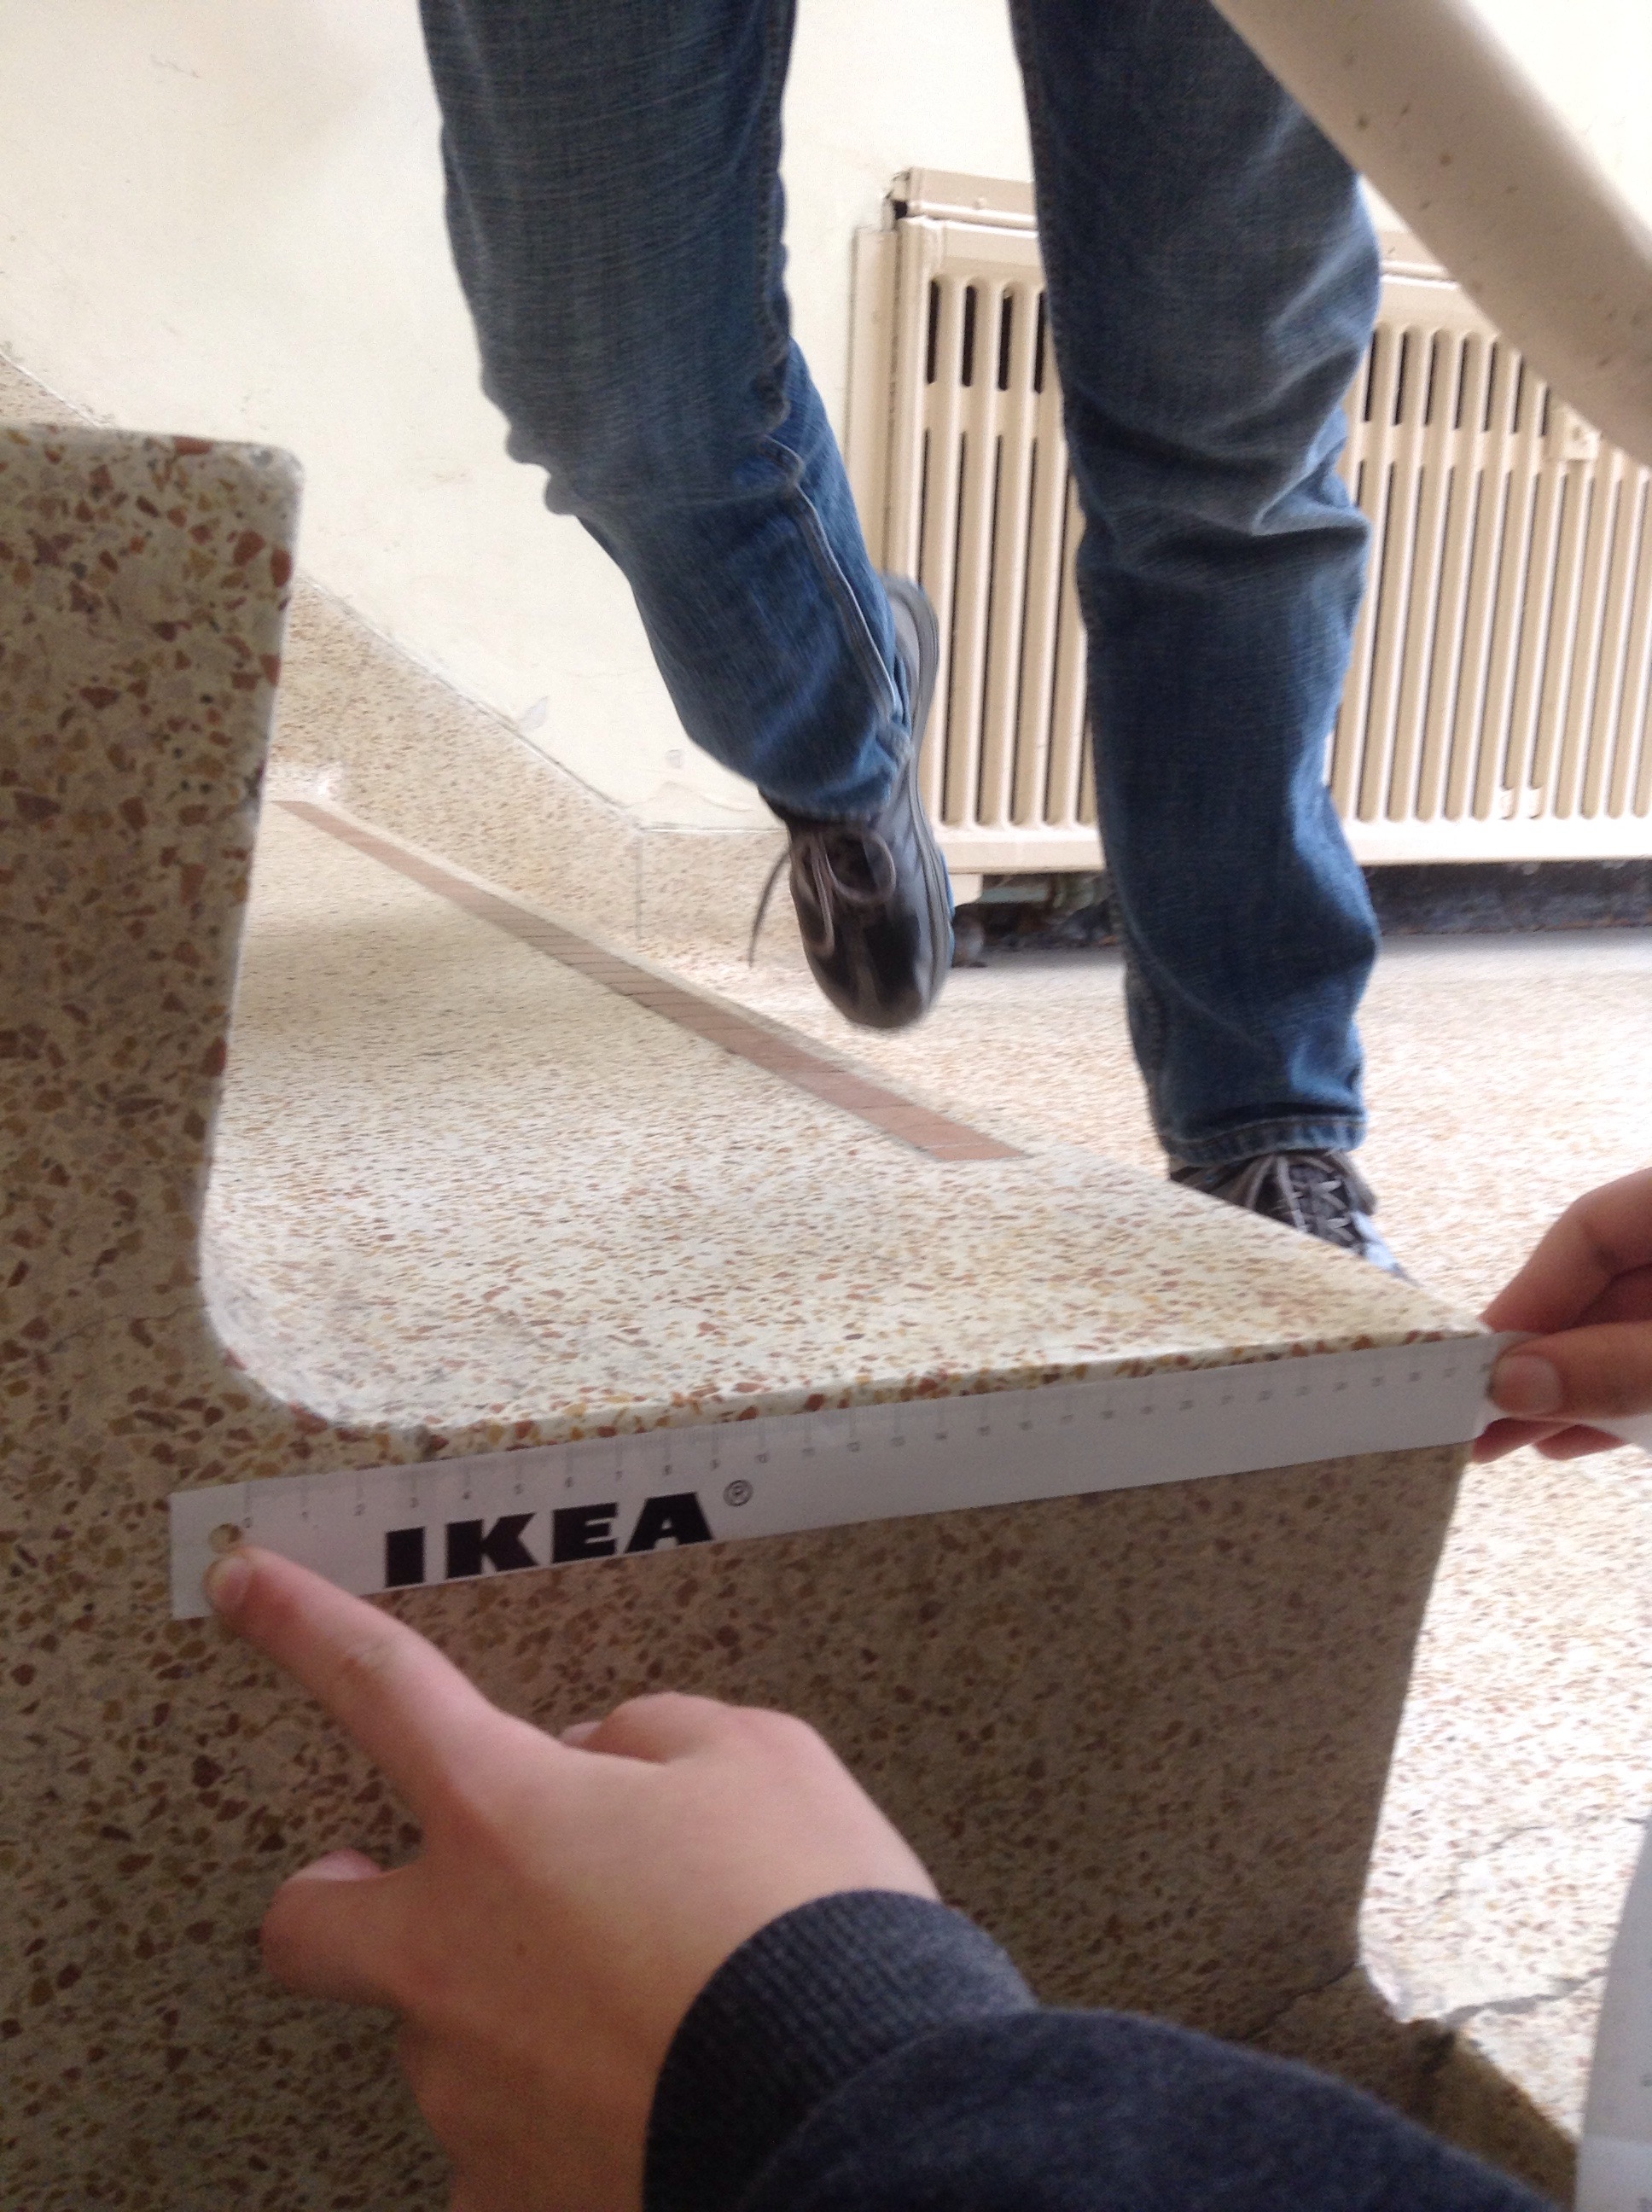
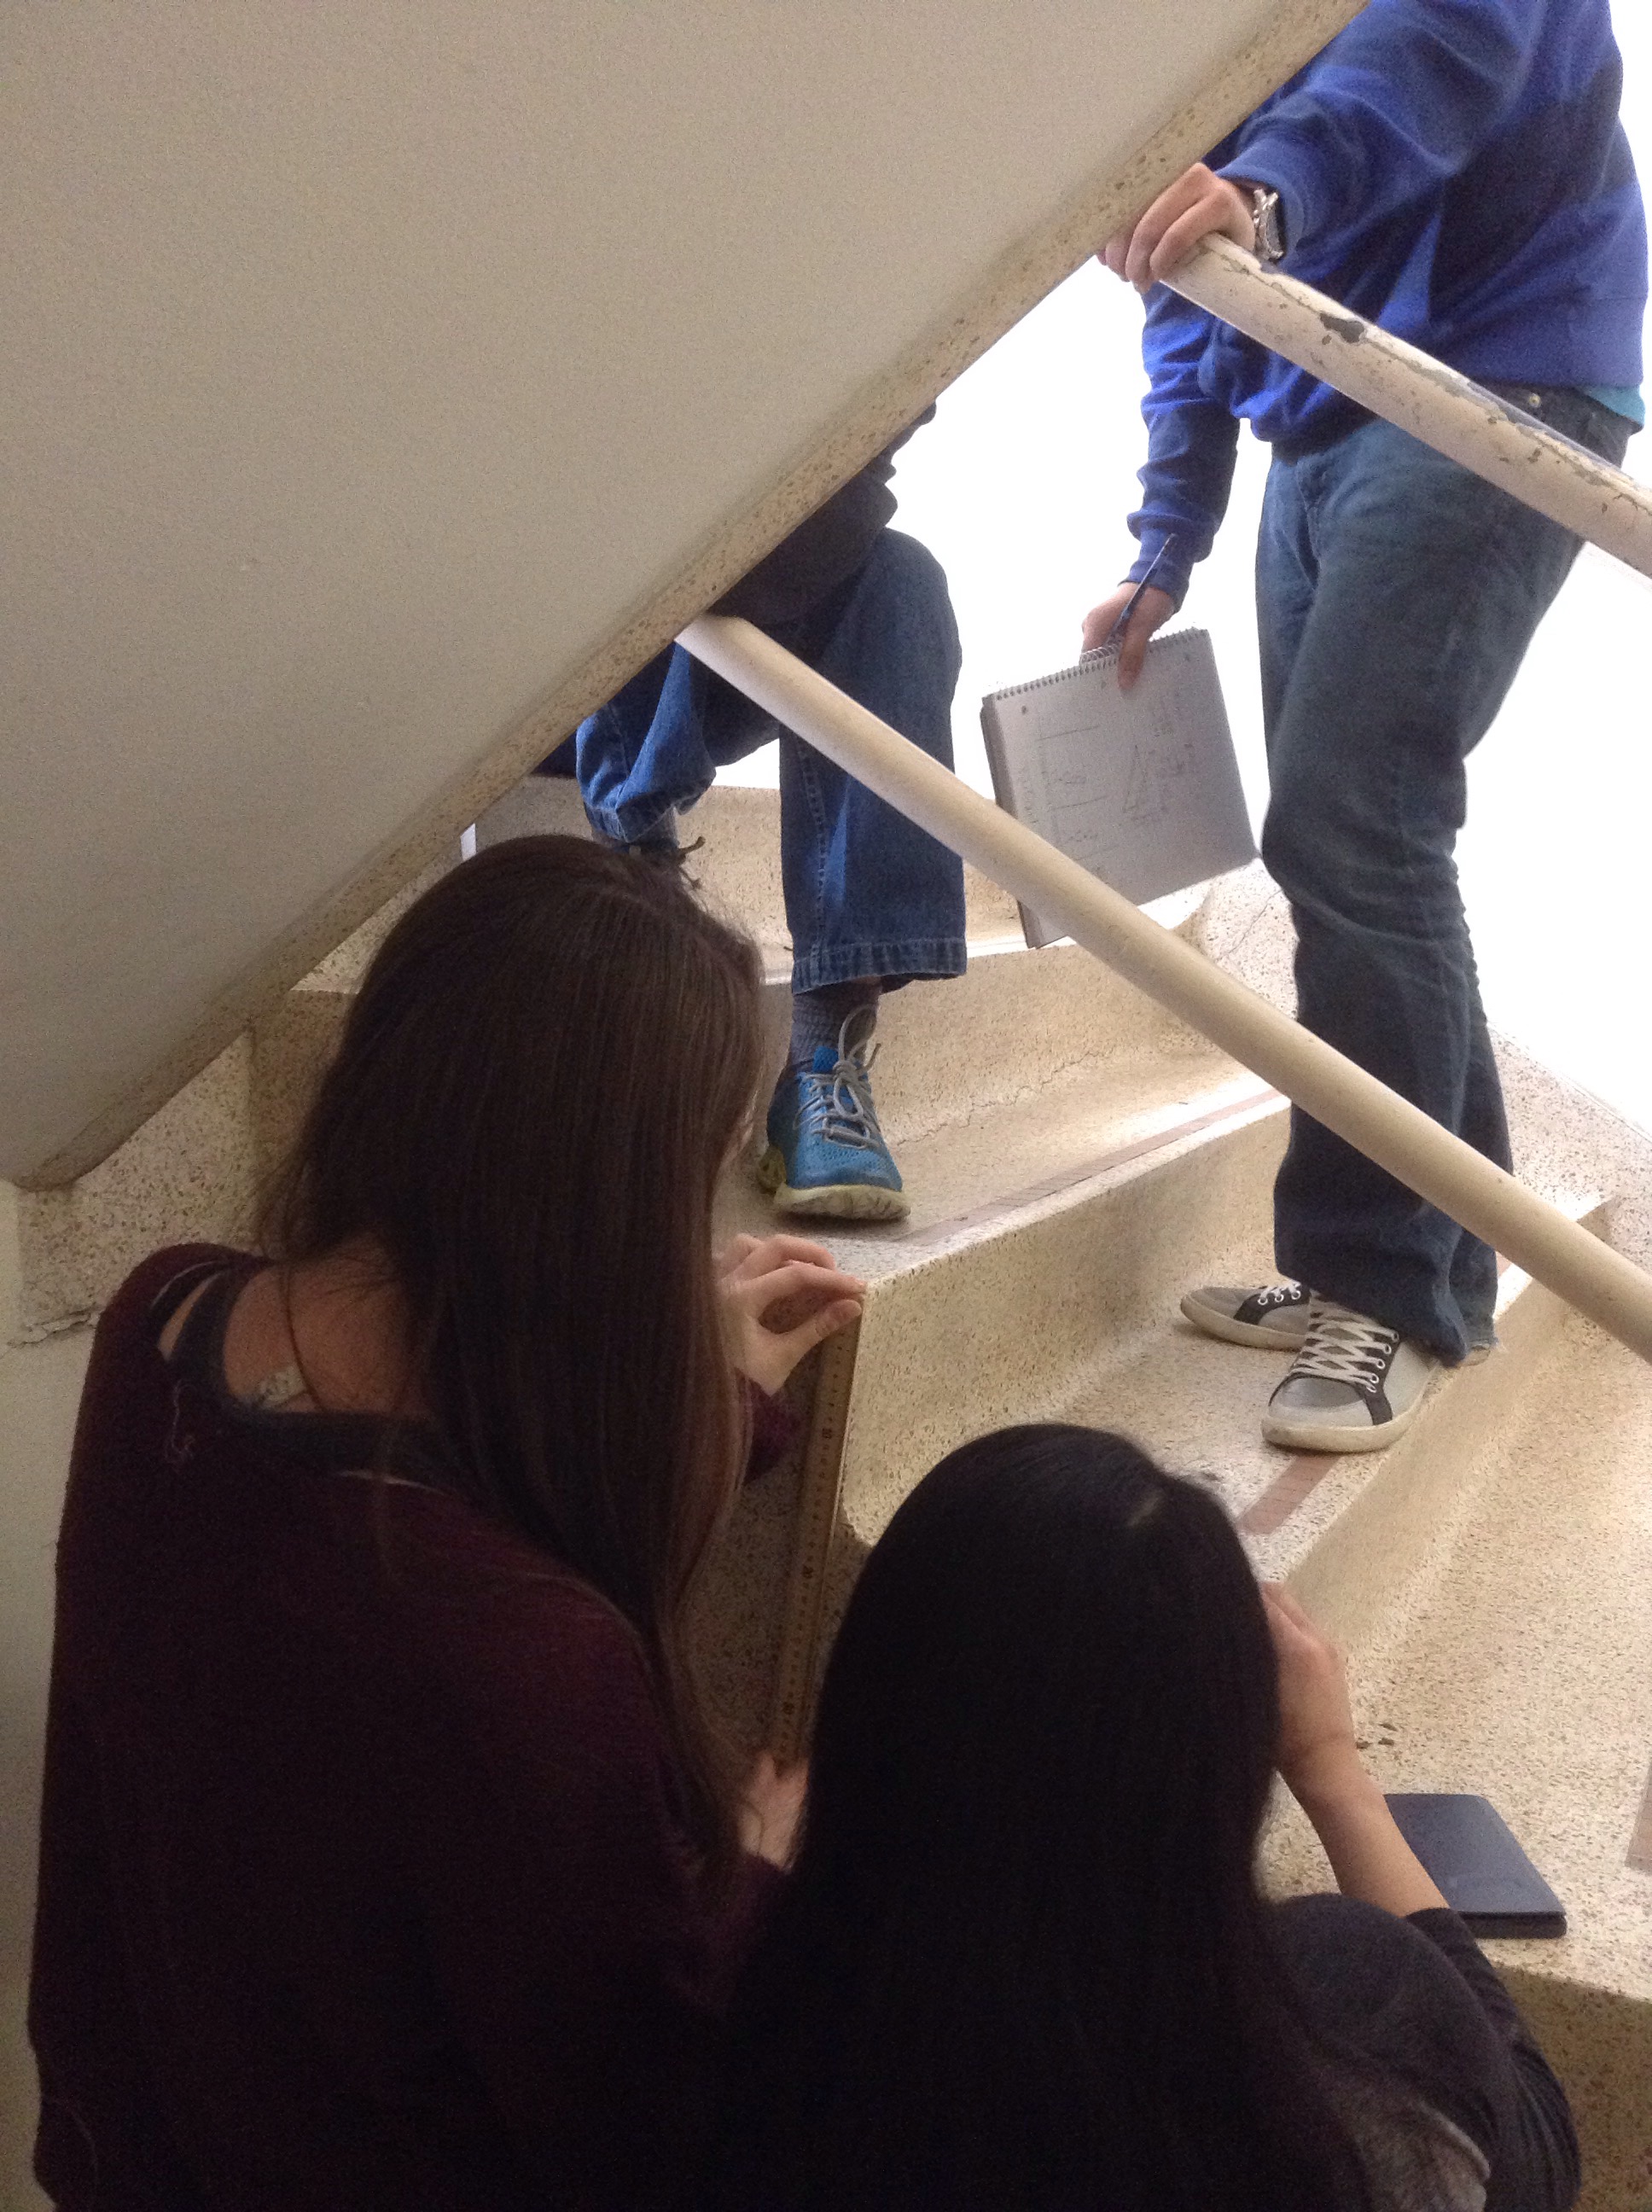
We used rise over run, and also the desmos app to calculate.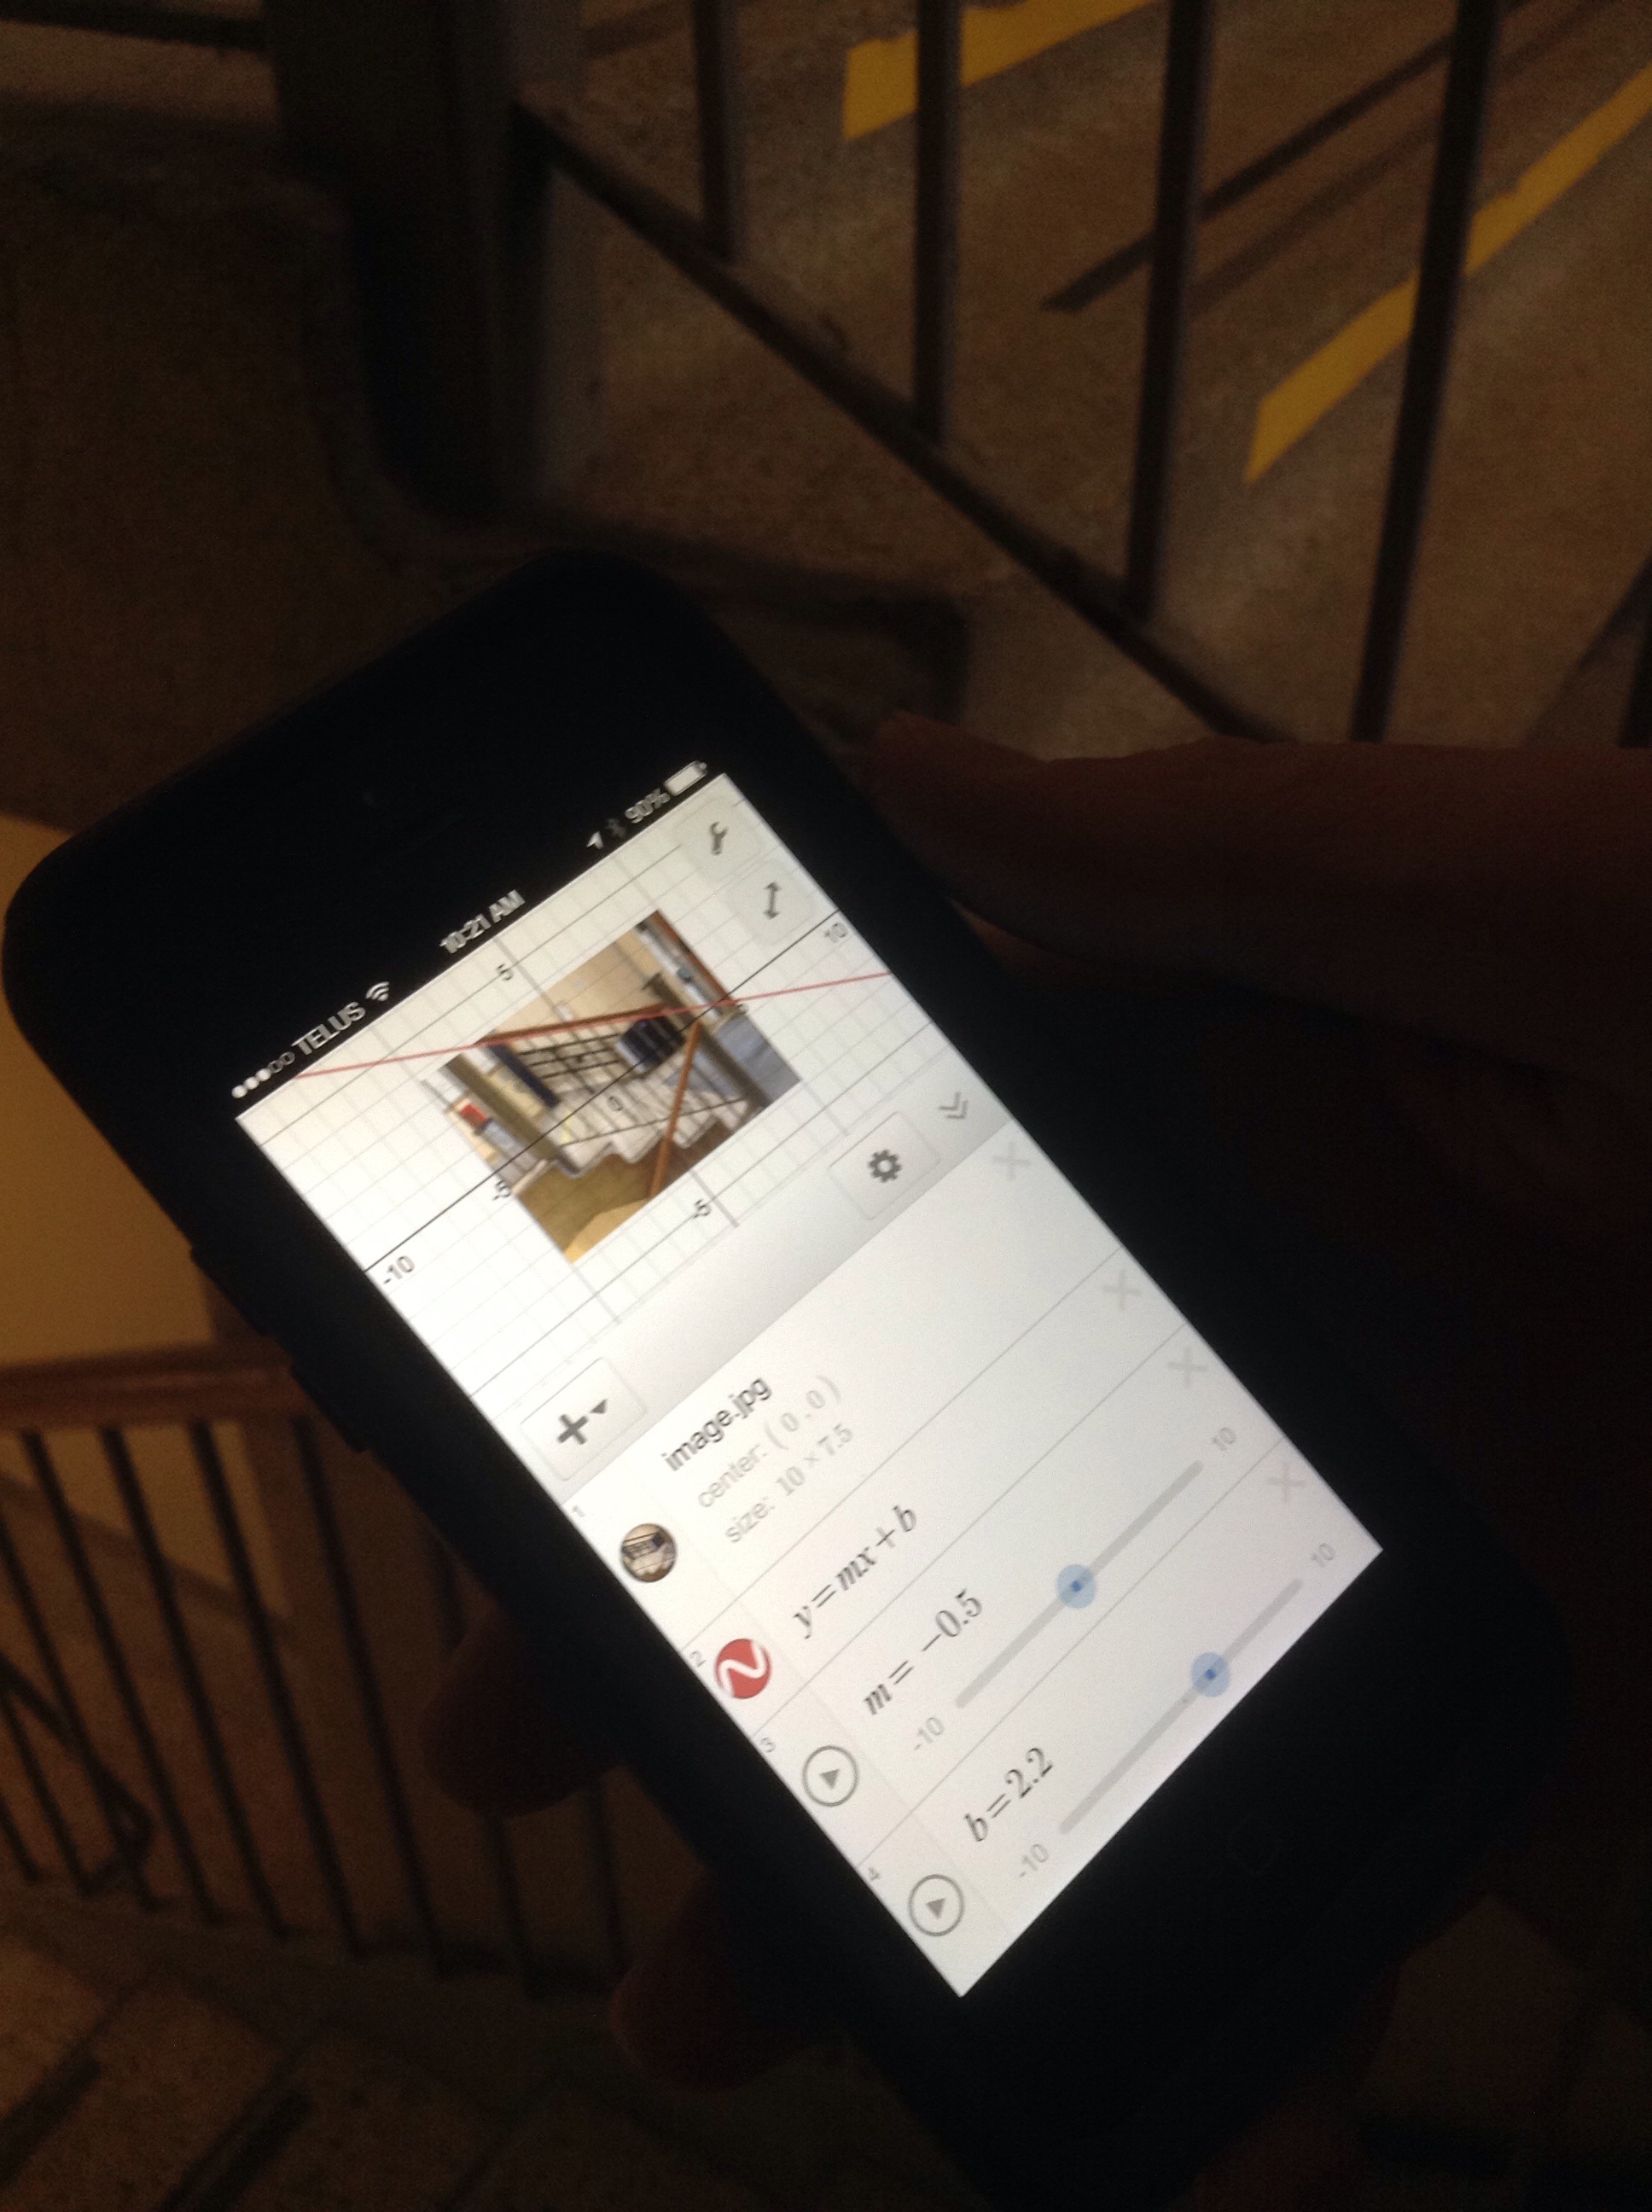
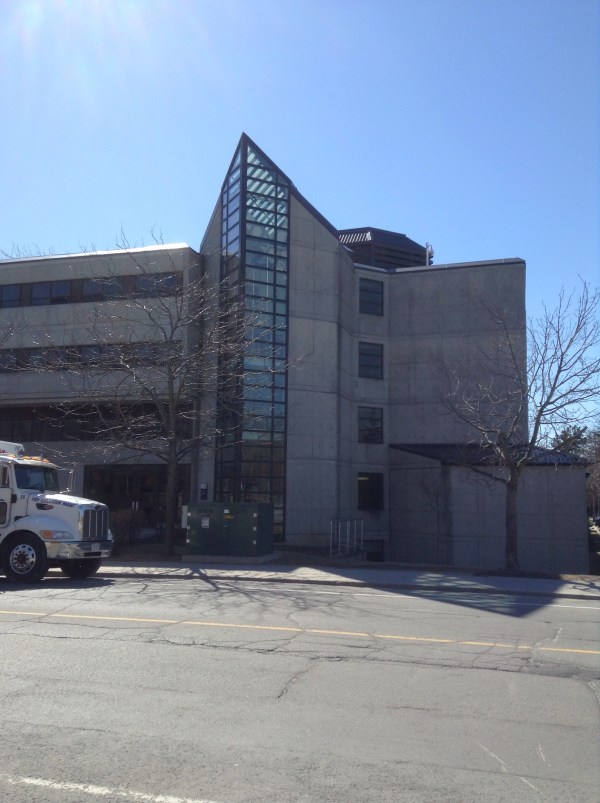
Which roof is steepest
we went for a walk and saw some steep rooves. Some are steeper than others. Import the photos into desmos and match a line to the roof you’re checking. We used y=mx+b then used sliders to adjust the m and the b. The greater the m value, the steeper the slope. 

Using Desmos.com
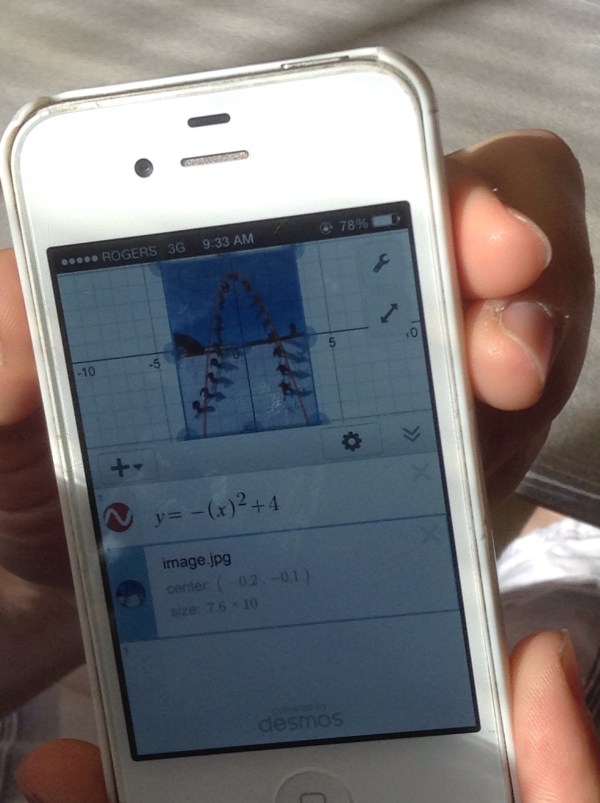
grade 10s looked at desmos.com today to investigate parabolas in the form y=a(x-h)^2+k (note, the little ^2 is the oldschool way to show someing as squared)
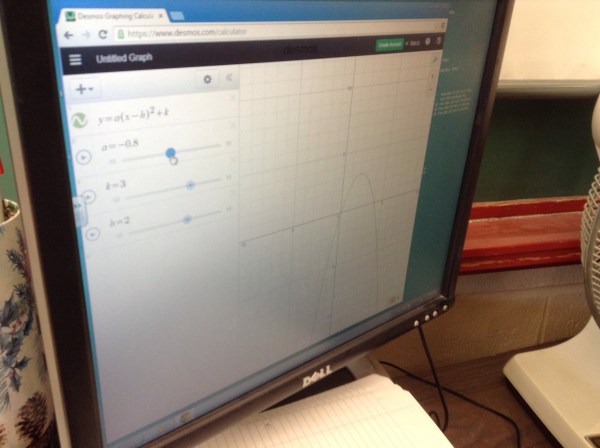
We changed values of h and k to move the graph around, and we changed the a value to change the shape of the graph.
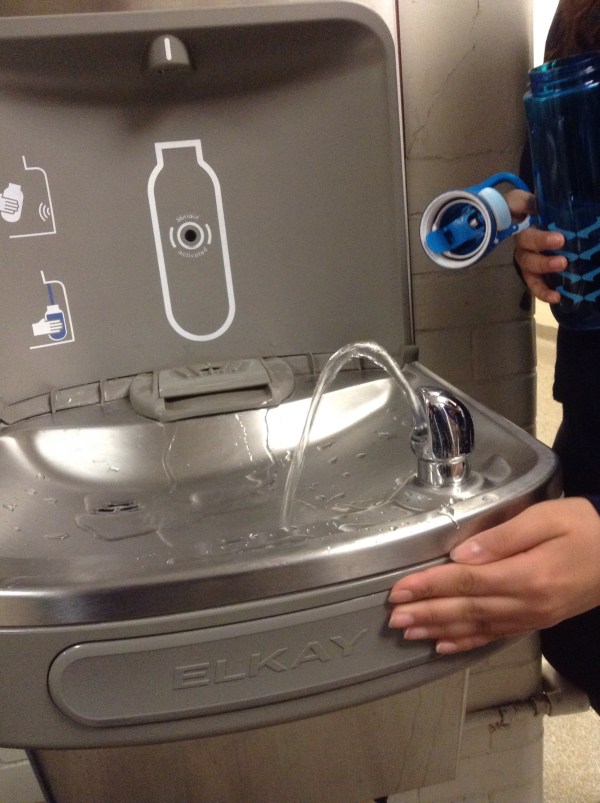
We took images of the water fountain and matched the water’s arch with a parabola.
We looked for neat real world parabola pictures online and matched the images with parabolas.

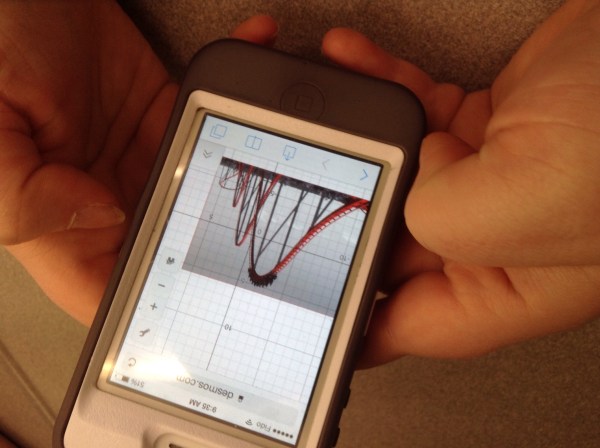
We cant stop seeing parabolas!
